Study of the Energy Conversion Process in the Electro-Hydrostatic Drive of a Vehicle

Faculty of Automotive and Construction Machinery Engineering, Warsaw University of Technology, Narbutta 84, 02-524 Warsaw, Poland
*
Author to whom correspondence should be addressed.
Energies 2018, 11(2), 348; https://doi.org/10.3390/en11020348
Submission received: 9 December 2017
/
Revised: 23 January 2018
/
Accepted: 30 January 2018
/
Published: 2 February 2018
(This article belongs to the Collection Electric and Hybrid Vehicles Collection)
Abstract
:In the paper, we describe a study of an electro-hydrostatic hybrid drive of a utility van intended for city traffic. In this hybrid drive, the electric drive is periodically accompanied by hydrostatic drive, especially during acceleration and regenerative braking of the vehicle. We present a mathematical model of the hybrid drive as a set of dynamics and regulation equations of the van traveling at a given speed. On this basis, we construct a computer program which we use to simulate the processes of energy conversion in the electro-hydrostatic drive. The main goal of the numerical simulation is to assess the possibility of reducing energy intensity of the electric drive through such a support of the hydrostatic drive. The obtained results indicate that it is possible to reduce the load on elements of the electric system and, therefore, improve energy conversion.
1. Introduction
For a while now, manufacturers of traditional cars and buses have been involved in manufacturing electric vehicles intended mainly for city traffic. In the years to come, the share of this type of vehicles in transport in urbanized areas is bound to increase.
Such cars, despite their obvious ecological advantages, visible mainly within cities, are questioned [1,2] when it comes to the effectiveness of cumulated energy conversion process including: energy conversion in power plants and its transmission, processes of charging and discharging of the traction battery, as well as energy conversion processes in the power transmission system of a vehicle. The effectiveness of the three mentioned energy conversion processes, which are directly connected with the vehicle use, influences energy consumption of a vehicle and thus has an economic significance for a vehicle user [3,4,5].
By the end of the 20th century, methods of decreasing energy intensity of the electric drive by supporting it with the flywheel drive, in which a spinning flywheel is connected to the power transmission system by means of a stepless mechanical transmission or electromechanically, were considered. A comprehensive study of such a drive is included in the monograph [6].
Improving the effectiveness of energy conversion in the power transmission system of a vehicle intended for transporting goods and passengers in a city is the main focus of the article, and its purpose is to show that it is possible to improve this effectiveness by applying hydrostatic support [7,8]. Such a drive, that will be referred to as the hybrid electro-hydrostatic drive, is intended for vehicles the load of which is determined by driving cycle, i.e., a function determining the curve of speed in time. The city driving cycle is characterized by the speeds not exceeding 50 km/h and frequent stopping. In such a driving cycle, a vehicle often accelerates and brakes. During accelerating or regenerative braking, the power transmission system is heavily loaded, since the power of energy conversion in these periods of movement increases. In electric cars, such a load results in huge energetic losses, and thus, the effectiveness of energy conversion decreases. It will be shown that applying hydrostatic support in such conditions of movement enables a significant reduction of load on the electric drive, especially the battery, and therefore the energy intensity of a vehicle decreases.
A similar kind of hydrostatic drive is used in vehicles to support a traditional drive with an internal combustion engine, and the power transmission system created this way is called an internal combustion hydrostatic drive. Usually, vehicles with such a power transmission system are referred to as Hybrid Hydraulic Vehicles—HHV. At the beginning of the 21st century, the U.S. Environmental Protection Agency (EPA) declared a Clean Automotive Technology research program which included extensive research related to applying the internal combustion hydrostatic drive in commercial vehicles, especially these used in cities. Within this program, a number of HHV concepts for commercial vehicles used in cities were developed (Using Hydraulics in Urban Delivery Trucks [9]).
In the article, an electric drive with hydrostatic support intended for a city car characterized by cyclic movement is considered. The aim of the study is to evaluate the influence of the hydrostatic support on the effectiveness of energy conversion and on the relief of the electric drive. It will also be shown that such a support results in decreasing traction energy consumption of a vehicle.
The focus of the study is a hybrid electro-hydrostatic drive for vehicles or construction machinery, the load of which changes cyclically. In the article, a delivery van with an electric drive intended for city traffic is considered. The article discusses improving the effectiveness of energy conversion in this vehicle due to using hydrostatic support in the electric drive. The article also presents mathematical description of energy conversion process in electric and hydrostatic drives, and the description of the model of a drive control system of a vehicle moving at a given speed. Based on this description, simulation studies of the energy conversion in the considered power transmission system, were performed. Additionally, a laboratory station to experimentally study the process of energy conversion in the considered electro-hydrostatic drive was constructed. The results of these studies were also used to verify the parameters of the mathematical description of the drive.
The obtained results of numerical studies confirm the thesis that it is possible to improve the effectiveness of energy conversion process in the electric drive of a city car by means of the hydrostatic drive support. The experimental research has also shown that employing the hydrostatic support reduces the load on the electric battery, which results in smaller energy losses in the electric drive.
2. Numerical Investigation
2.1. Description of the Electro-Hydrostatic Drive
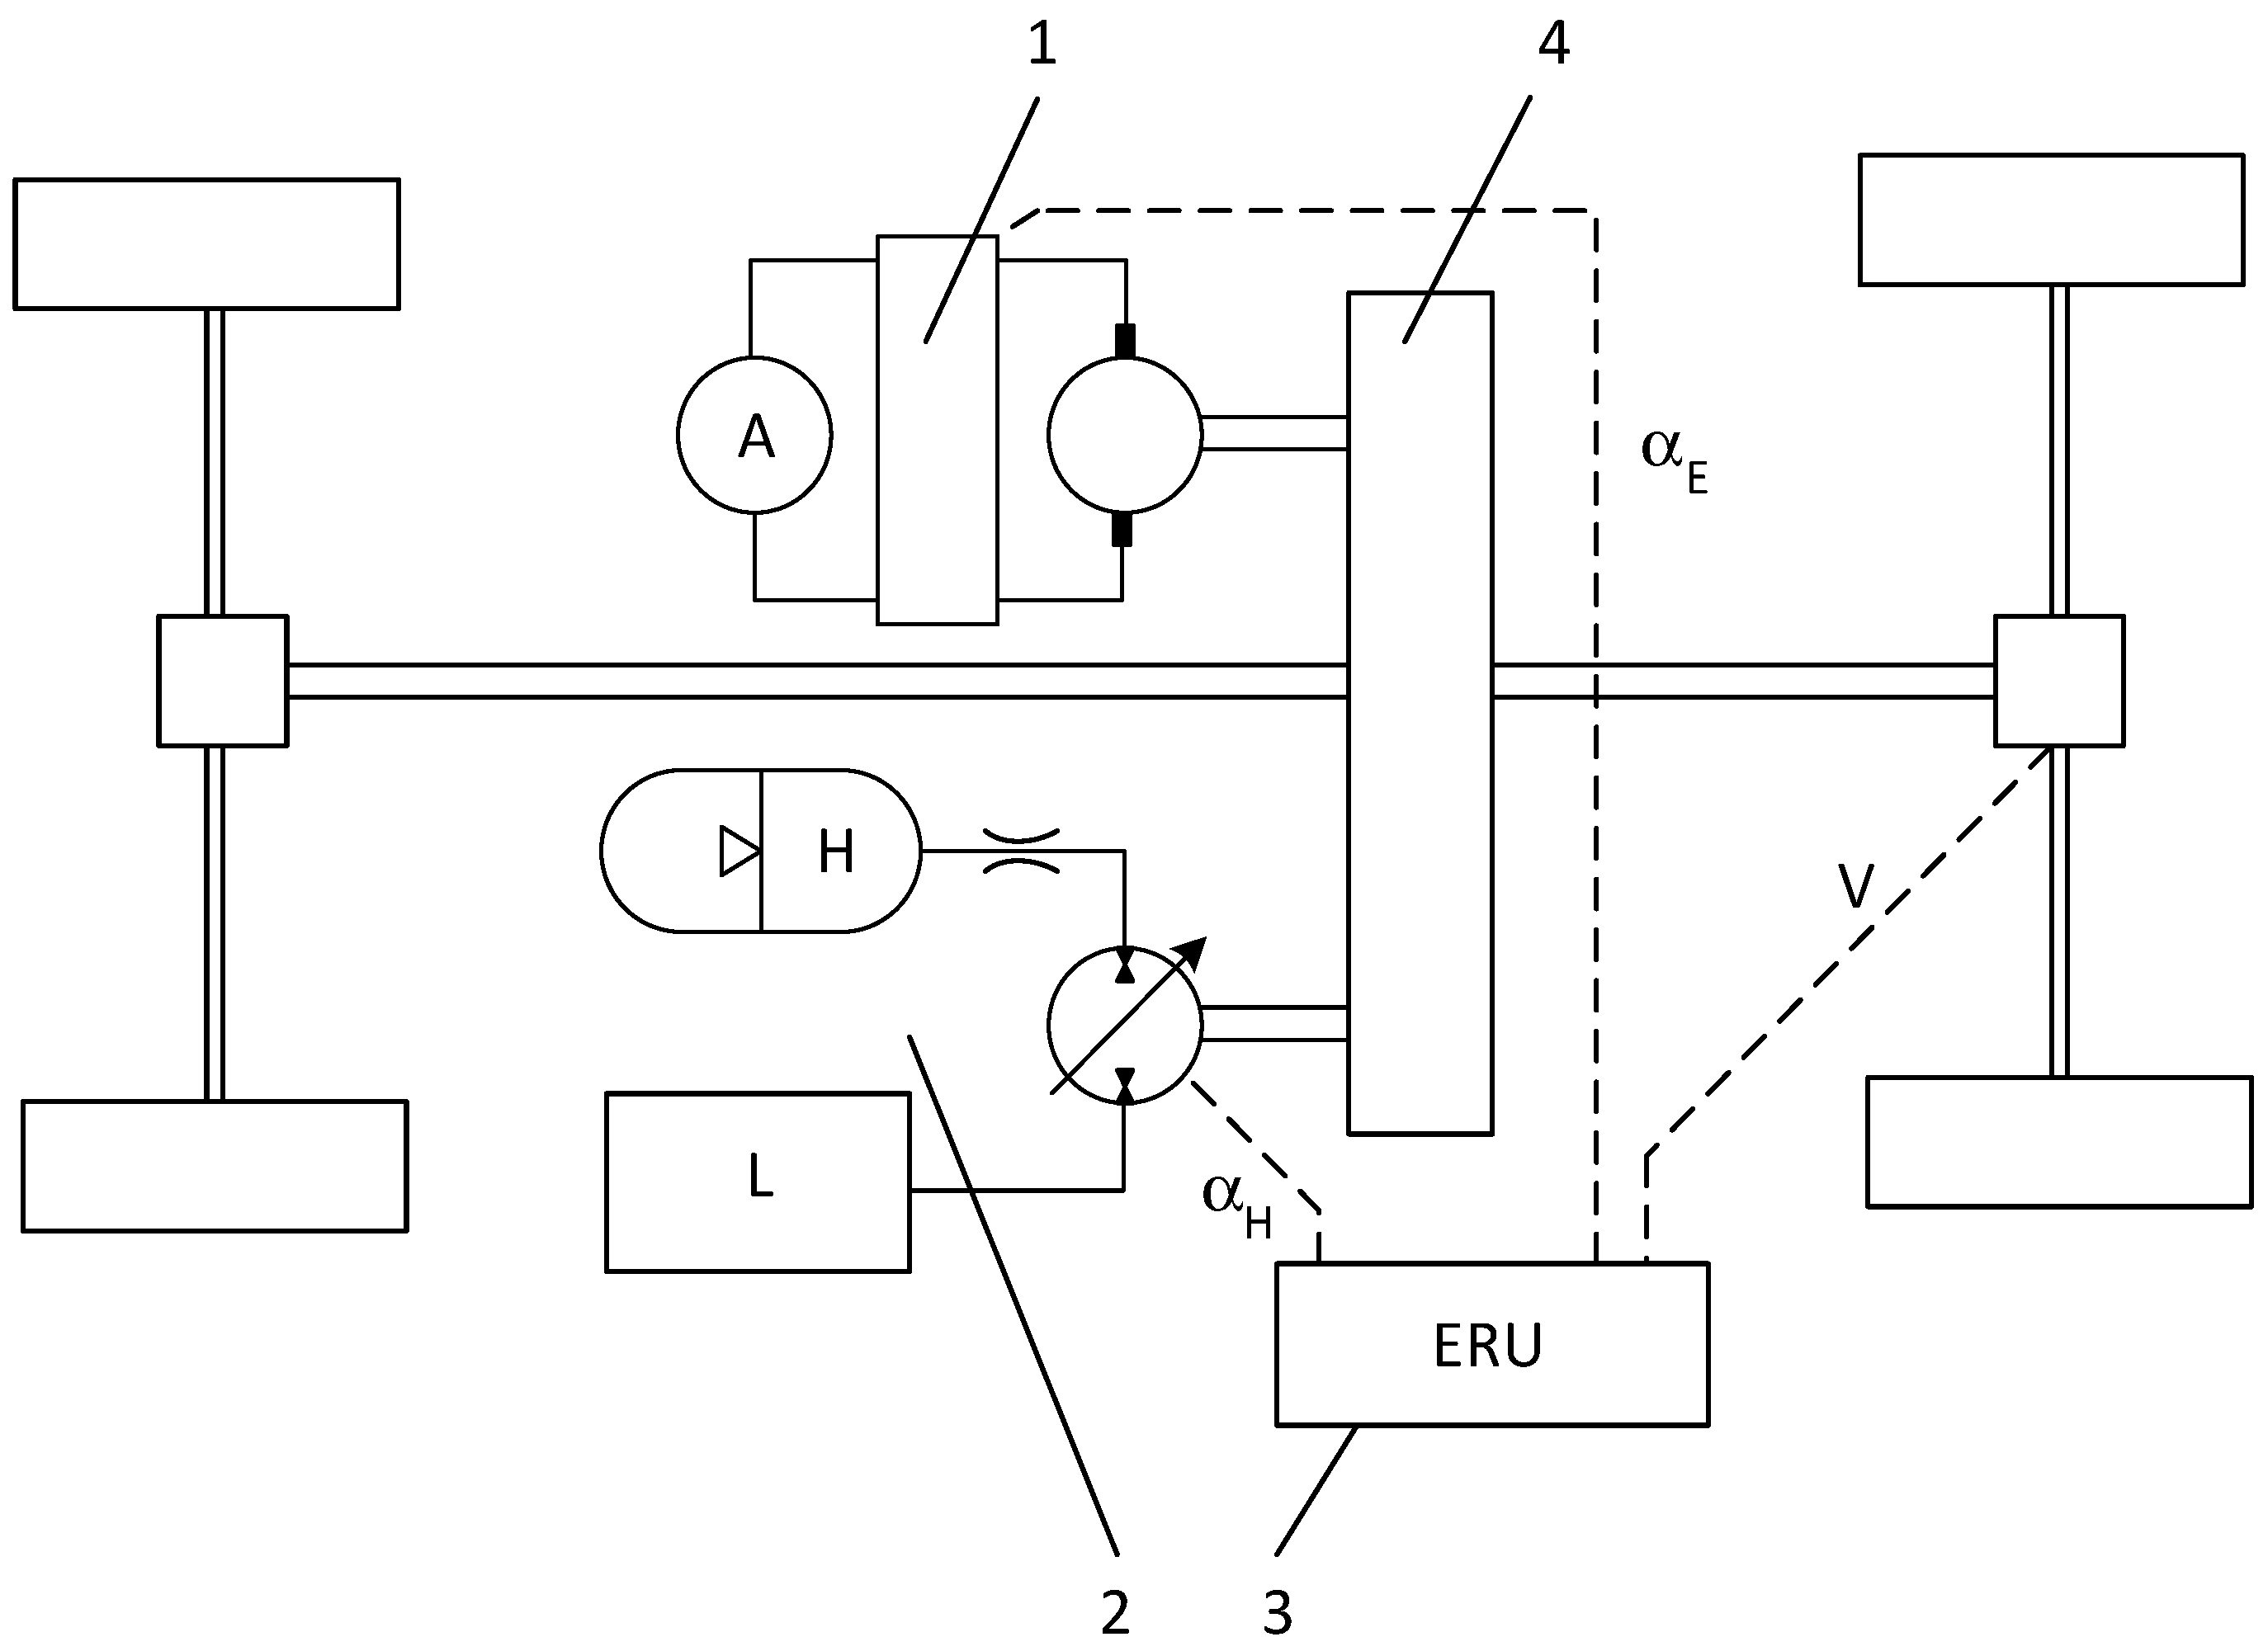
A structural scheme of the modelled power transmission system is shown in Figure 1. In the presented system, an energy flow process occurs between three reservoirs, in which energy is stored in three forms: electric and mechanical kinetic, as well as thermodynamic, i.e., hydraulic potential and thermal. While the vehicle accelerates, the energy is collected from the electric battery and partly from the hydro-pneumatic battery, and then is converted into kinetic energy of the vehicle. During vehicle braking, kinetic energy, having been converted, returns to the hydro-pneumatic battery and, in part, to the electric battery. The abovementioned processes of energy flow and conversion are accompanied by the energy dissipation process. The energy conversion occurs in the electric machine operating as a motor or a pump. The operation of both machines is controlled by the control system. Mathematical description of the energy conversion process in the hybrid drive was developed as a result of combining the descriptions of energy conversion processes in electric, hydrostatic and mechanical drives.
2.2. Mathematical Description of the Hydrostatic Drive
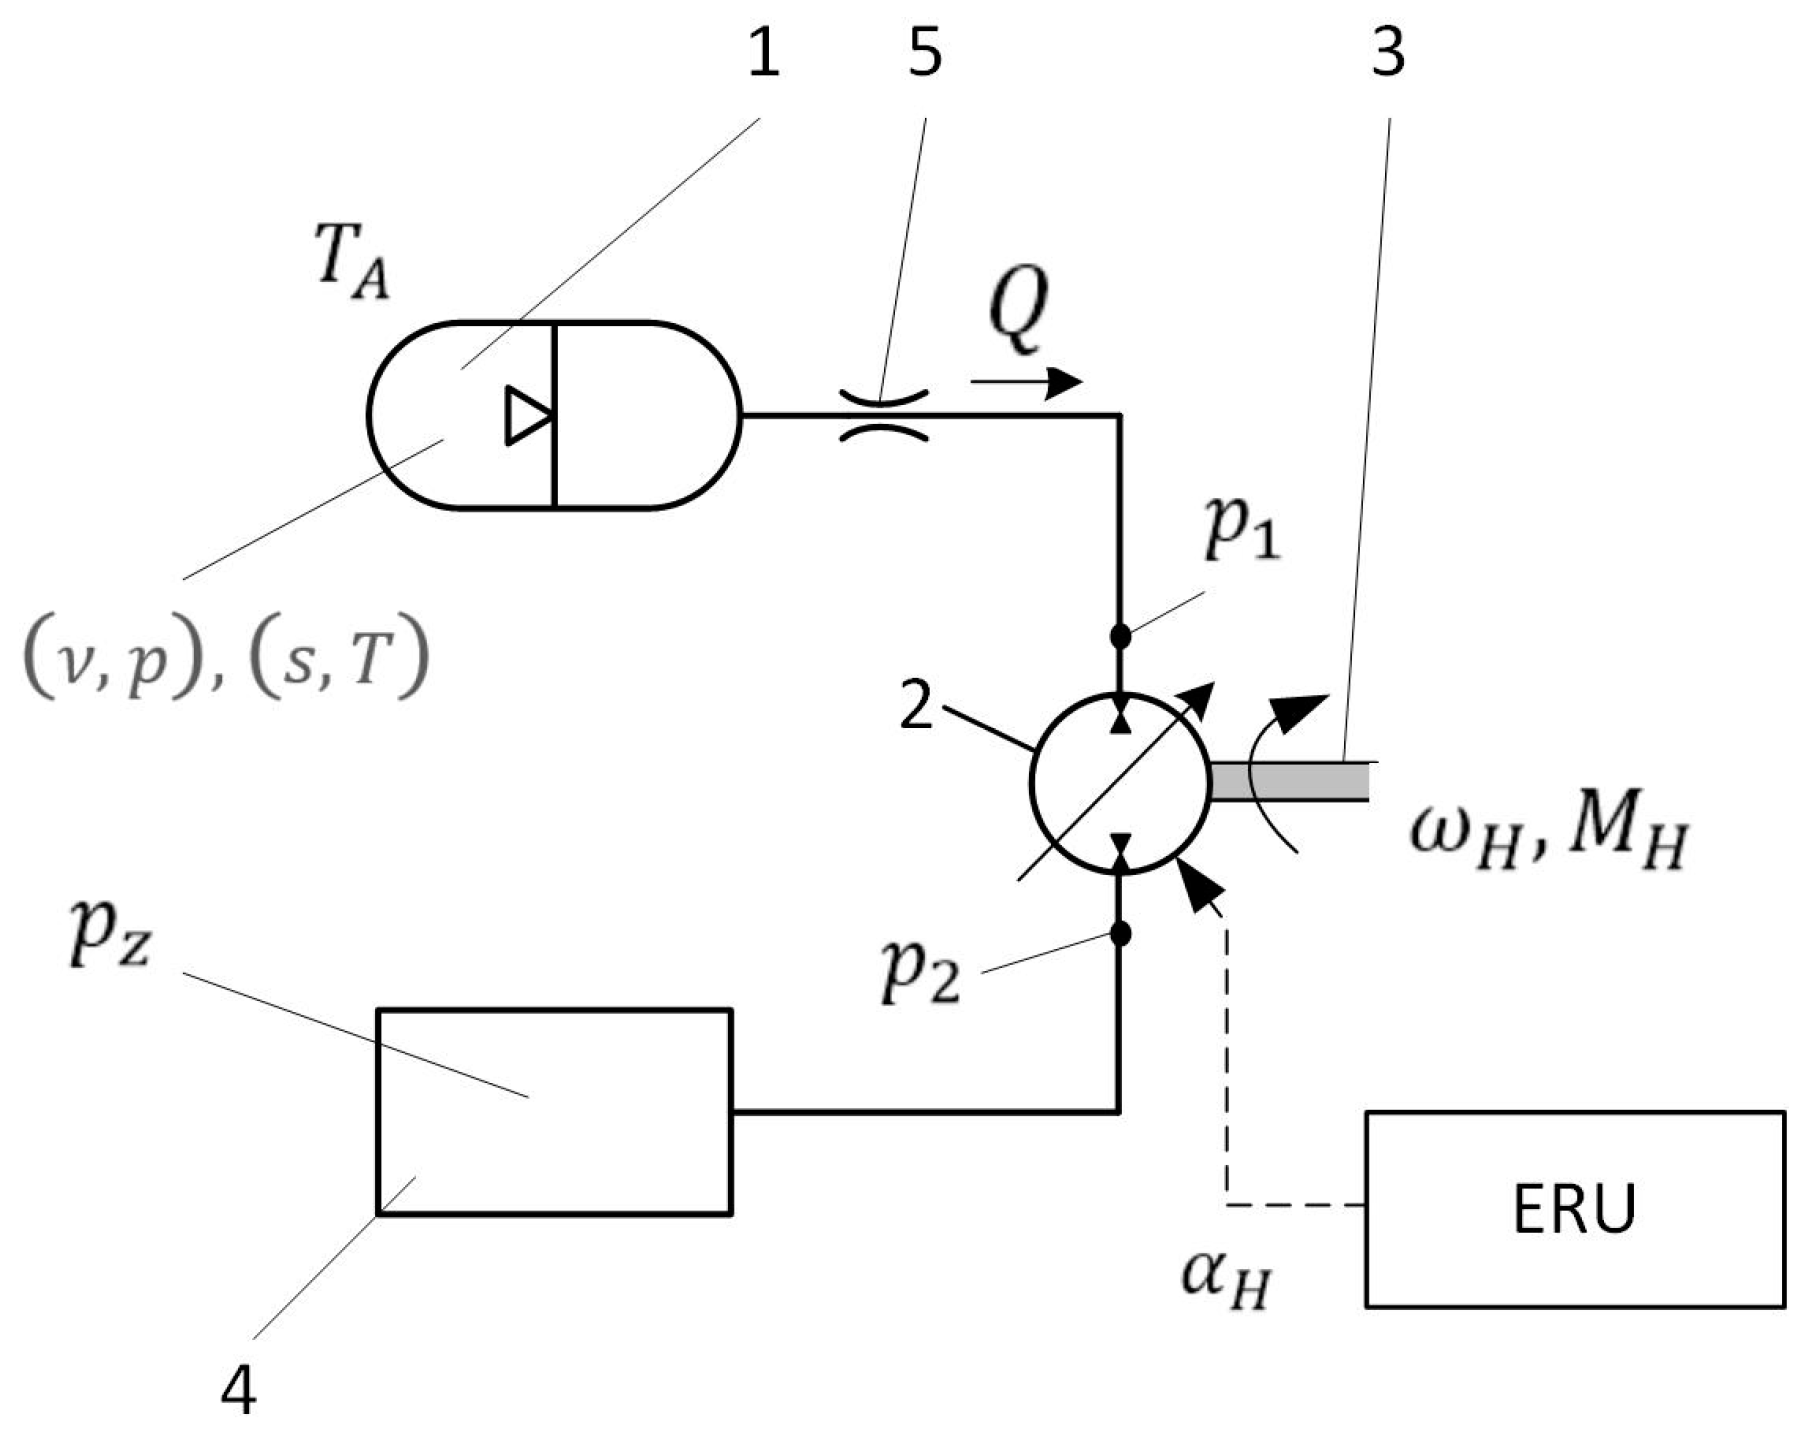
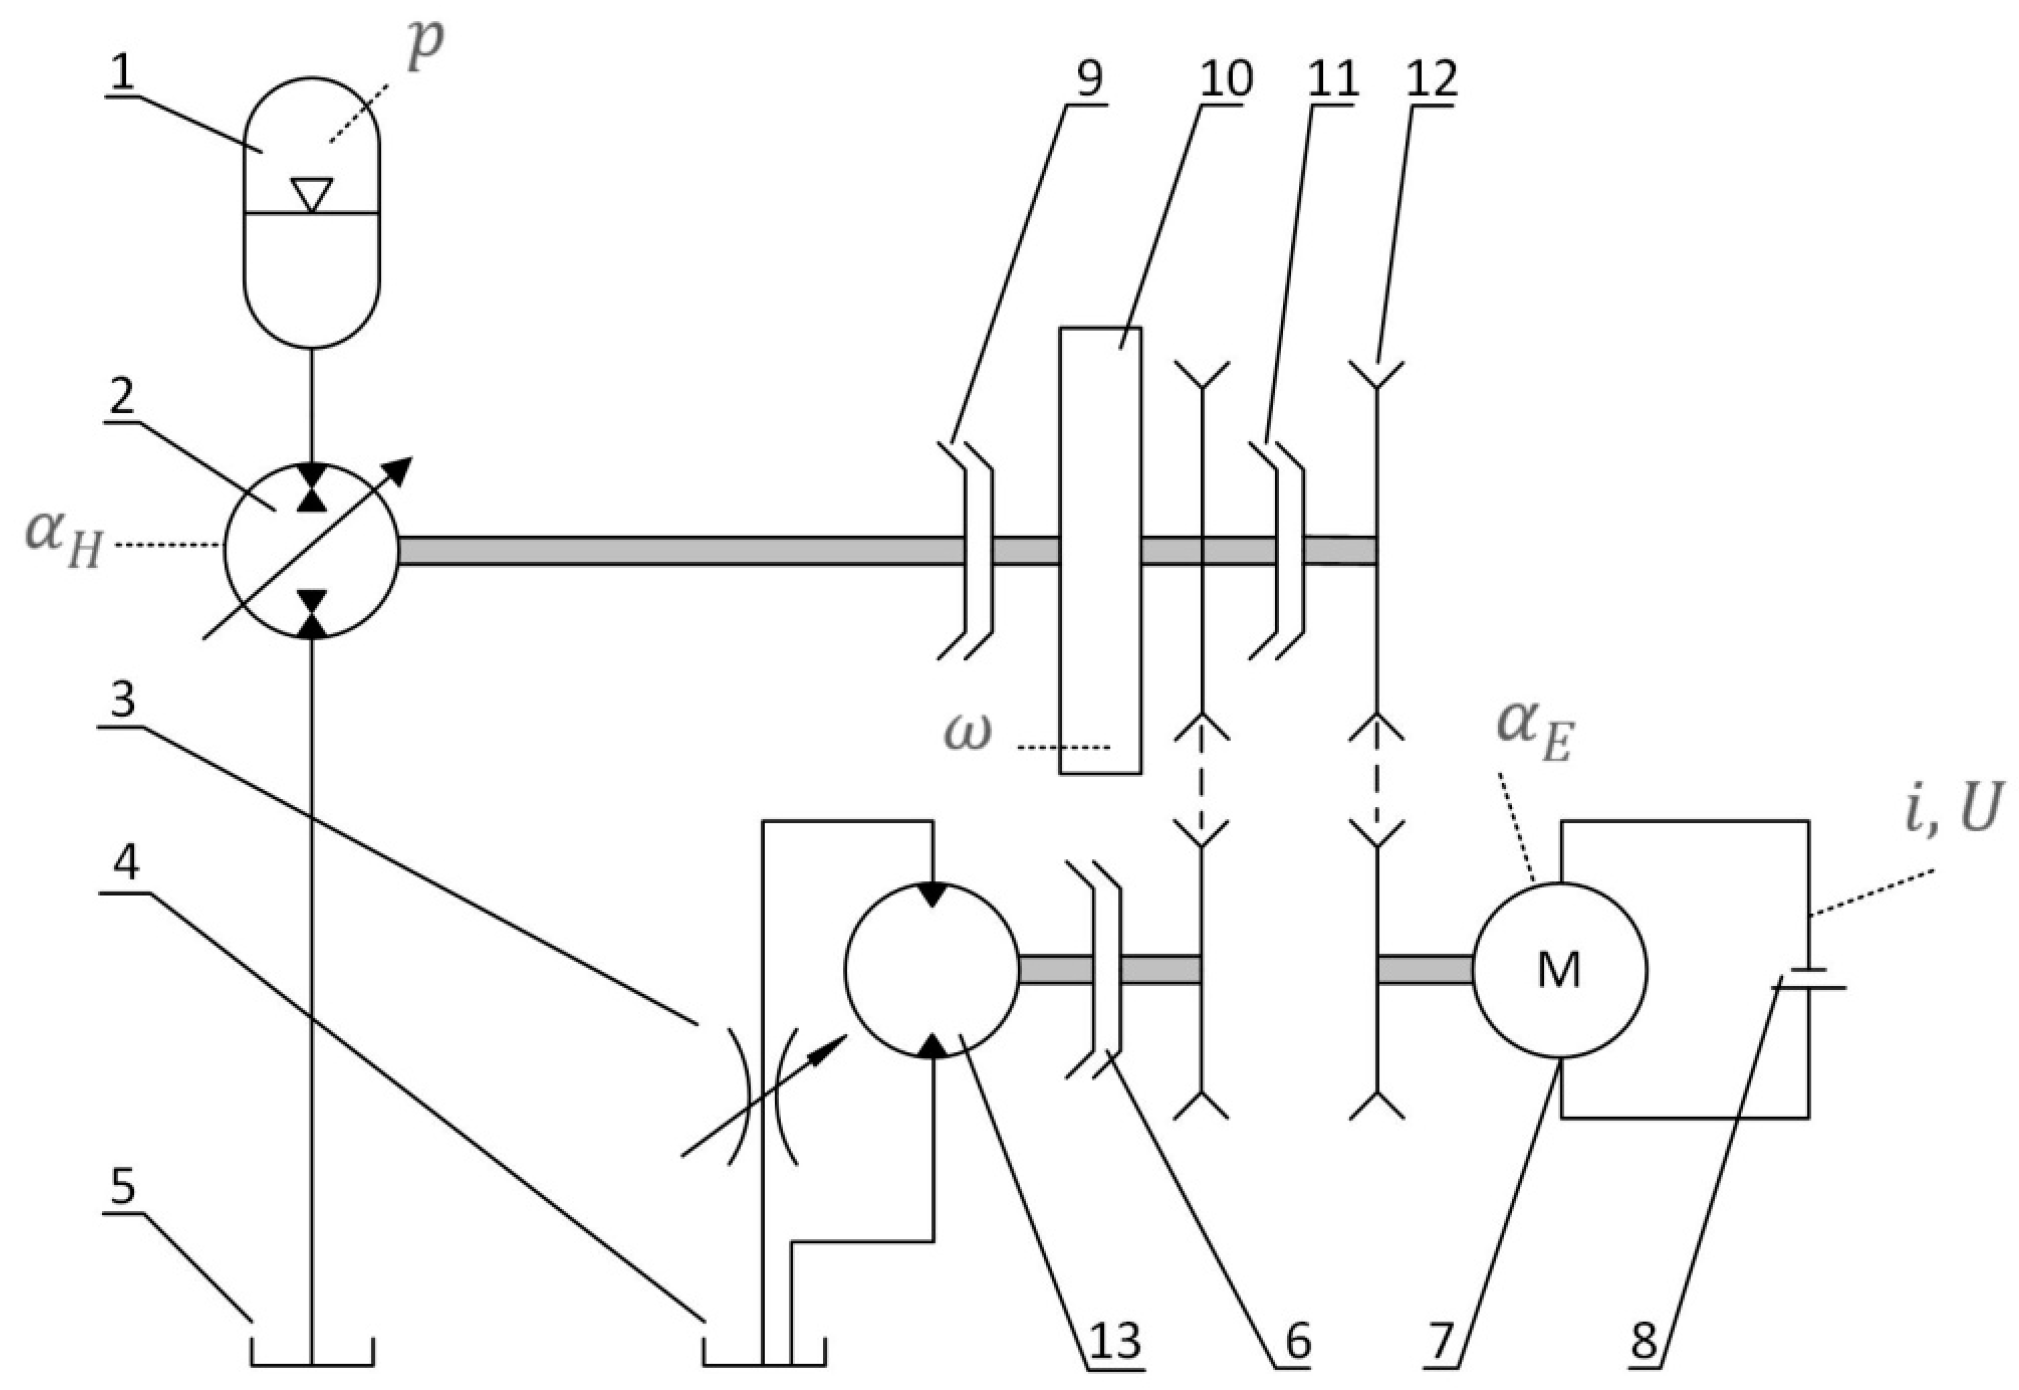
A scheme of the structure of the considered hydrostatic drive is shown in Figure 2. The drive consists of: 1—hydro-pneumatic battery; 2—pump-motor with variable displacement, where the energy conversion occurs; 3—drive shaft; 4—oil tank with constant pressure; 5—reducer rendering hydraulic resistance in the pipeline connecting the battery with the pump-motor.
In the presented power transmission system, while the vehicle accelerates, the energy accumulated in the gas bladder 1 flows to the drive shaft 3. While the vehicle brakes, the direction of the energy flow is reverse. In the scheme of the hydrostatic drive (cf. Figure 2), the symbols of physical quantities are shown, by means of which the energy flow process will be described. The symbols denote:
- —specific volume of gas,
- —gas pressure,
- —specific entropy of gas,
- —gas temperature,
- —volume intensity of the oil flow through the pump-motor,
- —signal controlling the pump-motor,
- —pressure of hydraulic oil on the pump-motor terminals,
- —angular velocity of the drive shaft,
- —moment acting upon the drive shaft,
- —pressure in the oil tank,
- —ambient temperature of the hydro-pneumatic battery.
It is assumed that:
- the hydro-pneumatic battery is filled with perfect gas,
- in the hydraulic installation, between the battery 1 and the tank 4, there is incompressible oil
- the principal resistance of the oil flow occurs in the ducts connecting the battery 1 to the pump-motor 2,
- the pump-motor is treated as a perfect converter,
- between the hydro-pneumatic battery and its environment, there is energy exchange in the form of heat conduction.
The amount of energy accumulated in the compressed gas is calculated as change in relation to the established reference state, according to the formula:
where:
- —specific volume, specific entropy and temperature of gas determining the reference state,
- —specific heat of gas,
- —constant called isentropic exponent (adiabate),
- —energy of gas in the reference state in relation to which the change is determined:
where:
- —mass of gas included in the hydro-pneumatic battery bladder,
- —volume of gas in the reference state.
As mentioned before, the crucial part of the operation of the considered hydrostatic drive is energy exchange, i.e., collecting it from the battery during acceleration and returning it during braking. Based on the Formula (1a), the power of the energy exchange is determined, assuming that the considered physical quantities change in time:
The first component of the right side of the Formula (2) determinates the power of energy exchange, connected with the change of gas volume, triggered by the operation of the hydraulic pump-motor. The second component defines the power of energy exchange between the gas and the environment, resulting from heat conduction.
Having performed the appropriate transformations, the Formula (2) can be written as follows:
if pressure and temperature are defined by the formulae:
As mentioned before, as a result of the operation of the pump-motor, the volume of gas changes; the rate of the change is defined by the formula resulting from the continuity of the oil flow in the hydraulic installation:
where:
- —angular velocity of the rotor of hydraulic pump-motor,
- —a constant characterizing the flow characteristics (volume capacity) of the pump-motor,
- —signal controlling the capacity of the hydraulic pump-motor.
Expression of the right side of the Equation (5) determines the flow intensity in the hydraulic installation of the hydrostatic drive.
Usually, it is assumed, that the process of energy change in the battery occurs according to a specified thermodynamic transformation, e.g., isentropic transformation (adiabatic), in which or isothermal process, when .
While performing experimental studies it was noticed, that the patterns of variables defining the state of gas differ from the above-mentioned thermodynamic transformations. Hence, based on the results of experimental studies of isochoric transformation of gas in the battery a model of heat exchange between the gas and its environment was established. Mathematical description of this process looks as follows:
where:
- —ambient temperature,
- —the constant characterizing the process of heat exchange between the gas and the environment, established on the basis of the results of experiments.
In the hydraulic installation, through which the energy is transferred between the battery (1) and the pump-motor (2), the losses resulting from the resistances of oil flow occur. As a result of these losses, the difference in oil pressure in the battery occurs on the first terminal of the pump-motor (see Figure 2). In the model, it was assumed that:
where:
- —the constant characterizing the pressure drop in the pipeline connecting the battery to the pump-motor – the value of this constant is established experimentally.
As mentioned before, in the pipeline connecting the pump-motor 2 to the tank 4 the flow losses were omitted and it was assumed that there is constant pressure in the tank. Thus, the pressure on the second terminal of the pump-motor is the same as in the tank, i.e., .
From the assumption on the perfect energy conversion in the pump-motor, stems the equation of power balance:
and thus, the formula for the moment of forces acting upon the drive shaft is obtained:
Based on the above considerations, the description of the process of energy conversion in the hydrostatic drive, was formulated. The description consists of the following formulae: (4)–(7) and (9).
2.3. Mathematical Description of the Electric Drive
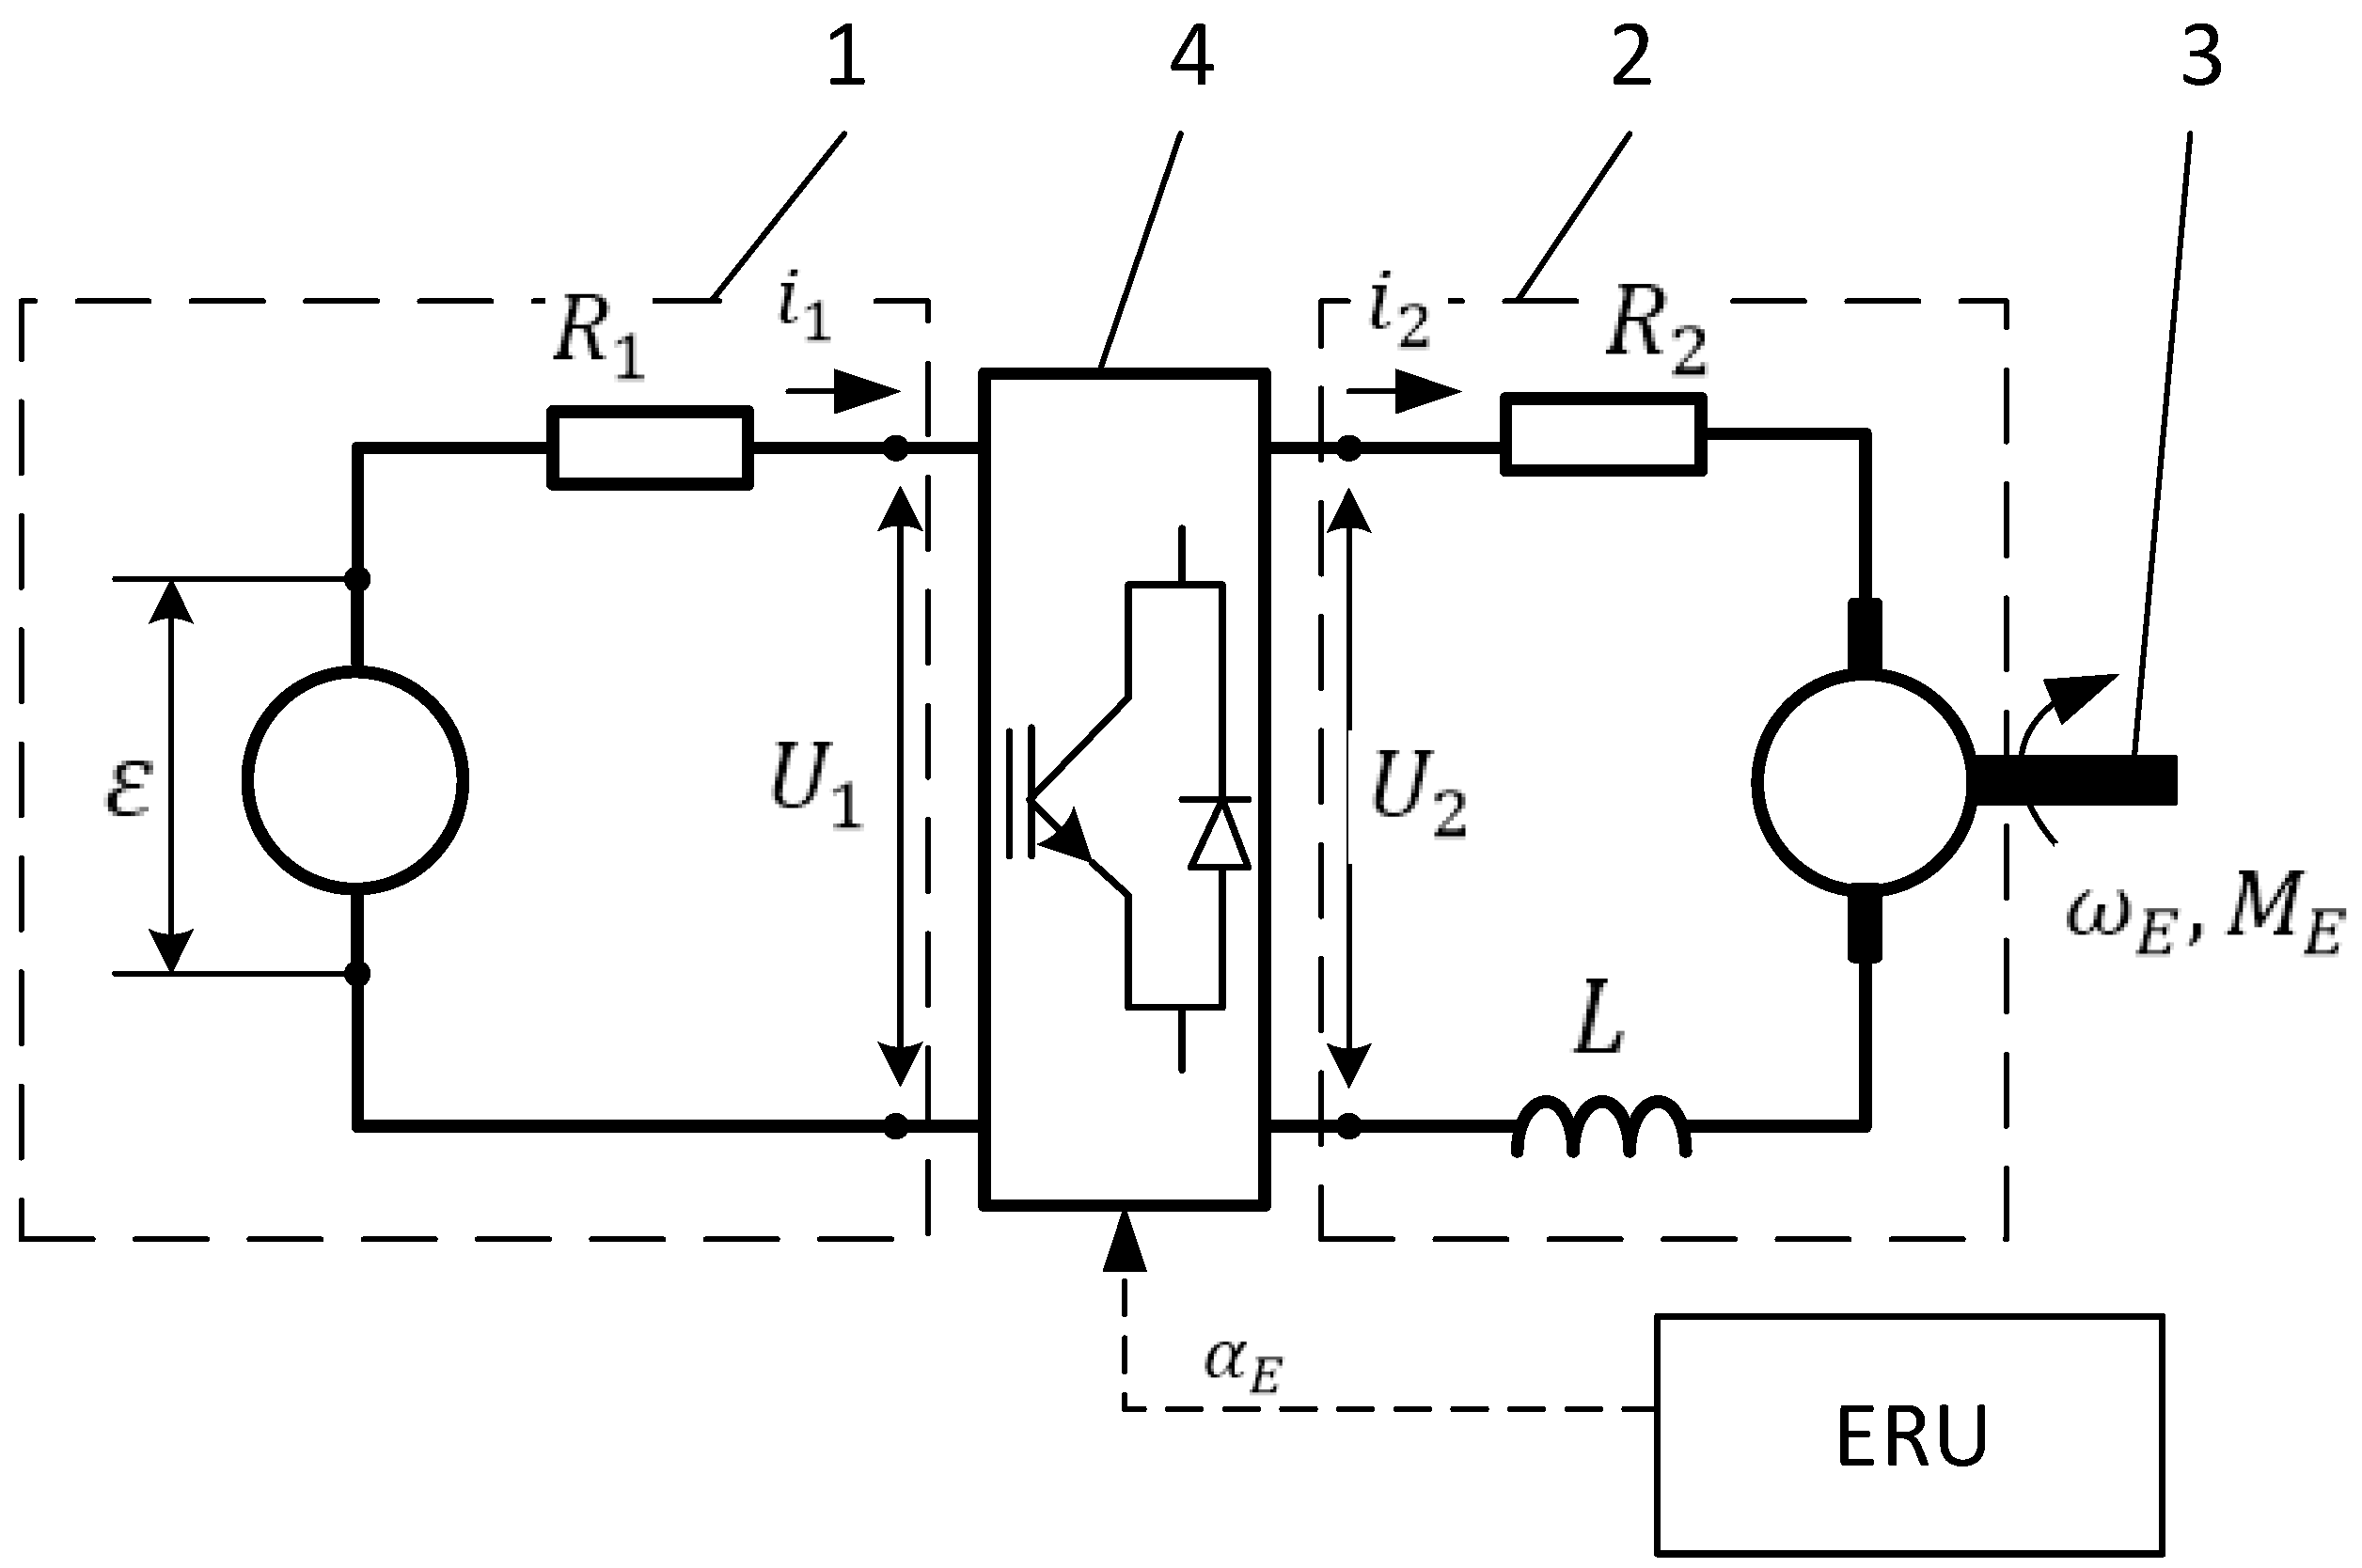
The scheme of the structure of the considered electric drive is shown in Figure 3. The system consists of: 1—battery; 2—electric motor which can also operate in a generator mode; 3—drive shaft; and 4 —transistorized DC/DC voltage converter.
In this article, a model of a direct current commutator motor with Permanent Magnet Direct Current (PMDC) magnets is studied. Such a motor was chosen due to a relatively simple mathematical description of energy conversion process. In the scheme of the electric drive the names of variables are shown, by means of which the process of energy conversion was described. The symbols denote:
- —current flowing through the battery,
- —current flowing through the motor winding,
- —voltage on the battery terminals and on converter terminals from the side of the battery,
- —voltage on the motor terminals and on converter terminals from the side of the motor,
- —inductance of motor winding,
- —internal resistance of the battery,
- —resistance of motor winding,
- —signal controlling voltage converter,
- —angular velocity of the drive shaft,
- —moment of forces acting upon the drive shaft.
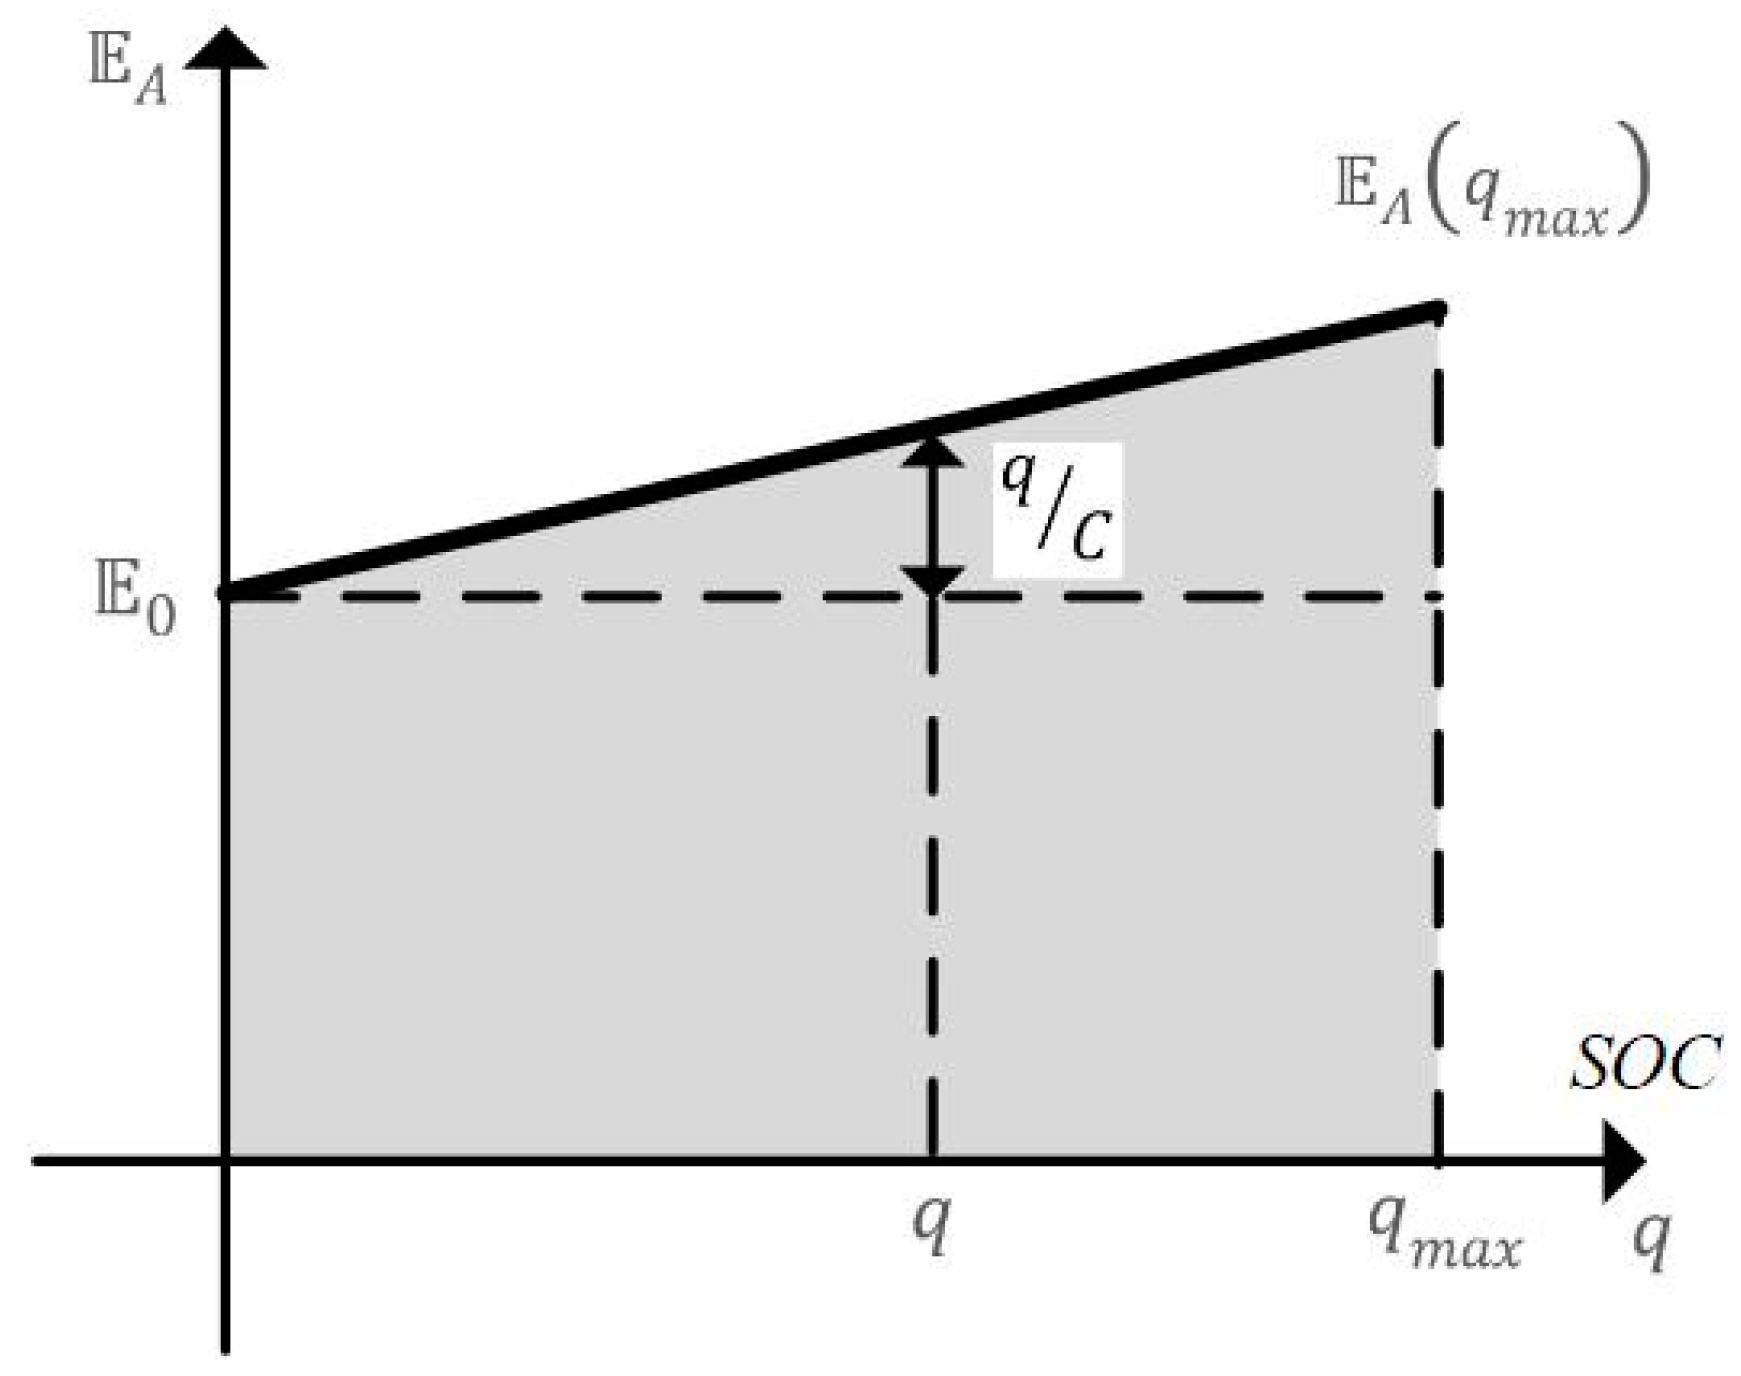
Based on the initial measurements, the form of characteristics of the electro-chemical battery was established, defining the dependencies of electromotive force on the accumulated electric charge. Additionally, it was assumed that the internal resistance of the battery is represented by the resistor (see Figure 3). The scheme of the form of characteristics of the battery is shown in Figure 4, and its description is defined by the formula:
where —two parameters defining the form of characteristics.
Very often, instead of an electric charge the SOC (State of Charge) variable is used, and it defines the rate of battery charge in relation to the full charge state, i.e.,
The amount of energy accumulated in the battery characterized in such a way is:
and at the beginning of the simulation, at the moment we adopt (full charge), that is:
Thus, voltage on the battery terminals is established by the formula:
whereas the relation occurs:
The considered electric motor is powered by voltage , the value of which is adjusted in the converter 4 by means of the signal . It is assumed that the converter is perfect, i.e., the balance of power is fulfilled:
and the operation of the converter is defined by the relations:
The description of current flowing through the motor winding 2 is in the form of balance of power:
where the expression determines electromotive force, which is induced in the motor winding rotating at the angular velocity . In the above expression denotes magnetic flux generated by stator permanent magnets, whereas is the constant characterizing the motor.
It is assumed, that the perfect energy conversion occurs in the motor, determined by the following balance of power:
thus the formula for the moment of forces on the motor shaft is obtained (cf. Figure 3):
The dependencies presented above define the process of energy conversion in the electric drive. The description of this process consists of the following formulae: (12)–(14), and (16).
2.4. Mathematical Description of the Vehicle
The considered model of the vehicle is used to analyze the process of energy conversion during vehicle accelerating and braking. For this reason the vehicle in which all wheels are connected to the power transmission system, as shown in Figure 1, is considered. It is assumed that the vehicle performs a rectilinear motion and the vibrations of the vehicle body and the slip of wheels are omitted. Energetic features of such a vehicle are characterized by: —mass, —velocity, —function describing the resistance of vehicle movement and resistances in the system of power transmission between the wheels of the vehicle and the shaft of the electric motor and the hydrostatic motor.
The equation describing the movement of such a vehicle is presented in the form of the equation:
where —resultant moment of forces acting upon the wheels of the vehicle, —radius of the vehicle wheels.
The value of the driving moment is connected with moments of forces (Formula (16)) and (Formula (9)) acting upon the shafts of the electric motor and the pump-motor. The value is defined by the following relation:
where: —kinematic transmission between the wheels of the vehicle and the shafts of the electric motor and the hydrostatic motor, and also that:
Formulae (18) define the energetic features of the energy transmission system from the motor shafts to the wheels of the vehicle, assuming that the balance of power is fulfilled:
Energetic losses occurring in the course of the above-mentioned energy transmission are included as an additional element of the function describing energetic losses connected with the movement of the vehicle.
Two pairs of magnitudes (), () enumerated in the Formulae (18) and (19) define energetic coupling of the vehicle with the drives described in points 3 and 4.
Thus, the description of the energy conversion process in the presented model of the vehicle with electro-hydrostatic drive also comprises the equations that were enumerated at the end of the two previous chapters (4)–(7), (9), (12)–(14), and (16), as well as the Equations (18) and (19).
It has to be stated that the above-mentioned overview of the formulae describing the process is not full, since it does not contain the method of designating the signals , controlling the drives. The method will be presented in the next section.
2.5. Description of the Electro-Hydrostatic Drive Control System
The description of the energy conversion process in the electro-hydrostatic drive was formulated in the Formulae (4)–(7), (12)–(14) and (16), as well as (17)–(19). The formulae constitute a set of ordinary differential equations with control:
if:
The presented initial issues will be referred to as a problem of hybrid drive dynamics. The form of the solution of this problem depends on two functions , describing control signals, the voltage of electric motor powering depends on, the issue described by Formulae (12)–(14), and the capacity of the hydrostatic pump-motor, described in the Formula (5).
The patterns of these signals are determined in the control system, where the conversion occurs of measuring signals defining physical quantities characterizing energetic state of both drive systems. Measuring signals are converted according to the established algorithm into control signals , , which control actuating modules of the voltage converter and the pump-motor. In this section, the designations of signals and physical quantities corresponding to them, will be the same.
Two signals external towards the power transmission system are the basis to establish the control signals , s. The first signal, described by the function determines the given speed of the vehicle within an established time frame , whereas the second signal determines the role of the hydrostatic drive in vehicle accelerating and braking.
The problem of adjusting the vehicle speed consists in designating signals and so that the vehicle moves at the speed . The problem may be realized in approximation defined by the function of speed error:
where —is the signal of speed established on the basis of solving the problem of dynamics. The obtained approximation is usually assessed by the value of integral:
The problem of speed adjustment described above does not have an unequivocal solution, since the resultant moment of forces on the drive shaft of the electro-hydrostatic system, defined in the Formula (19) may be obtained by different moments and . The considered signal determines the following relations between the enumerated moments:
Relations (23) enable establishing a clear solution to the considered problem of dynamics and control.
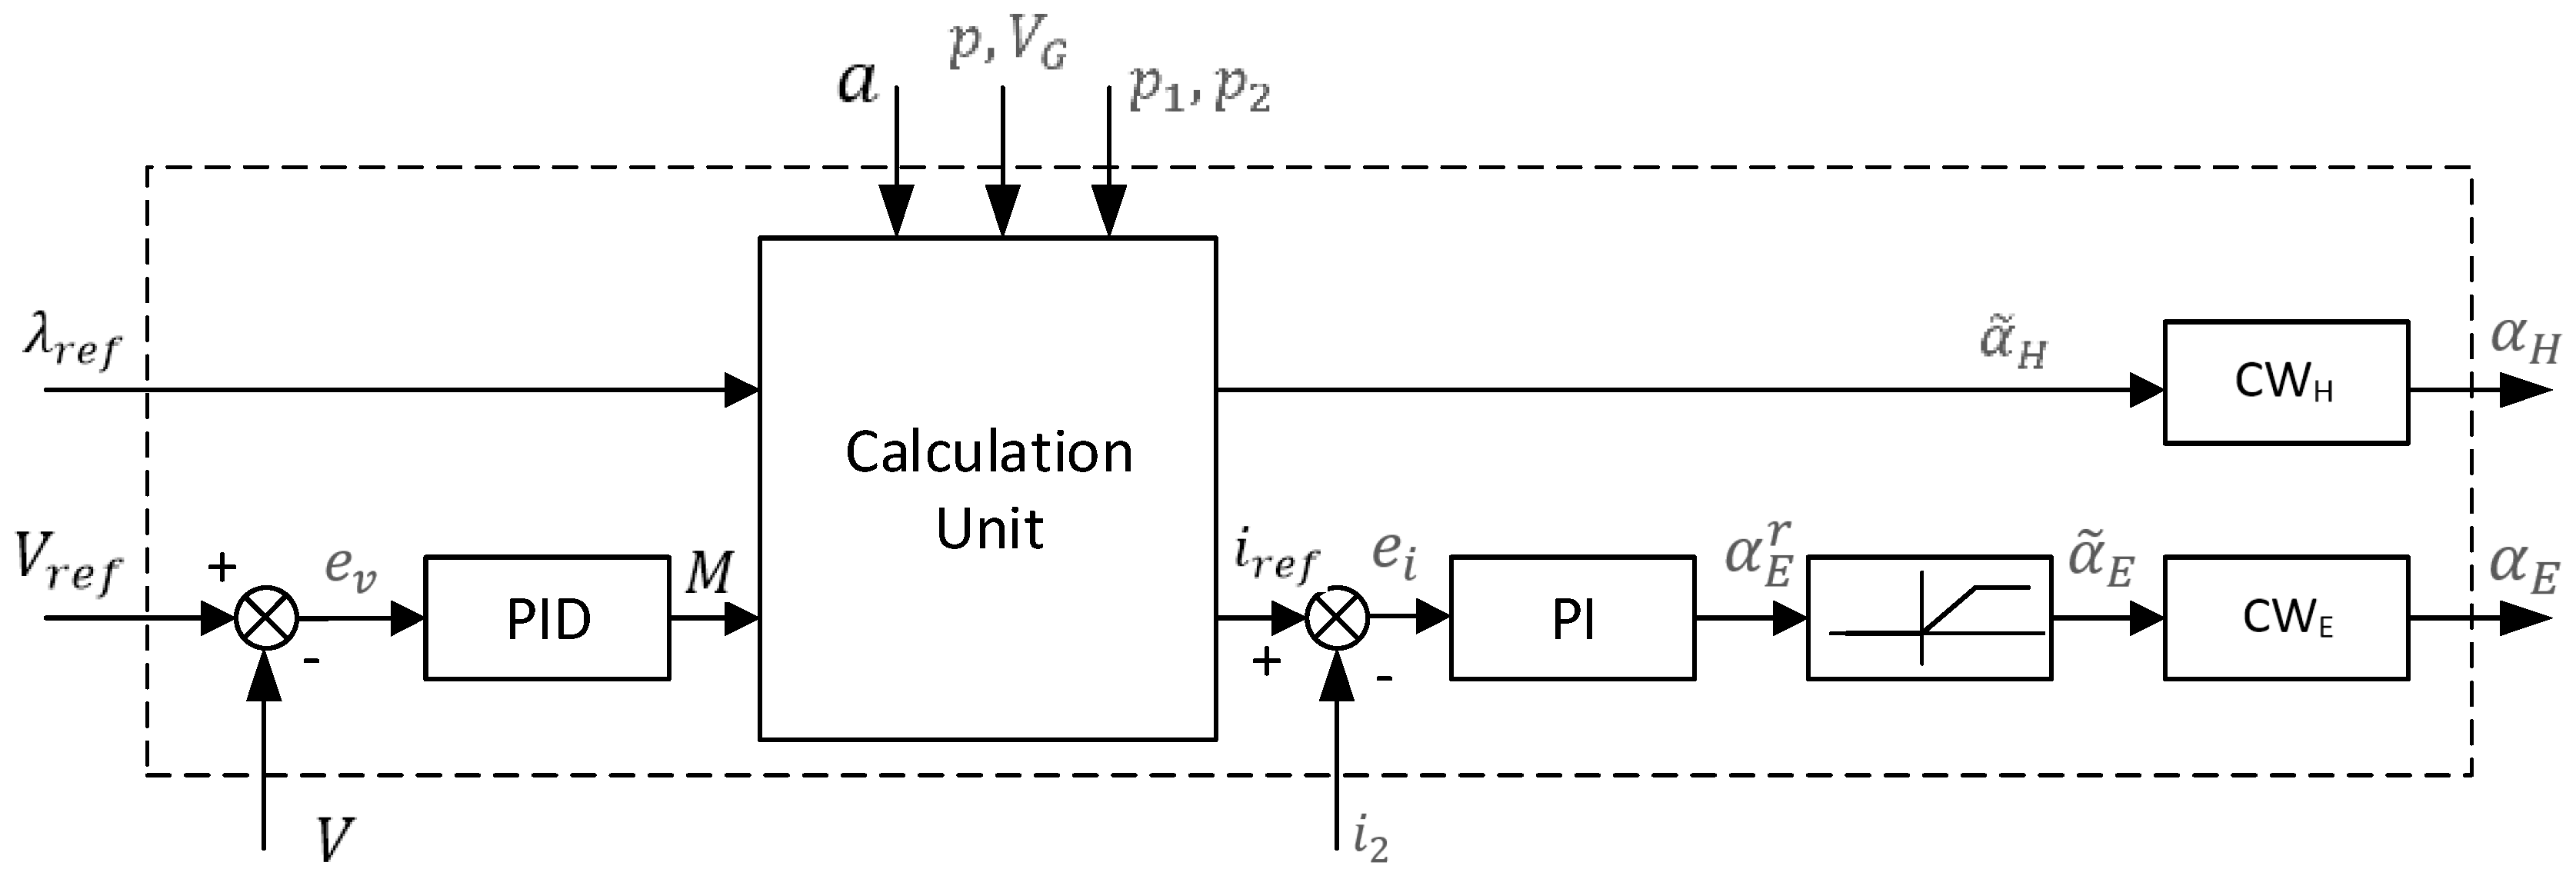
Figure 5 shows the scheme of the algorithm of signal conversion in the considered control system. The key element of the system is the PID speed controller, in which error signal from the Formula (21) is converted into a signal of resultant driving moment :
where , , are the constants of the PID controller.
In the calculation segment, the signals and as well as a set of measurement signals are converted into the signal of the given current flowing through the motor and control signal , which flows to the executing unit in the hydraulic pump-motor .
Converting signals in the calculation segment also refers to adjusting control signals to limitations, which are imposed on physical quantities defining the state of the hydrostatic system. The moment the vehicle is being slowed down, and the pressure of gas is higher than allowable , the hydrostatic drive is disconnected. The drive is also disconnected when the vehicle is accelerated and the volume of gas is lower that the allowable, i.e., .
The next limitation concerns the efficiency of the pump. In this case, the value of the moment of the pump , calculated according to the Formula (23) may be realized only when the value of the signal determined by the Formula (9) fulfills the condition .
The limitations described above result in the reduction of load on the hydrostatic drive, which in turn causes the load of the electric drive, so that the balance of moments described in the Formula (19) is fulfilled. The procedure described above enables calculating the moment of the electric motor , and then establishing by means of the Formula (16) the value of current intensity , which is adjusted in such a way, so that it does not exceed the allowable value . As a result of this adjustment, the given value of the current is obtained so that .
Then, the signal of the current error is established:
where is the measurement signal of the current flowing through the motor.
The signal of the current error is converted in the PI controller, i.e.,
As a result, a signal controlling the voltage converter is obtained. The constants , define the settings of the PI current controller. It was assumed, that in the considered converter, voltage powering the motor may not exceed the voltage of the battery , which was described in the Formulae (13).
Hence, the adjustment of signal occurs, so that its value is lower than 1. The signal adjusted in such a way, flows to the execution unit in the converter.
It was assumed that the operation of the execution units i is modelled using the 1st order inertial system, i.e., the sought control signals (cf. Figure 5) are defined by equations:
The algorithm of signal conversion in the drive control system described above and schematically shown in Figure 5 enables establishing the solution to the problem of dynamics of the electro-hydrostatic drive (20).
It has to be stressed that the form of the solution depends upon two defining signals: vehicle speed and the role of the hydrostatic drive in the energy conversion process .
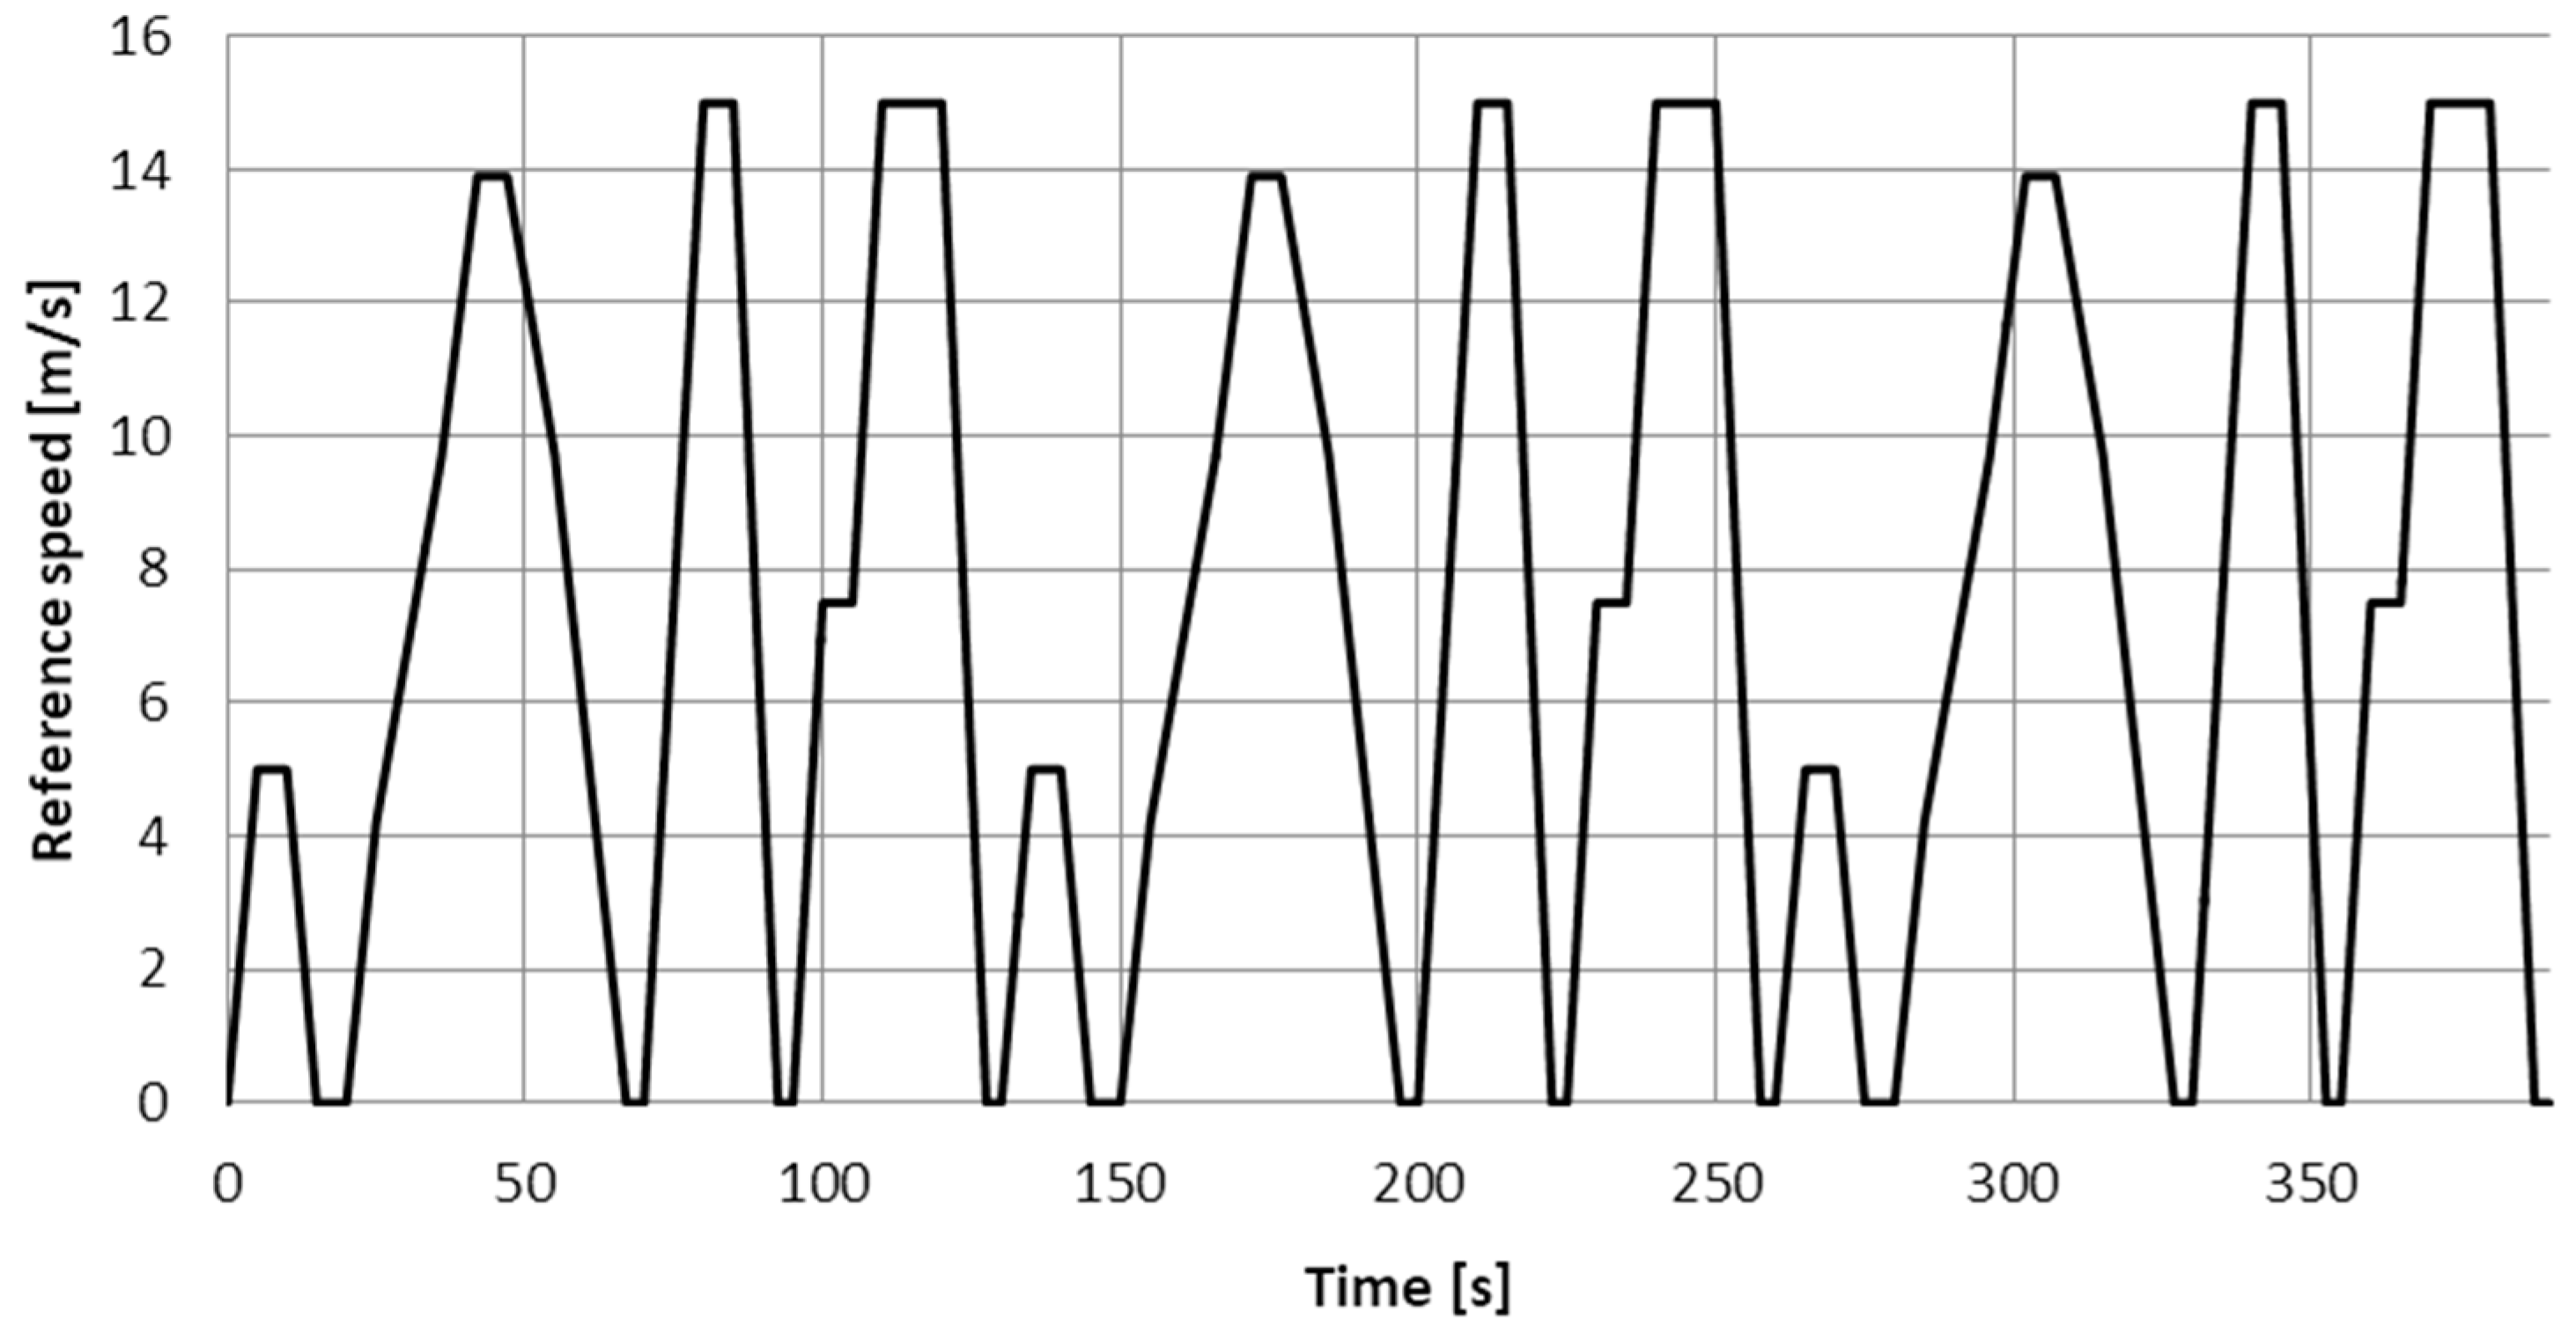
In this article, the signal , rendering the speed of the vehicle in the city traffic is considered. Figure 6 shows the graph of the assumed function , which is similar to the New European Driving Cycle (NEDC) function developed for the traffic of a vehicle with a combustion engine in European cities [10].
The essential property of the considered idea of the electro-hydrostatic drive is higher effectiveness of energy conversion in comparison with the electric drive, and the decreased load on the electric battery. The effectiveness will be evaluated based on the amount of energy necessary to cover an established route at the speed defined by the function , and the load of the electric system will be assessed by the effective value of the current.
In the electro-hydrostatic drive, the signal defining the role of the hydrostatic drive in the energy conversion, has the greatest influence on the amount of energy collected from the batteries and on the value of current. The optimal signal can be established using various methods. Similar issues are considered in traditional hybrid drives, in which the combustion engine is supported by an electric drive (HEV) [11,12,13,14] or in hydrostatic drives (HHV) [9,15] as well as in electric drives with hybrid energy storage system (HESS) [16].
In the article, the signal was established based on initial simulation studies of the modelled movement of the vehicle. Signal was described using a function:
where —vehicle acceleration, —values that will be shown in the results of simulation studies in the next chapter.
The values of signals presented above can be changed when the load of the drive reaches border values. Due to the comparative nature of the evaluation of the effectiveness of energy conversion in the electro-hydrostatic drive, a model of a vehicle with electric drive was also considered. In both these models the electric drives are the same, whereas the electric drive control system contains only the elements that are in the bottom part of the scheme shown in Figure 5.
2.6. Description of the Model Parameters
Below are presented the values of parameters of the model of the vehicle with hybrid drive, the mathematical description of which was given in previous sections.
A commercial vehicle with an unladen mass kg and a load with a mass kg was considered. The following parameters of the vehicle were assumed: radius of the wheel m, leverage transmission connecting wheels with motor shafts , movement resistance was described using the formula where is the moment of forces defining the moment of resistances of the pump-motor movement. It was assumed that Nm.
Function describing the electromotive force of the battery has the following form: if V, kF (see Figure 4), and the internal resistance of the battery is Ω. It was assumed that in a fully charged state, the electric charge amounts to Ah and the energy of the fully charged battery equals kWh. The values of the motor parameters are as follows: mH, Ω, Nm/A, A.
The hydrostatic drive is characterized by the following values of parameters: in the bladder of the hydro-pneumatic battery there is nitrogen; in the initial state: bar, dm3 and K, J/kgK, mass of gas amounts to kg, and the amount of energy accumulated in one battery kWh. Additionally, it was assumed that the time constant defining the process of heat exchange equals s, and ambient temperature K. The hydrostatic system is powered by two hydro-pneumatic batteries described above. The values of parameters of the pump-motor and of the hydraulic installation, given in the Formulae (7) and (8) amount to: l/obr, bar, bar.
The settings of the PID speed controller are defined by the coefficients , s, s, and for the PI current controller the settings amount to , s.
Considered simulations referred to the passage on the route of 2860 m lasting 390 s at a given speed , the course of which is illustrated by the graph in Figure 6. The average speed of the trip is 26.3 km/h.
As mentioned before, signal , defining the role of particular drives in performing driving or braking moments of the vehicle, plays a crucial role in controlling the hybrid drive. Based on initial studies, the following values of constants from the Formula (28) were assumed: —when the vehicle is accelerated, —when the vehicle is slowed down, —when the vehicle moves at a constant speed.
Apart from the vehicle with a hybrid drive, a model of an electric vehicle was also considered. It was assumed that both vehicles had the same electric drives, and the mass of the electric vehicle was lower by 100 kg. The obtained simulation results were performed in terms of the influence of the hydrostatic support on the effectiveness of the energy conversion, and the amount of energy collected from the electric battery until the passage finished was assumed as the ratio of this effectiveness.
2.7. Results of Simulation of Energy Conversion Process
Simulation of the energy conversion process in the considered drive was performed using a software for computer calculations, which was devised based on the presented description of the problem of dynamics and control (20).
A passage on the described route of vehicles with the electro-hydrostatic drive and the electric drive with the load of about 500 kg was simulated. The results of the simulation constitute the solution to the problem of dynamics and control, in the form of variable courses defining the energy conversion process and the control signals.
Due to the relatively broad scope of simulation results, the chosen results, referring to the transport of the load of 500 kg, are given.
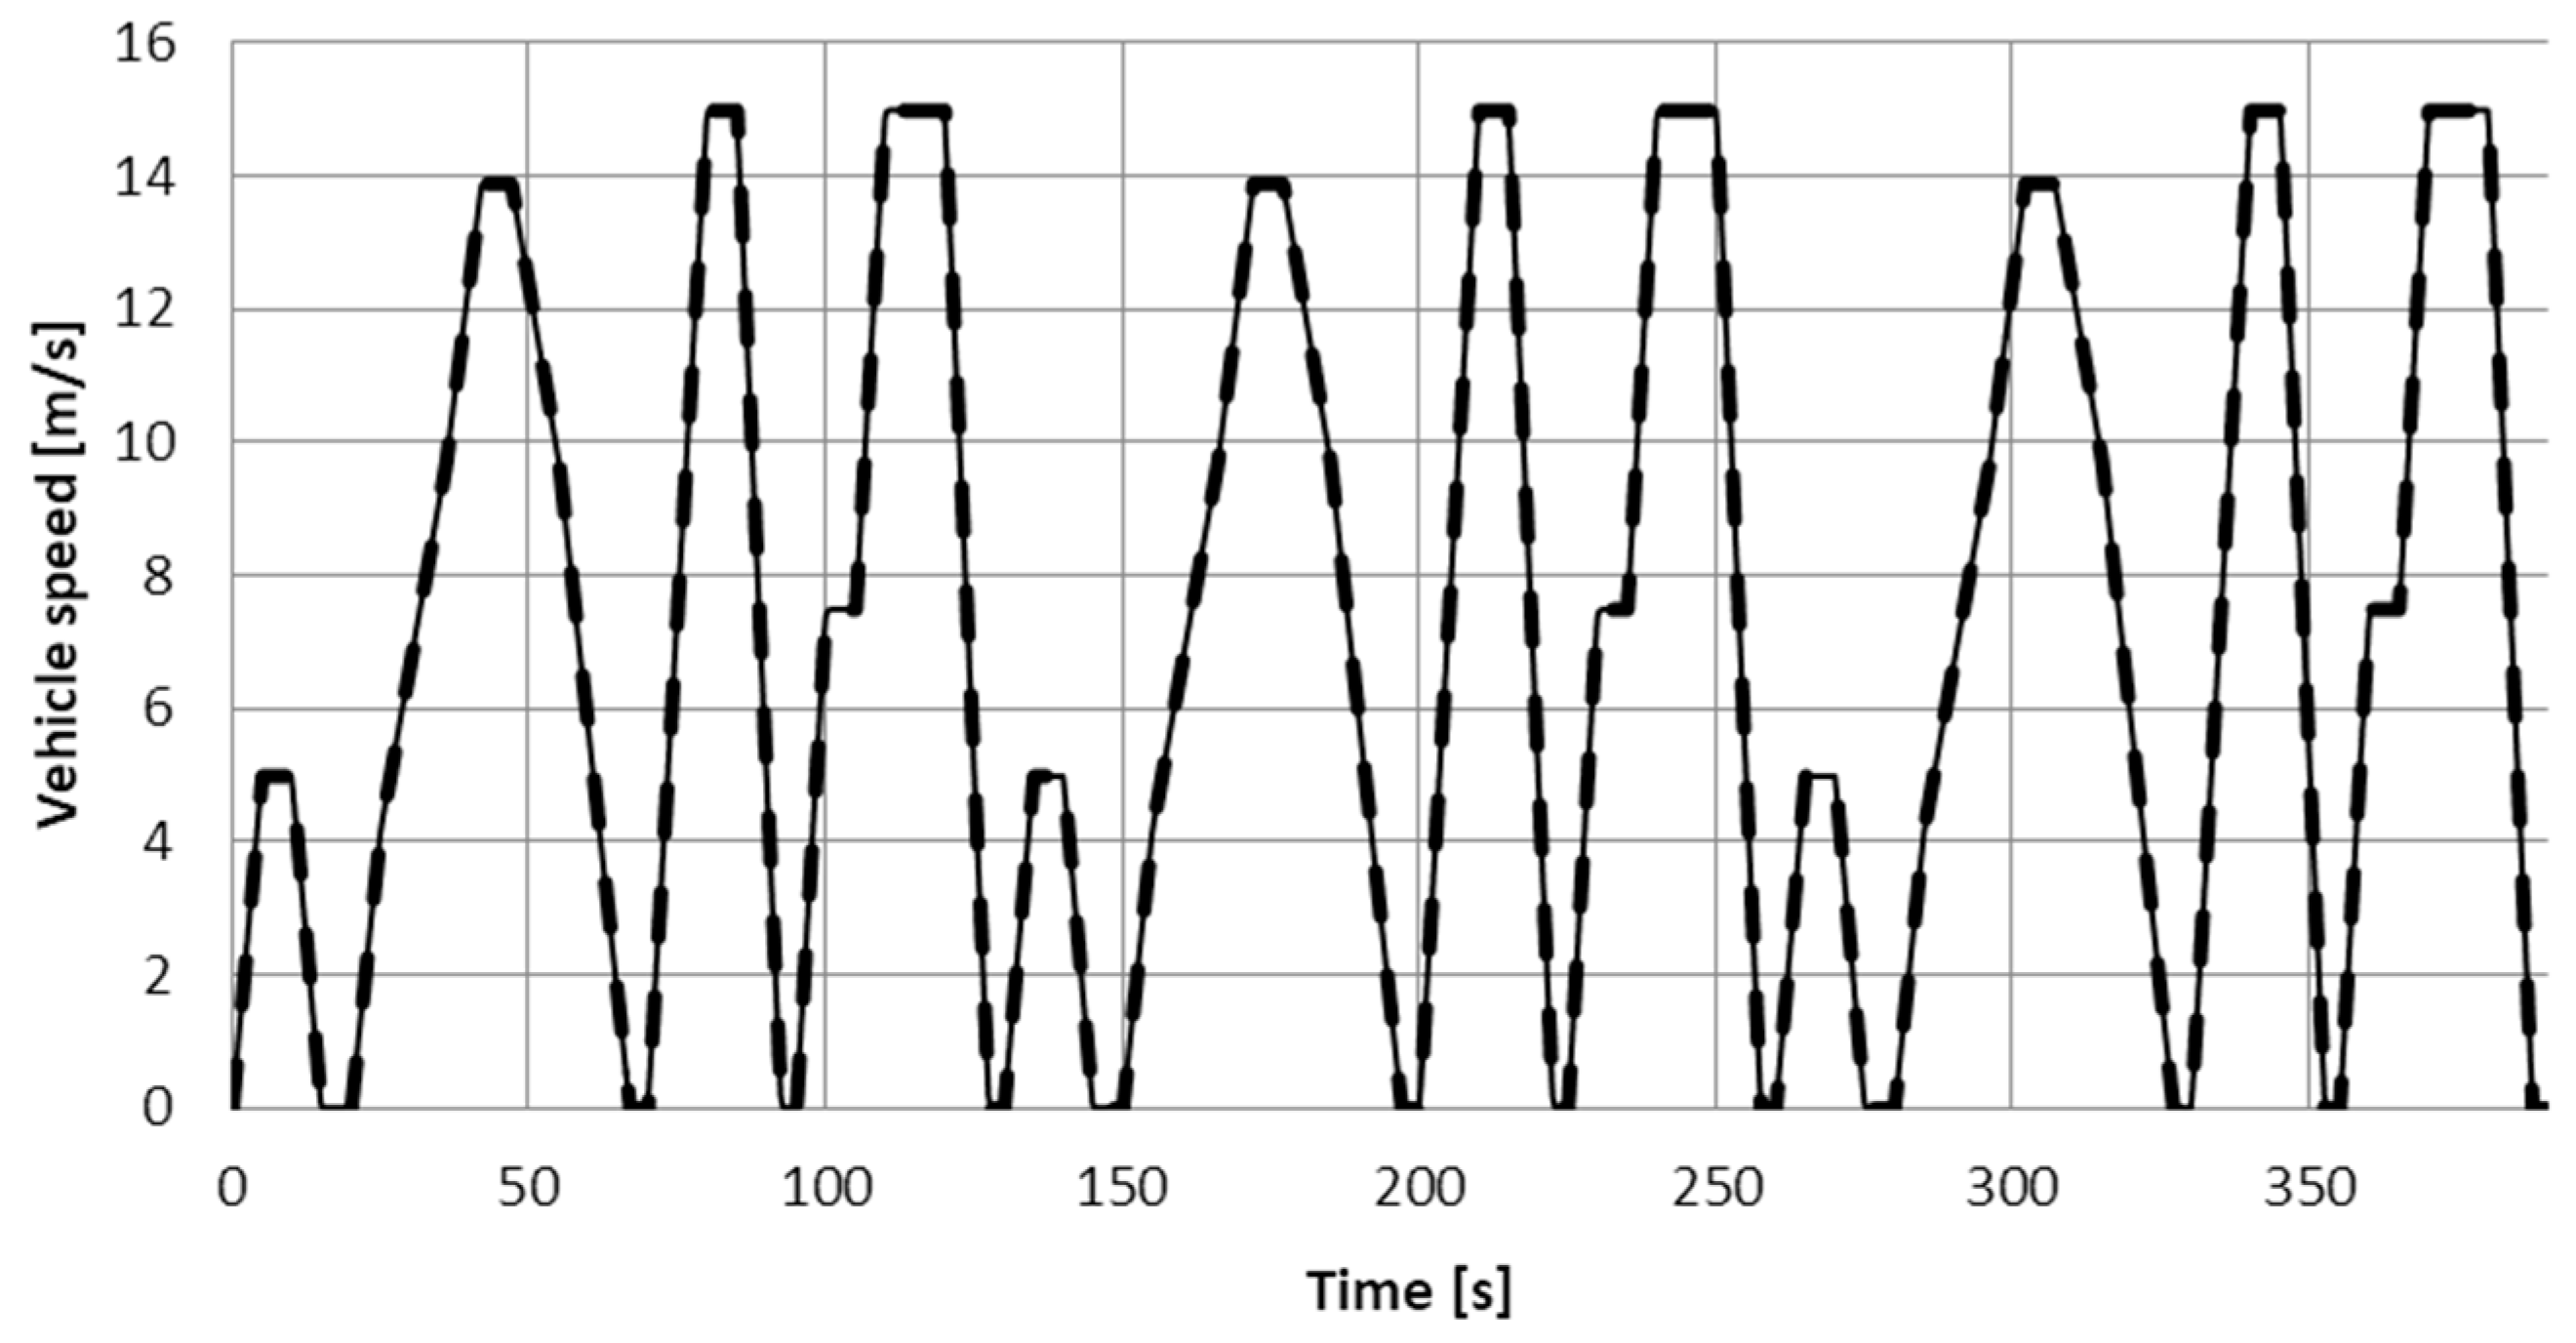
Initially, in Figure 7, two graphs illustrating the vehicle speed error are shown (Equation (21)). The graphs refer to the hybrid drive. By comparing the graphs it may be concluded that a satisfactory approximation of two graphs was obtained (Equation (22)), which confirms the proper choice of control system parameters. It ought to be added that an analogous result was obtained for the vehicle equipped only with an electric drive.
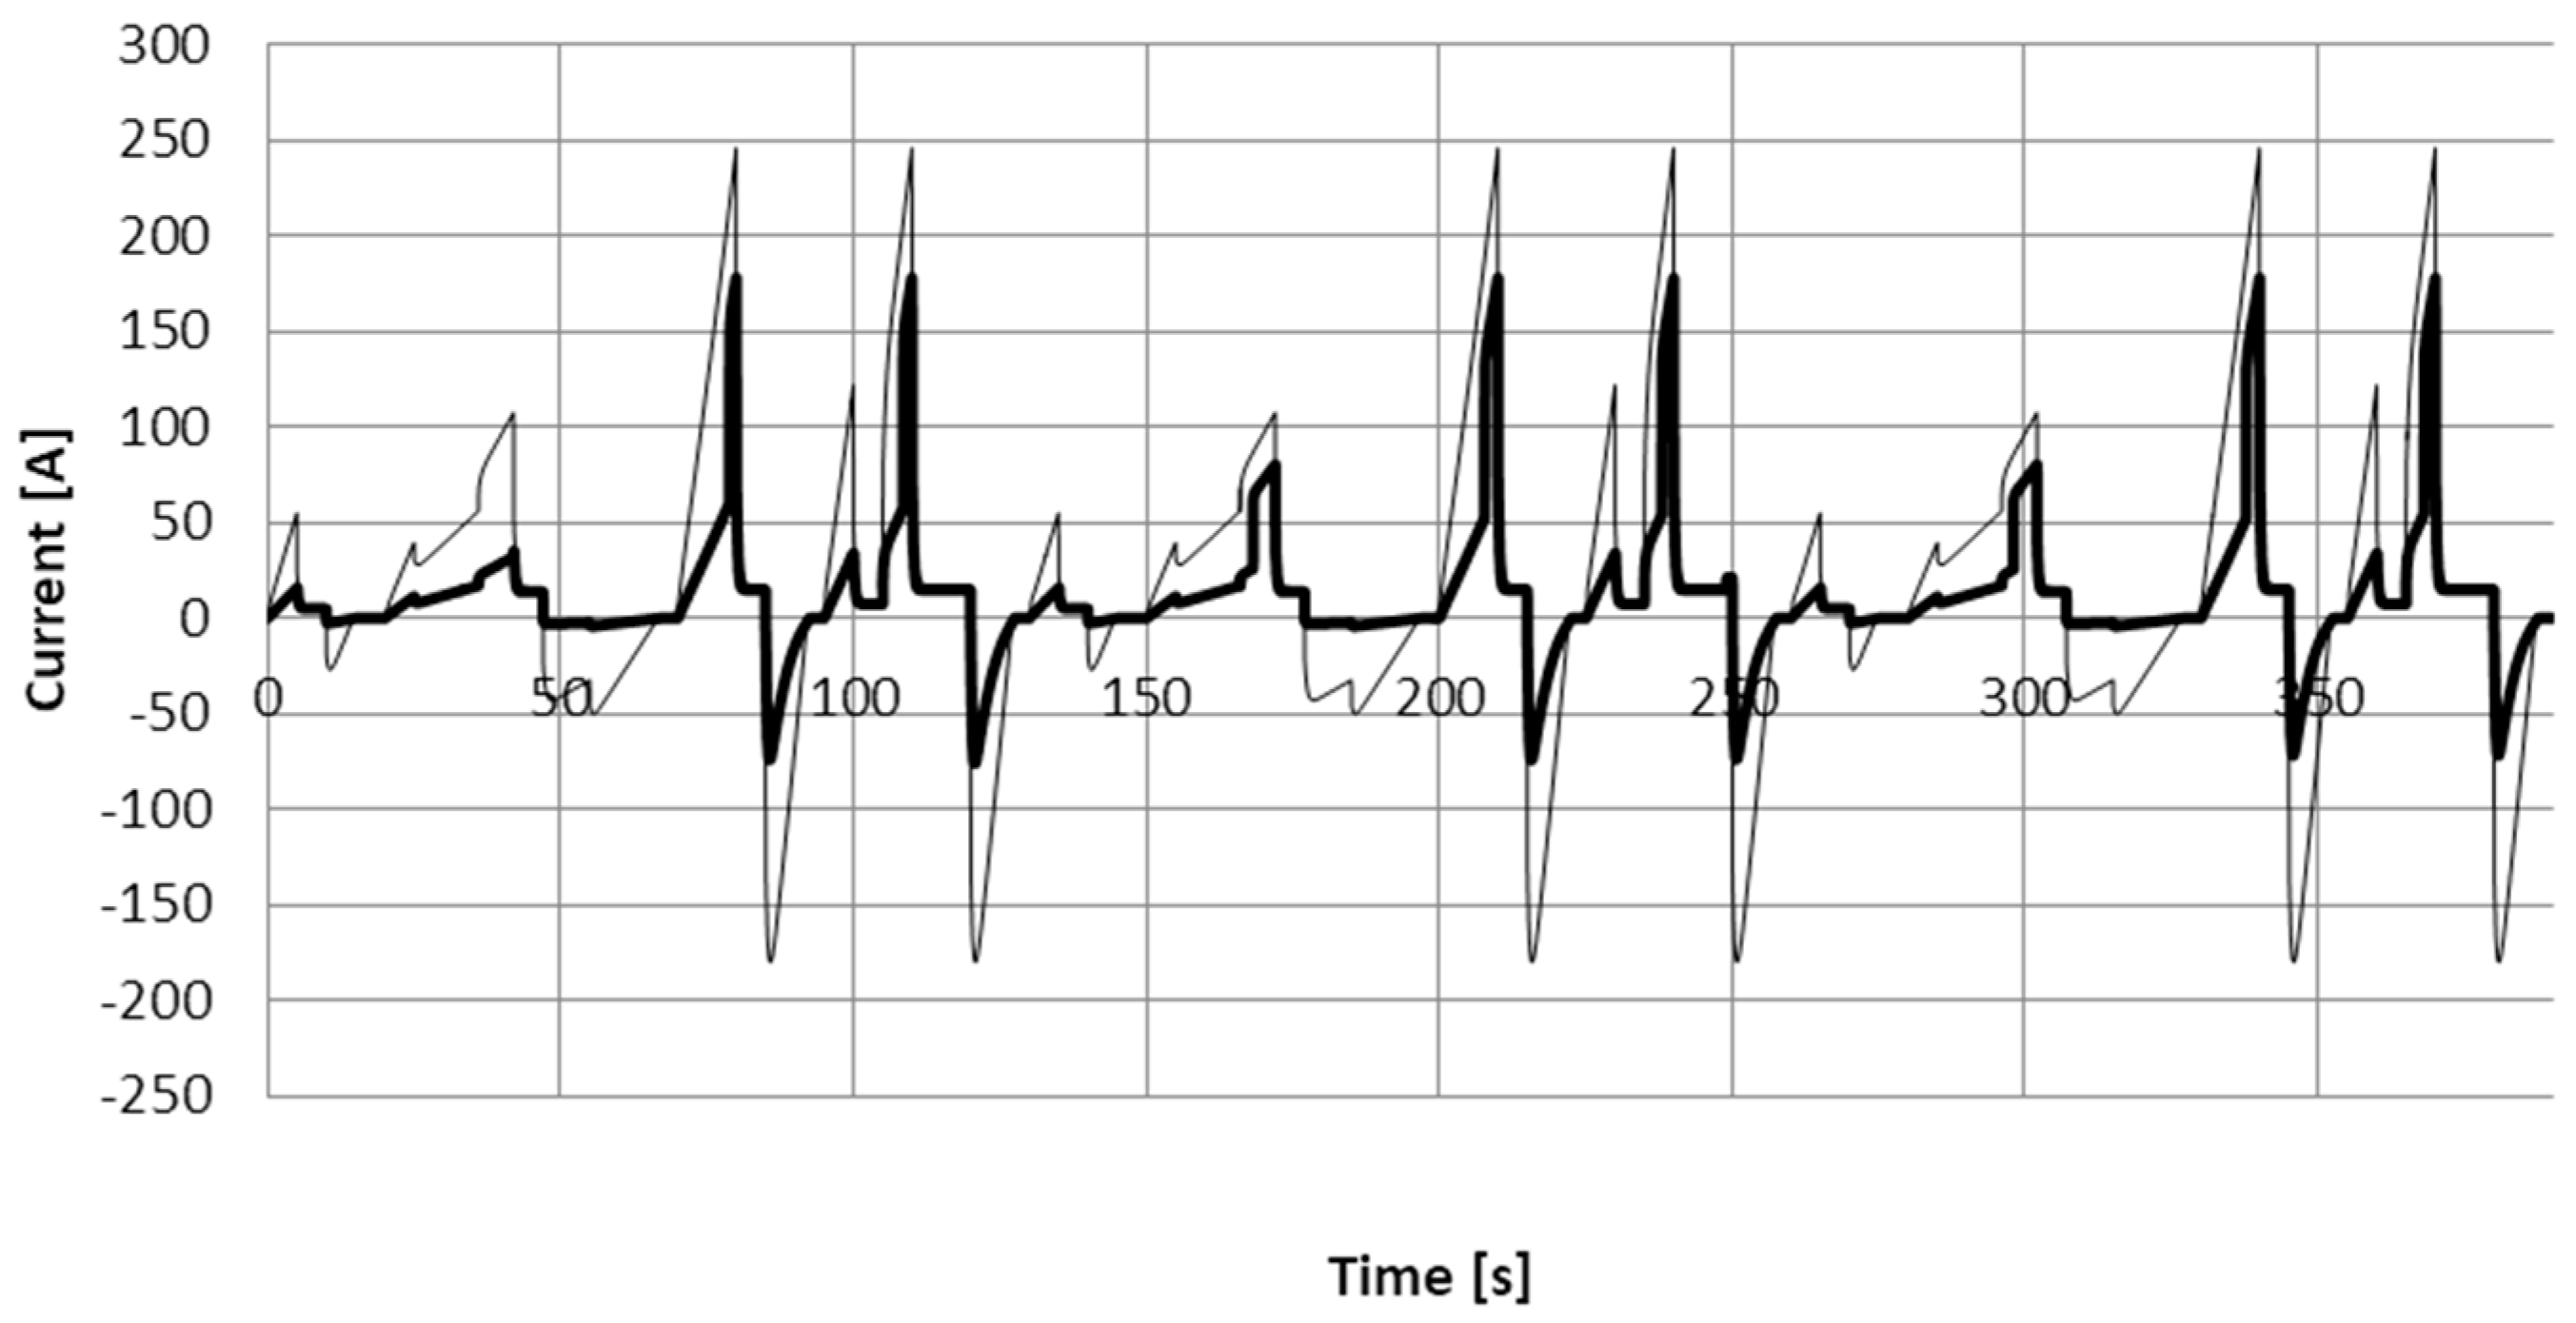
The load of the electric system in the electric drive and in hybrid drive will be illustrated by the graphs of currents flowing through the battery and through the motor . Figure 8 shows an overview of the graphs of currents flowing through the batteries of both drives, i.e., the hybrid electro-hydrostatic and electric drives. Analogous graphs, shown in Figure 9, refer to the current flowing through the electric motor.
Comparison of the presented graphs allows for the conclusion that the load of the electric system in the hybrid drive is considerably lower. In order to evaluate the load, two indices are assumed:
where and —defined according to the Formula (11), —the amount of energy collected from the electric battery during the entire passage, —effective value of intensity of current flowing through the electric motor during the entire passage.
The value of these indices in the considered passages amounted to:
- kJ and A—for the vehicle with only electric drive,
- kJ and A—for the vehicle with the hybrid electro-hydrostatic drive.
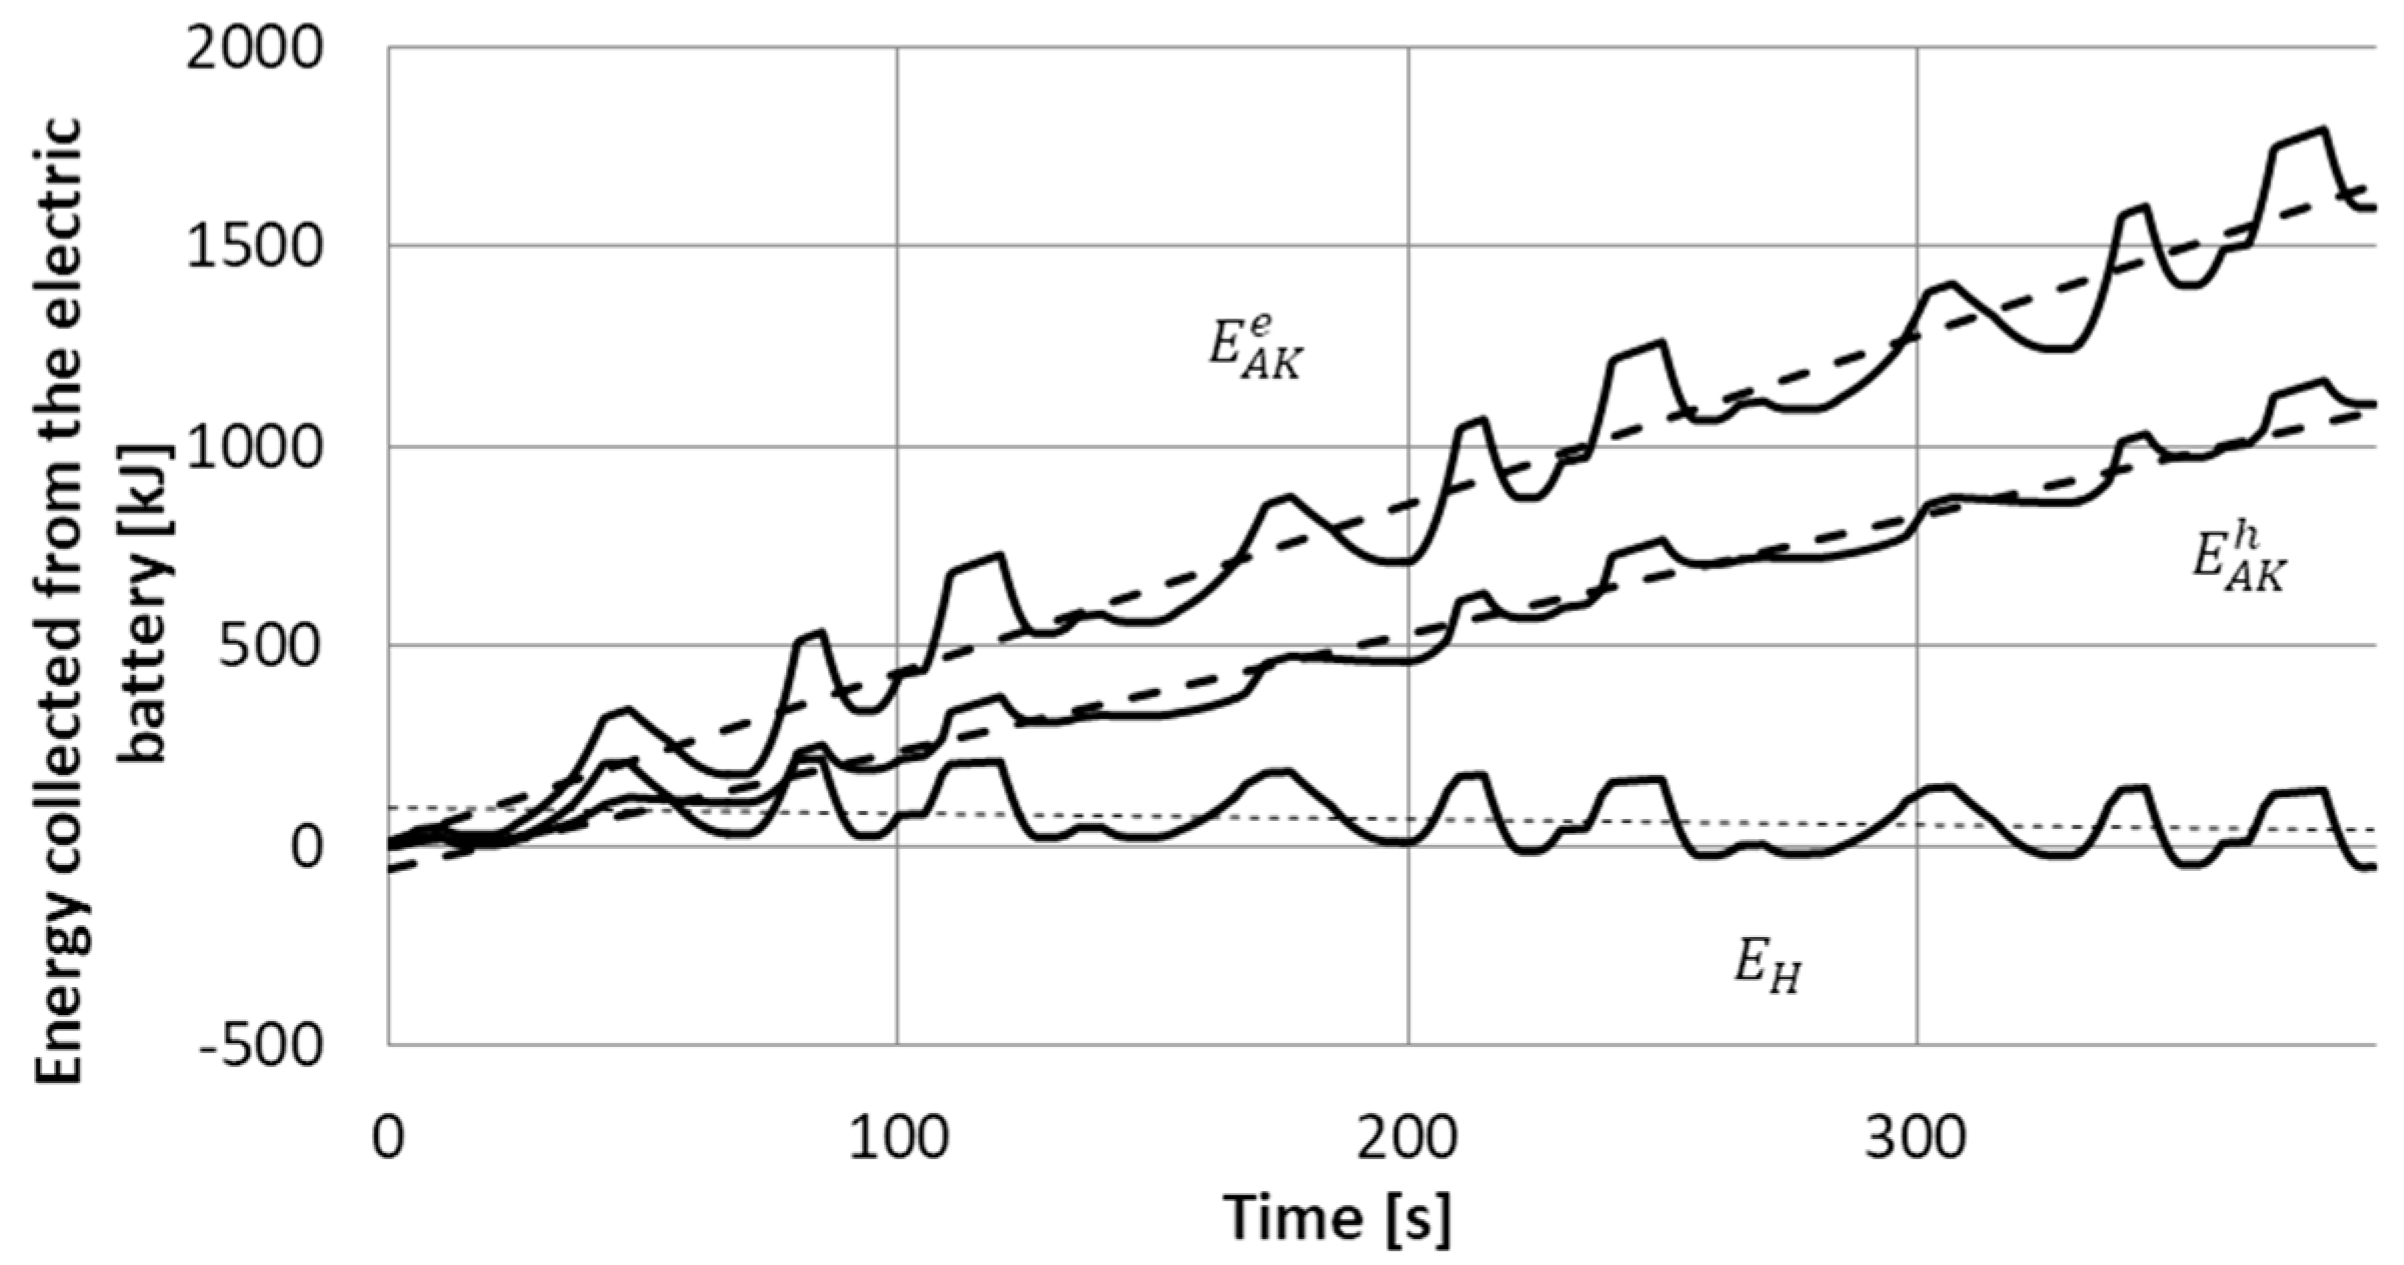
Graphs shown in Figure 10 illustrate the curves of energy collection from the electric battery in the electric drive and in hybrid drive, as well as from the hydro-pneumatic battery.
Based on these graphs an average integral power of the electric battery may be established. In the electric drive, the power amounts to 4.31 kW, and in the hybrid drive 2.68 kW which constitutes 62% of the power of the electric drive. An oscillating course of energy collection from the hydro-pneumatic battery, with the amplitude of 100 kJ is worth noting. It means, that the average amount of energy in the battery does not change.
The simulation results presented above confirm the thesis on the possibility of increasing the effectiveness of energy conversion in the electric drive due to applying the hydrostatic support.
The values of indices given above show, that in the hybrid drive the amount of energy collected from the electric battery is lower by 30%, and the values of the effective current intensity decreased by 65%.
In the course of the passage, almost entire energy collected from the batteries is dispersed by movement resistances and hydraulic resistances, as well as by electric resistance. A detailed analysis of the performed simulations enables to develop a balance of energy conversion during the passage. For example, for the passage with the load of 500 kg, the balance had the following form:
- Balance of energy for the electric drive:kJ—energy collected from the electric battery, kJ—energy dispersed by the resistances of movement of the vehicle, kJ—energy dispersed due to the internal resistance of the battery kJ—energy dispersed due to the resistance of motor winding;
- Balance of energy for the hybrid drive:kJ—energy collected from the electric battery, kJ—energy collected from the hydro-pneumatic battery, kJ—energy collected from the environment, kJ—energy supplied to the oil tank, kJ—energy dispersed due to the resistances of movement of the vehicle, kJ—energy dispersed due to the resistance of the electric system, kJ—energy dispersed in the hydraulic system.
The energy balance elements listed above indicate the difference between the amount of energy dispersed due to the resistance of the electric system in the electric drive, amounting to kJ, and the analogous energy dispersion in the hybrid drive kJ. It stems from a significant decrease in the value of current intensity in the hybrid drive, which is shown in Figure 8 and Figure 9.
A secondary effect of energy conversion process in the hybrid drive, resulting from the energy exchange between the hydro-pneumatic battery and the environment, described in Formula (6) is also worth mentioning. In the course of the considered passage, the battery collected the energy from the environment in the amount of kJ.
The presented analysis of the results of simulation of energy conversion process, confirms the assumed thesis on the possibility of increasing the effectiveness of energy conversion in the electric drive of a vehicle by means of the hydrostatic support. In the next chapter, the results of experimental studies on energy conversion in analogous drives will be given.
3. Experimental Investigation
In order to verify the thesis on the possibility of increasing the effectiveness of energy conversion in electric drive due to the application of the hydrostatic support, a laboratory station was built. The station shows a laboratory model of the considered hybrid drive. The structure of the station is analogous to the structure of the mathematical model, currently analyzed. The scheme of the structure of the station is shown in Figure 11. It consists of:
- hydrostatic drive consisting of the hydro-pneumatic battery and the pump-motor,
- electric drive consisting of the electric battery and the electric motor,
- system mapping a vehicle, consisting of the flywheel and the hydraulic pump.
The subsystems listed above are connected by electromagnetic clutches, thanks to which the flywheel may be powered in an electric or hybrid way.
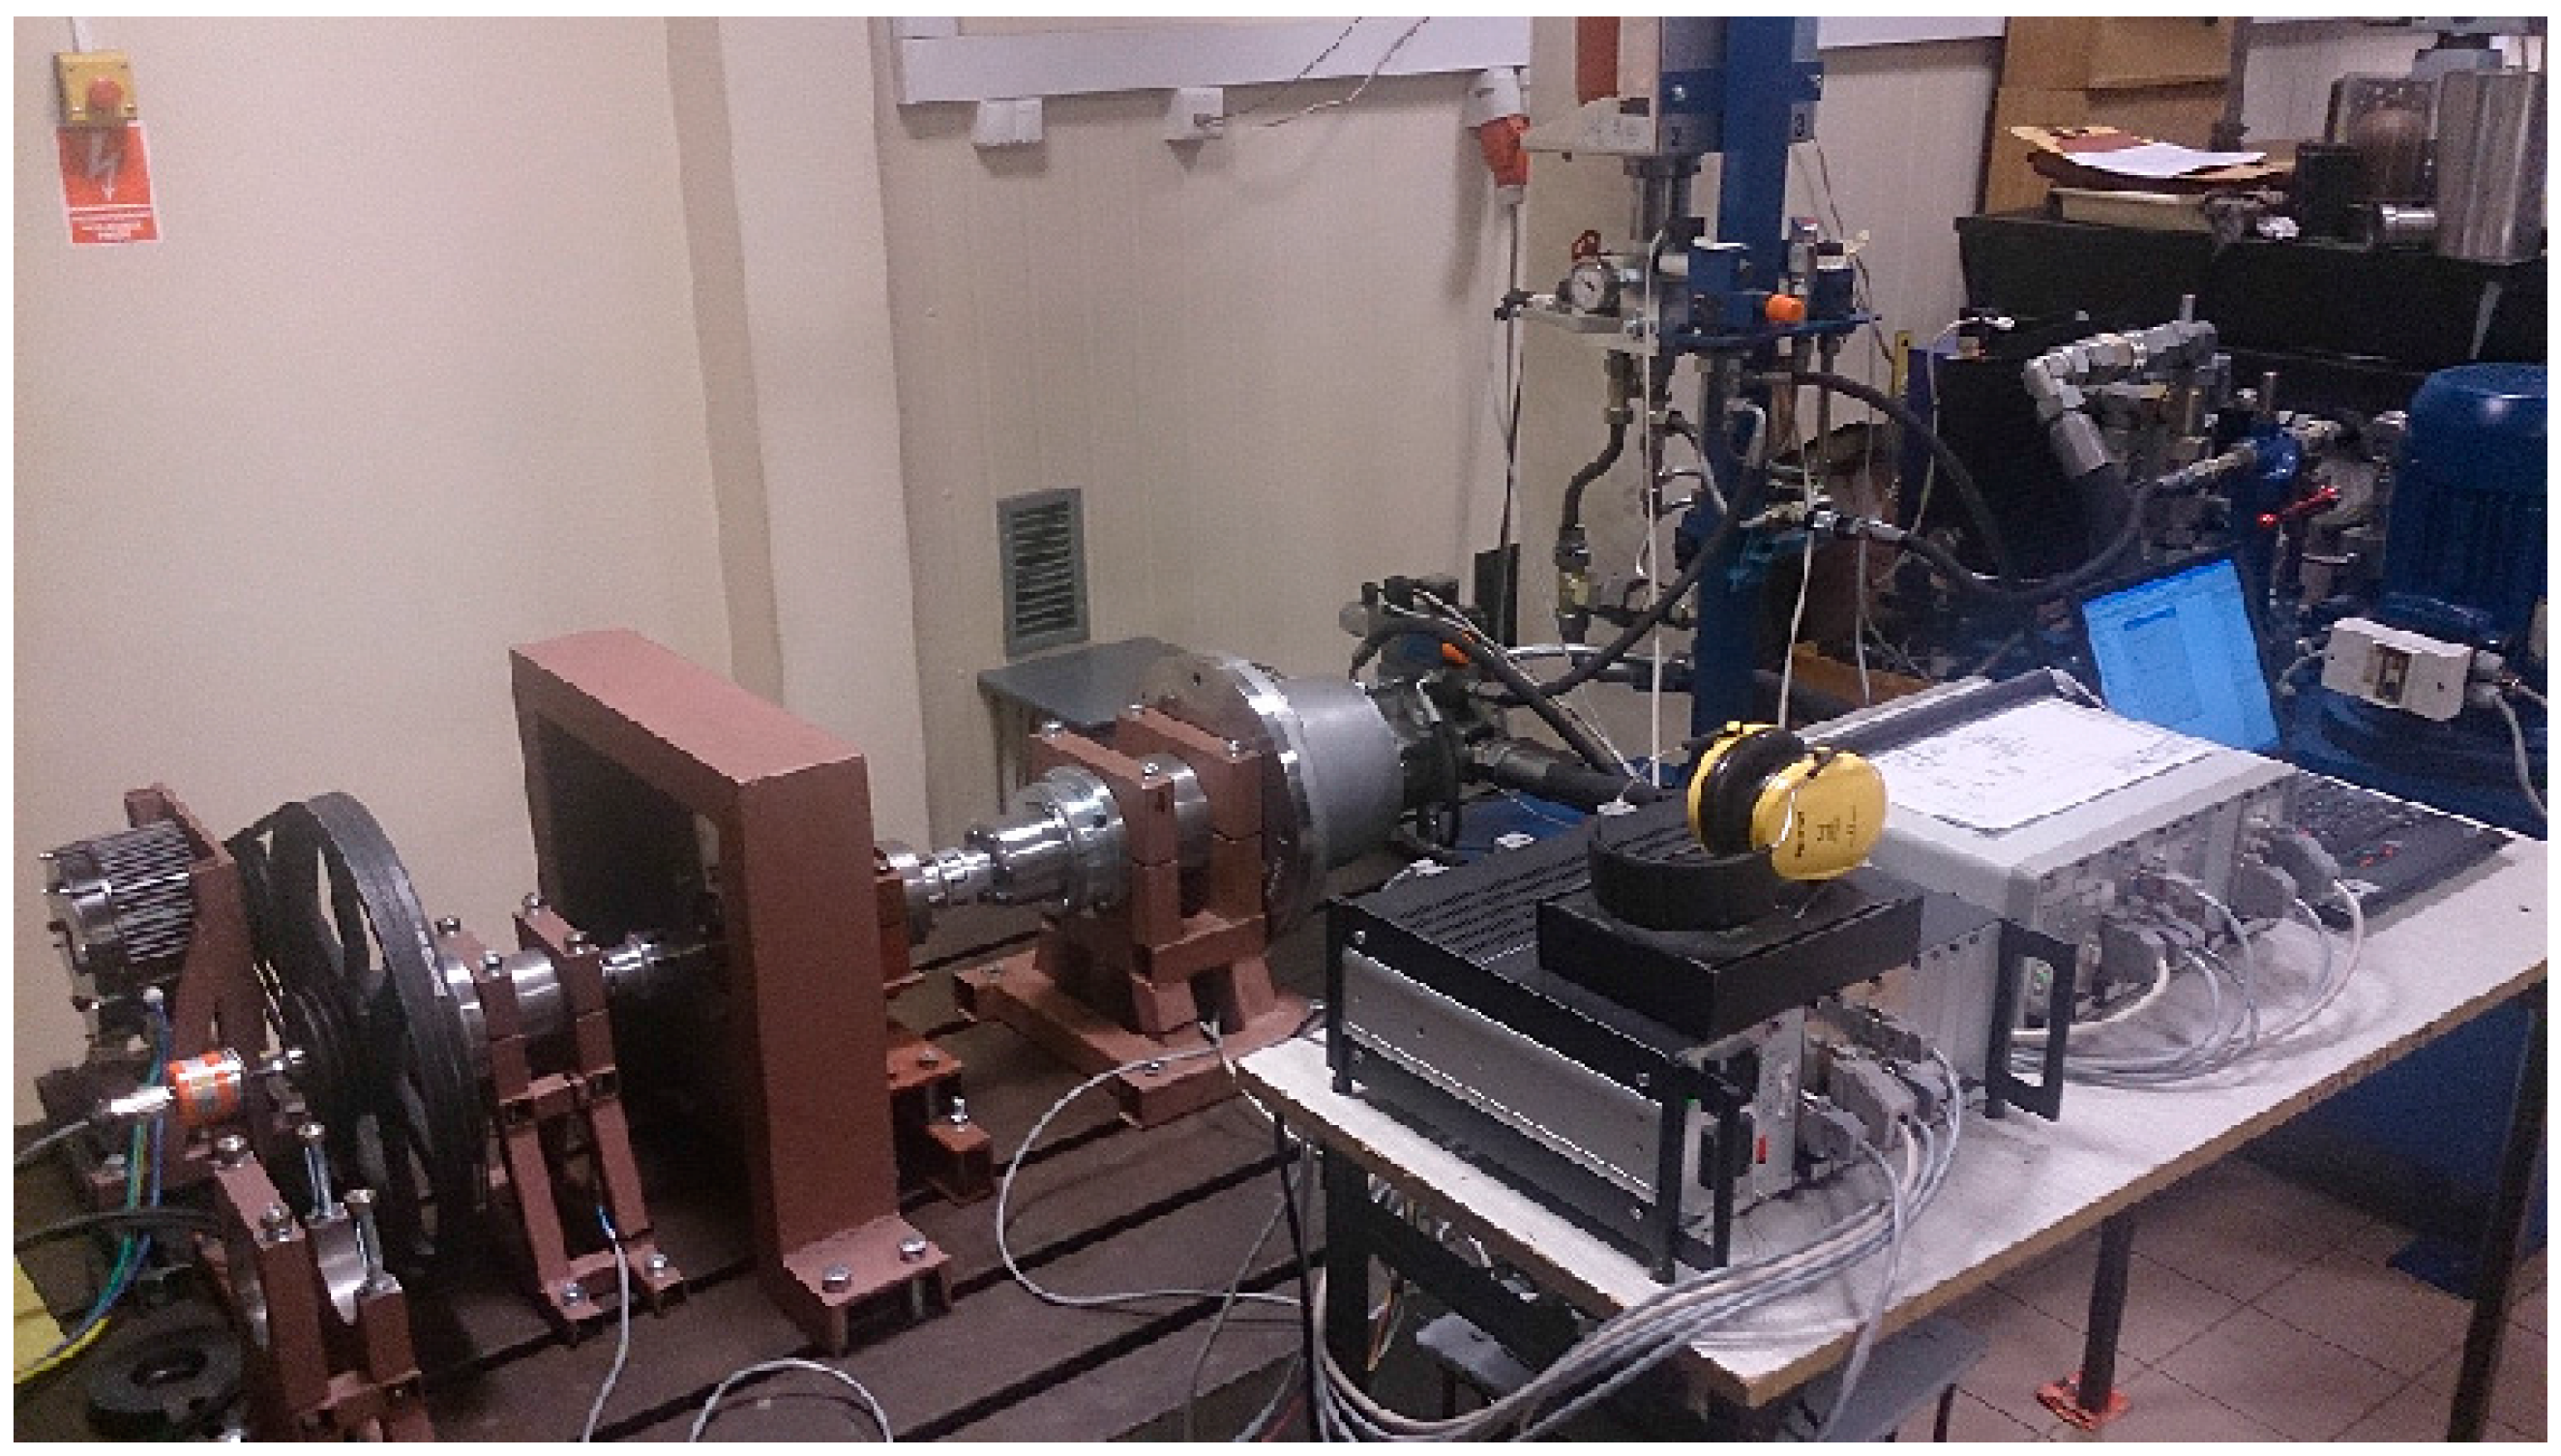
Additionally, there is a measure-control system in the station, consisting of: a control computer, data filing system, and conditioner of measurement-control signals. Figure 11 shows the scheme of the stations and sensors of the basic measurement signals, which were converted in the measure-control system into control signals . The view of the station is shown in Figure 12.
In the laboratory station, inertia of the vehicle is rendered by the flywheel placed on the shaft of the pump-motor. The resultant moment of inertia of the spinning elements of the station amounts to kg m2. With the assumed transmission ratio between the pump-motor and the wheels of the vehicle, and the wheel radius amounting to , m, the above-mentioned moment of inertia renders the inertia of the vehicle with the mass kg. Besides, rotational speed of the flywheel 1250 rev/min corresponds to the vehicle speed of 5 m/s.
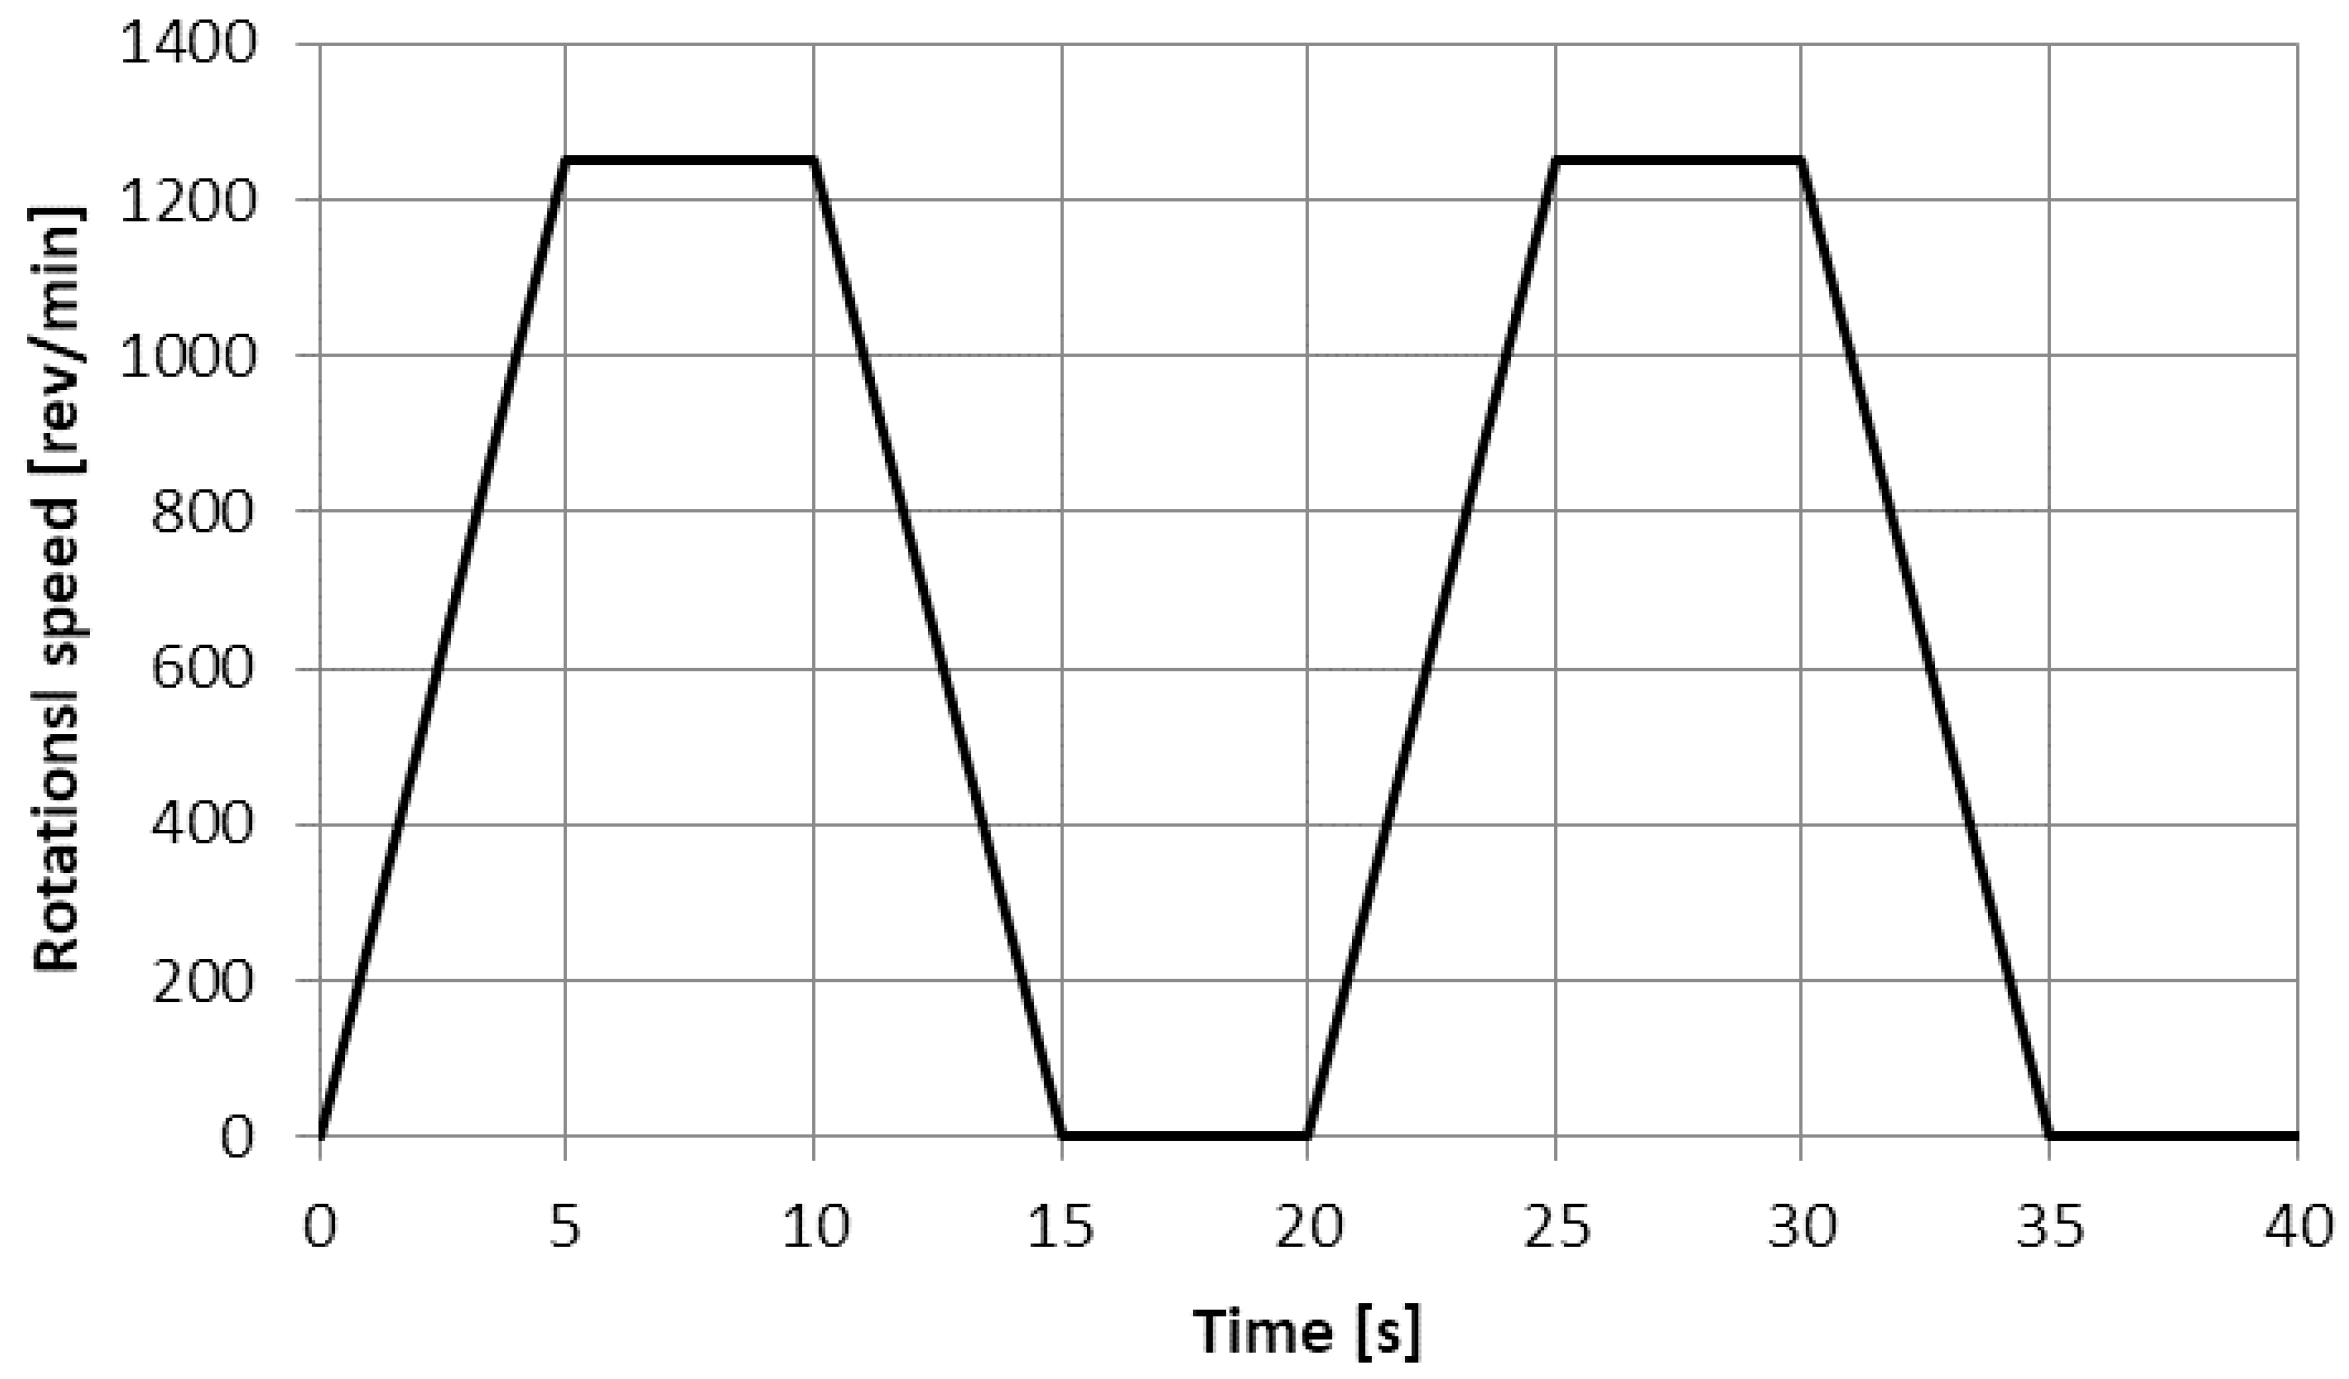
For the sake of the studies of the drive, it was assumed that the signal of the given speed of the flywheel consists of cyclically repeated courses shown in Figure 13.
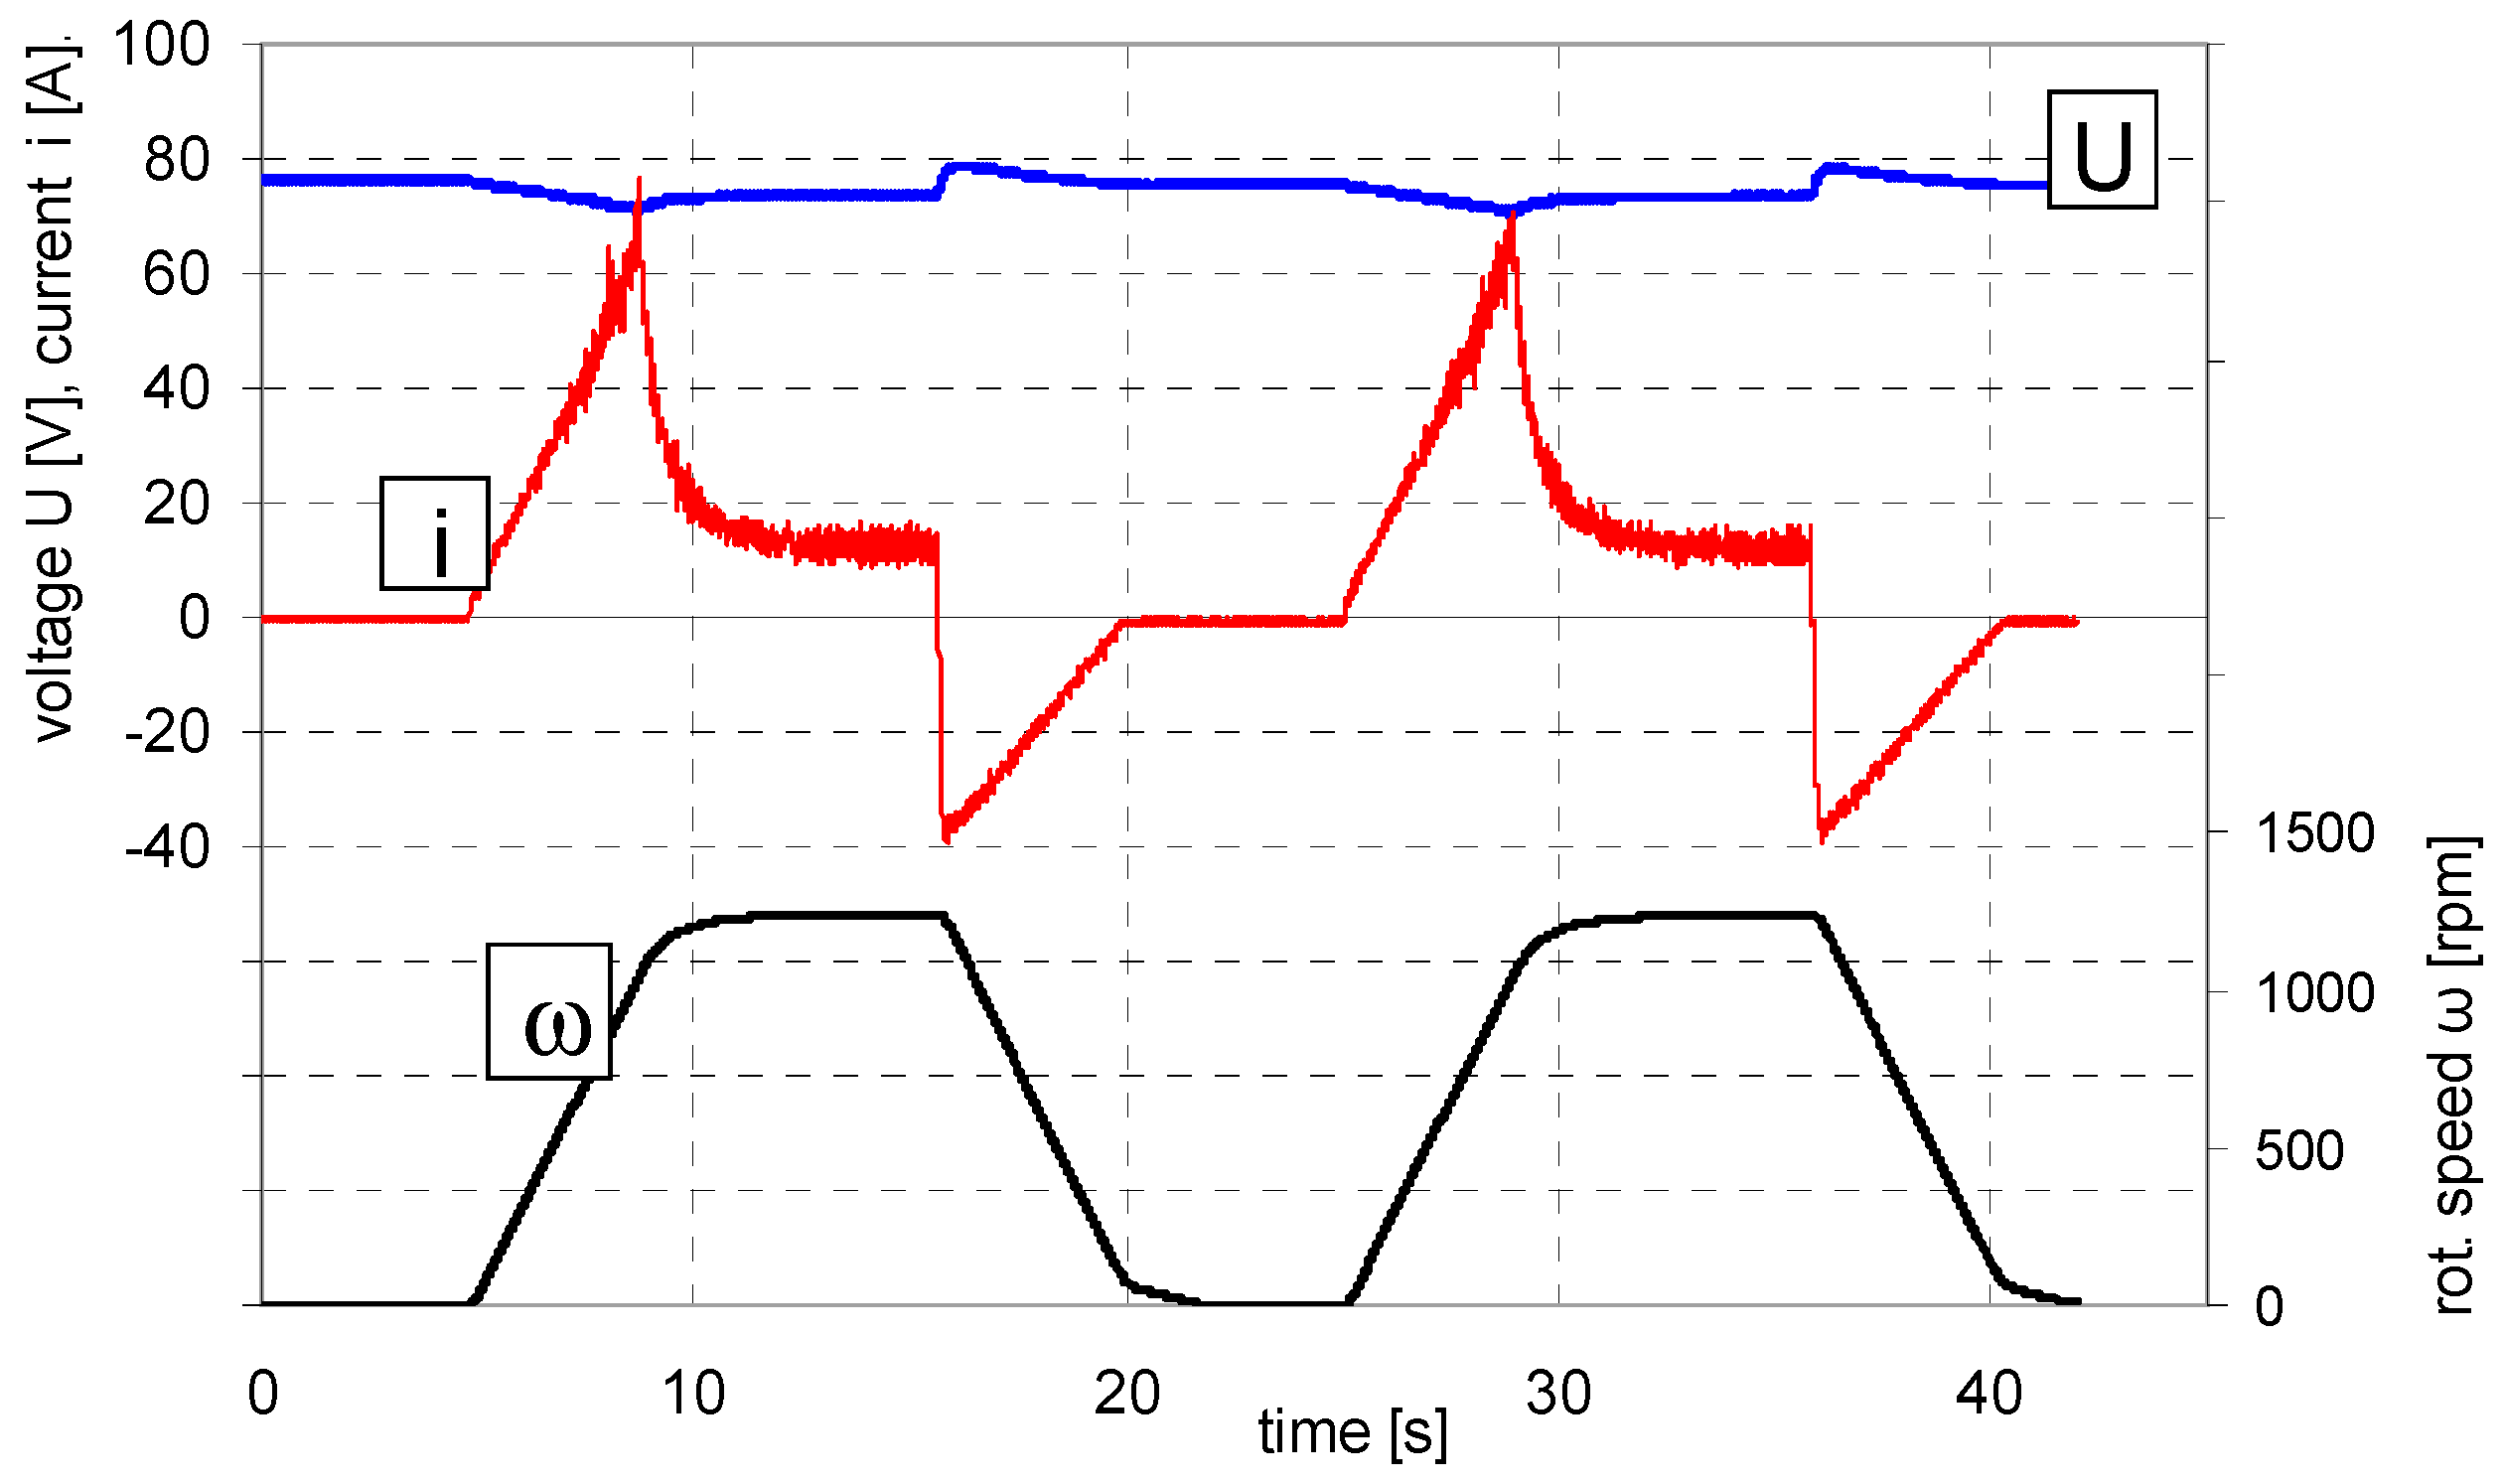
Figure 14 shows the graphs illustrating the results of measuring ; obtained in the course of electric accelerating and braking of the flywheel. At the first stage the flywheel is accelerated to the speed of and the current flowing from the battery increases to the value of about 60 A; then, when , the flywheel rotates at the constant speed and the current value drops to approximately 12 A; at the last stage, when regenerative braking of the flywheel occurs, during which the battery is charged with the current the initial value of which is about −37 A.
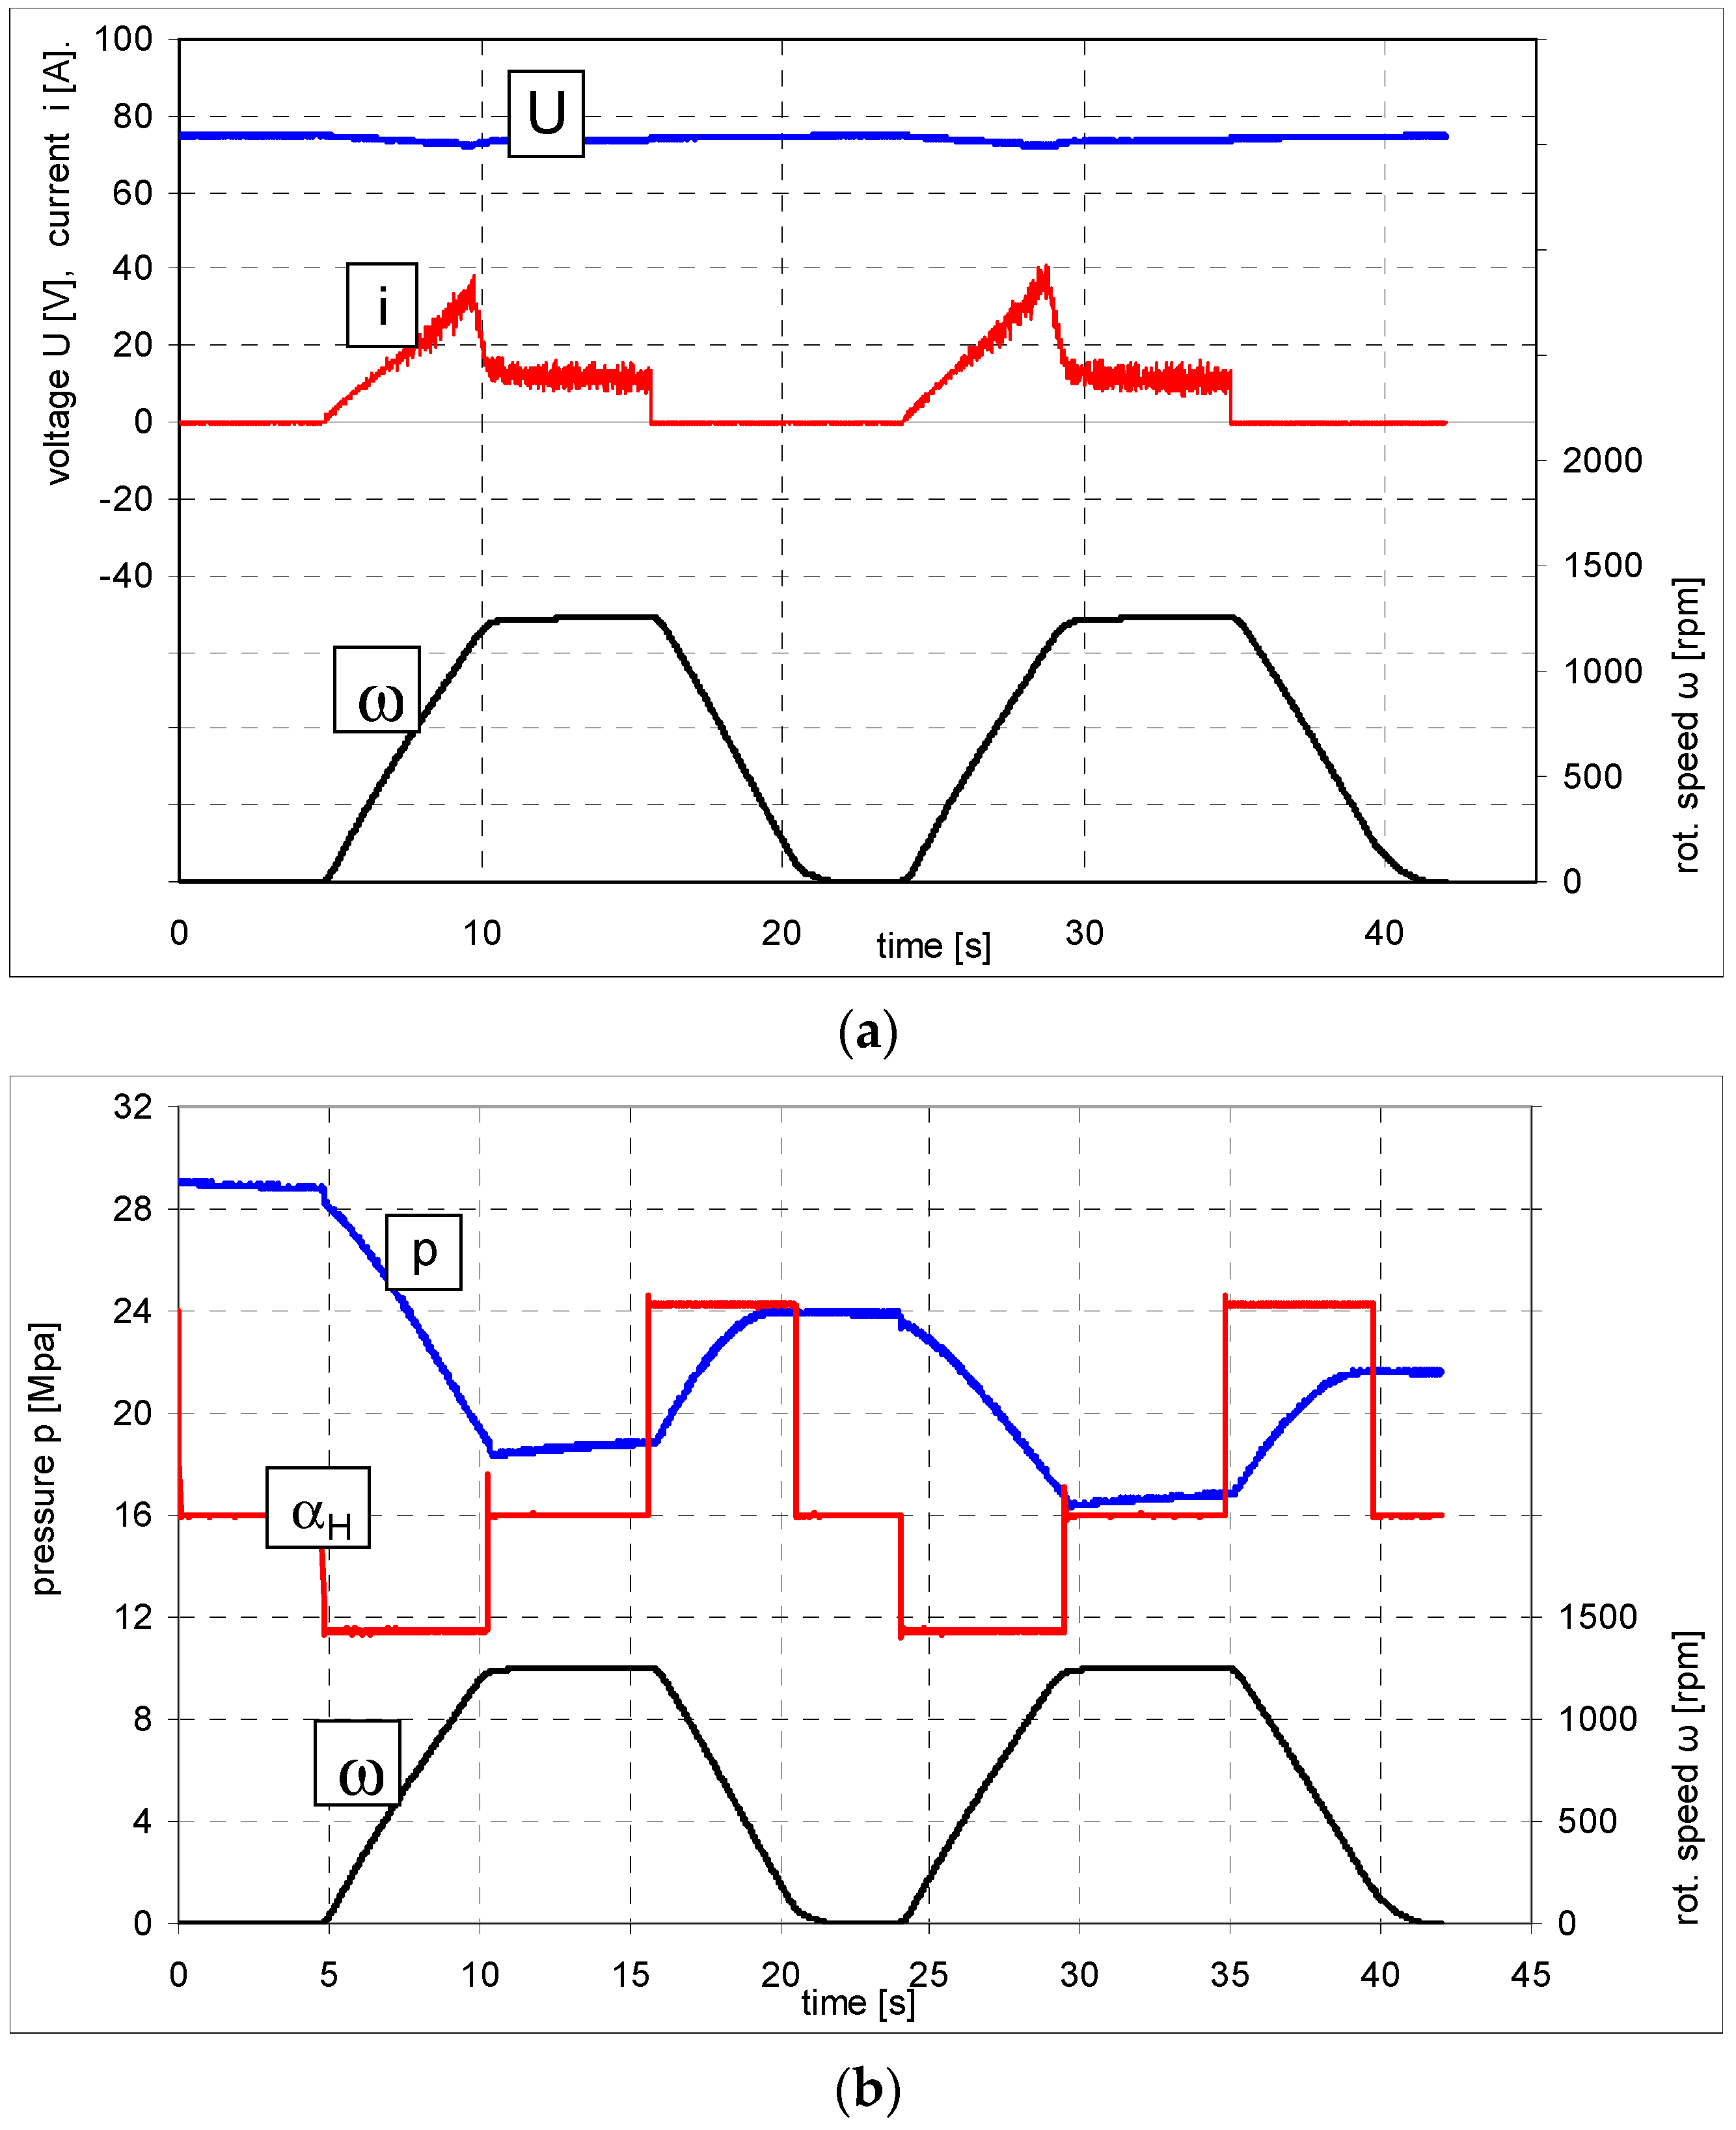
Analogous results of measurement during hybrid accelerating and braking of the flywheel are shown in Figure 15a. While accelerating ( ), which signifies that the electric drive was supported in a hydrostatic way; as a result, the highest value of the current decreased to approximately 33 A; at the second stage ( ) the flywheel is accelerated only electrically, and the value of the collected current amounts to 12 A, while braking ( ) the electric drive is disconnected, i.e., the current flowing through the battery amounts to zero (). The results of measurements shown in Figure 15b illustrate the curve of gas pressure in the hydro-pneumatic battery, and the signal controlling the operation of the pump-motor. While accelerating () energy is collected from the electric battery and hydro-pneumatic battery, and thus the gas pressure decreases from 29 MPa to 18.3 MPa; at the second stage ( ) the hydrostatic drive is disconnected , and the visible slight increase in gas pressure results from heating of the gas during isochoric process, which was mentioned in the description of simulation studies; during hydrostatic braking of the flywheel ( ) the hydro-pneumatic battery is charged, i.e., compressing gas to the value of 24 MPa. It has to be borne in mind that in the first cycle of the hydrostatic drive operation described above, the pressure of gas decreased by 29 − 24 = 5 MPa; it means that the amount of energy accumulated in the hydro-pneumatic battery also decreased. During the second cycle (cf. Figure 16) () gas pressure decreased by 2 MPa to the value of 22 MPa.
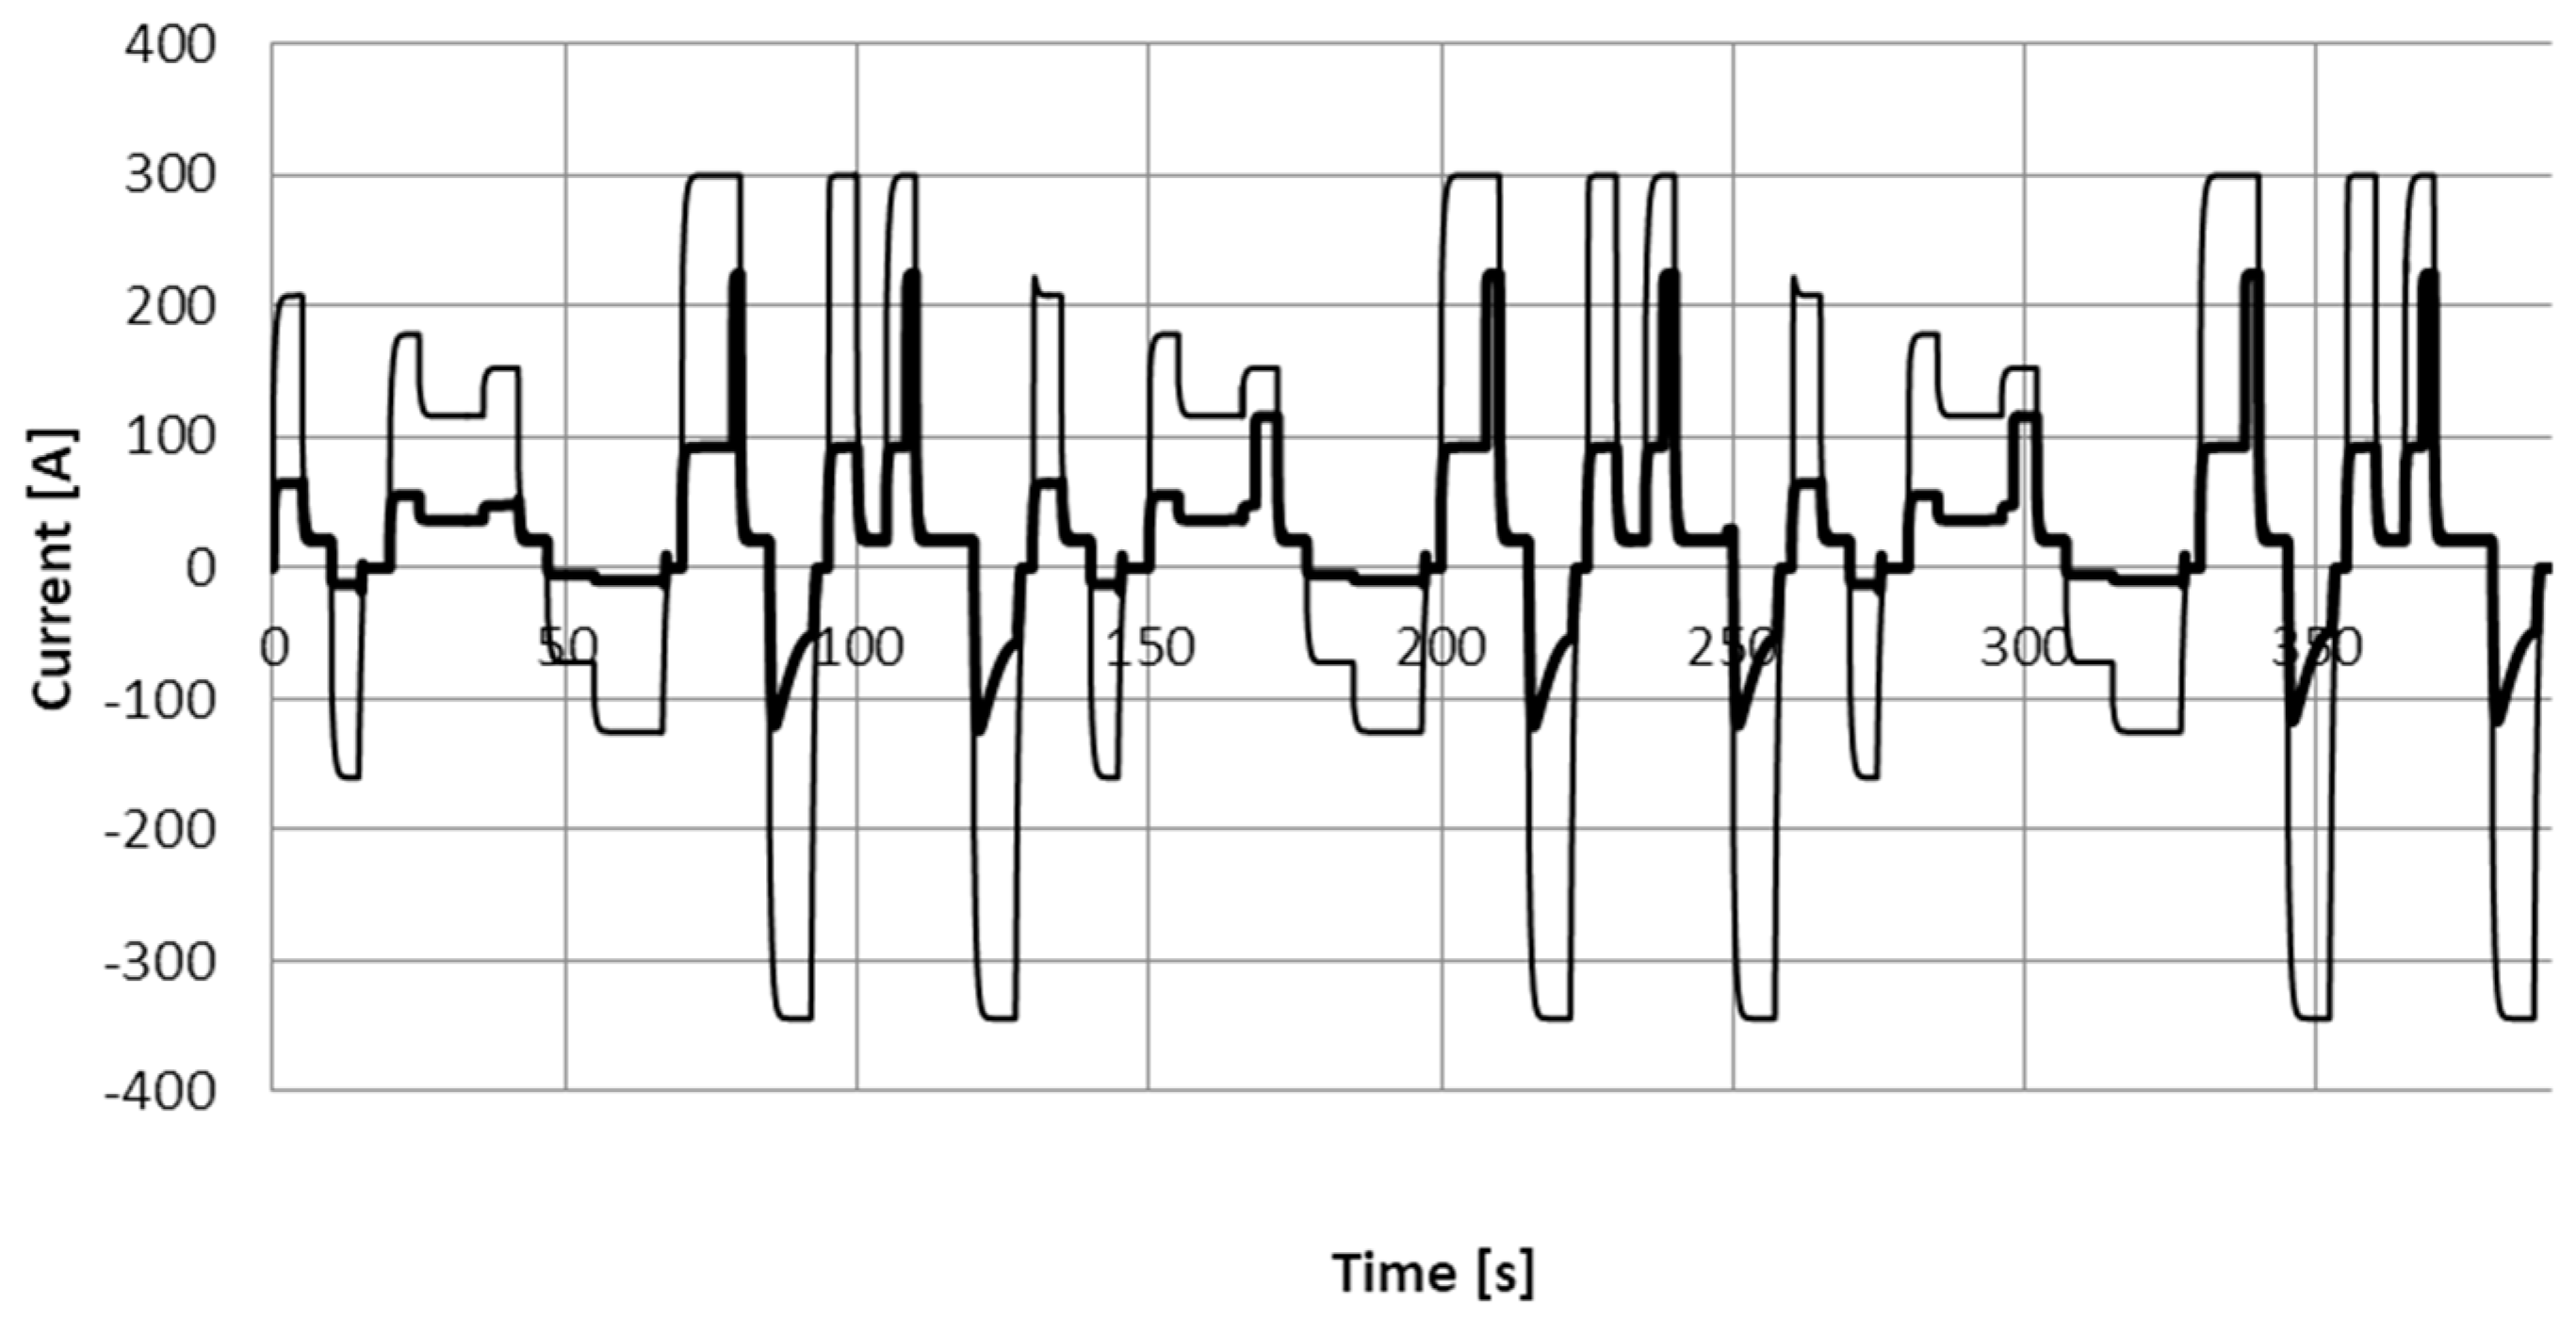
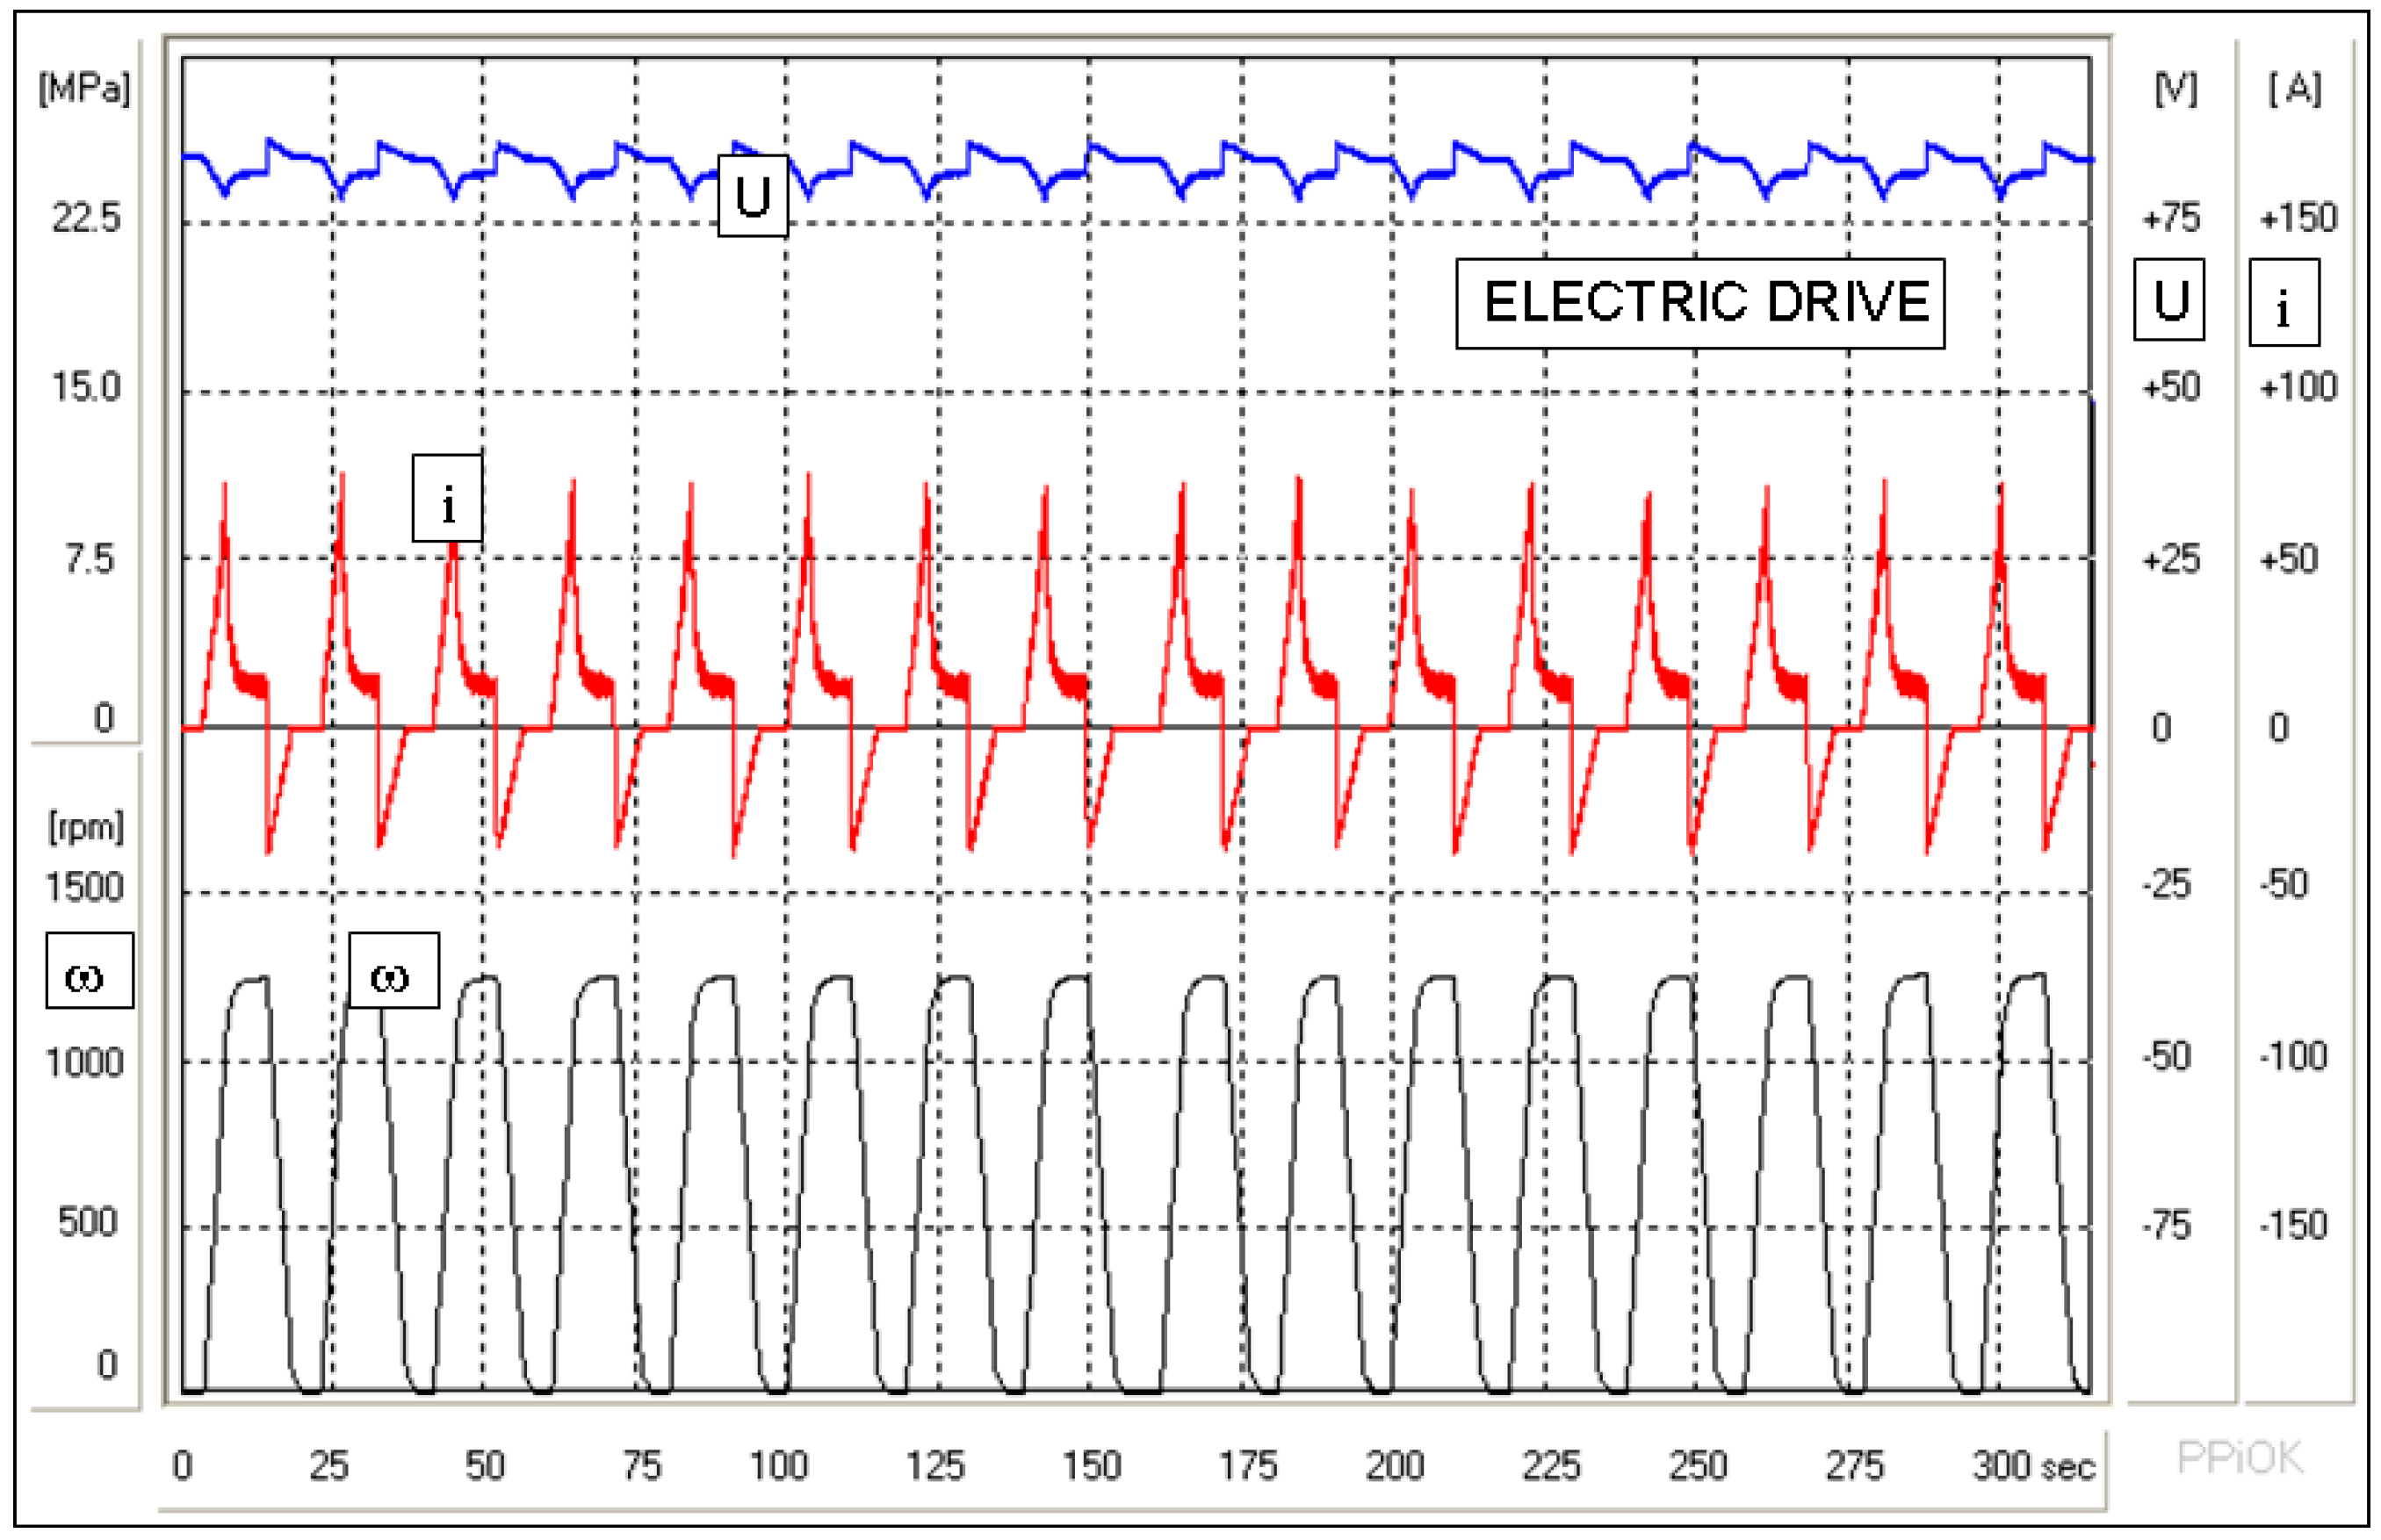
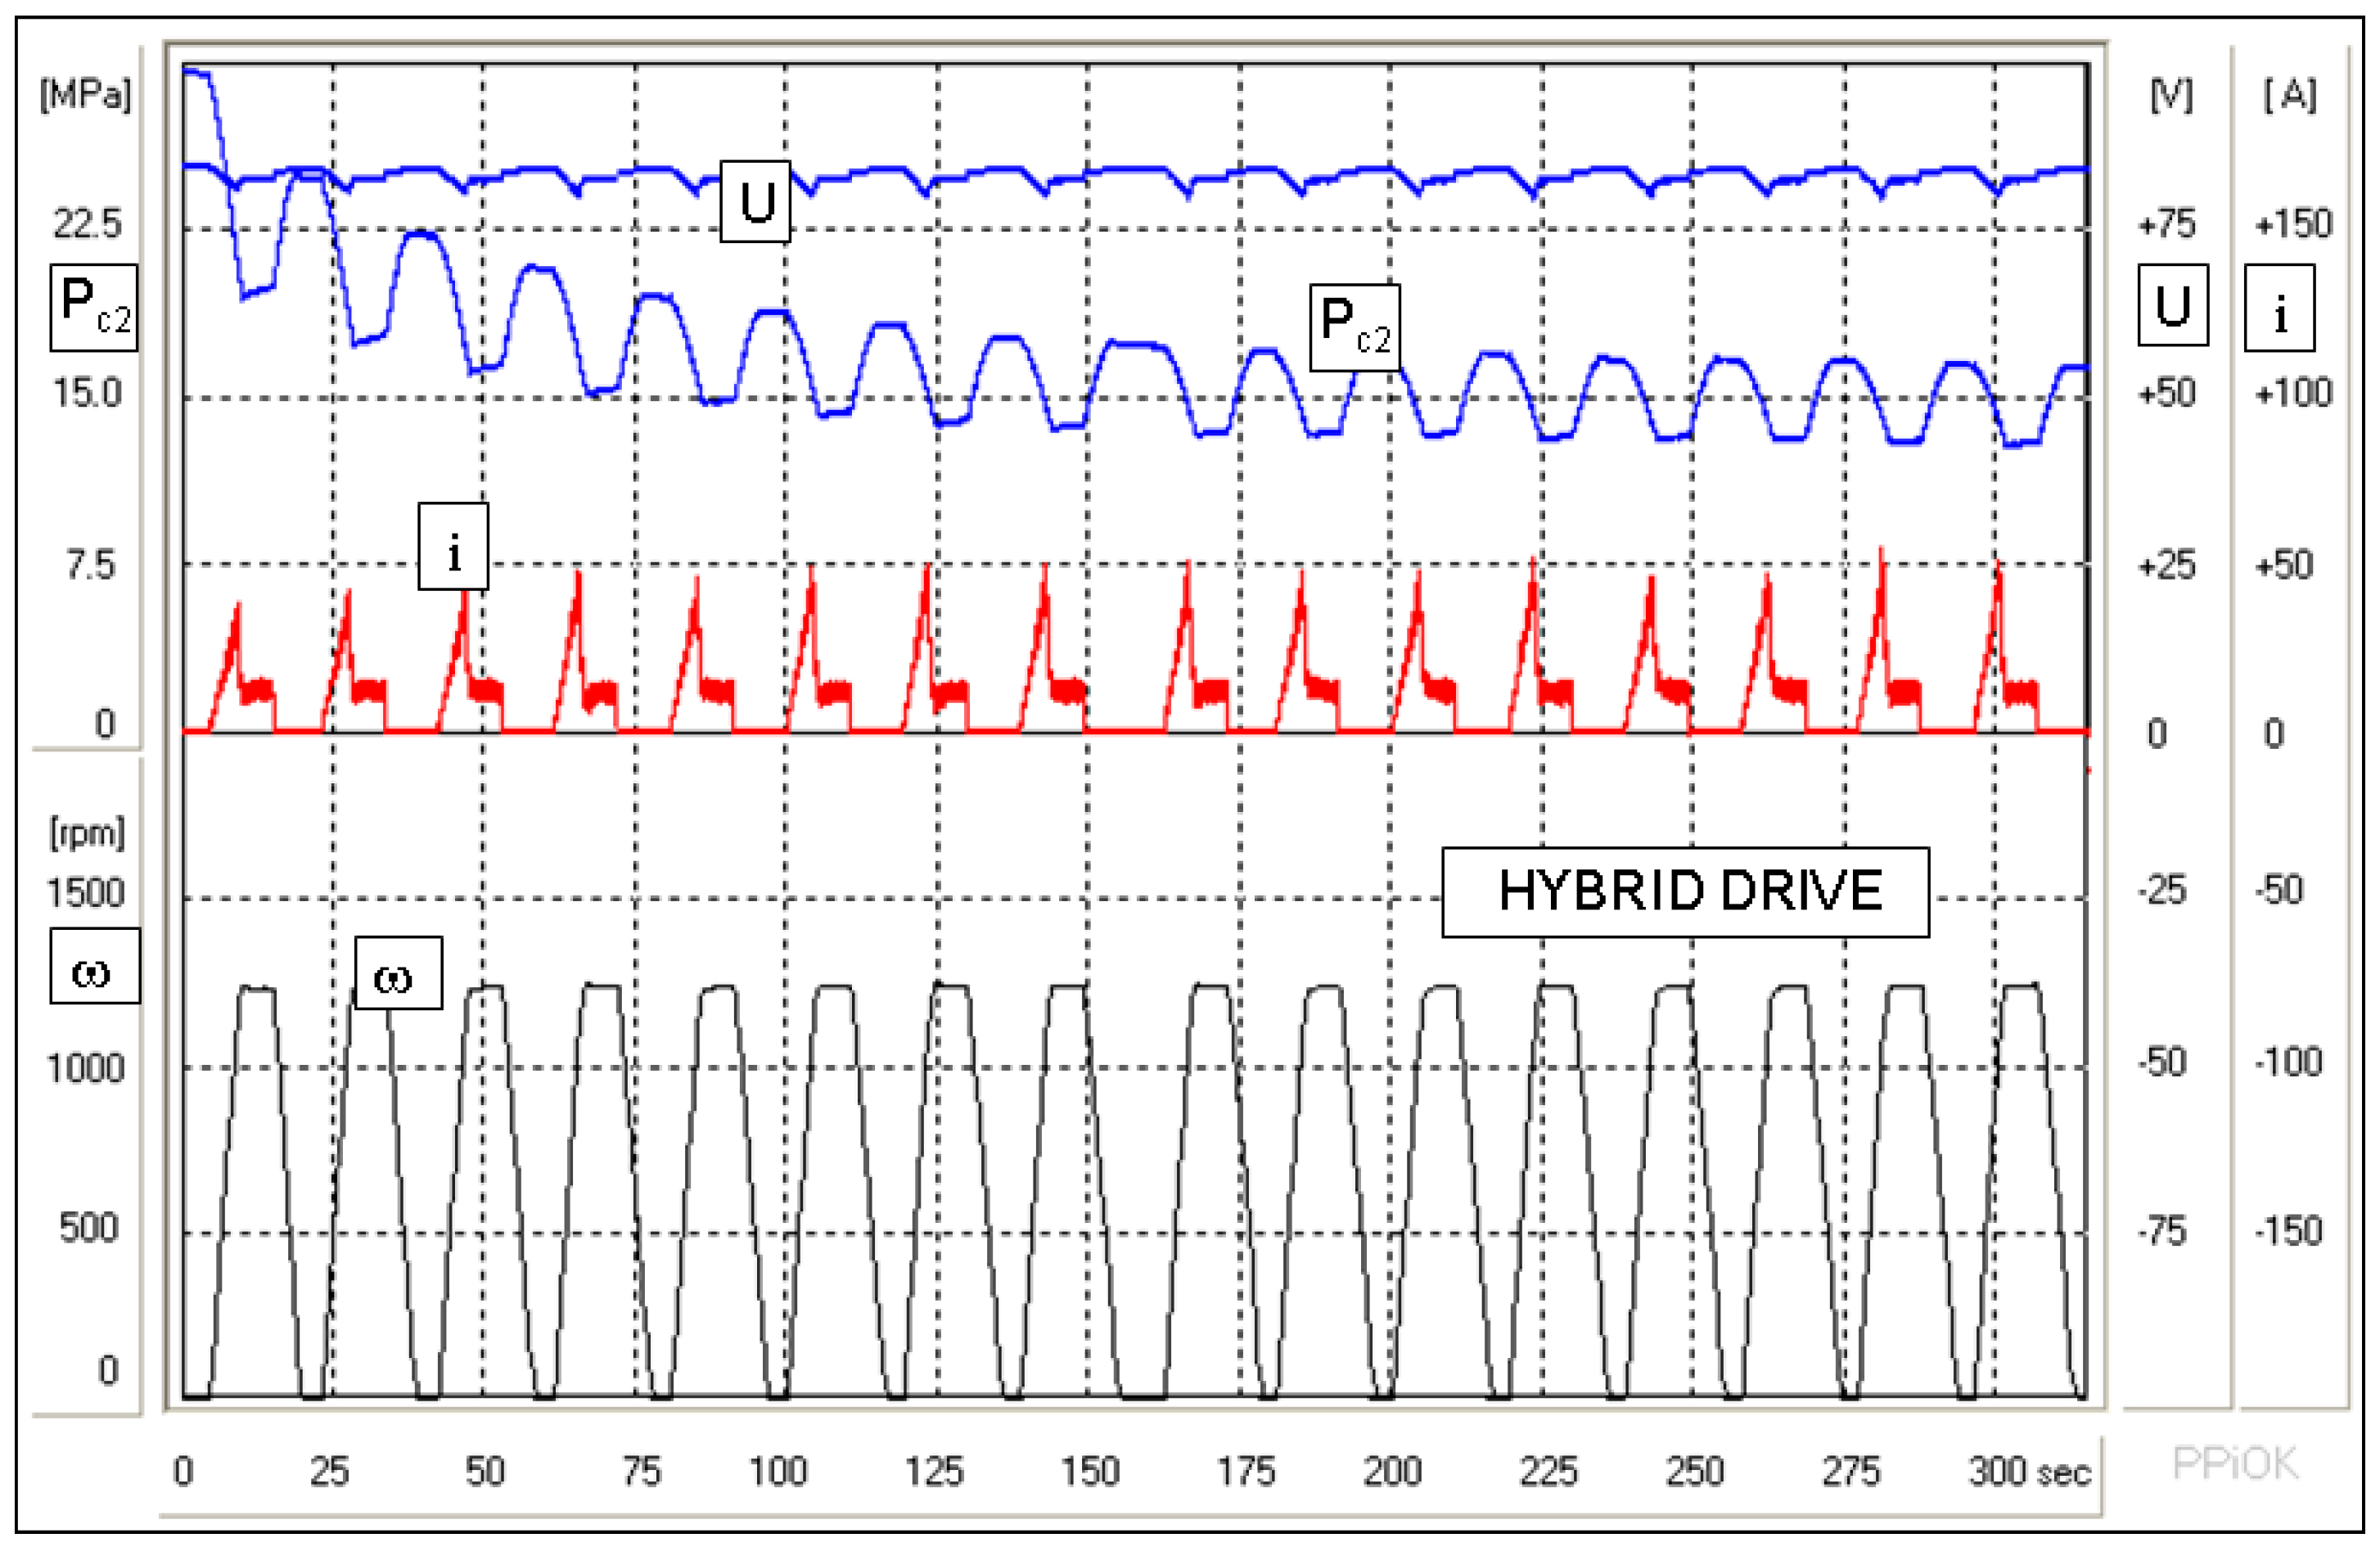
Analogous measurements, however, lasting approximately 320 s were performed for 16 cycles of the flywheel accelerating and braking. The results of measurement for the electric drive are shown in Figure 16, and for the hybrid drive—in Figure 17. The diagram of gas pressure shown in Figure 17 is worth mentioning; having performed 8 cycles () the stabilization of gas pressure occurs, which means that in the following tests the values of pressure pulsate within 13–16 MPa.
In order to compare the studied drives, the diagrams in Figure 16 and Figure 17, illustrating the currents flowing through the electric batteries in both drives, are analyzed. According to a visual evaluation of the diagrams, the values of current intensity in the hybrid drive are clearly lower than in the electric drive. To compare them, the index of battery load was calculated:
which define the electric load of the battery in one cycle; the following values were obtained:
- for the electric drive ,
- for the hybrid drive .
By comparing these values it may be concluded, that in the hybrid drive, the average value of squared current intensity is 2.5 times lower. Hence, the electric energy losses (e.g., on the electric battery, wires) in the installation of hybrid drive are significantly lower. Additionally, lowering the value of current intensity flowing through the battery contributes to its durability and reliability [17,18].
The obtained results of the experimental research require an additional word of comment. The general-utility pump-motors were used to build the hydrostatic drive system. Their properties are not quite optimal regarding their use in vehicles and minimizing losses of energy conversion. For example, in work [19], the shown comparison indicates that employing the dedicated Digital Displacement Pump-Motors allows for, compared to traditional hydraulic pump-motors, additional increase in the efficiency of the hydraulic drive at low speeds, which is significant during vehicle braking and when it starts to move. The expectations are that applying these kinds of units could account for even greater than shown effects of the hydrostatic support.
4. Conclusions
The results of theoretical and experimental studies confirmed the assumed thesis on the possibility of increasing the effectiveness of energy conversion in the electric drive of the vehicle by using hydrostatic support. The hydrostatic support consists in alternating processes of charging and discharging the hydro-pneumatic battery, occurring during the cyclic load of the drive of the vehicle, resulting from the conditions of the city traffic.
The increased effectiveness of conversion means that the amount of energy collected from the electric battery is smaller and so are the energy losses connected with collecting energy for accelerating and returning the energy during regenerative braking.
The above-mentioned evaluation of the influence of the hydrostatic support was formulated on the basis of the results of the computer simulation and laboratory studies. In the mathematical model of the hybrid drive, being the basis of the operation of computer simulation, as well as in the built research station, on which laboratory simulations were performed, some phenomena that could influence energy conversion processes were not taken into consideration. Thus, it is advisable to further improve the developed models of the hybrid drive and to perform further studies in a broader scope in order to highlight the possibilities of improving the effectiveness of energy conversion in different conditions of vehicle use.
The detailed remarks and conclusions concerning the improvement of the developed models of hybrid drive are presented below. In the model of the electric drive, models of induction or synchronous motor should be considered, and besides, models of voltage converters ought to be developed in order to include their influence in the motor operation. A crucial issue in modelling the electric drive is identifying the models of new kinds of batteries, as well as the influence of conditions of use on the values of parameters of a model.
In the modified model of the hydrostatic drive there are phenomena which influence the volume efficiency of the pump-motor. In the model of the hydro-pneumatic battery a relatively simple description of the heat exchange between the gas and the environment was assumed; due to a noticeable influence of this exchange on the operation of the drive, more detailed study of this phenomenon is advisable.
The quantity which defines the role of the hydrostatic system in the electric drive support is the value of the signal defining the separation of driving moments. In the conducted studies, the values of the signal were determined based on the initial simulation studies. It is thus appropriate to develop a proper algorithm to determine this signal, enabling more effective energy conversion.
The model of power transmission to the wheels is to be developed so that the energy transformations resulting from deformability of tires and changes of wheel pressure during accelerating and braking are rendered in a more detailed the way.
Currently, manufacturing and use of vehicles with electric drives is at the initial stage of development, despite a lot of available research. The analyzed concept of an electric drive with hydrostatic support does have a few disadvantages, which at the current stage of electric development, may prove more important than the main advantage analyzed in this article, namely lower energy consumption of the vehicle. The disadvantages include a higher mass of the hybrid drive and thus, higher cost of the vehicle. The significance of these drawbacks may decrease in regard with commercial vehicles with high traction energy consumption while driving in urbanized areas e.g., public transport buses with electric drive [3].
More and more often electric drives with hybrid energy storage system (HESS) are used, where the battery is supported by a supercapacitor. It is advisable to compare the energy effectiveness of this drive with the equivalent hybrid drive (HE-HV), during city traffic.
Acknowledgments
This project was funded by the Polish National Science Center allocated on the basis of the decision number DEC-2011/01/B/ST8/06822.
Author Contributions
W.G. contributed mathematical model of the hybrid drive and its components; M.M. and L.K. conceived, designed and build the experimental hybrid drive as well as identified numerical model parameters; J.P. and L.K. performed the experiments and analyzed experimental data. All authors were involved into writing the article.
Conflicts of Interest
The authors declare no conflict of interest.
References
- Hu, H.; Smaling, R.; Baselay, S. Advanced Hybrid Powertrains for Commercial Vehicles; SAE International: Warrendale, PA, USA, 2012. [Google Scholar]
- Williams, B.; Martin, E.; Lipman, T.; Kammen, D. Plug-in-Hybrid Vehicle Use, Energy Consumption, and Greenhouse Emissions: An Analysis of Household Vehicle Placements in Northern California. Energies 2011, 4, 435–457. [Google Scholar] [CrossRef]
- Bottiglione, F.; Contursi, T.; Gentile, A.; Mantriota, G. The Fuel Economy of Hybrid Buses. The Role of Ancillaries in Real Urban Driving. Energies 2014, 7, 4202–4220. [Google Scholar] [CrossRef]
- Khajepour, A.; Fallach, S.; Goodarrzi, A. Electric and Hybrid Vehicles; Willey: Chichester, UK, 2014. [Google Scholar]
- Wei, L. Introduction to Hybrid Vehicle System Modeling and Control; John Wiley & Sons, Inc.: Hoboken, NJ, USA, 2013. [Google Scholar]
- Pawelski, Z. Napęd hybrydowy dla autobusu miejskiego (Hybrid Drive for City Buses); WPŁ: Łódź, Polska, 1996. (In Polish) [Google Scholar]
- Grzesikiewicz, W.; Knap, L.; Makowski, M.; Pokorski, J. Badania doświadczalne hybrydowego napędu elektro-hydraulicznego (Experimental investigation of an electro-hydrostatic hybrid drive). Modelowanie Inżynierskie 2016, 59, 19–25. (In Polish) [Google Scholar]
- Sun, Y.; Jose Garcia, J.; Krishnamurthy, M. A Novel Fixed Displacement Electric-Hydraulic Hybrid (EH2) Drivetrain for City Vehicles. In Proceedings of the 2013 IEEE Transportation Electrification Conference and Expo (ITEC), Detroit, MI, USA, 16–19 June 2013. [Google Scholar]
- Alson, J.; Barbara, D.; Bryson, J.; Dooflag, M.; Haugen, D.; Kargul, J.; McDonald, J.; Nweman, K.; Platte, L.; Wolcott, M. Progress Report on Clean and Efficient Automotive Technologies Under Development at EPA. Available online: https://archive.epa.gov/otaq/technology/web/pdf/420r04002.pdf (accessed on 18 October 2016).
- Szumanowski, A. Hybrid-Electric Vehcile Drives Design; Institute for Sustainable Technologies: Radom, Poland, 2006. [Google Scholar]
- Hao, J.; Yu, Z.; Zhao, Z.; Shen, P.; Zhan, X. Optimization of Key Parameters of Energy Management Strategy for Hybrid Electric Vehicle Using DIRECT Algorithm. Energies 2016, 9, 997. [Google Scholar] [CrossRef]
- Herrera, V.; Milo, A.; Gaztañaga, H.; Etxeberria-Otadui, I.; Villarreal, I.; Camblong, H. Adaptive energy management strategy and optimal sizing applied on a battery-supercapacitor based tramway. Appl. Energy 2016, 169, 831–845. [Google Scholar] [CrossRef]
- Qin, F.; Xu, G.; Hu, Y.; Xu, K.; Li, W. Stochastic Optimal Control of Parallel Hybrid Electric Vehicles. Energies 2017, 10, 214. [Google Scholar] [CrossRef]
- Tribioli, L. Energy-Based Design of Powertrain for a Re-Engineered Post-Transmission Hybrid Electric Vehicle. Energies 2017, 10, 918. [Google Scholar] [CrossRef]
- Liu, T.; Jiang, J.; Sun, H. Investigation to Simulation of Regenerative Braking for Parallel Hydraulic Hybrid Vehicles. In Proceedings of the International Conference on Measuring Technology and Mechatronics Automation, Zhangjiajie, China, 11–12 April 2009. [Google Scholar]
- Wieczorek, M.; Lewandowski, M. A mathematical representation of an energy management strategy for hybrid energy storage system in electric vehicle and real time optimization using a genetic algorithm. Appl. Energy 2017, 192, 222–233. [Google Scholar] [CrossRef]
- Gyan, P.; Baghdadi, I.; Briat, O.; Del, J. Lithium battery aging model based on Dakin’s degradation approach. J. Power Sources 2016, 325, 273–285. [Google Scholar]
- Ma, X.; Zhang, Y.; Yin, C.; Yuan, S. Multi-Objective Optimization Considering Battery Degradation for a Multi-Mode Power-Split Electric Vehicle. Energies 2017, 10, 975. [Google Scholar] [CrossRef]
- Taylor, J.; Rampen, W.; Robertson, A.; Caldwell, N. Digital Displacement Hydraulic Hybrids—Parallel Hybrid Drives for Commercial Vehicles. In Proceedings of the JSAE Annual Congress, Yokohama, Japan, 18–20 May 2011. [Google Scholar]
Figure 1.
Scheme of the hybrid electro-hydrostatic drive: 1—electric drive; 2—hydrostatic drive; 3—electronic control system; 4—power transmission mechanism.
Figure 1.
Scheme of the hybrid electro-hydrostatic drive: 1—electric drive; 2—hydrostatic drive; 3—electronic control system; 4—power transmission mechanism.

Figure 2.
Scheme of the hydrostatic drive: 1—hydro-pneumatic battery; 2—pump-motor with variable displacement, where the energy conversion occurs; 3—drive shaft; 4—oil tank with constant pressure; 5—reducer rendering hydraulic resistance in the pipeline connecting the battery with the pump-motor.
Figure 2.
Scheme of the hydrostatic drive: 1—hydro-pneumatic battery; 2—pump-motor with variable displacement, where the energy conversion occurs; 3—drive shaft; 4—oil tank with constant pressure; 5—reducer rendering hydraulic resistance in the pipeline connecting the battery with the pump-motor.

Figure 3.
Scheme of the electric drive: 1—battery; 2—electric motor which can also operate in a generator mode; 3—drive shaft; and 4—transistorized DC/DC voltage converter.
Figure 3.
Scheme of the electric drive: 1—battery; 2—electric motor which can also operate in a generator mode; 3—drive shaft; and 4—transistorized DC/DC voltage converter.

Figure 4.
Characteristics of the electric battery.

Figure 5.
Scheme of drive control system.

Figure 6.
Graph of the function defining the given speed of the vehicle.

Figure 7.
An overview of the graph of a calculated speed of the vehicle: continuous line—calculated vehicle speed; dotted line—given speed .
Figure 7.
An overview of the graph of a calculated speed of the vehicle: continuous line—calculated vehicle speed; dotted line—given speed .

Figure 8.
An overview of curves of intensity of the current flowing through the batteries: thick line—hybrid drive; thin line—electric drive.
Figure 8.
An overview of curves of intensity of the current flowing through the batteries: thick line—hybrid drive; thin line—electric drive.

Figure 9.
An overview of curves of intensity of current flowing through the electric motor: thick line—hybrid drive; thin line—electric drive.
Figure 9.
An overview of curves of intensity of current flowing through the electric motor: thick line—hybrid drive; thin line—electric drive.

Figure 10.
Energy collected from the electric battery in the electric drive and in the hybrid drive and from the hydro-pneumatic battery in the hybrid drive .
Figure 10.
Energy collected from the electric battery in the electric drive and in the hybrid drive and from the hydro-pneumatic battery in the hybrid drive .

Figure 11.
Scheme of the laboratory station to study hybrid electro-hydrostatic drive together with measurement-control signals: 1—hydro-pneumatic battery; 2—pump-motor with control system; 3—throttling elements; 4—tank; 5—tank; 6—clutch; 7—electric motor with control system; 8—electric battery; 9—clutch; 10—flywheel; 11—clutch; 12—transmission belt; 13—hydraulic pump.

Figure 12.
A general view of the station for studying the hybrid electro-hydrostatic drive.

Figure 13.
Signal of the given angular speed of the flywheel (two cycles).

Figure 14.
Results of measurements of the cycles during the electric accelerating and braking of the flywheel, angular speed ω, current i, voltage U.
Figure 14.
Results of measurements of the cycles during the electric accelerating and braking of the flywheel, angular speed ω, current i, voltage U.

Figure 15.
Results of measurements during two cycles of hybrid accelerating and braking of the flywheel; (a) electric drive; (b) hydrostatic drive.
Figure 15.
Results of measurements during two cycles of hybrid accelerating and braking of the flywheel; (a) electric drive; (b) hydrostatic drive.

Figure 16.
Results of measurements during 16 cycles of electric accelerating and braking of the flywheel.
Figure 16.
Results of measurements during 16 cycles of electric accelerating and braking of the flywheel.

Figure 17.
Results of measurements during 16 cycles of hybrid accelerating and braking of the flywheel.
Figure 17.
Results of measurements during 16 cycles of hybrid accelerating and braking of the flywheel.

© 2018 by the authors. Licensee MDPI, Basel, Switzerland. This article is an open access article distributed under the terms and conditions of the Creative Commons Attribution (CC BY) license (http://creativecommons.org/licenses/by/4.0/).
Share and Cite
MDPI and ACS Style
Grzesikiewicz, W.; Knap, L.; Makowski, M.; Pokorski, J. Study of the Energy Conversion Process in the Electro-Hydrostatic Drive of a Vehicle. Energies 2018, 11, 348. https://doi.org/10.3390/en11020348
AMA Style
Grzesikiewicz W, Knap L, Makowski M, Pokorski J. Study of the Energy Conversion Process in the Electro-Hydrostatic Drive of a Vehicle. Energies. 2018; 11(2):348. https://doi.org/10.3390/en11020348
Chicago/Turabian StyleGrzesikiewicz, Wiesław, Lech Knap, Michał Makowski, and Janusz Pokorski. 2018. "Study of the Energy Conversion Process in the Electro-Hydrostatic Drive of a Vehicle" Energies 11, no. 2: 348. https://doi.org/10.3390/en11020348
Note that from the first issue of 2016, this journal uses article numbers instead of page numbers. See further details here.