PV Hosting Capacity Dependence on Harmonic Voltage Distortion in Low-Voltage Grids: Model Validation with Experimental Data


Abstract
:1. Introduction
2. Hosting Capacity
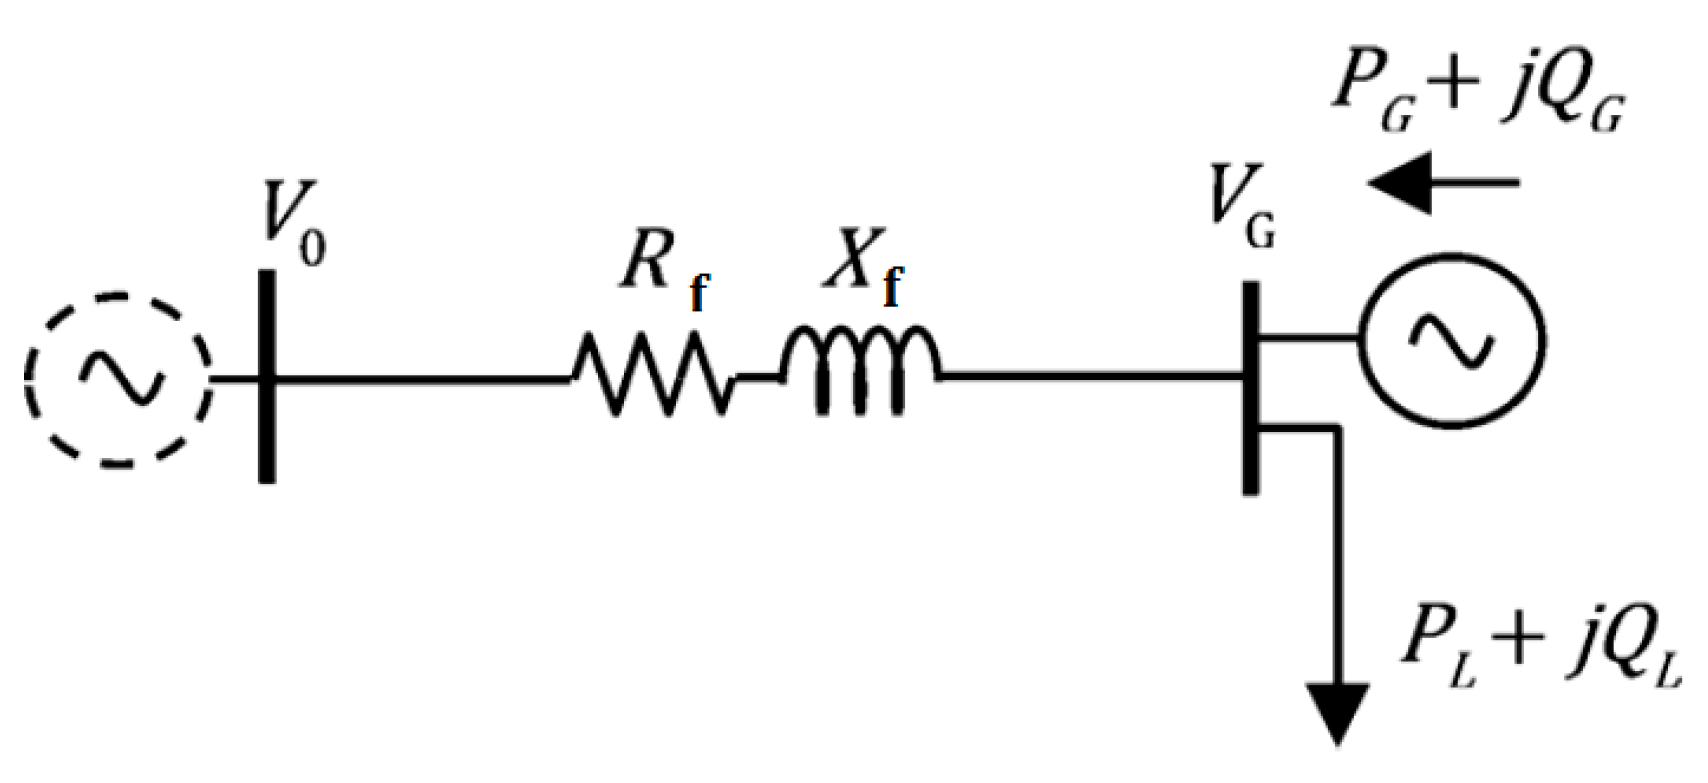
2.1. Voltage Rise Due to Harmonic Injection and Its Limits to Define the Local Hosting Capacity
2.2. Sensitivity Analysis of Hosting Capacity
2.2.1. Harmonic Voltage
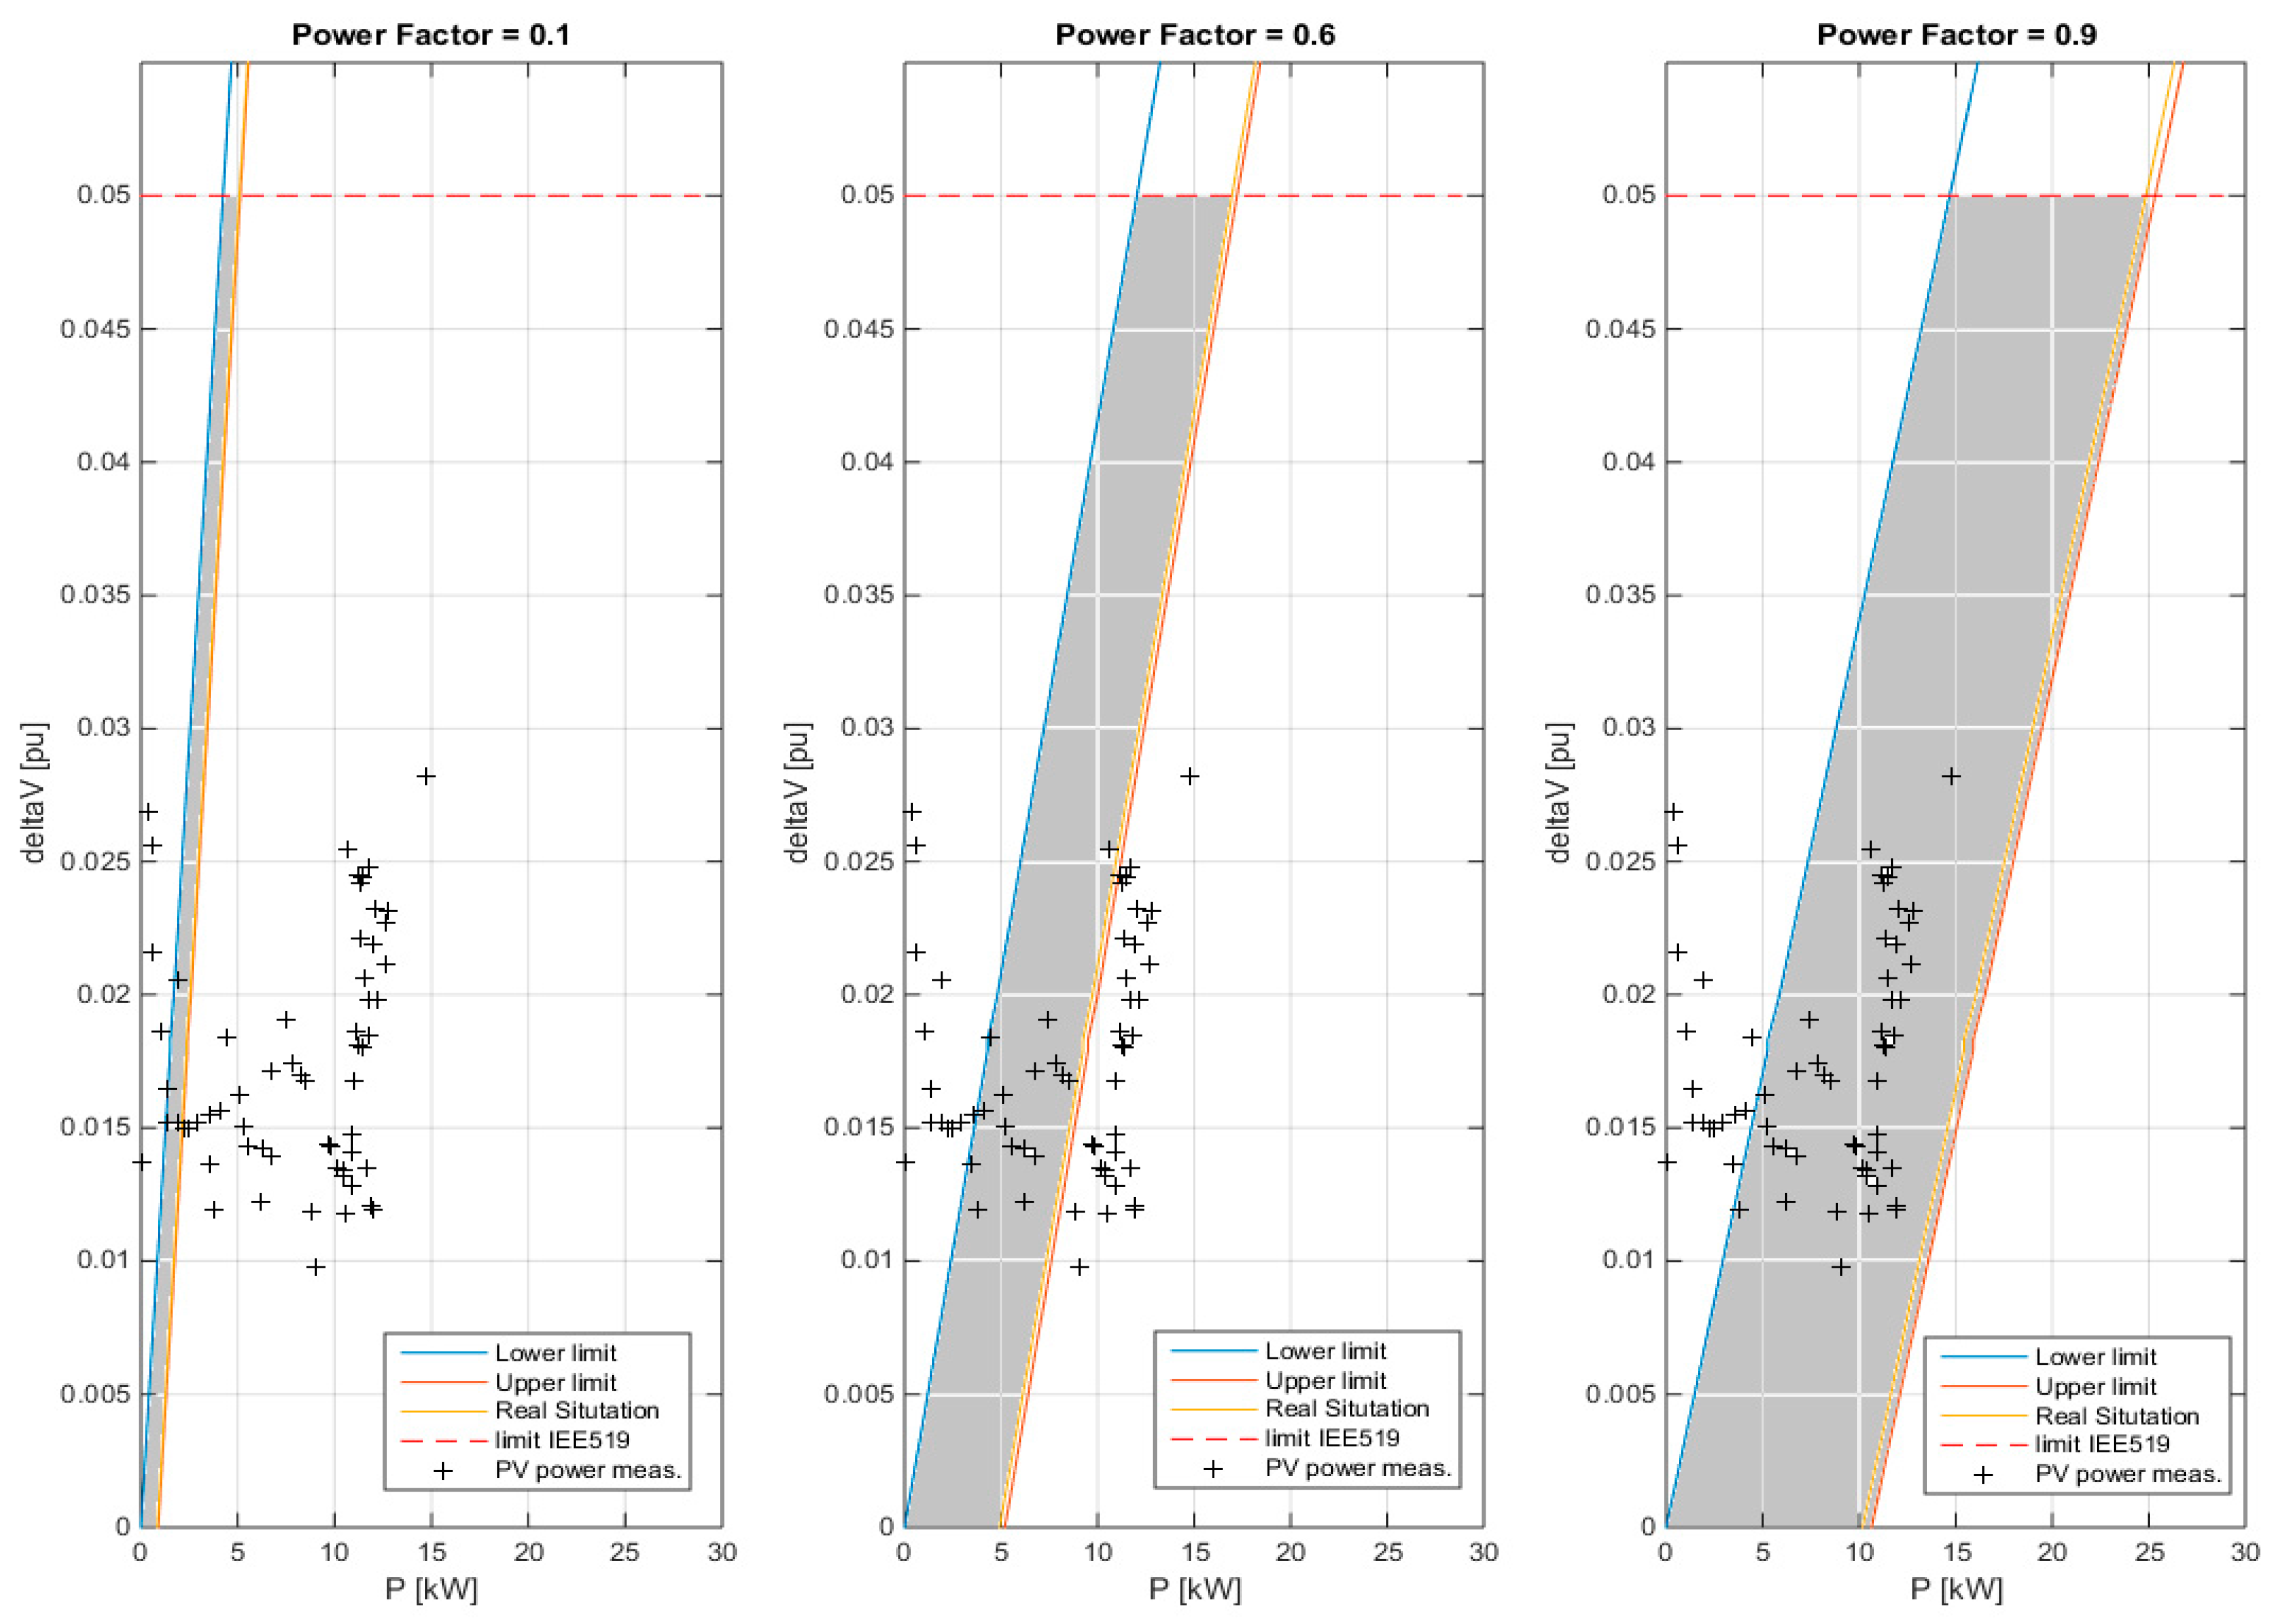
2.2.2. Set Reactive Power on the Inverters
3. Experimental Data, Validation and Analysis
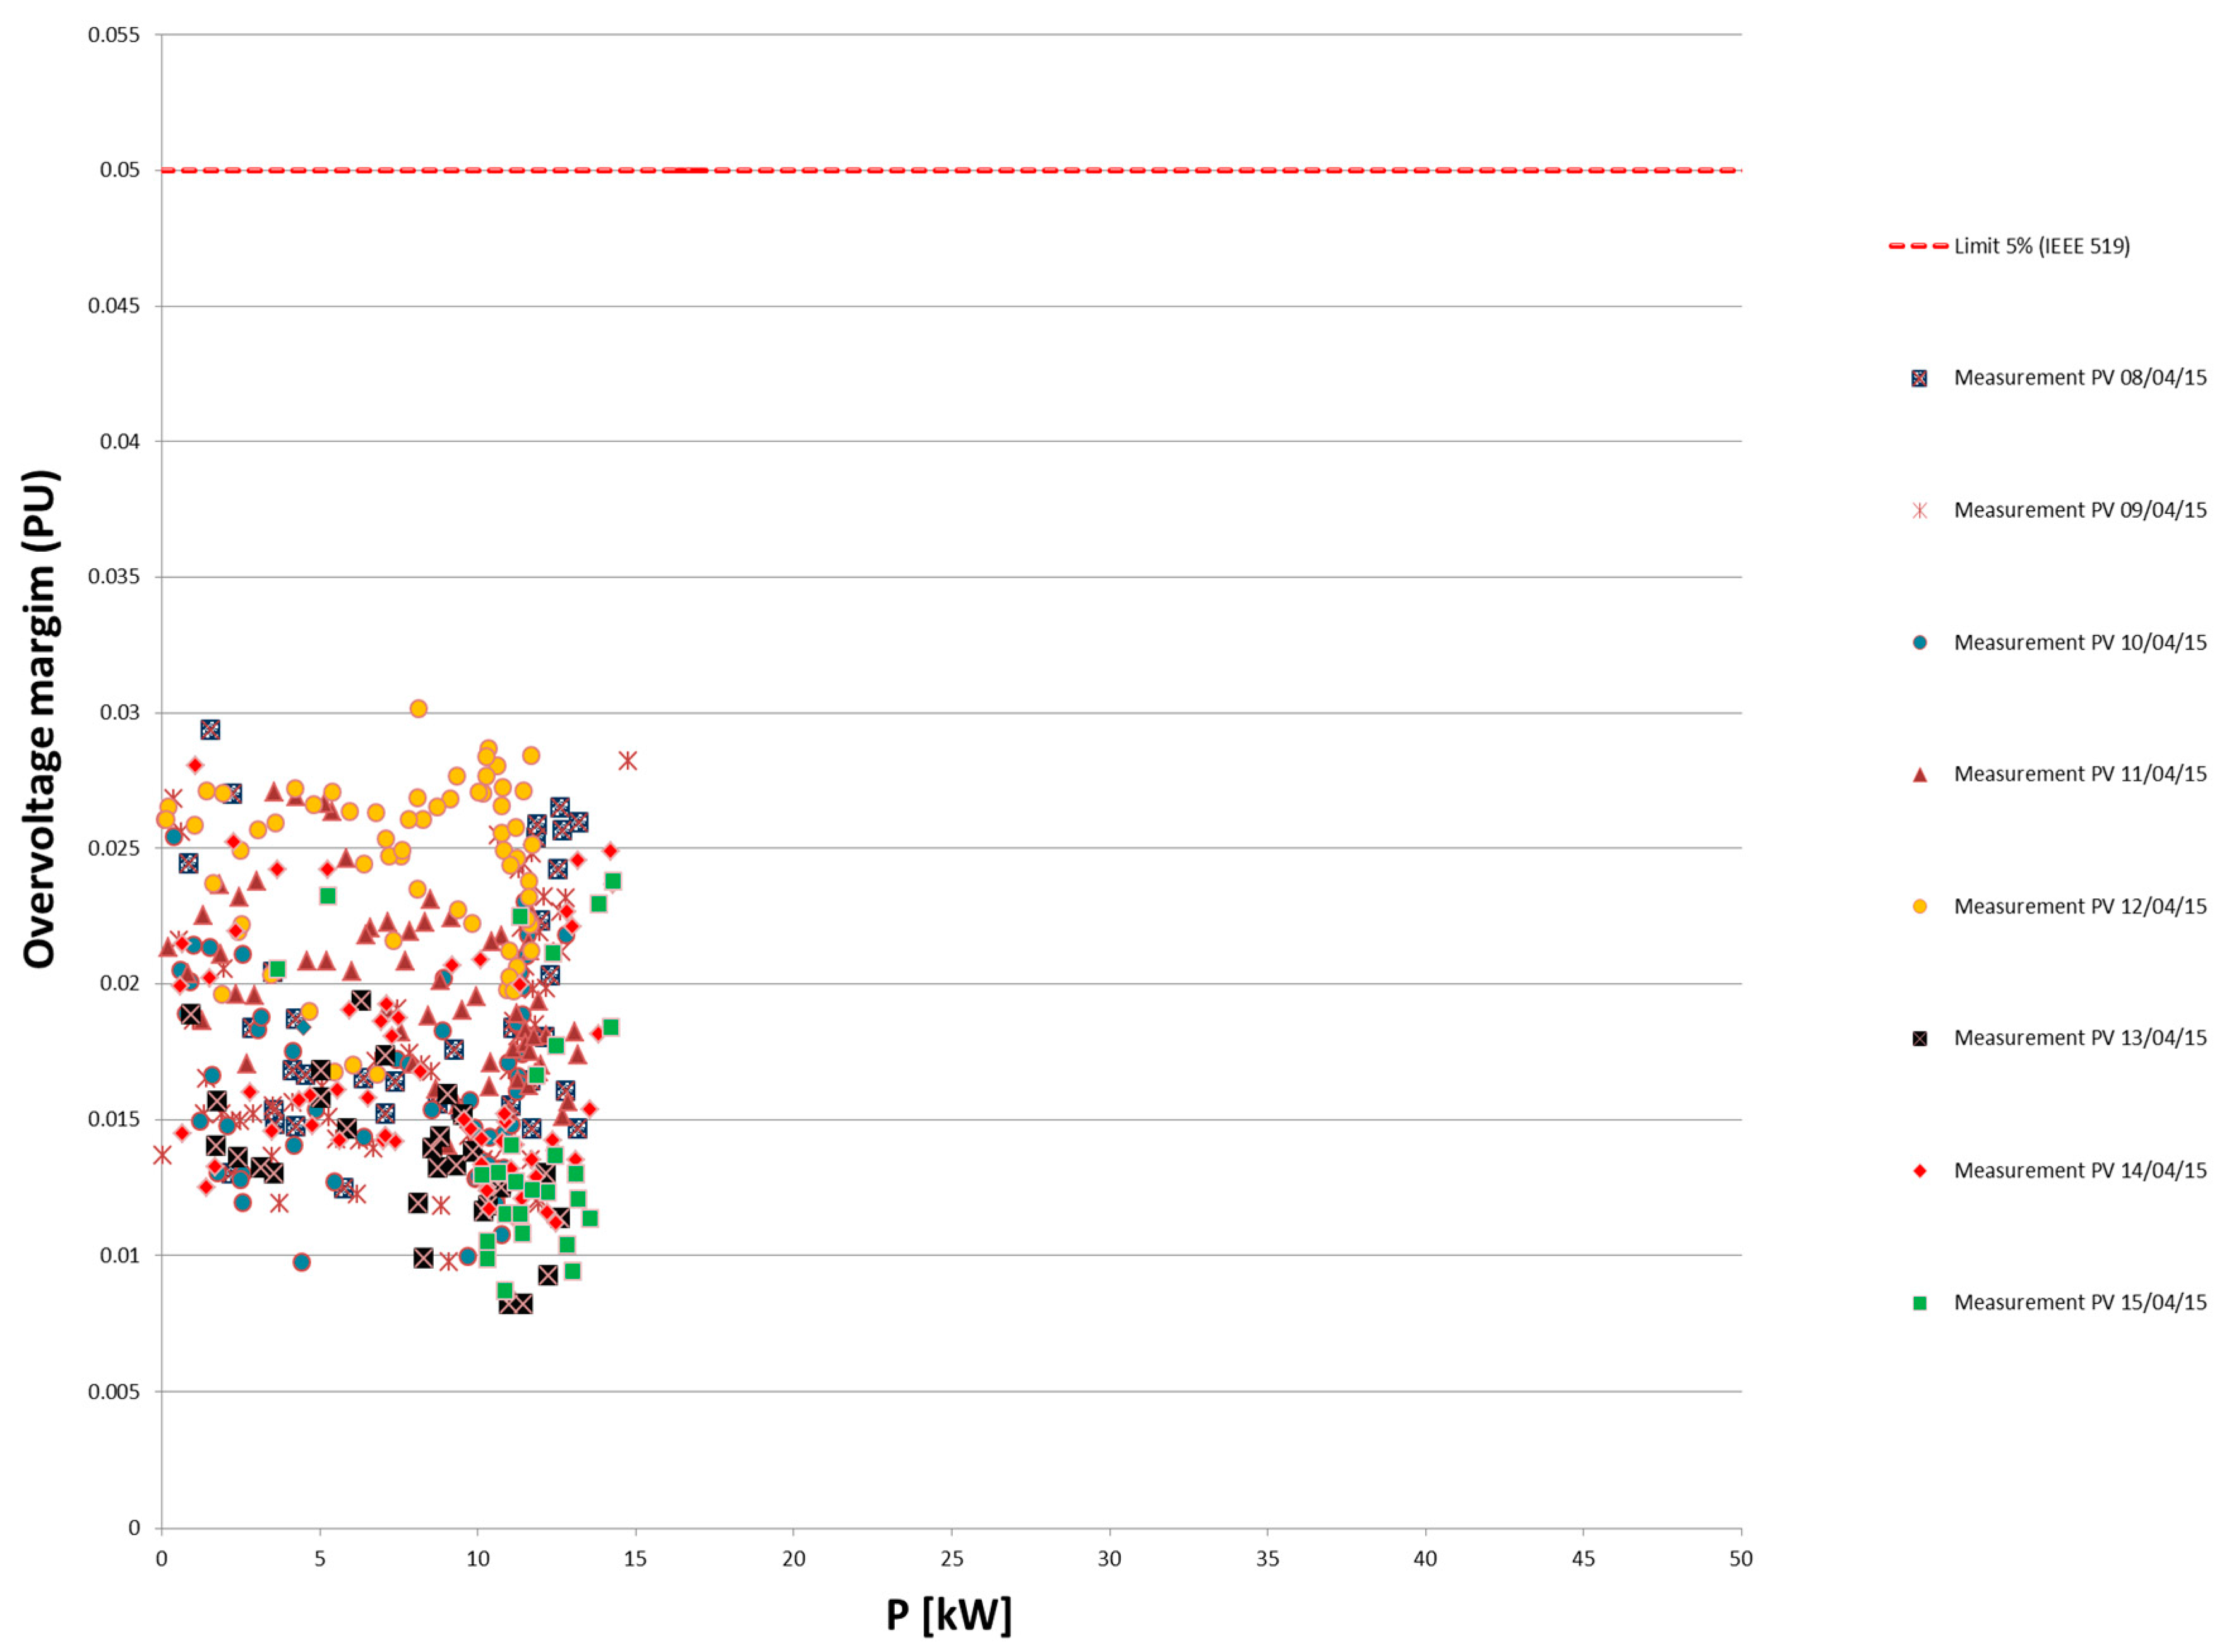
3.1. Experimental Data and a Brief Analysis
3.2. Calculation Method for Analysis and Planning
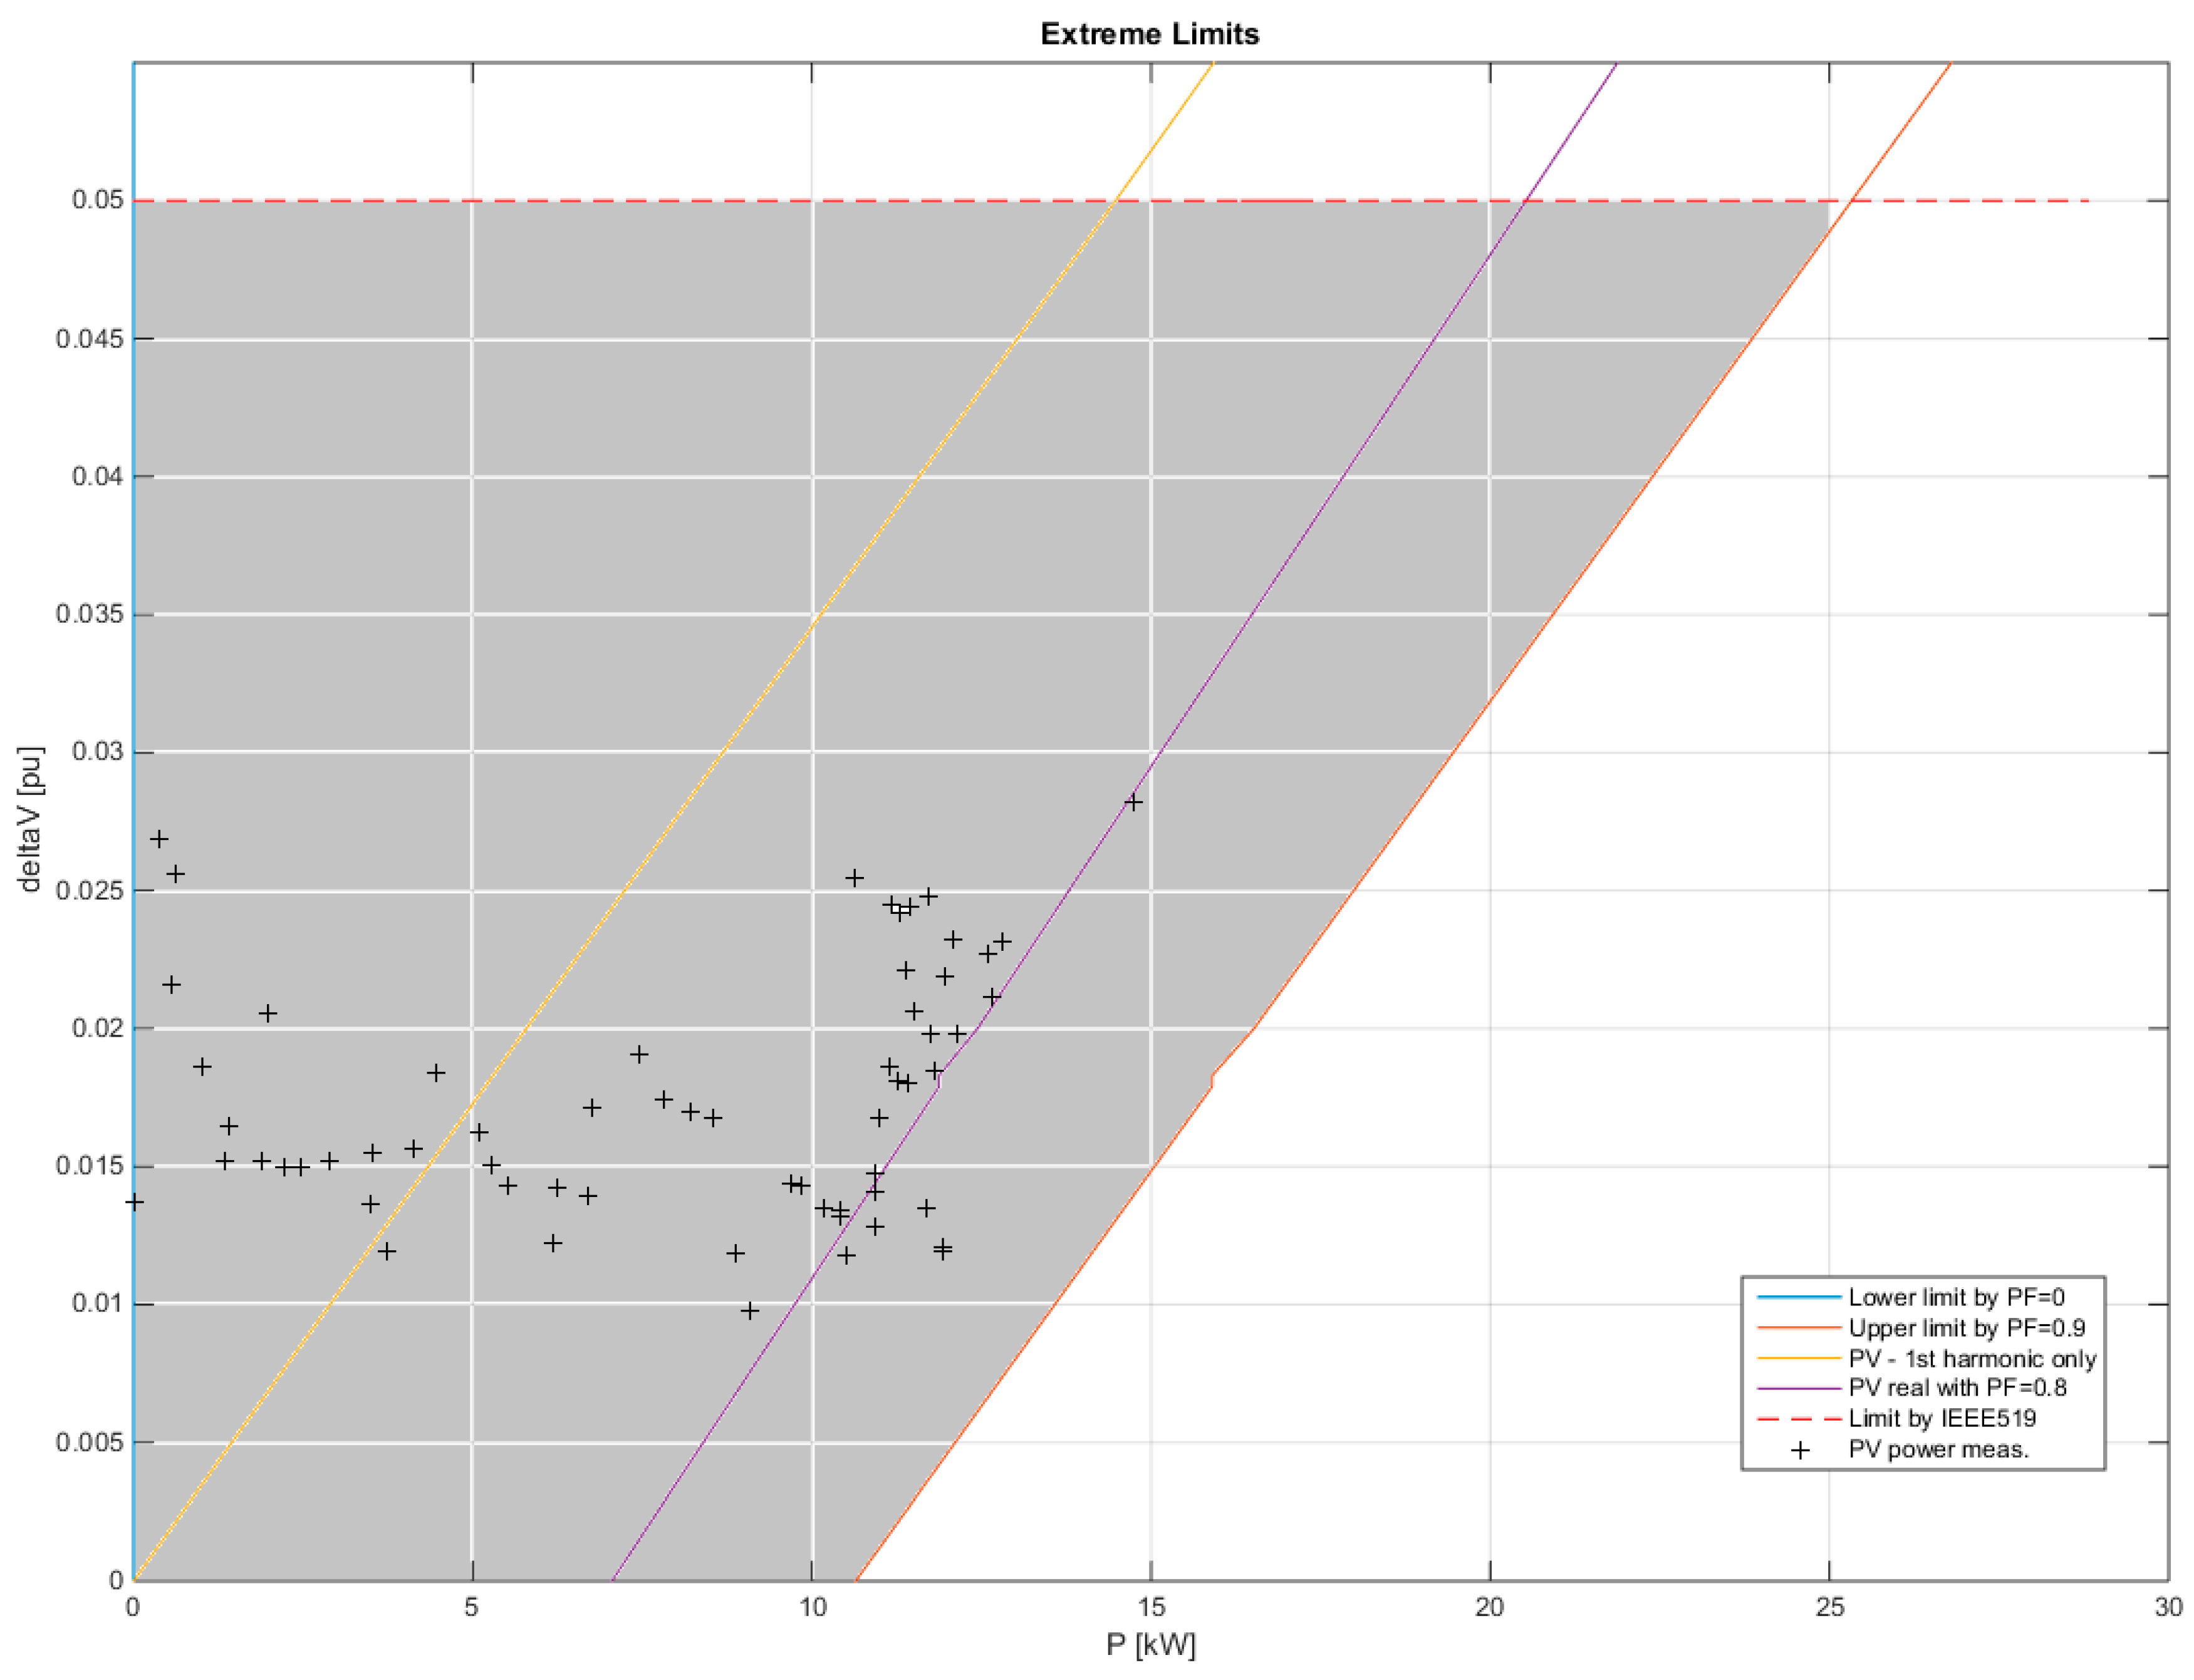
- (i)
- A worst-case scenario is defined in two strands as part of an extreme situation. First, we consider that all harmonic voltages are 5% for , which leads to in equation (14). This situation corresponds to the system being at the maximum harmonic limit. Second, we consider the case where the power factor is at the minimum possible, which in this case is zero. This scenario defines an unacceptable region where our system is where our PV unit cannot be integrated into the distribution system.
- (ii)
- A best-case scenario is also defined in two strands, in a similar way to that used for the worst-case scenario. First, we consider all harmonic voltages as negligible for , which leads to . This situation corresponds to the system having a voltage waveform that is 100% sinusoidal. Secondly, we consider the case where the power factor is at the maximum, which in this case is above 90%.
- (iii)
- A third scenario is defined as the real case wherein the power factor range was [0.77; 0.82].
- (iv)
- Finally, the fourth scenario is used to illustrate the behavior of the hosting capacity approach when only the fundamental frequency is considered in (14) and compared with case (iii), which considers all harmonic orders.
4. Conclusions
Acknowledgments
Author Contributions
Conflicts of Interest
References
- Pesaram, M.; Huy, P.D.; Ramachandaramurthy, V.K. A review of the optimal allocation of distributed generation: Objectives, constraints, methods and algorithms. Renew. Sustain. Energy Rev. 2017, 75, 293–312. [Google Scholar] [CrossRef]
- Tan, W.S.; Hassan, M.Y.; Majid, M.S.; Rahman, H.A. Optimal distributed renewable generation planning: A review of different approaches. Renew. Sustain. Energy Rev. 2013, 18, 626–645. [Google Scholar] [CrossRef]
- Carvalho, M.S.; Correia, P.F.; Ferreira, L.A.F.M. Distributed Reactive Power Generation Control for Voltage Rise Mitigation in Distribution Networks. IEEE Trans. Power Syst. 2008, 23, 766–772. [Google Scholar] [CrossRef]
- Bollen, M.H.J.; Hassan, F. Integration of Distributed Generation in the Power System; Wiley-Blackwell: New York, NY, USA, 2011. [Google Scholar]
- Oliveira, T.E.C. Estudo da Capacidade de Hospedagem de Fontes de Geração Distribuída no Sistema Elétrico de um Campus Universitário. Master’s Thesis, Universidade Federal de Itajubá, Itajubá, Brazil, 2015. (In Portuguese). [Google Scholar]
- Bollen, M.H.J.; Ronnberg, S.K. Hosting Capacity of the Power Grid for renewable Electricity Production and New Large Consumption Equipment. Energies 2017, 10, 1325. [Google Scholar] [CrossRef]
- Oliveira, T.E.C.; Ribeiro, P.F.; Santos, I.N. Determining the harmonic hosting capacity of PV sources for a university campus. In Proceedings of the 17th International Conference on Harmonics and Quality of Power (ICHQP), Belo Horizonte, Brazil, 16–19 October 2016; pp. 836–841. [Google Scholar]
- Standard. Procedimentos de Distribuição de Energia Elétrica no Sistema Elétrico Nacional—PRODIST Módulo 8—Qualidade da Energia Elétrica. 2015. Available online: http://www.aneel.com.br (accessed on 11 November 2017).
- Standard. IEEE Std. 1159, IEEE Recommended Practice for Monitoring Electric Power Quality; IEEE: Piscataway, NJ, USA, 2014. [Google Scholar]
- JWG C4/C6.29 Power Quality Aspects of Solar Power. C4, CIGRE. Available online: http://c4.cigre.org/WG-Area/JWG-C4-C6.29-Power-Quality-Aspects-of-Solar-Power (accessed on 11 November 2017).
- Jothibasu, S.; Santoso, S. Sensitivity Analysis of Photovoltaic Capacity of Distribution Circuits. In Proceedings of the 2016 IEEE Power and Energy Society General Meeting (PESGM), Boston, MA, USA, 17–21 July 2016; pp. 1–5. [Google Scholar]
- Etherden, N.E.M.; Bollen, H.J. Increasing the hosting capacity of distribution networks by curtailment of renewable energy resources. In Proceedings of the 2011 IEEE Trondheim, PowerTech, Norway, 19–23 June 2011; pp. 1–7. [Google Scholar]
- Santos, I.N.; Bollen, M.H.J.; Ribeiro, P.F. Methodology for estimation of harmonic hosting. In Proceedings of the 2014 16th International Conference on Harmonics and Quality of Power (ICHQP), Bucharest, Romania, 25–28 May 2014; pp. 708–712. [Google Scholar]
- Sáiz-marín, E.; Member, S.; Lobato, E.; Egido, E.I. Local Hosting Capacity Increase by Means of Wind Farm Voltage Control Provision. IEEE Trans. Power Syst. 2014, 29, 1731–1738. [Google Scholar] [CrossRef]
- Capitanescu, F.; Ochoa, L.F.; Member, S.; Margossian, H.; Hatziargyriou, E.N.D. Assessing the Potential of Network Reconfiguration to Improve Distributed Generation Hosting Capacity in Active Distribution Systems. IEEE Trans. Power Syst. 2014, 30, 346–356. [Google Scholar] [CrossRef]
- Rylander, M.; Smith, J.; Sunderman, E.W. Streamlined Method for Determining Distribution System Hosting Capacity. IEEE Trans. Ind. Appl. 2016, 52, 3–9. [Google Scholar] [CrossRef]
- Altin, M. Distributed Generation Hosting Capacity Calculation of MV Distribution Feeders in Turkey. In Proceedings of the IEEE PES Innovative Smart Grid Technologies Conference Europe, Istanbul, Turkey, 12–15 October 2014; pp. 1–7. [Google Scholar]
- Dudiak, I.J. Integration of renewable energy sources to the power system. In Proceedings of the 2014 14th International Conference on Environment and Electrical Engineering, Krakow, Poland, 10–12 May 2014; pp. 1–4. [Google Scholar]
- Menniti, D.; Merlo, M.; Scordino, N.; Zanellini, E.F. Distribution network analysis: A comparison between hosting and loading capacities. In Proceedings of the International Symposium on Power Electronics Power Electronics, Electrical Drives, Automation and Motion, Sorrento, Italy, 20–22 June 2012; pp. 926–933. [Google Scholar]
- Schwaegerl, C.; Bollen, E.M. Voltage control in distribution systems as a limitation of the hosting capacity for distributed energy resources. In Proceedings of the 18th International Conference and Exhibition on Electricity Distribution (CIRED 2005), Turin, Italy, 6–9 June 2005; pp. 6–9. [Google Scholar]
- Rylander, M.; Smith, J.; Lewis, D.; Steffel, E.S. Voltage impacts from distributed photovoltaics on two distribution feeders. In Proceedings of the 2013 IEEE Power & Energy Society General Meeting, Vancouver, BC, Canada, 21–25 July 2013; pp. 2–6. [Google Scholar]


| Parameter | Default Value |
|---|---|
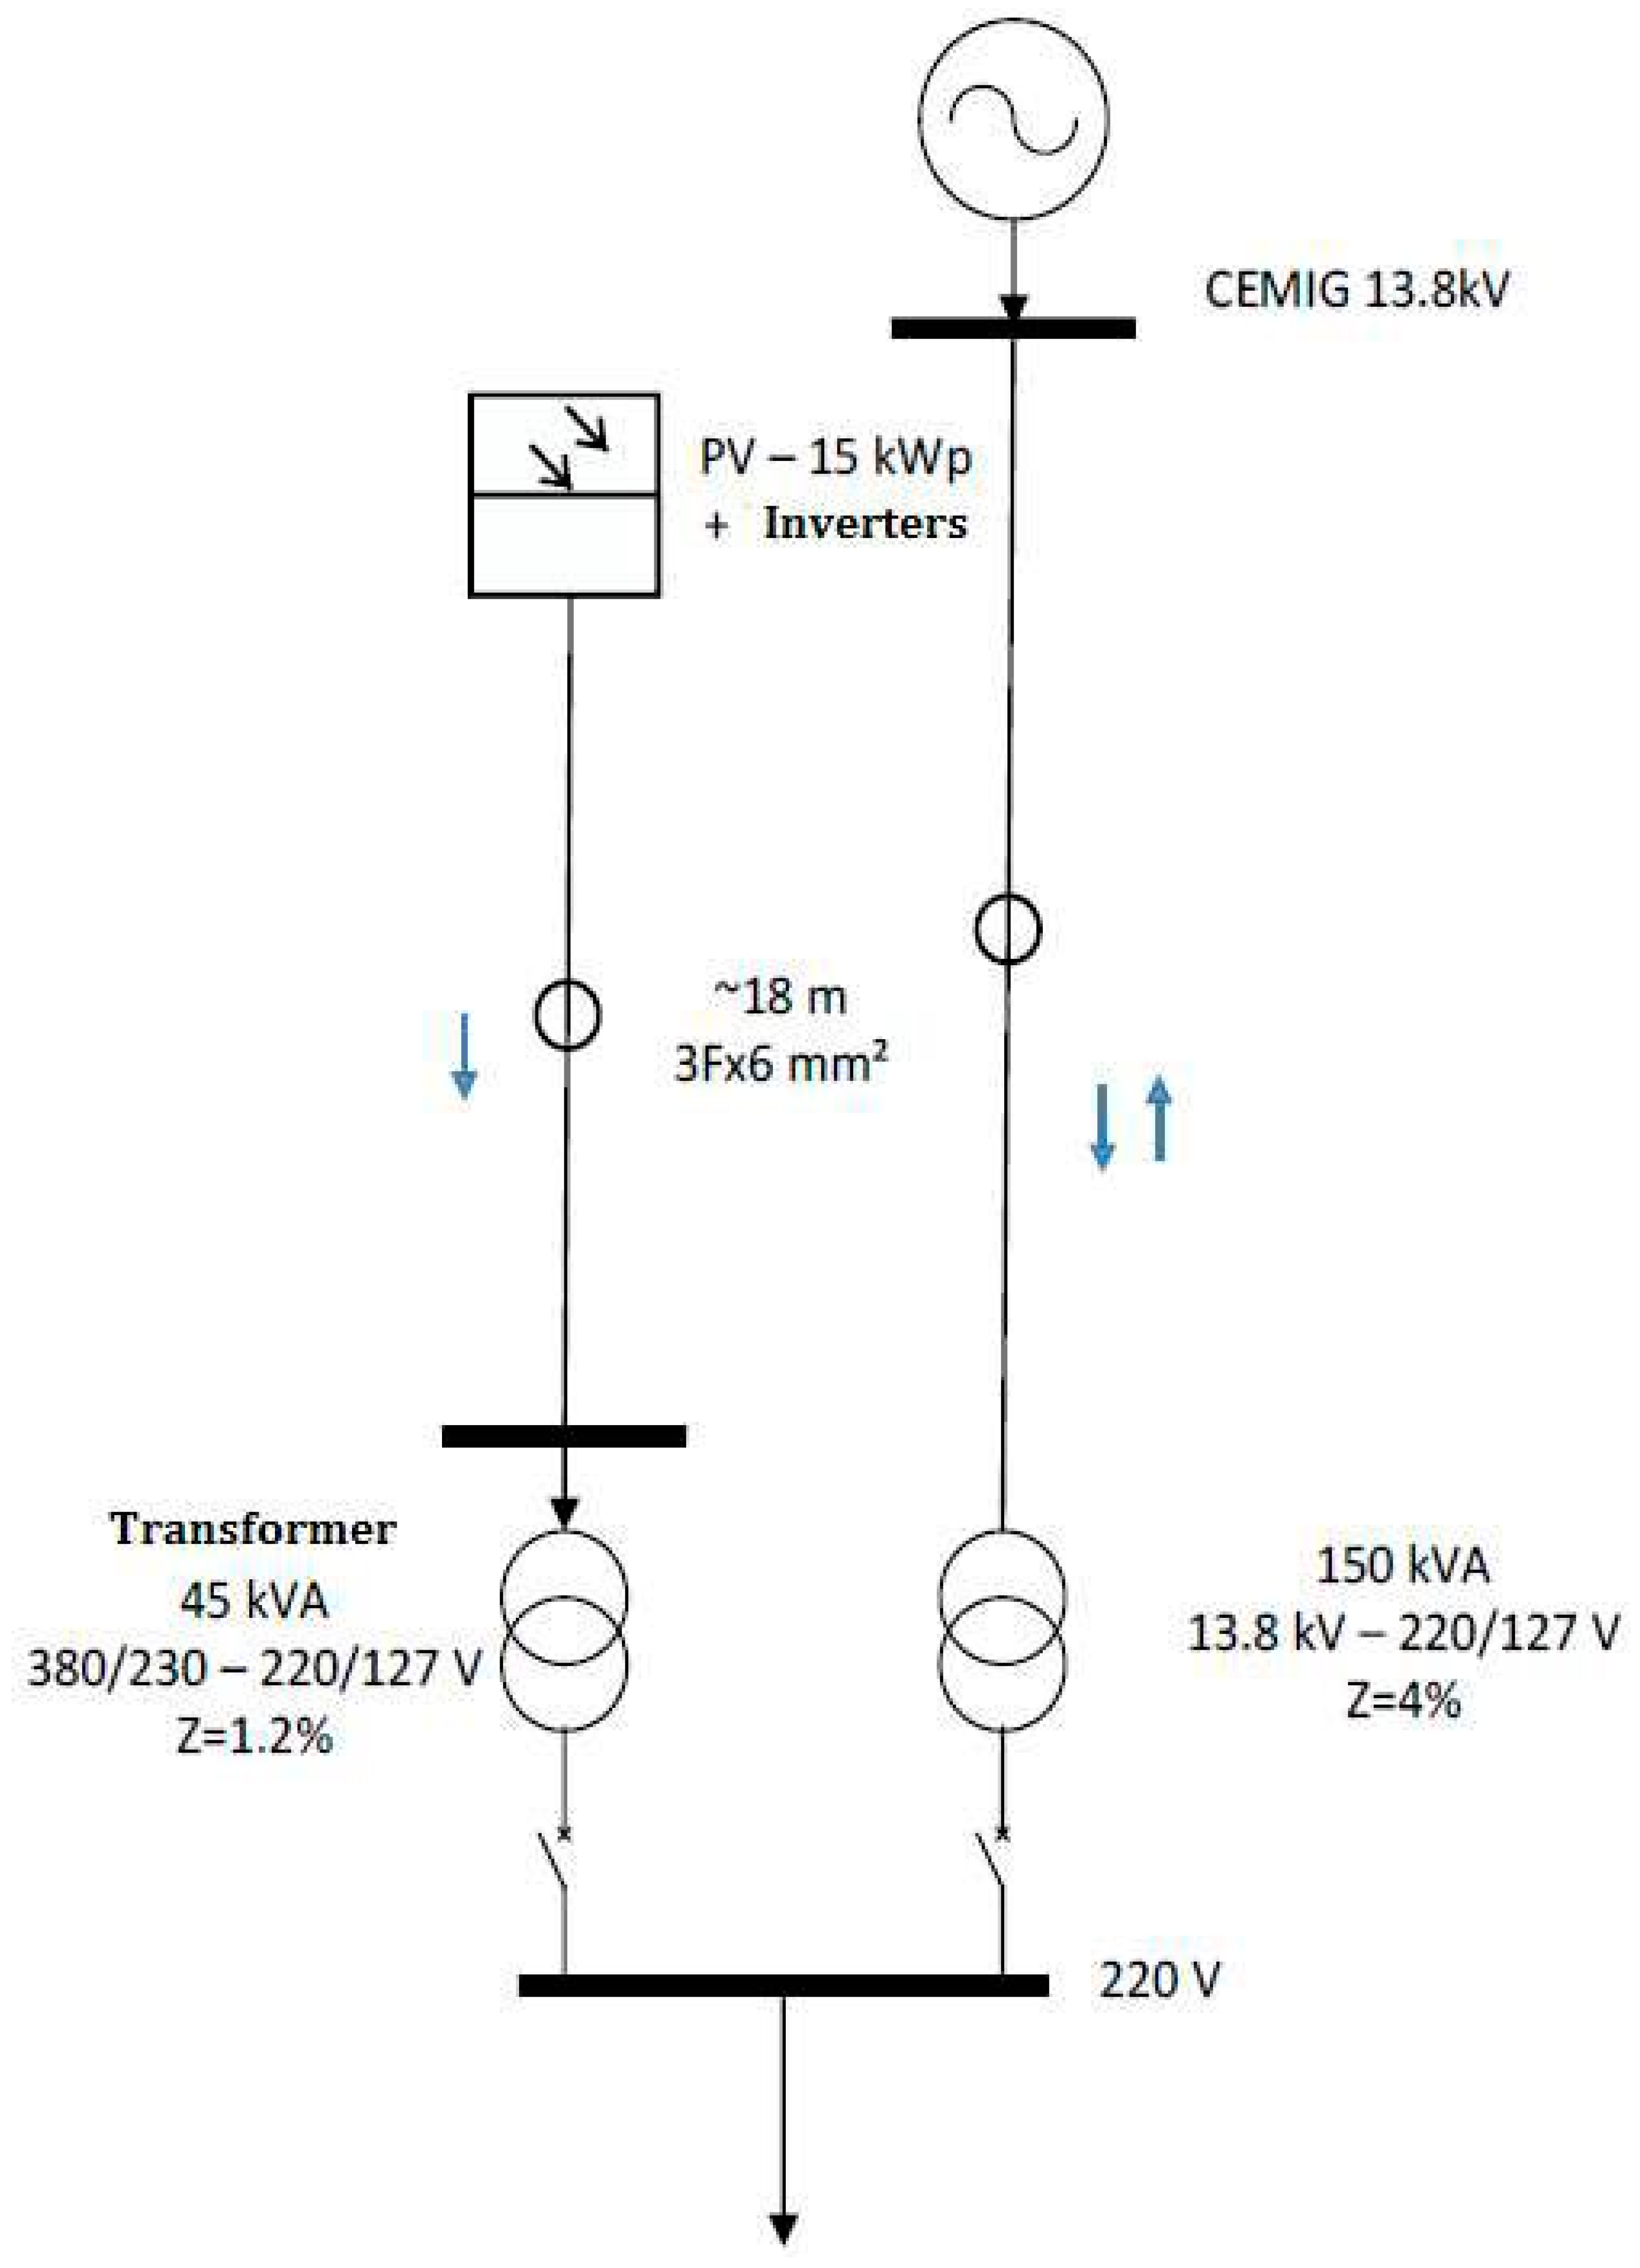
| Autotransformer | 45 kVA, 380/230–220/127 V, Z = 1.2% |
| Transformer | 150 kVA 13.8 kV–220/127 V, Z = 4% |
| PV cable | 18 m, 3F × 6 mm2, Cu |
| PV system + Inverters | 15 + 2 Inverters (7.5 kW) |
| CEMIG 13.8 kV | Scc = 1000 MVA |
© 2018 by the authors. Licensee MDPI, Basel, Switzerland. This article is an open access article distributed under the terms and conditions of the Creative Commons Attribution (CC BY) license (http://creativecommons.org/licenses/by/4.0/).
Share and Cite
Oliveira, T.E.C.d.; Carvalho, P.M.S.; Ribeiro, P.F.; Bonatto, B.D. PV Hosting Capacity Dependence on Harmonic Voltage Distortion in Low-Voltage Grids: Model Validation with Experimental Data. Energies 2018, 11, 465. https://doi.org/10.3390/en11020465
Oliveira TECd, Carvalho PMS, Ribeiro PF, Bonatto BD. PV Hosting Capacity Dependence on Harmonic Voltage Distortion in Low-Voltage Grids: Model Validation with Experimental Data. Energies. 2018; 11(2):465. https://doi.org/10.3390/en11020465
Chicago/Turabian StyleOliveira, Tiago E. C. de, Pedro M. S. Carvalho, Paulo F. Ribeiro, and Benedito D. Bonatto. 2018. "PV Hosting Capacity Dependence on Harmonic Voltage Distortion in Low-Voltage Grids: Model Validation with Experimental Data" Energies 11, no. 2: 465. https://doi.org/10.3390/en11020465