Multi-Objective Optimal Design of Electro-Hydrostatic Actuator Driving Motors for Low Temperature Rise and High Power Weight Ratio

School of Automation Science and Electrical Engineering, Beihang University, Beijing 100083, China
*
Author to whom correspondence should be addressed.
Energies 2018, 11(5), 1173; https://doi.org/10.3390/en11051173
Submission received: 15 March 2018
/
Revised: 26 April 2018
/
Accepted: 26 April 2018
/
Published: 7 May 2018
(This article belongs to the Special Issue Thermal Energy Storage and Thermal Management (TESM2017))
Abstract
:With the rapid development of technology, motors have drawn increasing attention in aviation applications, especially in the more electrical aircraft and all electrical aircraft concepts. Power weight ratio and reliability are key parameters for evaluating the performance of equipment applied in aircraft. The temperature rise of the motor is closely related to the reliability of the motor. Therefore, based on Taguchi, a novel multi-objective optimization method for the heat dissipation structural design of an electro-hydrostatic actuator (EHA) drive motor was proposed in this paper. First, the thermal network model of the EHA drive motor was established. Second, a sensitivity analysis of the key parameters affecting the cooling performance of the motor was conducted, such as the thickness of fins, the height of fins, the space of fins, the potting materials and the slot fill factor. Third, taking the average temperature of the windings and the power weight ratio as the optimization goal, the multi-objective optimal design of the heat dissipation structure of the motor was carried out by applying Taguchi. Then, a 3-D finite element model of the motor was established and the steady state thermal analysis was carried out. Furthermore, a prototype of the optimal motor was manufactured, and the temperature rise under full load condition tested. The result indicated that the motor with the optimized heat dissipating structure presented a low temperature rise and high power weight ratio, therefore validating the proposed optimization method.
1. Introduction
With the development of the more electric/all electric aircraft technology, aircraft servo-actuating systems are gradually developing from multi-energy source systems to a single electric power system [1]. Electrical actuating systems can be classified into two types: electro-hydrostatic actuators (EHAs) and electromechanical actuators (EMAs). The EHA concept has attracted wide attention in the aviation industry as it has the advantages of high efficiency, high power weight ratio, good compatibility with the existing centralized hydraulic system and so on [2]. The motor is the driving element of the EHA system, and the power weight ratio and reliability of the motor are of vital importance to the performance of the actuator system. With the characteristics of high efficiency, high power weight ratio, high dynamic performance, the permanent magnet synchronous motor (PMSM) is widely used in airborne equipment [3].
In order to improve the performance of the EHA drive motor, the power weight ratio and reliability of the motor should be enhanced. The power weight ratio is restricted by the electric load and the magnetic load. It grows along with the electric load and the magnetic load. However, the increase of the electric and magnetic loads will lead to a higher temperature rise of the driver motor, which may reduce the performance of insulation materials and threaten the motor reliability. Therefore, the cooling capacity of the motor restricts the increase of the power weight ratio and affects the reliability of the system. Improving the cooling capacity of the motor can effectively improve the power weight ratio and enhance the reliability of the motor.
The losses of PMSM mainly include three parts: copper loss, iron loss and mechanical loss [4]. Copper loss is caused by the Joule heat loss of the winding resistance. Stator iron loss consists of hysteresis loss, eddy current loss and excessive loss due to the impact of the alternating magnetic field. Mechanical loss includes the frictional loss of bearings and the windage loss of the rotor. The iron loss of the PMSM is mainly concentrated on the stator core. Due to the direct contact between the stator core and the housing of the motor, the heat generated by the iron loss can be easily dissipated. In order to ensure the insulation between the winding and the housing, the winding is surrounded by various insulating materials such as some types of varnishes and resins. Since the thermal conductivity of the insulating materials is low, the equivalent thermal conductivity of the winding becomes poor, which leads to great heat resistance between the housing and the winding. Therefore, when compared to other components of the motor, the winding temperature is the highest, which increases the risk of the insulation material failing.
At present, the existing research on the heat dissipation structure of an EHA drive motor has mainly focused on natural convection and wet-rotors where the air gap between the stator and rotor is filled with hydraulic oil [5]. In the structure of the wet-rotor, since the stator and rotor are immersed in hydraulic oil, the heat generated in the stator and rotor can be easily taken away. Therefore, the temperature of the motor can be controlled within a reasonable range. However, the hydraulic oil present in the motor will lead to a huge loss when the motor is running at a high speed [2,5]. As a result, the efficiency and dynamic performance of the motor would become worse. Meanwhile, the natural convection system is widely applied in motors since it has a simple structure and it does not need any other assisting devices such as a pump or heat exchanger [6]. However, the natural convection system is unsuitable to use in large-capacity drive motors due to its poor cooling capacity.
In order to enhance the cooling capacity of the natural convection system, many strategies can be adopted. Traditionally, fins and ducts on the housing can be applied to improve convection and radiation heat transfer [7]. However, fins and ducts need a specific installation space and they will increase the weight of the motor. Usually the winding of the motor is the hot spot due to the poor equivalent thermal conductivity. By inserting a high thermal conductivity conductor, a higher thermal conductivity path between the center of the slot and the housing can be established and the equivalent thermal conductivity improved [7,8]. However, this method will reduce the effective slot fill factor and the high conductivity conductor inserted in the slot will generate an eddy current loss. To improve the heat conductivity of the end winding, various materials are applied to pot the end windings. One plastic with a thermal conductivity of 2 W/m·K was used to encapsulate the end windings of an axial flux machine; therefore a low thermal resistance path to the motor housing was established [9]. Due to its excellent thermal conductivity which is up to 150~300 W/m·K, aluminum nitride (Al N) has also been used to pot the end windings of motors such as the PMSM or axial flux motor [10,11].
Different materials have different physical properties, including thermal conductivity, which have different effects on the temperature rise. Metal has a high thermal conductivity, but its mass density is large which has a great influence on the weight of the motor. The thermal conductivity of non-metallic materials is relatively low, but has a small mass density, so greatly benefits the reduction of the total weight of the motor.
Meanwhile, the structure of the fins or ducts on motor housing can affect the heat convection of the housing. Different structures may have different effects on the cooling performance and the weight of the motor. Previous studies on the optimal design of the heat dissipation structure have only paid attention to the improvement of the motor cooling performance; little consideration has been given to the weight of the heat dissipation structure. In high power weight ratio applications, it is not only the cooling effect of the heat dissipation structure that should be considered, but also the weight of the heat dissipating structure.
Taguchi is a statistical method that was first used to analyze various quality problems in the field of statistics [12]. Many scholars have introduced the Taguchi method into the design field such as the analysis of cogging torque and torque ripple. Furthermore, Taguchi has the advantages of being simple and convenient, and can search the design space quickly [13].
Since a motor with low temperature and high power weight ratio can improve the performance of the actuating system, a novel multi-objective optimization method for heat dissipation structure design is presented in this paper. The method not only takes the cooling performance of the heat dissipation structure into consideration, but also the weight of the structure. First, the thermal network model of the EHA drive motor was built. Next, a sensitivity analysis of the key parameters accounting for the cooling performance was carried out. Then using the Taguchi method, the optimum design of the heat dissipation structure was performed to choose the average temperature of the winding and the weight as optimization goals. After that, based on a 3-D finite element model, the thermal analysis was carried out under different working conditions. Furthermore, the prototype with the optimized parameters was processed, and the temperature rise under different working conditions tested.
2. Establishment of a Thermal Network Model
2.1. Electrical Machine Model
In order to enhance the dynamic performance, the EHA driving motor was designed with surface mounted permanent magnets, 12 slots, 10 poles and large stator length-inner diameter ratio which can reduce the inertia of the rotor. Due to the large stator length-inner diameter ratio, the height of slot is also large. Consequently, there is a large thermal resistance between winding and housing, which brings challenges to the heat dissipation of winding [14]. In this paper, an EHA drive motor is taken as an example to improve the cooling performance of motor. The motor adopts the natural convection heat dissipation mode. In order to improve the convection and radiation heat transfer on surface of housing, many axial fins are applied to the housing. The initial structure of the motor is shown in Figure 1 and the main parameters are described in Table 1.
2.2. Establishment of a Thermal Network Model
In order to build the thermal network, some assumptions are needed. The assumptions used are listed as follows:
- The distribution of the motor temperature field is symmetrical along the circumference, and the cooling condition is the same in the circumferential direction.
- The distribution of the temperature field is identical along the central axis and the cooling condition is the same.
- The radiation is neglected, and the convection and conduction are considered in the building of the thermal network model.
- Heat sources are focused on the center of components.
According to the hypotheses above, the temperature field in the motor can be divided into multiple regions by an orthogonal grid. The center of each region is a temperature node and different nodes are connected to each other by thermal resistance. A simplified thermal network model was set up and shown in Figure 2. The thermal network model contained 12 nodes, 18 thermal resistances and five heat sources. The heat sources included five parts: iron loss at the stator yoke, iron loss at the stator teeth, copper loss in the winding that is embedded in the slot, copper loss in the end winding, and loss at magnet which is caused by the eddy current. All of the above losses were calculated by electromagnetic finite element method. And the results of calculation are shown in Table 2. The temperature nodes included 12 parts such as fins, housing, stator yoke, stator teeth, magnet, rotor yoke, shaft, winding, end winding, HC (high thermal conductive potting materials), and the endcap. In this thermal network model, the equivalent thermal resistances are used to indicate the heat flux. The description of each thermal resistance and the value of each resistance of initial motor are shown in Table 3.
The heat transfer mode in the motor mainly includes heat conduction and convective heat dissipation. The corresponding thermal resistance is the conduction thermal resistance and convection thermal resistance respectively.
The thermal resistance of convection can be calculated as follows [15]:
where is the convection thermal resistance, is the convective heat transfer coefficient [W/m2 °C], is the surface area and the thermal resistance of heat conduction can be calculated as follows [15]:
where is the conduction thermal resistance, is the characteristic length of the surface, is the area of the surface and is the thermal conductivity [W/m2 °C]
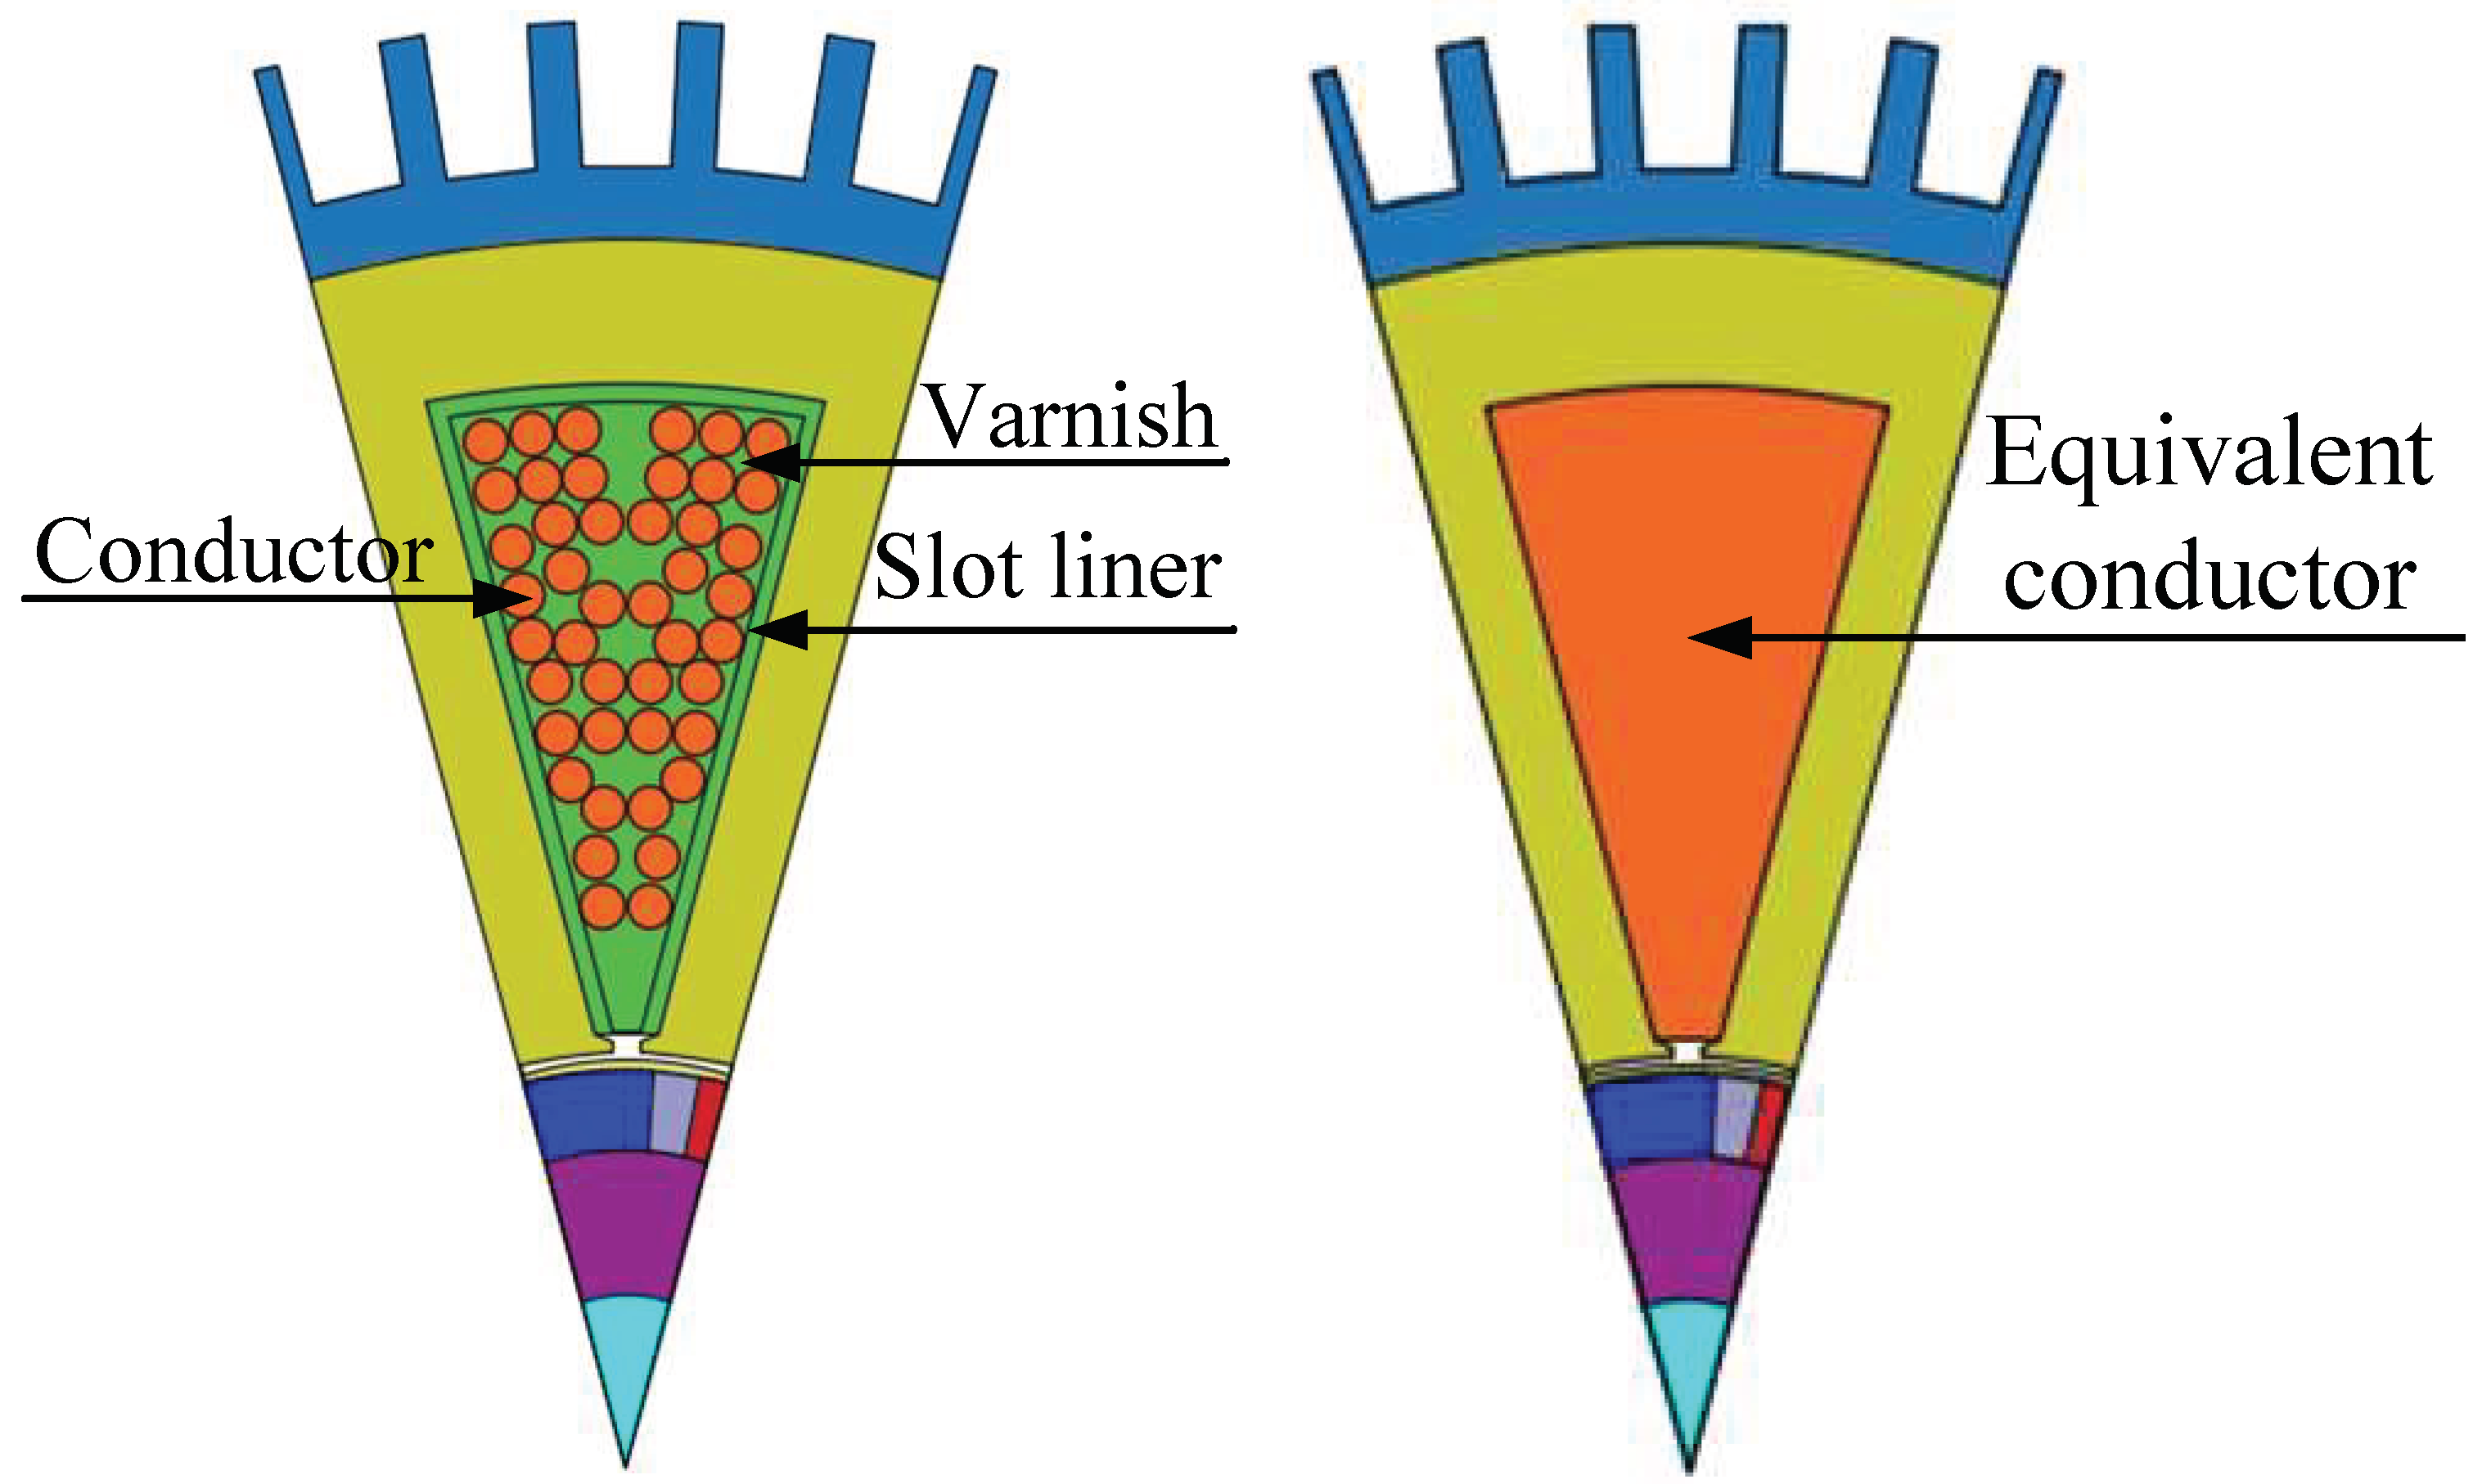
One slot of the EHA driver motor is shown in Figure 3 and the properties of materials used in the motor are shown in Table 4. It can be seen that the conductors of the winding are surrounded by various insulating materials. The total copper area depends on the slot fill factor (Ks), which is defined as the copper area in the slot divided by the total slot window [7]. For the convenience of modeling and analysis in the thermal analysis process, all conductors and insulating materials in the stator slot are usually replaced by an equivalent solid conductor, as shown in Figure 3.
The thermal conductivity of equivalent conductor can be calculated as follows [7]:
where is the thermal conductivity of equivalent conductor, is the thermal conductivity of copper, is the thermal conductivity of varnish and is the slot fill factor
In this paper, the material of the slot wall liner was polyimide, which has a thermal conductivity of 0.26 W/m·K. The thickness of slot wall liner was 0.15 mm. The diameter of the conductors was 0.556 mm and the thickness of the wire wrap was 0.028 mm. The slot fill factor of the initial motor was 0.55 and the area of the slot was 437.747 mm2. Using the above parameters, the thermal conductivity of the equivalent conductor was calculated with a result of 0.4996. Then the thermal resistance between the conductor and stator can be easily obtained.
The heat convection is a heat transfer mode generated by fluid motion. Therefore it is related to the motion of fluid around the motor. In natural convection, the motion of air around the motor occurs due to buoyancy and gravity. In this study, there were three types of convection and the convective heat transfer coefficients are described as follows:
- (1)
- hca: convective heat transfer coefficient between the housing and air around it;
- (2)
- hcg: convective heat transfer coefficient between the stator or rotor and air in the airgap;
- (3)
- hcia: convective heat transfer coefficient between the internal structure and the inner air.
As there is no external force to affect the motion of air, hca is considered as natural convection. The natural convection of air on the surface of the motor housing can be calculated as follows [16]:
where is the Nusselt number, is the heat capacity (kJ/kg·°C) of air, is the Prandtl number, is the Grashof number, is the coefficient of cubical expansion (1/K), is the difference between surface and fluid temperatures, is the density of fluid, is the fluid dynamic viscosity (kg/m·s), is the heat transfer coefficient (W/m2 °C), is the characteristic length of the surface (m) and is the thermal conductivity of air (W/m2 °C)
The convection on the surface of housing is not only related to the structure of housing but also related to the direction of housing. When the housing is one simple smooth housing structure, the suitable values of a and b used in Equation (4) can be obtained from Table 5:
When the fins are used to improve the convection on the surface of the housing, the structure of the housing becomes complex and the convection is related to the structure of fins. When the structure of the fins is U-shaped vertical channels and the motion of the air is laminar flow [16]:
where S is the spacing of the fins, L is the height of the fins, is the channel aspect ratio and r is the characteristic length (hydraulic radius).
When the structure of the fins is U-shaped horizontal channels and the motion of the air is laminar flow [16]:
In this case, the characteristic length is the spacing of the fins.
According to the early study that the convection in the inner space of motor can be calculated as follows [16]:
where: hcia1 is the heat transfer coefficient between the stator end region and the inner air, hcia2 is the heat transfer coefficient between the rotor end region and the inner air, ω is the rotor speed and Rr is the outer radius of the rotor.
The motion of the air in the air gap is complex. Therefore, it is difficult to evaluate the convection in the air gap. According to earlier work, the convection in the air gap can be calculated as follows [17]:
where is s a geometrical factor, is the size of air gap, is the diameter of the rotor, is the diameter of the stator, is the density of air, is the is the fluid kinematic viscosity, is the speed of the rotor and is the mean diameter of the air gap.
3. Optimal Design of Heat Dissipation Structure
3.1. Parameter Sensitivity Analysis
Taguchi is an experimental method to select the experimental conditions and to arrange the experiment by orthogonal table. It can use the least experimental data to obtain the best combination of design parameters and to realize the optimal design. The optimal design process by applying Taguchi can be described as follows:
- (1)
- The optimal design variable and the optimal objectives need to be determined.
- (2)
- The orthogonal table is established. Then the influence of the design variables on the optimal objectives can be obtained through the orthogonal experiment.
- (3)
- The best combination of optimal design variables is obtained by means of mean and variance.
In order to improve the cooling performance and the power weight ratio of the EHA driving motor, one optimal design was conducted by applying Taguchi. The average temperature of winding (Ta), weight of motor (Wm) and power weight ratio (Pd) were selected as the optimal goal. The slot fill factor affects the equivalent conductivity of the slot and then has a great influence on the thermal resistance of slot. The wire diameter of the EHA driving motor partly depends on the slot fill factor. Therefore the copper loss is also related to the slot fill factor. The thickness and spacing of fins will impact the housing convection and produce an effect on the cooling performance of the motor. The physical properties of the potting material not only affect the thermal resistance between the end winding and the housing, but also the weight of the motor. Therefore, the thickness of the fins (Ft), the spacing of the fins (Fs), the height of the fins (Fh), the slot fill factor (Ks) and the thermal conductivity of the potting materials (Hc) were selected as the optimal design variables. The optimal variables and the level of each variable are given in Table 6.
In Table 6, the end windings of motor were not potted when Hc = 0. In order to investigate the influence of potting materials on the cooling performance, three products of the PAKCOOL (Chooyu, Shanghai, China), named TG550, TC213, and TC23, respectively, were selected as the samples. Some of the physical properties of these materials are listed in Table 7:
Next, a Taguchi’s L-16 orthogonal array is built. The experiments for the orthogonal array experiments and results are shown in Table 8. The average temperature of the winding was calculated by the thermal network as described in Section 2. The weight of the motor was calculated according to the size of motor and the density of materials used in this machine. The power weight ratio was defined as the rated output power divided by weight.
To analyze the influence on cooling performance and power weight ratio produced by different variables at different levels, the statistical mean made by the orthogonal arrays and the calculation of thermal network were used in this optimization. The average values can be calculated as follows:
The results of average value calculation are shown as Table 9 described:
Then set one optimal variable as the constant, calculate the average value of each optimal objective while the other optimal variables vary at different levels. For example, the average value of Ta when Ks at level 0.55, can be calculated as Equation (11) described and the average values of performances under each level factor are listed in Table 10.
To analyze the proportions of the influences on the average temperature of winding and power weight ratio of the motor that are produced by the optimal design variable, the analysis of variance to provide a measure of confidence was conducted. Generally, the sum of squares (SS) is used to evaluate the deviation of the experimental data to the average value of the data. Therefore SS can be used to describe the influence proportions on the optimal objectives produced by the design variable.
Then, SS can be calculated according to Equation (12). Furthermore, the results of the SS calculation and proportion are listed in Table 11
where xi is the optimal variable and can be expressed as Ks, Ft, Fh, Fs, Hc in the formulation, are each optimal objective average value of various optimal variables at different levels and is the average value of each optimal objective.
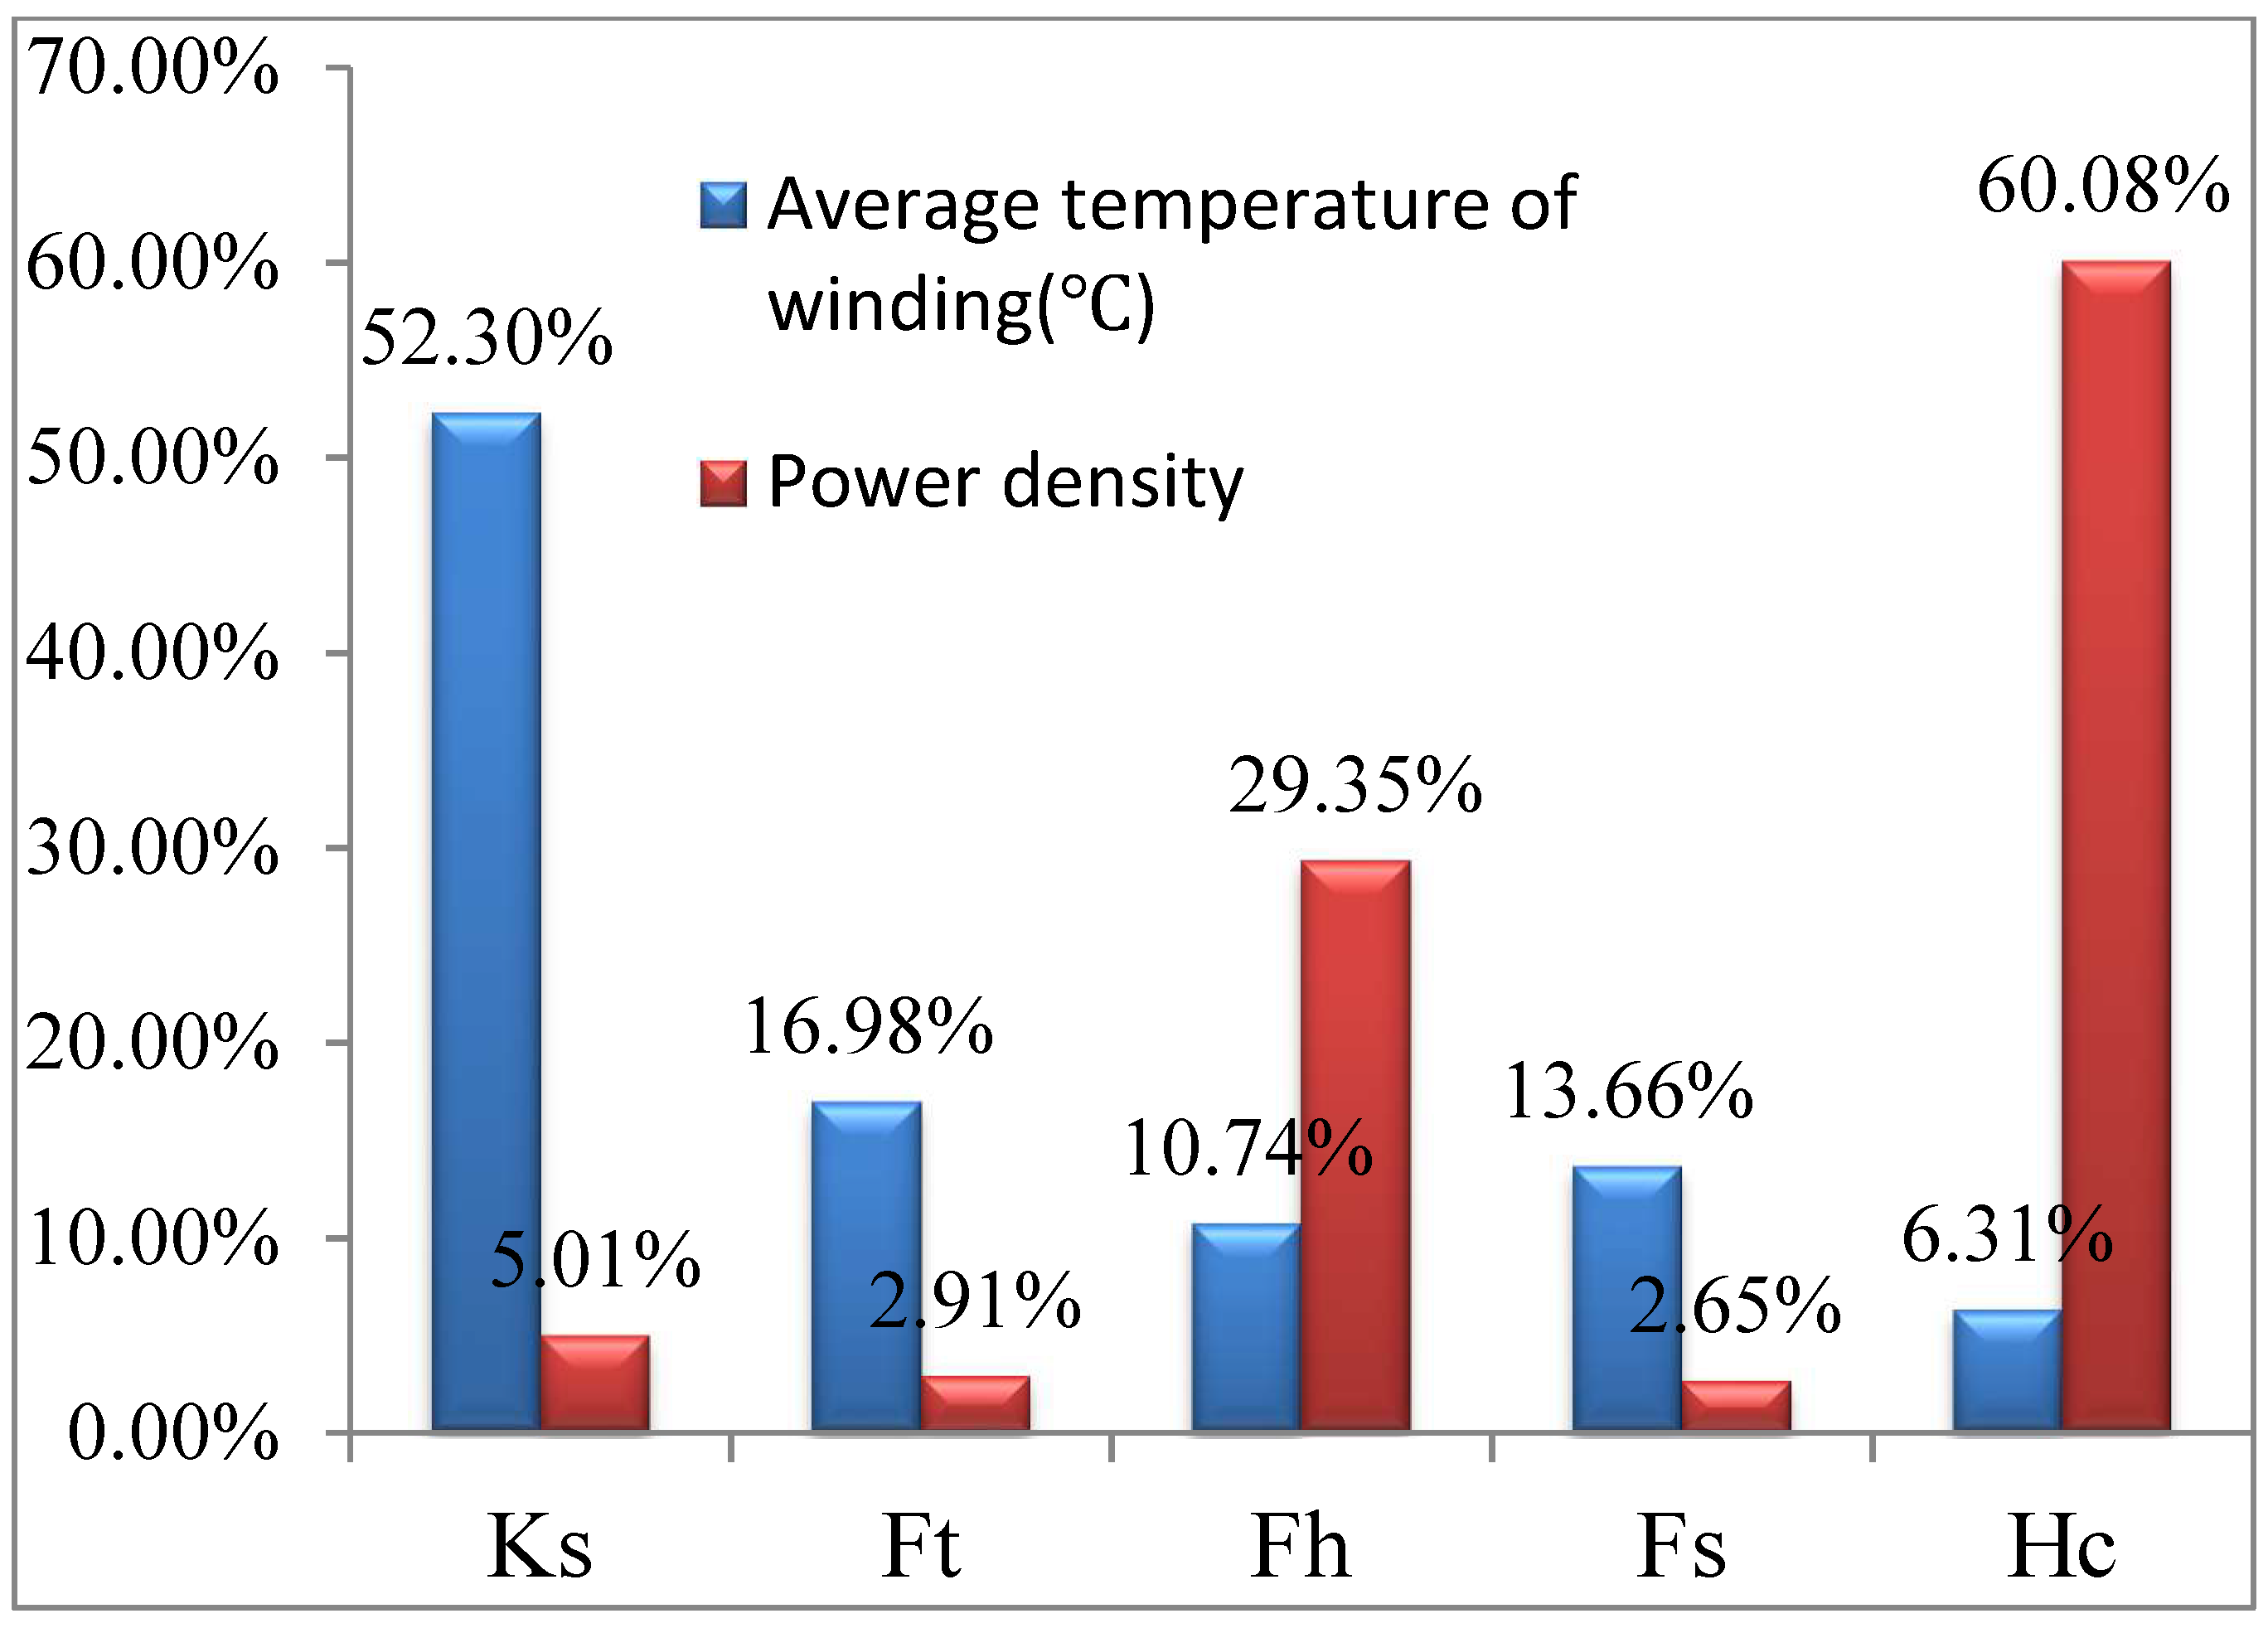
The slot fill factor not only affects the copper loss of the motor but also has a great influence on the equivalent thermal conductivity of the slot. Therefore, the slot fill factor is vital for the improvement of the winding temperature rise. As shown in Figure 4, the proportion of influence produced by the slot fill factor was up to 52.3%. The thickness of the fins, the height of the fins, and the spacing of the fins all influence the convection of housing. As for the motors that are cooled by natural convection, convection on the surface of the housing is the main way to dissipate the heat generated by the motor. Then the proportion of influences produced by the dimensions of the fins reached up to 41.38%, as shown in Figure 4. The EHA driving motor is a surface-mounted PMSM (SPMSM) with three phases, 12 slots, 10 poles and non-overlapped concentrated windings. The end winding of the motor was shorter and the copper loss at the end winding was small. As a result, the heat generated by the loss at end winding was smaller. Therefore, the potting materials contributed a small proportion of influence on the winding temperature as shown in Figure 4. In order to improve the thermal conductivity of the insulation materials, some metals such as silver are mixed into the insulation materials by manufacturers. The thermal conductivity of the insulation material will rise along with the amount of metal mixed in the material. Meanwhile, the mass density of the potting material will become larger as shown in Table 7. Due to the large mass density of the potting material, the influence produced by the potting materials on power weight ratio reached 60.08%. The thickness of the fins, the height of the fins and the spacing of the fins all directly influence the housing weight which accounts for a large proportion of the total weight. Therefore, the structure of the fins makes a big difference to the power weight ratio of the motor as shown in Table 11 and Figure 4.
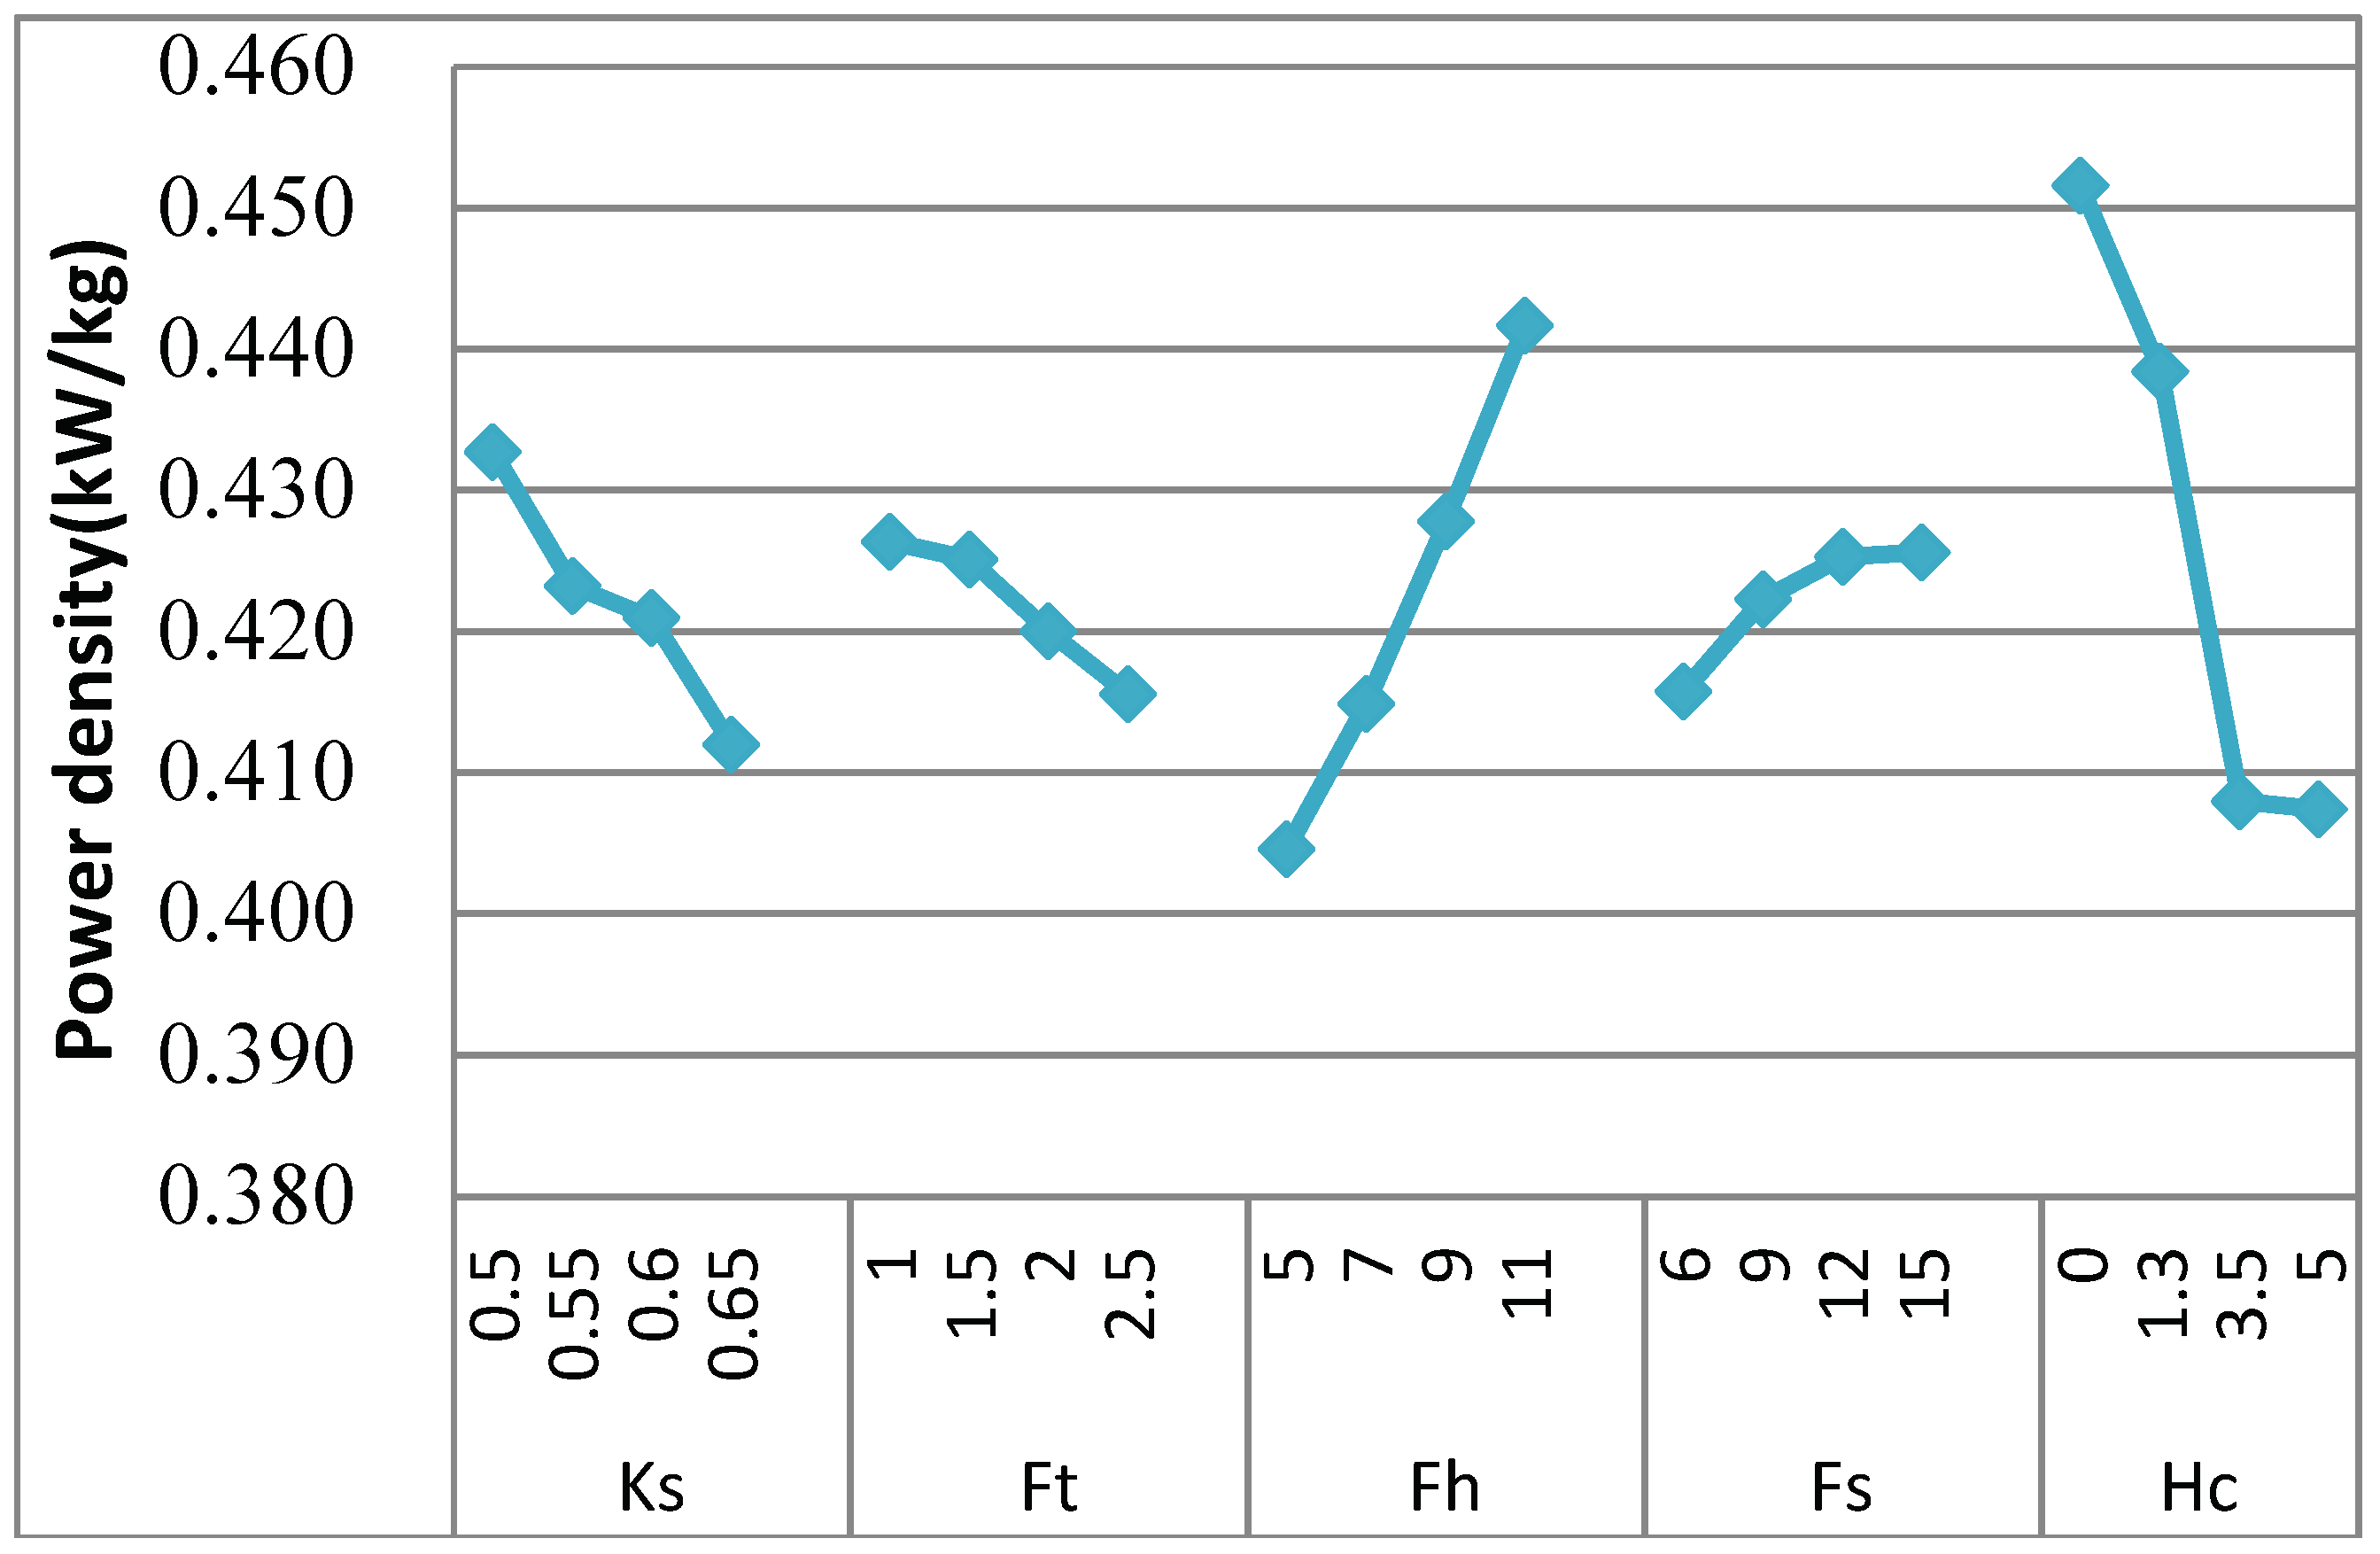
The variation of the average winding temperature with the optimization parameters is shown in Figure 5. The increase in the slot fill factor will lead to an enlargement of the copper area. Consequently, the equivalent conductivity of slot will increase as well as the weight of winding, which is shown in Figure 5 and Figure 6. The thermal resistance between the housing and the end winding will decrease with the rise of the potting material’s thermal conductivity. As a result, the average temperature of the winding will be on a decline, as shown in Figure 5. Since the structure of the fins is closely related to the fluid state, it has a nonlinear influence on temperature rise as shown in Figure 5. It can be seen from Figure 5 and Figure 6 that the optimal variables had a different influence on the average winding temperature and the power weight ratio. For example, the average winding temperature decreased with the increase of the slot fill factor. However, the power weight ratio decreased while the slot fill factor increased. It can be seen that it is difficult to select a combination of parameters that can achieve a high power weight ratio and low average winding temperature.
3.2. Multi-Objective Optimization Design
Nowadays, the conventional method is to assign different weight coefficients for each optimized objective, and transform the multi-objective problem into a single objective problem that only contains one compound objective function [18,19]. According to this method, a new objective function is defined by combining the objectives with the weight coefficients [18], and it is expressed as follows:
where f1(x), f2(x) represent the power weight ratio and the average winding temperature respectively. If the average winding temperature becomes smaller while the power weight ratio of the motor grows higher, the performance of the motor will be improved. That is to say, a small value of F is required since it means a better performance of the motor. i, j are the weight coefficients of the objectives. The weight coefficients are usually assigned based on the importance of the different objectives. Since the average winding temperature and the power weight ratio are of equal importance during the optimization process, the weight coefficients are assigned as i = 1 and j = 1. According to Table 10 and Equation (13) the multi-objectives optimal design process applied to Taguchi can be described as in Figure 7 described and the results are shown in Table 12:
From Table 12 and Figure 8 it can be seen that the motor achieved its best performance when Ks = 0.65, Ft = 1, Fh = 11, Fs = 9, Hc = 0. Under these parameters, the average winding temperature, weight and power weight ratio of the motor were calculated and the results are listed in Table 13.
Table 13 compares the optimal motor with the initial motor in the structure parameters and the output performance. Due to the increase of the slot fill factor, the copper loss of the winding was decreased and the equivalent thermal conductivity of slot was enhanced. The structure of fins was optimized and the housing convection g improved as a consequence. As a result, the average winding temperature was reduced from 166.4 °C to 156.4 °C, as shown in Table 13. The length of the end winding was smaller and the loss of the end winding was reduced. The potting materials had little influence on the temperature of winding as shown in Figure 8. However, since the mass density of the potting material was large, the potting material had a great influence on the power weight ratio of the motor as shown in Figure 8. With the improvement of the heat dissipation structure, the power weight ratio increases from 0.396 kW/kg to 0.434 kW/kg. After optimization, both the temperature rise and the power weight ratio of the motor improved. The optimization result was particularly obvious.
4. Finite Element Simulation Analysis and Experimental Verification
The multi-objective optimization design of PMSM’s heat dissipation structure is based on the thermal network calculation. However the thermal network calculation is based on the simplified model which assumes that the temperature distribution of the motor is uniform. In order to validate the thermal network calculation and the multi-objectives optimal design, a more accurate thermal analysis based on a 3-D finite element analysis was carried out.
The conductivity of some parts of the motor is uniform such as the magnet, wedge and potting materials, rotor yoke, housing and rear endcap. However, the conductivity of multilayered components such as the stator core, winding in slot and end winding is non-uniform. The equivalent thermal conductivity heq of these parts can be calculated as follows [20]:
where is the equivalent thermal conductivity, is the thickness of the material and is the thermal conductivity of the material.
The convective heat transfer coefficient in the fins of the housing, air gap and endcap can be calculated by Equations (4)–(8).Then the heat conductivity used in the 3-D steady state thermal analysis is listed in Table 14.
Then, based on the above parameters, the steady state thermal analysis of the initial motor and the optimal motor were carried out when the motor was running at 6000 rpm and the output torque was 10 N·m. The ambient temperature was 30 °C. The results are shown as follows:
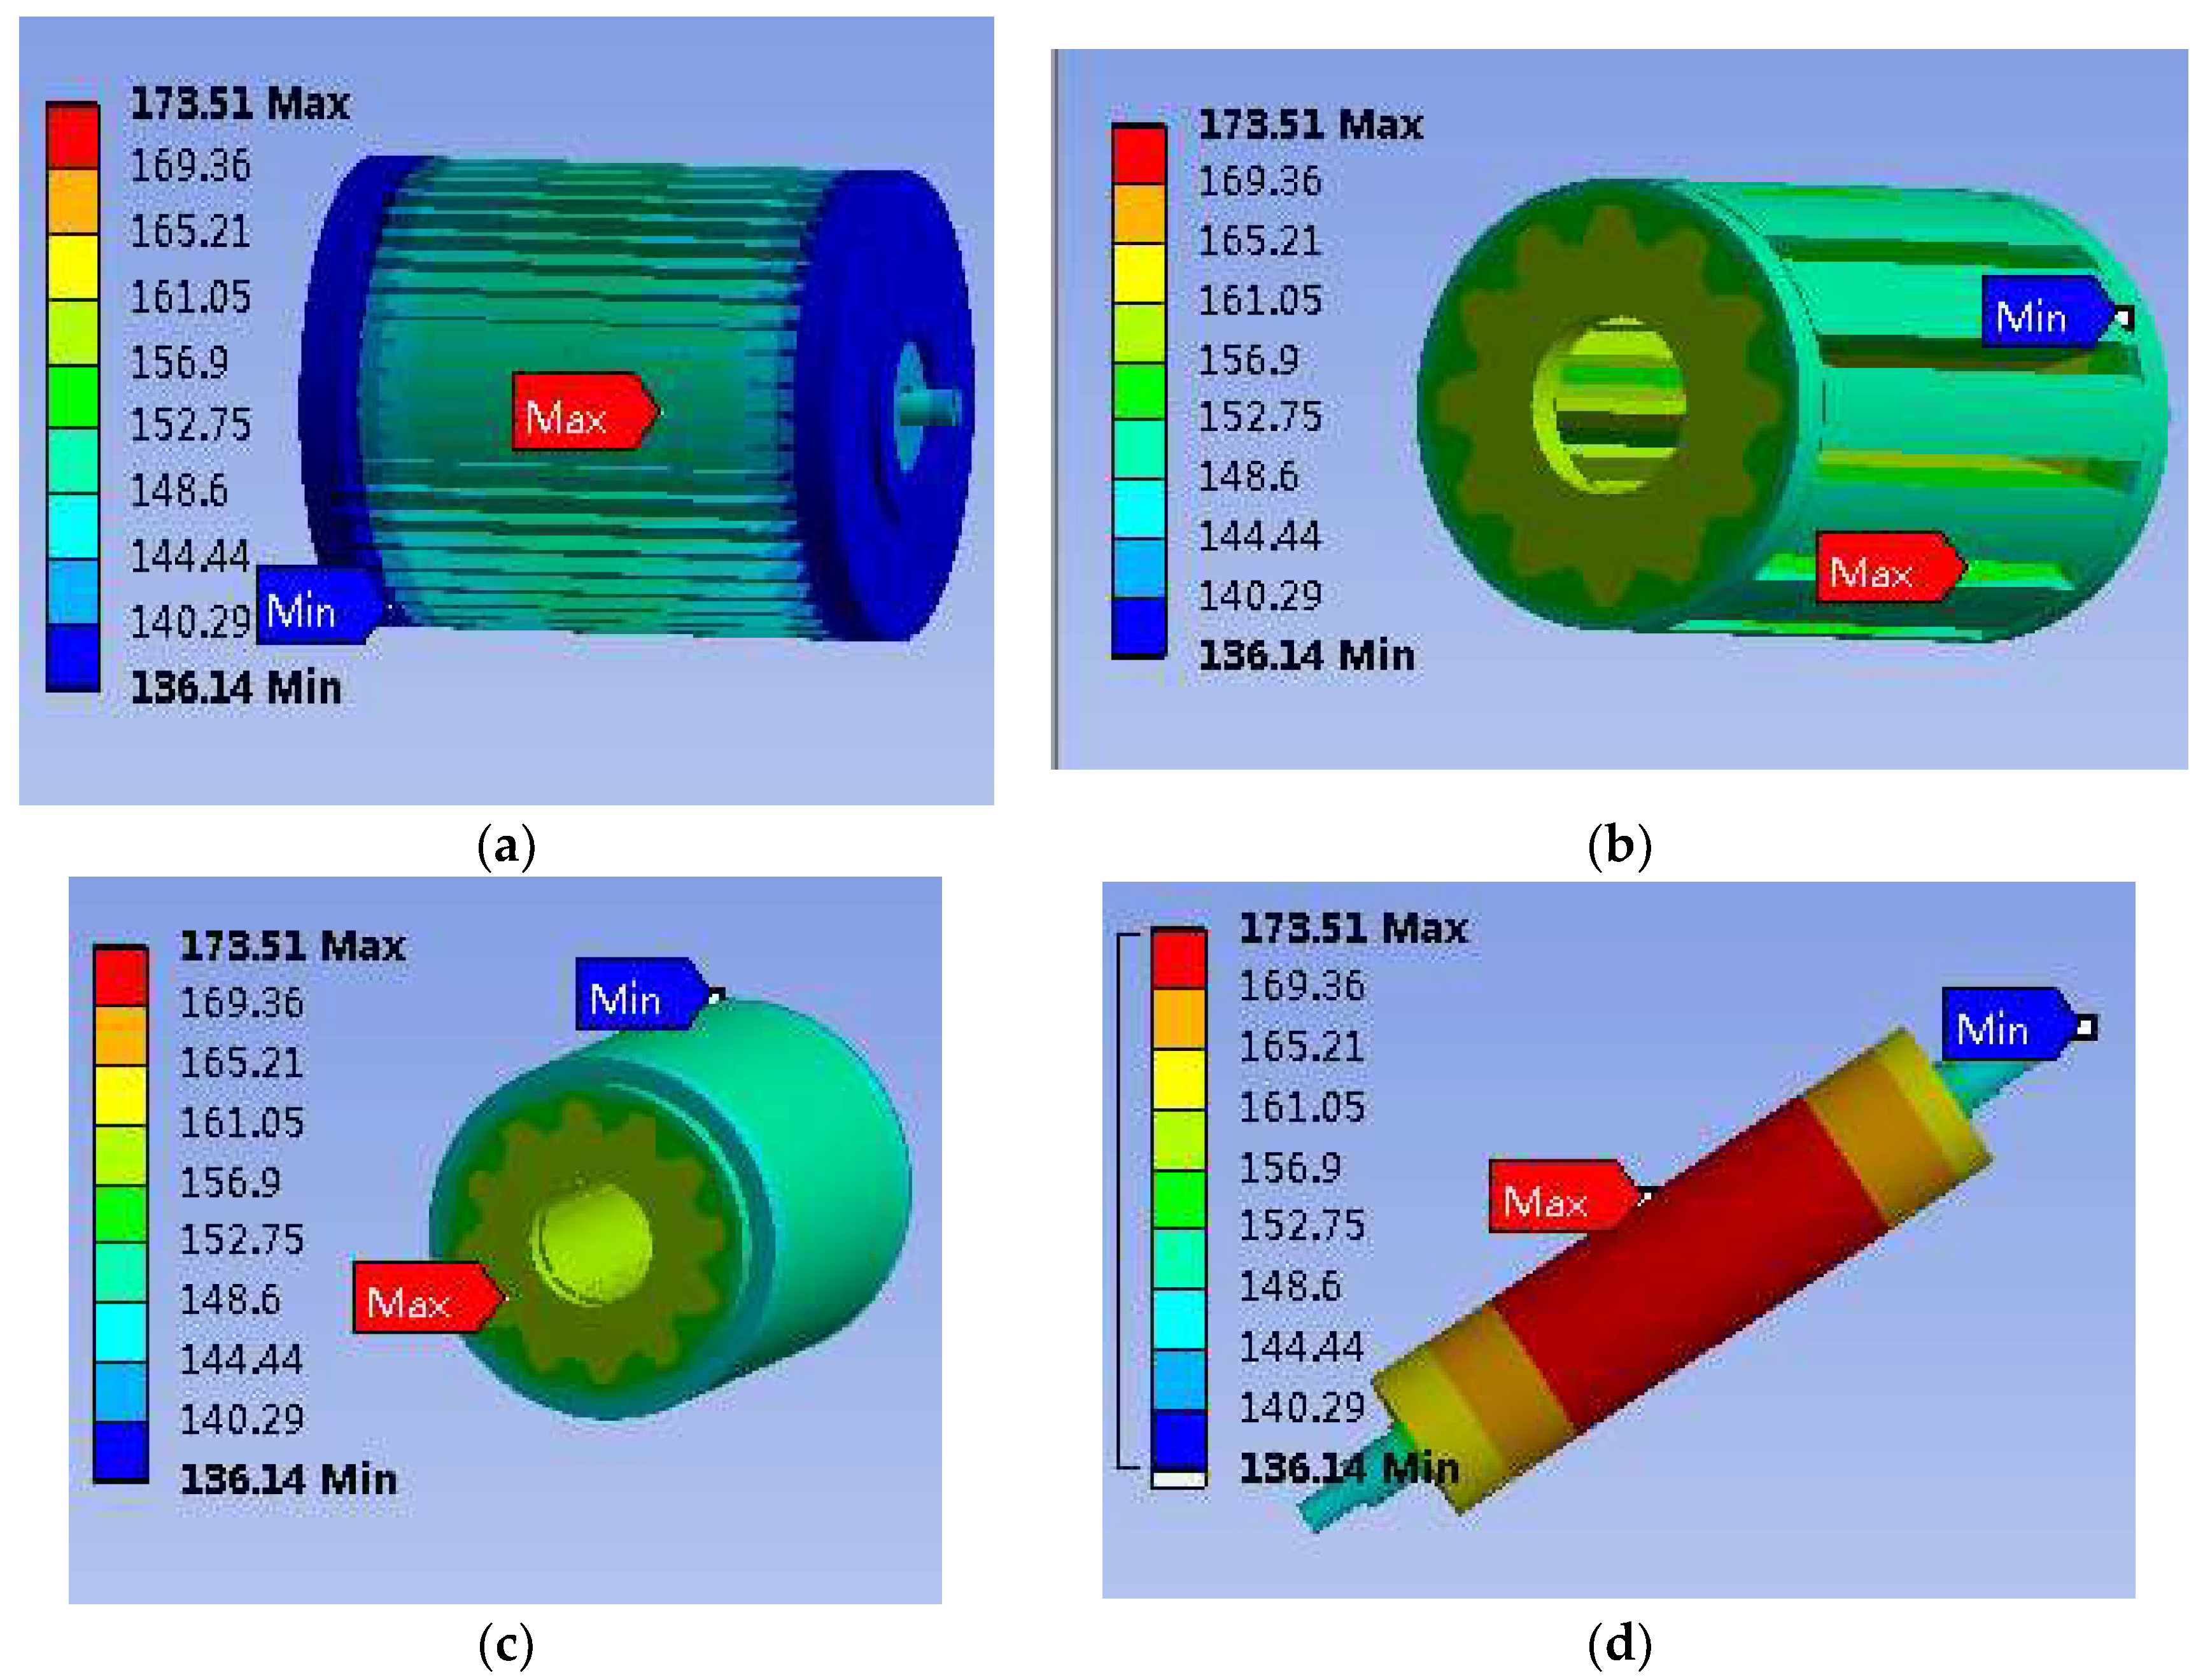
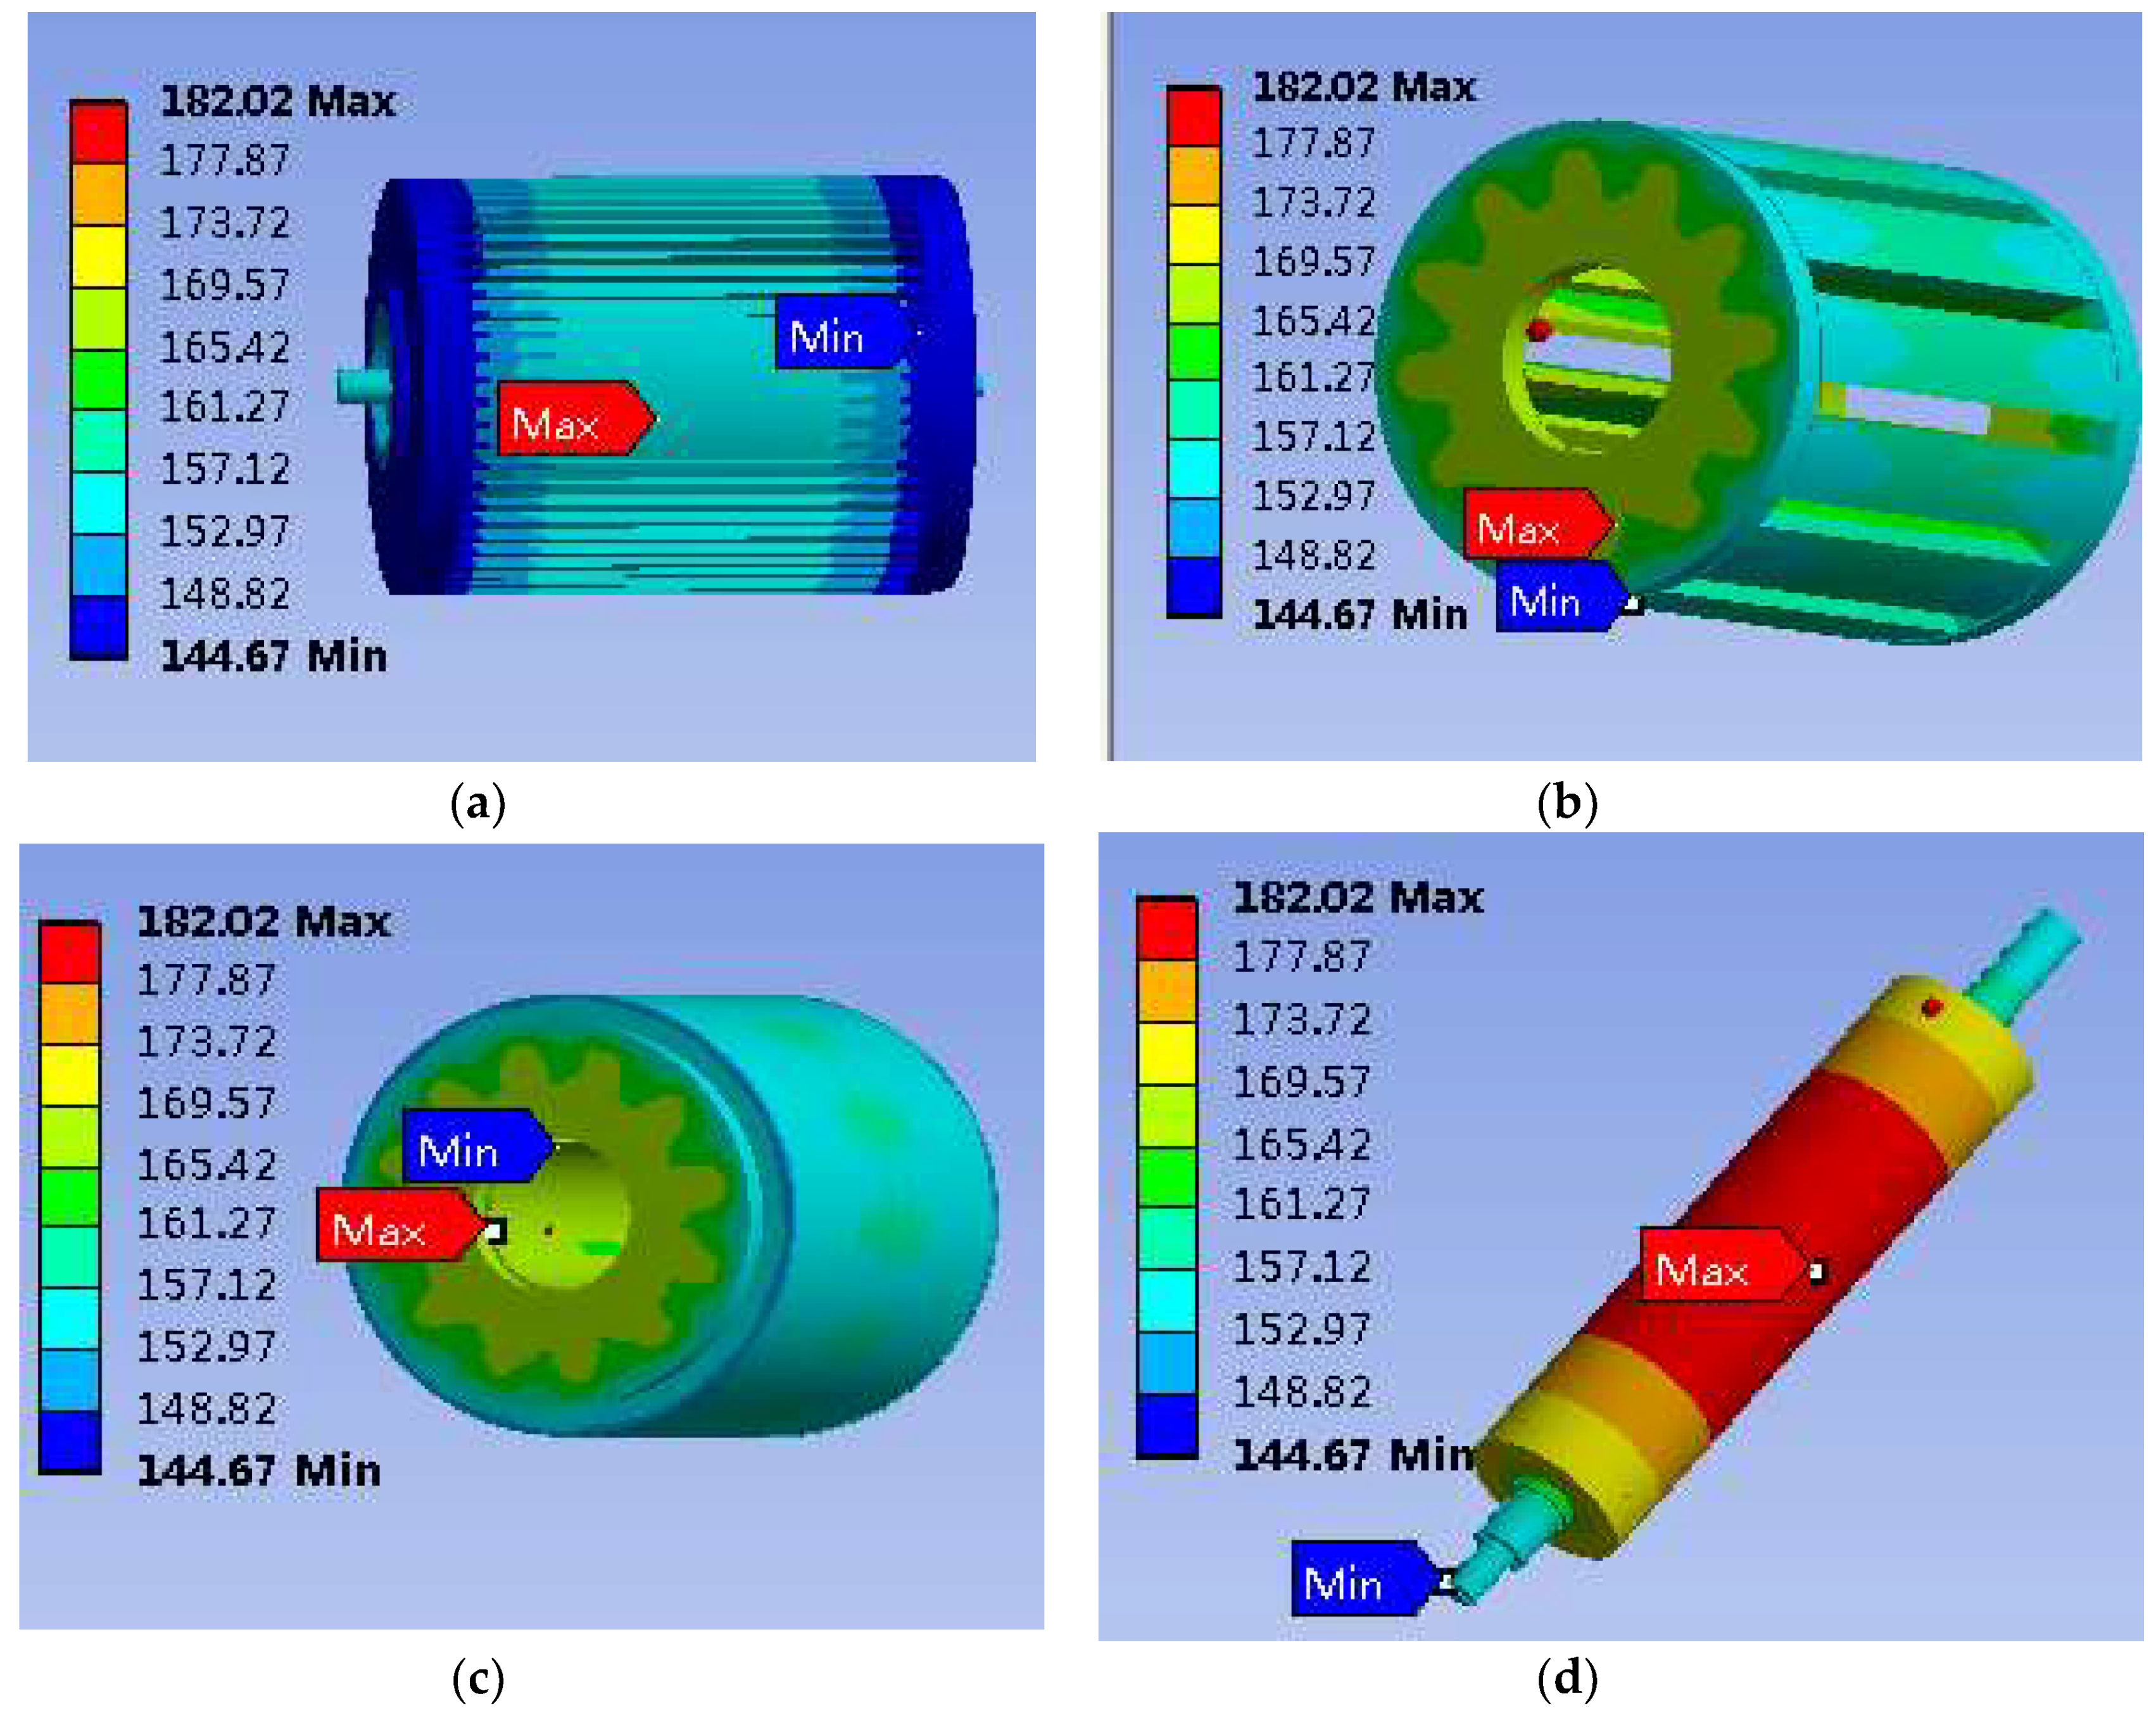
Figure 9 and Figure 10 are the temperature distribution of the initial motor and the optimal motor when the motor is running at a full load, respectively. Due to the poor convection in the air gap, the magnets are the hottest parts in the two motors as shown in Figure 9d and Figure 10d. Thanks to the short length of non-overlap winding, the loss of end winding was small. Therefore the heat dissipation from the front and rear of the housing are small and the temperature of these two parts are the coolest. As the conductivity of the multilayered components such as the stator core, winding in slot and end winding is orthotropic, the temperature distribution of these components is non-uniform as shown in Figure 9 and Figure 10. After being optimized, the copper loss of the motor was reduced from 84.2 W to 63.46 W and the convection of the fins was improved, as a consequence, the average winding temperature of was reduced to 158.6 °C from 168.4 °C. Therefore, the optimal design was successful.
The temperature comparison of the prototype machine and optimal machine calculated by FEA and a thermal network are shown in Figure 11. It can be seen that there are differences between the results calculated by FEA and the thermal network. The temperature of the motor calculated by FEA is smaller than the temperature calculated by the thermal network due to the fact the contact heat resistance is not considered during the FEA. The temperature of permanent magnet is the highest in all analysis parts due to the poor heat dissipation condition. The heat generated by eddy current loss of the permanent magnet can only dissipate through the weak heat convection at the shaft end and the small air convection in the air gap. Therefore, the temperature of permanent magnet should be mainly considered in the process of heat dissipation structure design and electromagnetic calculation, so as to prevent irreversible damage of permanent magnet due to over temperature. In order to control the temperature of permanent magnet, the magnet of each pole was divided into five parts to reduce the loss of permanent magnet caused by eddy current during the electrical magnet calculation. Furthermore, the samarium cobalt permanent magnet with good high-temperature properties was applied in this motor to prevent irreversible at high temperature.
5. Experimental Verification
In order to validate the optimal design a prototype machine was manufactured according to the final optimization results. The machine prototype is shown in Figure 12. To verify the optimization results, the experimental platform based on the designed PMSM was established as shown in Figure 13, including the PMSM, drive controller, dynamometer, power analysis instrument, power supply, and CAN bus demonstration. The average temperature of the winding was measured by two temperature sensors PT100 which were buried in the slot of the motor as shown in Figure 12. Then the temperature rise experiment was carried out when the motor was running at 6000 rpm and the output torque was 10N·m. The temperature of the environment was 20 °C. The temperatures of the two test points after a 30 min working time are shown in Figure 14.
As the difference between the two test points was very small, than the temperature of test point 1 is shown in Figure 14. It can be seen that there was a discrepancy between the test results and the transient thermal analysis by FEA. The temperature of test point 1 was larger than the results of transient thermal analysis. In the transient thermal analysis, there were assumptions and many factors that were not considered in the calculation such as the airgap between the housing and the stator core, stator core and winding. The model of transient thermal analysis was not full consistent with the actual motor. Therefore, there were errors between the theoretical analyses and the experimental results. Furthermore, the focus of this paper was on the optimal design method of heat dissipation for low temperature rise and low weight. Therefore, the small error between the theoretical analyses and experimental had little influence on the optimal design.
6. Conclusions
This paper proposed a novel multi-objective optimal design of a heat dissipation structure for an EHA driving motor to achieve a low temperature rise and low weight. A thermal network model of the motor for thermal calculation was developed. To improve the cooling performance, the parameters such as slot fill factor, thickness of the fins, height of the fins, space of the fins, and potting materials were selected as optimal variables, and then a sensitivity analysis of these parameters affecting the cooling performance of the motor was conducted. Through the parametric analysis, a conclusion was reached where the slot fill factor had the biggest influence on the average temperature of the winding and the potting materials had the biggest influence on the weight of the motor.
Next, the Taguchi method was applied to search for the optimal combination of design variables. As a result, the average temperature of the windings was reduced and the power weight ratio of the motor had been increased. The average temperature of windings was reduced to 156.4 °C from 166.4 °C. Meanwhile the power weight ratio of this motor had been increased to 0.434 kW/kg from 0.396 kW/kg. The performance of the optimal motor was verified by 3D finite element analysis. Furthermore, one prototype machine was manufactured and the experiments provided further verification.
Author Contributions
G.H. and T.W. conceive and design the experiment. T.W. and X.D. analyzed the data. T.W. and C.D. wrote the paper.
Conflicts of Interest
The authors declare no conflict of interest.
References
- Qi, H.T.; Fu, Y.L.; Qi, X.Y.; Lang, Y. Architecture optimization of more electric aircraft actuation system. Chin. J. Aeronaut. 2011, 24, 506–513. [Google Scholar] [CrossRef]
- Churn, P.M.; Maxwell, C.J.; Schofield, N.; Howe, D. Electro-hydraulic actuation of primary flight control surfaces. In Proceedings of the IEE Colloquium on All Electric Aircraft (Digest No. 1998/260), London, UK, 17 June 1998. [Google Scholar]
- Guo, H.; Wu, Z.; Qian, H.; Sun, Z. Robust design for the 9-slot 8-pole surface-mounted permanent magnet synchronous motor by analytical method-based multi-objectives particle swarm optimisation. IET ELECTR. POWER APPL. 2016, 10, 117–124. [Google Scholar] [CrossRef]
- Ding, X.; Liu, G.; Du, M.; Guo, H.; Duan, C.; Qian, H. Efficiency Improvement of Overall PMSM-Inverter System Based on Artificial Bee Colony Algorithm Under Full Power Range. IEEE Trans. Magn. 2016, 52, 8106904. [Google Scholar] [CrossRef]
- Li, K.; Zhang, C.; Cui, N. Study of High Dynamic Response Strategy for Electric Vehicle Drive. Trans. China Electro-Tech. Soc. 2007, 22, 41–47. [Google Scholar]
- Dong, H.L.; Lee, M.Y.; Lee, H.S.; Kim, S.C. Performance Evaluation of an in-Wheel Motor Cooling System in an Electric Vehicle/Hybrid Electric Vehicle. Energies 2014, 7, 961–971. [Google Scholar]
- Galea, M.; Gerada, C.; Raminosoa, T.; Wheeler, P. A Thermal Improvement Technique for the Phase Windings of Electrical Machines. IEEE Trans. Ind. Appl. 2012, 48, 79–87. [Google Scholar] [CrossRef]
- Ding, X.; Du, M.; Duan, C.; Guo, H.; Xiong, R.; Xu, J.; Cheng, J.; Kwong Luk, P.C. Analytical and Experimental Evaluation of SiC-inverter Nonlinearities for Traction Drives Used in Eletric Vehicles. IEEE Trans. Veh. Technol. 2018, 67, 146–159. [Google Scholar] [CrossRef]
- Hoerber, J.; Mueller, M.; Franke, J.; Ranft, F.; Heinle, C.; Drummer, D. Assembly and interconnection technologies for MID based on thermally conductive plastics for heat dissipation. In Proceedings of the 34th International Spring Seminar on ElectronicsTechnology, Tratanska Lomnica, Slovakia, 11–15 May 2011; pp. 103–108. [Google Scholar]
- Yao, Y.; Gu, L.; Fan, T.; Sun, W.; Luo, J. Evaluation of heat transfer characteristic of aluminum nitride (AlN) potting compound for the end windings of permanent magnet synchronous machines. In Proceedings of the International Conference on Electrical and Control Engineering, Yichang, China, 16–18 September 2011; pp. 4498–4501. [Google Scholar]
- Polikarpova, M.; Lindh, P.; Gerada, C.; Rilla, M.; Naumanen, V. Thermal effects of stator potting in an axial-flux permanent magnet synchronous generator. Appl. Therm. Eng. 2015, 75, 421–429. [Google Scholar] [CrossRef]
- Kim, K.C.; Lee, J.; Kim, H.J.; Koo, D.H. Multiobjective optimal design for interior permanent magnet synchronous motor. IEEE Trans. Magn. 2009, 45, 1780–1783. [Google Scholar]
- Misu, D.; Matsushita, M.; Takeuchi, K.; Oishi, K.; Kawamura, M. Consideration of optimal number of poles and frequency for high-efficiency permanent magnet motor. Power Electron. Conf. 2014, 2011, 3012–3017. [Google Scholar]
- Ding, X.; Du, M.; Zhou, T.; Guo, H.; Zhang, C. Comprehensive comparison between silicon carbide MOSFETs and silicon IGBTs based traction systems for electric vehicles. Appl. Energy 2017, 194, 626–634. [Google Scholar] [CrossRef]
- Kim, K.S.; Lee, B.H.; Hong, J.P. Improvement of Thermal Equivalent Circuit Network and Prediction on Heat Characteristic of Motor by Calculation of Convection Heat Transfer Coefficient. In Proceedings of the 2012 Sixth International Conference on Electromagnetic Field Problems and Applications (ICEF), Dalian, China, 19–21 June 2012; pp. 1–4. [Google Scholar]
- Staton, D.A.; Cavagnino, A. Convection Heat Transfer and Flow Calculations Suitable for Electric Machines Thermal Models. IEEE Trans. Ind. Electron. 2008, 55, 3509–3516. [Google Scholar] [CrossRef]
- Howey, D.A.; Childs, P.R.N.; Holmes, A.S. Air-Gap Convection in Rotating Electrical Machines. IEEE Trans. Ind. Electron. 2011, 59, 1367–1375. [Google Scholar] [CrossRef]
- Vaez-Zadeh, S.; Isfahani, A.H. Multiobjective design optimization of air-core linear permanent-magnet synchronous motors for improved thrust and low magnet consumption. IEEE Trans. Magnet. 2006, 42, 446–452. [Google Scholar] [CrossRef]
- Li, L.; Tang, Y.; Liu, J.; Pan, D. Application of the Multiple Population Genetic Algorithm in Optimum Design of Air-Core Permanent Magnet Linear Synchronous Motors. Proc. CSEE 2013, 33, 69–77. [Google Scholar]
- Rehman, Z.; Seong, K. Three-D Numerical Thermal Analysis of Electric Motor with Cooling Jacket. Energies 2018, 11, 92. [Google Scholar] [CrossRef]
Figure 1.
The initial motor structure.

Figure 2.
The model of the thermal network.

Figure 3.
A motor slot.

Figure 4.
Proportion of influences produced by the optimal variables on the average temperature of winding and power weight ratio.
Figure 4.
Proportion of influences produced by the optimal variables on the average temperature of winding and power weight ratio.

Figure 5.
The effect of the main factors on the average temperature of winding.

Figure 6.
The effect of the main factors on the power weight ratio.

Figure 7.
The flow chart of the multi-objective optimal design process of this motor and the flowchart of the optimal design by Taguchi.
Figure 7.
The flow chart of the multi-objective optimal design process of this motor and the flowchart of the optimal design by Taguchi.

Figure 8.
The variation of the value of F function with the variable.

Figure 9.
Temperature distribution of the optimal motor, (a) Temperature distributon of motor; (b) Temperature distributon of motor winding; (c) Temperature distributon of stator; (d) Temperature distributon of rotor.
Figure 9.
Temperature distribution of the optimal motor, (a) Temperature distributon of motor; (b) Temperature distributon of motor winding; (c) Temperature distributon of stator; (d) Temperature distributon of rotor.

Figure 10.
Temperature distribution of the initial motor, (a) Temperature distributon of motor; (b) Temperature distributon of motor winding; (c) Temperature distributon of stator; (d) Temperature distributon of rotor.
Figure 10.
Temperature distribution of the initial motor, (a) Temperature distributon of motor; (b) Temperature distributon of motor winding; (c) Temperature distributon of stator; (d) Temperature distributon of rotor.

Figure 11.
Temperature comparison of prototype machine and optimal machine calculated by FEA and thermal network.
Figure 11.
Temperature comparison of prototype machine and optimal machine calculated by FEA and thermal network.

Figure 12.
The optimized motor prototype.

Figure 13.
The load test bench of the motor.

Figure 14.
Temperature comparison.


Table 1.
Main parameters of the original motor.
| Parameter | Value | Parameter | Value |
|---|---|---|---|
| Input voltage (Vdc) | 270 | Slot height (mm) | 35 |
| Output power (kW) | 6.28 | Airgap length (mm) | 1 |
| Rated speed (rpm) | 6000 | Magnet thickness (mm) | 4.5 |
| Rated torque (Nm) | 10 | embrace | 0.85 |
| Pole pairs | 4 | Current density: (A/mm2) | 6.3 |
| Stator out diameter (mm) | 132 | Efficiency | 94.5 |
| Stator inner diameter (mm) | 46 | Armature Phase Resistance (Ω) | 0.03588 |
| Stator core length (mm) | 160 | D-Axis Inductance (mH) | 0.86 |
| Tooth width (mm) | 9 | Moment of inertia (kg·m2) | 0.00113 |
| Tooth tip height (mm) | 1 | Slot Fill Factor | 0.55 |
| Tooth open width (mm) | 1.5 | Thickness of fins (mm) | 2 |
| Stacking factor of stator core | 0.95 | Height of fins (mm) | 7 |
| Housing diameter (mm) | 163 | Space of fins (mm) | 6 |
| Thermal conductivity of potting material (W/m·K) | 1.3 | Potting material: | TC213 |
Table 2.
The loss of the initial EHA driving motor.
| Parameters | Value (Slot Fill Factor is 0.55) |
|---|---|
| Copper loss of winding (W) | 12.53 |
| Copper loss of end winding (W) | 63.9 |
| Iron loss in the slot yoke (W) | 58.18 |
| Iron loss in the stator tooth (W) | 103.82 |
| The loss at magnet (W) | 47 |
Table 3.
The description of thermal resistance.
| Parameters | Values (C/W) | Description |
|---|---|---|
| R0 | 1.43 | Resistance due to convection between fins and air |
| R1 | 0.00118 | Resistance due to radial heat conduction between housing and fin |
| R2 | 0.0017 | Resistance due to radial heat conduction between housing and stator yoke |
| R3 | 0.019 | Resistance due to radial heat conduction between stator yoke and stator tooth |
| R4 | 0.718 | Resistance due to convection in air gap |
| R5 | 0.0274 | Resistance due to radial heat conduction between magnet and rotor yoke |
| R6 | 0.0236 | Resistance due to radial heat conduction between shaft and rotor yoke |
| R7 | 0.837 | Resistance due to radial heat conduction between winding and stator yoke |
| R8 | 0.086 | Resistance due to axial heat conduction between winding and stator tooth |
| R9 | 0.0019 | Resistance due to axial heat conduction between winding and end winds |
| R10 | 1.26 | Resistance due to axial heat conduction between end winding and HC |
| R11 | 2.529 | Resistance due to radial heat conduction between housing and HC |
| R12 | 0.0817 | Resistance due to radial heat conduction between housing and endcap front |
| R13 | 1.26 | Resistance due to axial heat conduction between endcap front and HC |
| R14 | 8.71 | Resistance due to convection between endcap front and air |
| R15 | 4.78 | Resistance due to radial heat conduction between endcap front and bearing |
| R16 | 4.78 | Resistance due to radial heat conduction between shaft and bearing |
| R17 | 1060.78 | Resistance due to convection between shaft and air |
| R18 | 0.815 | Resistance due to radial heat conduction of shaft |
Table 4.
Physical properties of the motor materials.
| Materials | Thermal Conductivity (W/m·K) | Density (kg/m3) |
|---|---|---|
| Aluminum alloy | 203 | 2790 |
| Laminated core pack (radial) | 46 | 7650 |
| Copper | 386 | 8933 |
| Permanent-magnet | 10 | 8300 |
| Stainless steel | 60.6 | 7650 |
| Epoxy resin | 0.2 | 1700 |
| Varnish | 0.2 | 1400 |
| Slot liner | 0.2 | 700 |
| Potting material TC213 | 1.3 | 1900 |
Table 5.
Natural convection correlation coefficients parameters.
| Shape | a | b |
|---|---|---|
| Horizontal cylinder | 0.525 | 0.25 |
| Vertical flat plate | 0.59 | 0.25 |
Table 6.
Optimal parameters and the constraints of the motor.
| Ks | Ft (mm) | Fh (mm) | Fs (mm) | Hc (W/m·K) | |
|---|---|---|---|---|---|
| Level 1 | 0.5 | 1 | 5 | 6 | 0 |
| Level 2 | 0.55 | 1.5 | 7 | 9 | 1.3 |
| Level 3 | 0.6 | 2 | 9 | 12 | 3.5 |
| Level 4 | 0.65 | 2.5 | 11 | 15 | 5 |
Table 7.
The properties of potting material.
| Material | Thermal Conductivity (W/m·K) | Density (g/cm3) | Dielectric Strength (kV/mm) | Continuous Temperature |
|---|---|---|---|---|
| TC213 | 1.3 | 1.95 | 14 | −60–200 °C |
| TC235 | 3.5 | 3.1 | 14 | −60–200 °C |
| TGG550 | 5 | 3.2 | 4.5 | −60–200 °C |
Table 8.
Experimental arrays and results of thermal network calculation.
| No | Ks | Ft (mm) | Fh (mm) | Fs (mm) | Hc (W/m·K) | Copper Loss (W) | Iron Loss (W) | (°C) | Wm (kg) | Pd (kW/kg) |
|---|---|---|---|---|---|---|---|---|---|---|
| 1 | 0.5 | 1 | 5 | 6 | 0 | 84.2 | 173 | 165.1 | 14.21 | 0.442 |
| 2 | 0.5 | 1.5 | 7 | 9 | 1.3 | 84.2 | 173 | 165.5 | 14.67 | 0.428 |
| 3 | 0.5 | 2 | 9 | 12 | 3.5 | 84.2 | 173 | 164.1 | 14.78 | 0.425 |
| 4 | 0.5 | 2.5 | 11 | 15 | 5 | 84.2 | 173 | 163.1 | 14.4 | 0.436 |
| 5 | 0.55 | 1 | 7 | 12 | 5 | 76.4 | 173 | 160.2 | 15.38 | 0.408 |
| 6 | 0.55 | 1.5 | 5 | 15 | 3.5 | 76.4 | 173 | 167.6 | 15.8 | 0.398 |
| 7 | 0.55 | 2 | 11 | 6 | 1.3 | 76.4 | 173 | 166.2 | 14.48 | 0.434 |
| 8 | 0.55 | 2.5 | 9 | 9 | 0 | 76.4 | 173 | 162.2 | 13.85 | 0.453 |
| 9 | 0.6 | 1 | 9 | 15 | 1.3 | 69 | 173 | 159.1 | 14.48 | 0.434 |
| 10 | 0.6 | 1.5 | 11 | 12 | 0 | 69 | 173 | 162.5 | 13.2 | 0.476 |
| 11 | 0.6 | 2 | 5 | 9 | 5 | 69 | 173 | 160.3 | 16.25 | 0.386 |
| 12 | 0.6 | 2.5 | 7 | 6 | 3.5 | 69 | 173 | 167.5 | 16.18 | 0.388 |
| 13 | 0.65 | 1 | 11 | 9 | 3.5 | 63. | 173 | 147.9 | 14.90 | 0.421 |
| 14 | 0.65 | 1.5 | 9 | 6 | 5 | 63 | 173 | 155.1 | 15.73 | 0.399 |
| 15 | 0.65 | 2 | 7 | 15 | 0 | 63 | 173 | 161.7 | 14.43 | 0.435 |
| 16 | 0.65 | 2.5 | 5 | 12 | 1.3 | 63 | 173 | 156.5 | 16 | 0.392 |
Table 9.
Average value of optimal objectives.
| Optimal Objectives | Average Value |
|---|---|
| Ta (°C) | 161.66 |
| Wm (kg) | 14.92 |
| Pd (kW/kg) | 0.42 |
Table 10.
Average values of performance under each level of factor variable index.
| Variable | Level of Each Factor | (°C) | Wm (kg) | Pd (kW/kg) |
|---|---|---|---|---|
| Ks | 0.5 | 164.45 | 14.52 | 0.433 |
| 0.55 | 164.05 | 14.88 | 0.423 | |
| 0.6 | 162.35 | 15.03 | 0.421 | |
| 0.65 | 155.3 | 15.27 | 0.412 | |
| Ft | 1 | 158.08 | 14.74 | 0.426 |
| 1.5 | 163.18 | 14.85 | 0.425 | |
| 2 | 163.08 | 14.99 | 0.42 | |
| 2.5 | 162.33 | 15.11 | 0.416 | |
| Fh | 5 | 162.88 | 15.57 | 0.405 |
| 7 | 163.73 | 15.17 | 0.415 | |
| 9 | 160.13 | 14.71 | 0.428 | |
| 11 | 159.93 | 14.25 | 0.442 | |
| Fs | 6 | 163.48 | 15.15 | 0.416 |
| 9 | 158.98 | 14.92 | 0.422 | |
| 12 | 160.83 | 14.84 | 0.425 | |
| 15 | 163.38 | 14.78 | 0.426 | |
| Hc | 0 | 162.88 | 13.92 | 0.452 |
| 1.3 | 162.41 | 14.36 | 0.438 | |
| 3.5 | 162.28 | 15.42 | 0.408 | |
| 5 | 159.68 | 15.44 | 0.407 |
Table 11.
Proportion of influences produced by various factors on motor performance.
| Variable | (°C) | Wm (kg) | Pd (kW/kg) | |||
|---|---|---|---|---|---|---|
| SS | Proportion | SS | Proportion | SS | Proportion | |
| Ks | 163.09 | 52.30% | 0.89 | 9.11% | 0.000401 | 5.01% |
| Ft | 52.96 | 16.98% | 0.23 | 2.39% | 0.000233 | 2.91% |
| Fh | 33.51 | 10.74% | 2.92 | 29.86% | 0.002349 | 29.35% |
| Fs | 42.61 | 13.66% | 0.24 | 2.43% | 0.000212 | 2.65% |
| Hc | 19.68 | 6.31% | 5.5 | 56.21% | 0.004809 | 60.08% |
Table 12.
Average values of the optimal objectives under each level of all optimal design variables.
Table 12.
Average values of the optimal objectives under each level of all optimal design variables.
| Variable | Level of Each Variable | (°C) | Pd (kW/kg) | F |
|---|---|---|---|---|
| Ks | 0.5 | 164.45 | 0.433 | 380.05 |
| 0.55 | 164.05 | 0.423 | 387.59 | |
| 0.6 | 162.35 | 0.421 | 385.62 | |
| 0.65 | 155.3 | 0.412 | 376.92 | |
| Ft | 1 | 158.08 | 0.426 | 370.74 |
| 1.5 | 163.18 | 0.425 | 383.80 | |
| 2 | 163.08 | 0.42 | 388.24 | |
| 2.5 | 162.33 | 0.416 | 390.61 | |
| Fh | 5 | 162.88 | 0.405 | 402.58 |
| 7 | 163.73 | 0.415 | 394.59 | |
| 9 | 160.13 | 0.428 | 374.30 | |
| 11 | 159.93 | 0.442 | 362.06 | |
| Fs | 6 | 163.48 | 0.416 | 393.20 |
| 9 | 158.98 | 0.422 | 376.45 | |
| 12 | 160.83 | 0.425 | 378.12 | |
| 15 | 163.38 | 0.426 | 383.87 | |
| Hc | 0 | 162.88 | 0.452 | 360.65 |
| 1.3 | 162.41 | 0.438 | 370.41 | |
| 3.5 | 162.28 | 0.408 | 397.76 | |
| 5 | 159.68 | 0.407 | 391.93 |
Table 13.
Comparison of the results of the initial motor and the optimal motor.
| Parameters | The Initial Motor | The optimal motor |
|---|---|---|
| (°C) | 166.4 | 156.4 |
| Wm (kg) | 15.85 | 14.45 |
| Pd (kW/kg) | 0.396 | 0.434 |
| Copper loss (W) | 76.3 | 63.2 |
| Ks | 0.55 | 0.65 |
| Ft | 2 | 1 |
| Fh | 7 | 11 |
| Fs | 6 | 9 |
| Hc | 1.3 | 0 |
Table 14.
Parameters used in the steady stator thermal analysis.
| Parameters | Initial Motor | Optimal Motor | ||
|---|---|---|---|---|
| Thermal conductivity (W/m·K) | radial | axial | radial | axial |
| Equivalent conductivity of winding in slot | 0.5997 | 401 | 0.7419 | 401 |
| Equivalent conductivity end winding | 4724 | 401 | 0.577 | 401 |
| Stator lamination | 30 | 4.4647 | 30 | 4.4647 |
| Aluminum (alloy 95) | 186 | 186 | 186 | 186 |
| Epoxy resin | 0.26 | 0.26 | 0.26 | 0.26 |
| Glass fiber | 0.43 | 0.43 | 0.43 | 0.43 |
| Potting material (TC213) | 1.3 | 1.3 | No potting | No potting |
© 2018 by the authors. Licensee MDPI, Basel, Switzerland. This article is an open access article distributed under the terms and conditions of the Creative Commons Attribution (CC BY) license (http://creativecommons.org/licenses/by/4.0/).
Share and Cite
MDPI and ACS Style
Hong, G.; Wei, T.; Ding, X.; Duan, C. Multi-Objective Optimal Design of Electro-Hydrostatic Actuator Driving Motors for Low Temperature Rise and High Power Weight Ratio. Energies 2018, 11, 1173. https://doi.org/10.3390/en11051173
AMA Style
Hong G, Wei T, Ding X, Duan C. Multi-Objective Optimal Design of Electro-Hydrostatic Actuator Driving Motors for Low Temperature Rise and High Power Weight Ratio. Energies. 2018; 11(5):1173. https://doi.org/10.3390/en11051173
Chicago/Turabian StyleHong, Guo, Tian Wei, Xiaofeng Ding, and Chongwei Duan. 2018. "Multi-Objective Optimal Design of Electro-Hydrostatic Actuator Driving Motors for Low Temperature Rise and High Power Weight Ratio" Energies 11, no. 5: 1173. https://doi.org/10.3390/en11051173
Note that from the first issue of 2016, this journal uses article numbers instead of page numbers. See further details here.