Short-Term Load Forecasting for Electric Vehicle Charging Station Based on Niche Immunity Lion Algorithm and Convolutional Neural Network

Department of Economic Management, North China Electric Power University, Baoding 071000, China
*
Author to whom correspondence should be addressed.
Energies 2018, 11(5), 1253; https://doi.org/10.3390/en11051253
Submission received: 20 April 2018
/
Revised: 8 May 2018
/
Accepted: 10 May 2018
/
Published: 14 May 2018
(This article belongs to the Special Issue Short-Term Load Forecasting by Artificial Intelligent Technologies)
Abstract
:Accurate and stable prediction of short-term load for electric vehicle charging stations is of great significance in ensuring economical and safe operation of electric vehicle charging stations and power grids. In order to improve the accuracy and stability of short-term load forecasting for electric vehicle charging stations, an innovative prediction model based on a convolutional neural network and lion algorithm, improved by niche immunity, is proposed. Firstly, niche immunity is utilized to restrict over duplication of similar individuals, so as to ensure population diversity of lion algorithm, which improves the optimization performance of the lion algorithm significantly. The lion algorithm is then employed to search the optimal weights and thresholds of the convolutional neural network. Finally, a proposed short-term load forecasting method is established. After analyzing the load characteristics of the electric vehicle charging station, two cases in different locations and different months are selected to validate the proposed model. The results indicate that the new hybrid proposed model offers better accuracy, robustness, and generality in short-term load forecasting for electric vehicle charging stations.
1. Introduction
The development of the electric vehicle (EV) industry has attracted broad attention from governments, auto manufacturers, and energy enterprises. Electric vehicles are regarded as an effective way to cope with the depletion of fossil energy and increasingly serious environmental pollution [1]. Charging stations, serving as the infrastructure, have been extensively built along with the advance of EVs. However, the volatility, randomness, and intermittence of the load bring new challenges to optimal dispatching and safe operation of power grids [2]. The establishment of a scientific and reasonable short-term load forecasting model for EV charging stations will not only improve the prediction precision for optimal dispatching, but will also promote the rational construction of charging stations, and boost the popularity rate of EVs. Accordingly, focus on the research of load forecasting for EV charging stations is of great significance.
The current methods of load forecasting for EV charging stations can be divided into two parts, namely: statistical approaches and artificial intelligent algorithms. Statistical forecasting models are based on the theory of probability and statistics, such as the Monte Carlo method [3]. Concretely, on the foundation of a residents’ traffic behavior database, the Monte Carlo approach exploits a definite probability distribution function to fit the users’ driving behaviors, and establishes a mathematical model with random probability to forecast the charging time, location, and load demand of EVs in the future [4]. Simple though it is, this kind of method is not suited to address load forecasting for inaccurate estimation, considering the randomly selected distribution parameters [5]. Additionally, Ref. [6] carried out charging load prediction of EVs based on the statistical analysis of vehicle data from the perspective of time and space. In order to simulate the driving patterns of EVs, Ref. [7] outlined an improved charging load calculation model, where charging probability was proposed to illustrate the uncertainty of charging behaviors and kernel density functions. Multidimensional probability distribution functions were utilized to replace deterministic ones, and a random number was generated to present the coupling characteristics of driving discipline. The view of big data was indicated in the literature [8], which calculated the load of every EVs at the charging station, and summed them up; thus, load forecasting results were obtained. Nevertheless, these statistical approaches are criticized by researchers for their weakness of universality, due to the difficulty of parameter determination.
With the rapid development of artificial intelligence (AI) technology, intelligent algorithms, which mainly include artificial neural networks (ANNs) and support vector machines (SVM), are gradually applied to load forecasting of EV charging stations by scholars [9]. Ref. [10] employed back propagation neural network (BPNN) models to predict the daily load curve of EV charging stations, with consideration of various factors. Here, fuzzy clustering analysis based on transfer closure methods was adopted to select the historical load similar to the predicted one as the training samples, so as to improve forecasting accuracy. The drawbacks of BPNN are the existence of many parameters to set, and trapping into the local minimum or over-fitting easily. To address these problems, Ref. [11] studied a short term load forecasting model for EV charging stations on the basis of radial basis function neural networks (RBFNN), and modified it by the use of fuzzy control theory. The results showed that prediction accuracy was further improved. In [12], particle swarm optimization and spiking neural networks were combined to forecast the short term load of EV charging stations. The findings revealed that the prediction accuracy of the proposed model was superior to BPNN. An SVM integrated with genetic algorithms was exploited in short term load forecasting for EV charging stations in [13], which illustrated that it was difficult for SVMs to deal with large-scale training samples and achieve ideal prediction accuracy. The aforementioned algorithms belong to shallow learning with weak ability in processing complex functions, and cannot completely reflect the characteristics of information based on prior knowledge. To this end, deep learning algorithms provide better ways to present data feature by abstracting the bottom feature combination into high-level [14].
At present, deep learning algorithms have been widely applied in various fields, especially in the field of prediction. Ref. [15] executed an advertising click rate prediction method based on a deep convolutional neural network (CNN). This model accomplished feature learning through the simulation of human thinking, and analyzed the role of different features in forecasting. Ref. [16] successfully introduced deep structure networks into ultra short term photovoltaic power predictions. A deep belief network with restricted Boltzmann machine was presented to extract deep features to finish the unsupervised learning, and the supervised BPNN was taken as the conventional fitting layer to obtain the forecasting results. Ref. [17] built deep CNN for bioactivity prediction of small molecules in drug discovery applications. These studies have demonstrated that deep learning algorithms have better prediction accuracy in comparison to shallow learning. CNN allows the existence of deformed data and reduces parameters through local connection and weight sharing; thus, forecasting precision and efficiency can be greatly improved [18]. As a result, CNN is selected as the prediction model in this paper. Notably, the fitting accuracy of CNN is influenced by its two parameters’ selection, namely: weight and threshold. Consequently, it’s vital to apply an appropriate intelligent algorithm to determine theses values. Several traditional optimization algorithms have been used to select parameters for CNN, such as genetic algorithms, particle swarm optimizations and ant colony algorithms. Although the above algorithms have their own advantages, they also have corresponding shortcomings. For example, genetic algorithm cannot guarantee the convergence to the best, and is easy to fall into the local optimum, which leads to a decrease in prediction accuracy [19]. Particle swarm optimization will appear in premature convergence in different situations [20]. Ant colony algorithms have low searching efficiency and long calculation times, and local search accuracy is not high. Also, it cannot fully meet the needs of the CNN parameter optimization problem [21]. The Lion algorithm (LA), based on the social behavior of lions, was introduced by B.R. Rajakumar in 2012 [22]. Compared with preceding models, this approach shows strong robustness and good abilities in global optimization, and fast convergence. Nevertheless, inbreeding appears among the lions with large fitness during the iterative process, which leads to premature convergence and diversity reduction. To settle this problem, niche immune algorithms are employed in this paper to optimize LA, namely NILA. Here, niche immune algorithms can restrict over-duplication of similar individuals, so as to ensure the diversity of the population, and improve the optimization effect of the lion algorithm for selecting the parameters of CNN. This hybrid optimization method is used to automatically determine the appropriate values in CNN model.
This paper combines NILA with the CNN model for load forecasting of EV charging stations, with scientific analysis of influential factors. The rest of the paper is organized as follows: Section 2 shows a brief description of LA, NILA, and CNN, as well as the framework of the proposed technique; Section 3 presents an analysis of the influential factors and determines the input; Section 4 introduces an experiment study to test the accuracy and robustness of the established model; Section 5 makes further validation on this method, and Section 6 concludes this paper.
The innovations of this paper are as follows:
(1) The construction of the forecasting model
Firstly, it is the first time to combine CNN and lion algorithm improved by niche immunity and employ this model for the load forecasting of electric vehicle charging stations. Furthermore, the CNN model used for load forecasting cannot only allow the existence of deformed data, but also improve the load forecasting efficiency and accuracy by parameter reduction through local connection and shared weight. Finally, niche immunity is used in this paper to restrict over duplication of similar individuals, so as to ensure the diversity of population, and it effectively improves the optimization effect of the lion algorithm, as we can conclude from the case study.
(2) The input selection of the forecasting
In order to produce a scientific and reasonable input index system for the forecasting model, this paper fully analyzes the load characteristics in an EV charging station. And it can be concluded that the load in the EV charging station is heavily influenced by meteorological conditions, seasonal variation, and day types, which are more comprehensive and effective for forecasting.
In summary, this paper not only creatively combines various prediction theories to construct a comprehensive forecasting model, but also conducts the study of influential factors affecting the load of EV charging stations so that a scientific and reasonable input index system is produced.
2. Methodology
2.1. Lion Algorithm Improved by Niche Immune (NILA)
2.1.1. Lion Algorithm (LA)
Lion algorithm is a social behavior-based bionic algorithm developed by B. R. Rajakumar in 2012. The iteration and generation of optimal solutions can be realized through territorial lion’s breeding, and its defense to other nomadic lions. In this approach, every single solution corresponds to “Lion”.
LA proceeds through four main steps: population initialization, mating and mutation, territorial defense, and territorial takeover. The objective function is set as Equation (1):
Step 1: Population initialization
In the first stage of this algorithm, lions are averagely assigned to two groups as the candidate population, namely male lions and female lions . represents the length of the solution vector.
Step 2: Mating
Mating is an essential process to update and maintain the stability of the lion group via crossover, mutation, cluster or killing the sick and weak, thus new solutions can be continually delivered through iteration.
Dual probabilities based crossover is introduced in this paper, that is, crossover is implemented with two different probabilities. The lion and lioness generate a new cub through mating. Then, four cubs are generated according to two randomly selected crossover points by and .
Random mutation with is enabled to generate , resulting in 8 cubs after crossover and mutation.
The cubs are separated into male cubs () and female cubs () by K-means clustering.
Then, in light of health status, the weak cubs in larger group are killed off to ensure an equal number in the two cubs. After population regeneration, the age of the cub is initialized as 0.
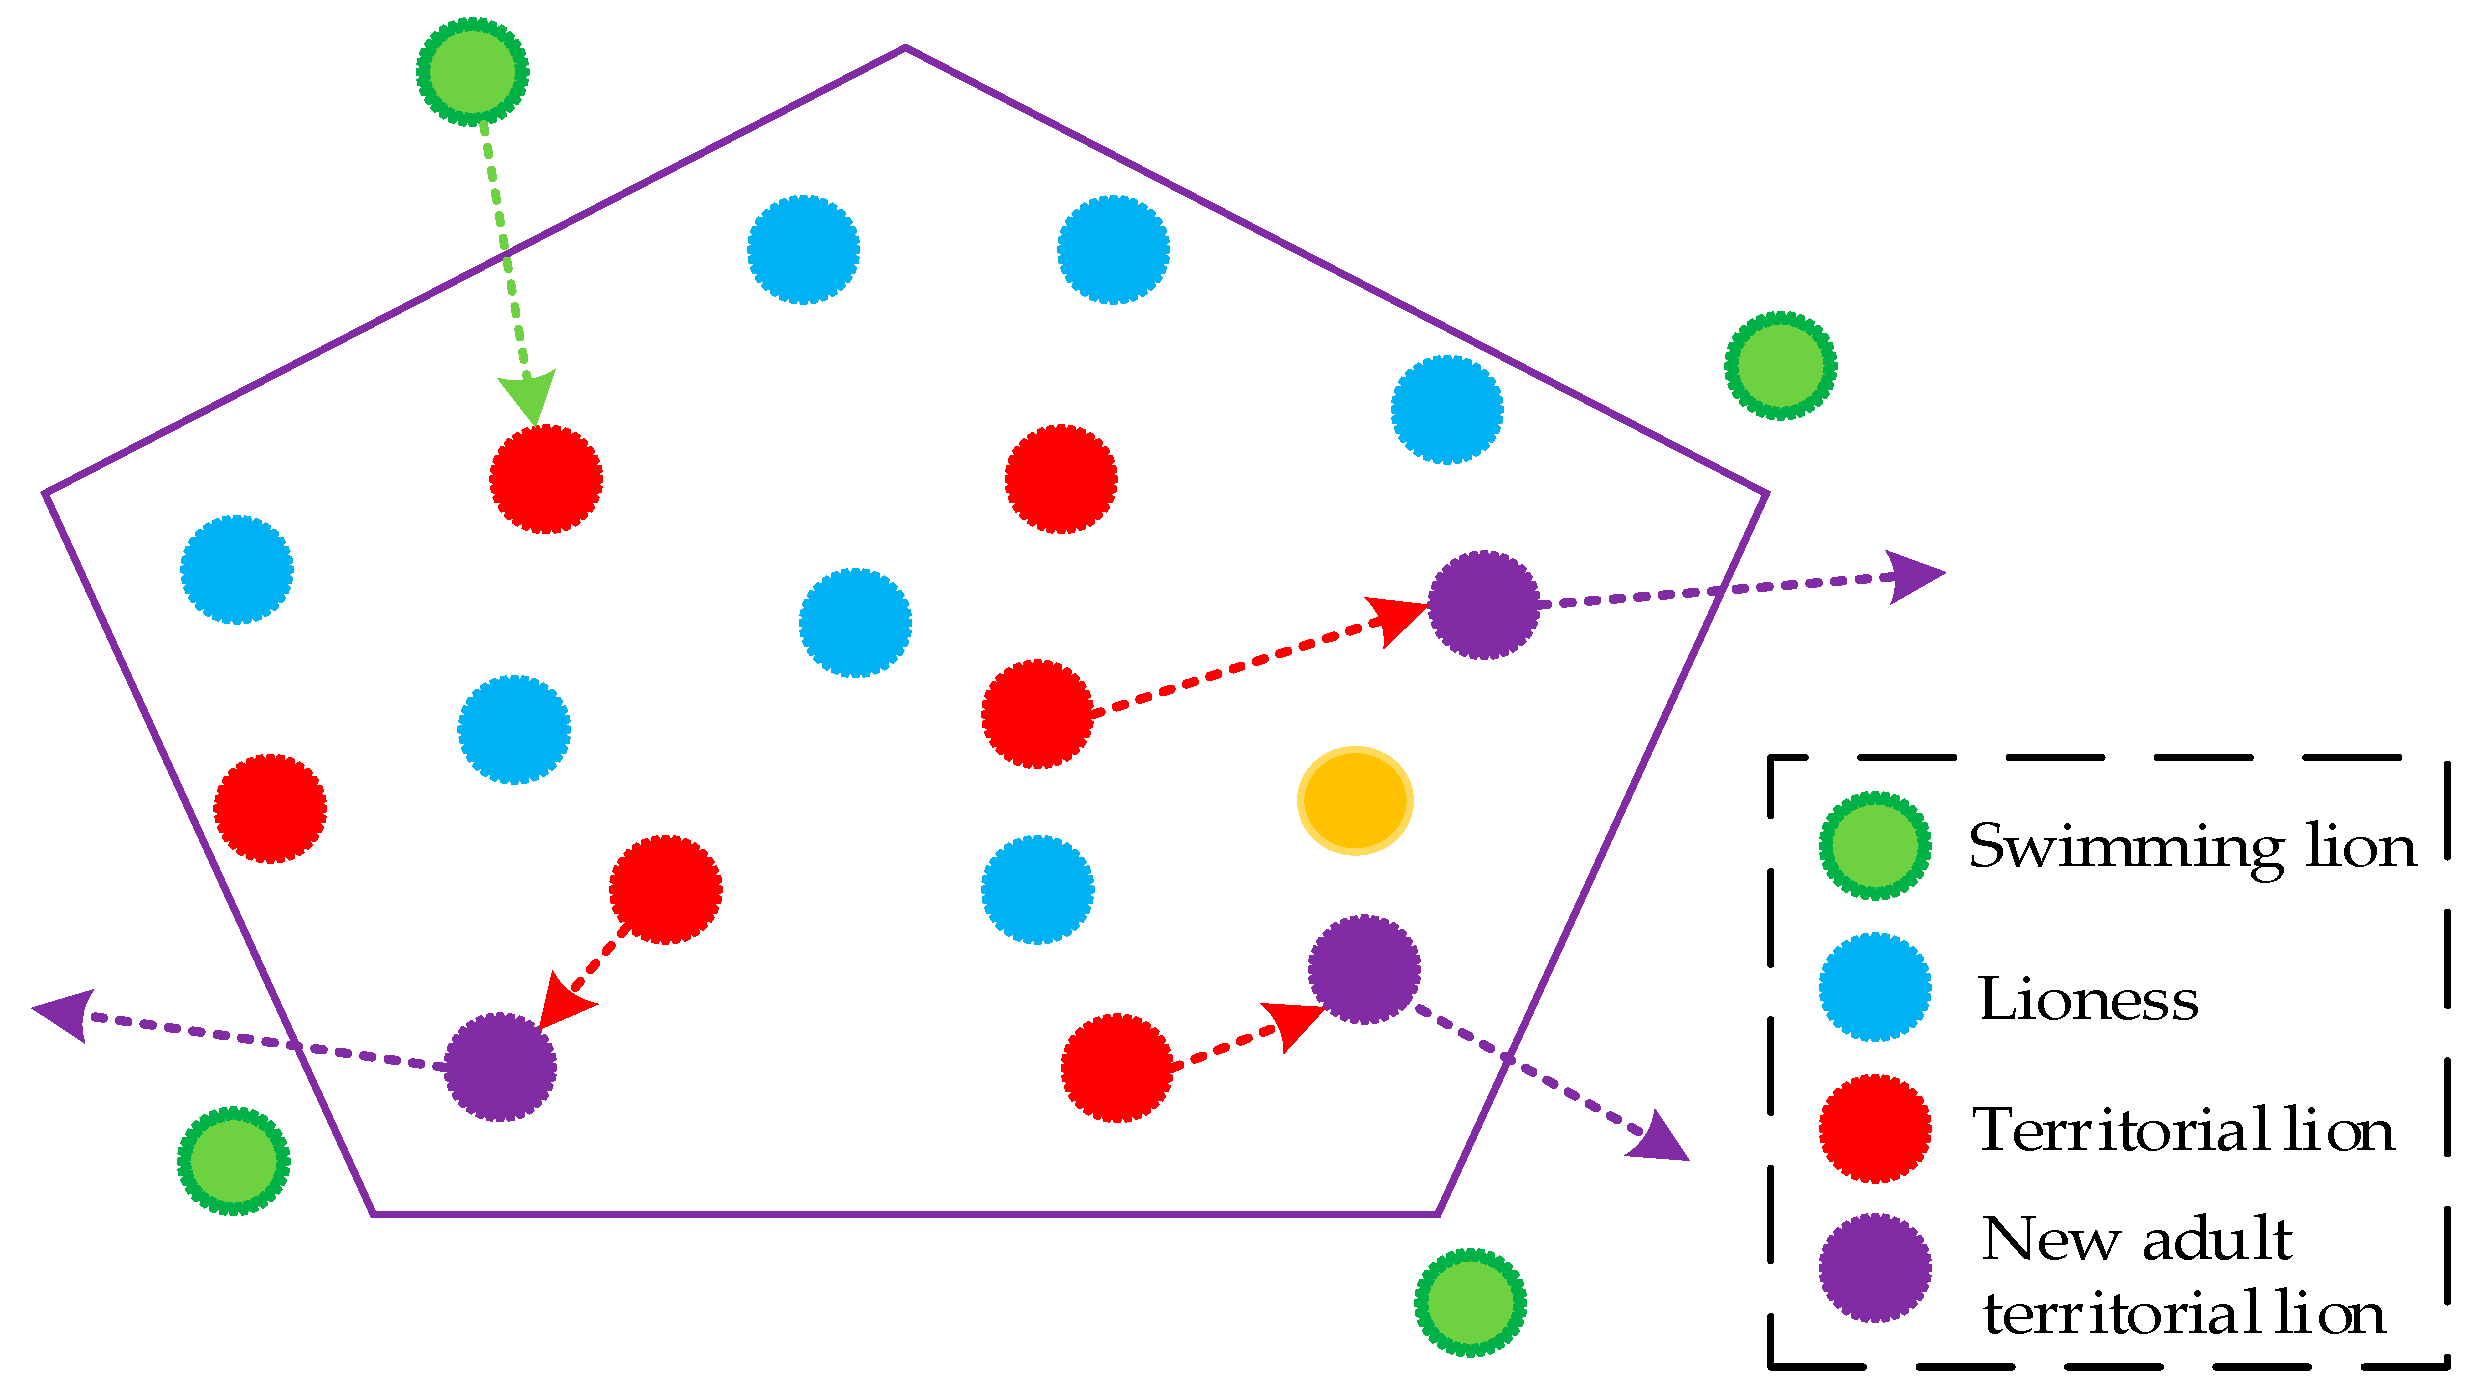
Step 3: Territorial defense
During breeding, it will be attacked by the nomadic lion. At this time, the male lion will defend and protect the cubs, and occupy the territory, as illustrated in Figure 1.
The nomadic lion is generated in the way that is the same as territorial lion. Then the new solution is used to attack the male lion . If is superior to other solutions in the pride, replace with . The new lion will continue to mate, and the old, as well as the cubs, will be killed off. Otherwise, the old lion will continue with territory defense, and the cubs will be one year older than before.
is the objective function and is the value of the whole population which can be calculated as Equation (2).
where and represent the values of lion and lioness, respectively; and equals the values of male cub and female cub, respectively; means the number of male cubs; is employed to designate the time required for mating.
Step 4: Territorial takeover
In this step, the optimal solutions among the lion and lioness are found to replace the inferior one. Mating will not end until the terminating conditions are reached. The best lion and lioness are determined according to the following criteria:
In the pseudo code, represents the number of breeding and describes the female’s optimal breeding ability, generally set to 5. is set as 0 at the time of initial pride generation, and should be incremented. If the female lion is replaced, has to be started from 0. On the other hand, if the old lioness continually existed, should be accumulated. When the previous steps are completed, go back to Step 2 until the termination condition is satisfied. The best lion responds to the optimal solution.
2.1.2. LA Improved by Niche Immune
LA is a parallel combination of self-adaption, group search and a heuristic random search, while inbreeding appears among the lions with large fitness during the iterative process, resulting in premature convergence and diversity reduction. Niche immunity is exploited in this paper to restrict over duplication of similar individuals, so as to ensure the diversity of population. The detailed steps of NI algorithm are displayed in [23]. LA optimized by NI can be performed as follow:
Step 1: According to the value of objective function, cloned lions can be obtained in the center of the location at a specified iteration interval.
where is the clone number of the -th lion, represents the maximum clone number that is set to 40 here. is the objective function value of the -th lion.
Step 2: lions are mutated by single parent after clone. For the lion with low objective function value, mutation is carried out by the parthenogenetic lions, as given in Equations (6) and (7).
where represents the lion, is the offspring generation after parthenogenesis, is the maximum value of lion location, equals the number of lions.
Step 3: Make comparison among the mutated lions and select the one with the maximum objective function value as the new lion.
2.2. Convolutional Neural Network (CNN)
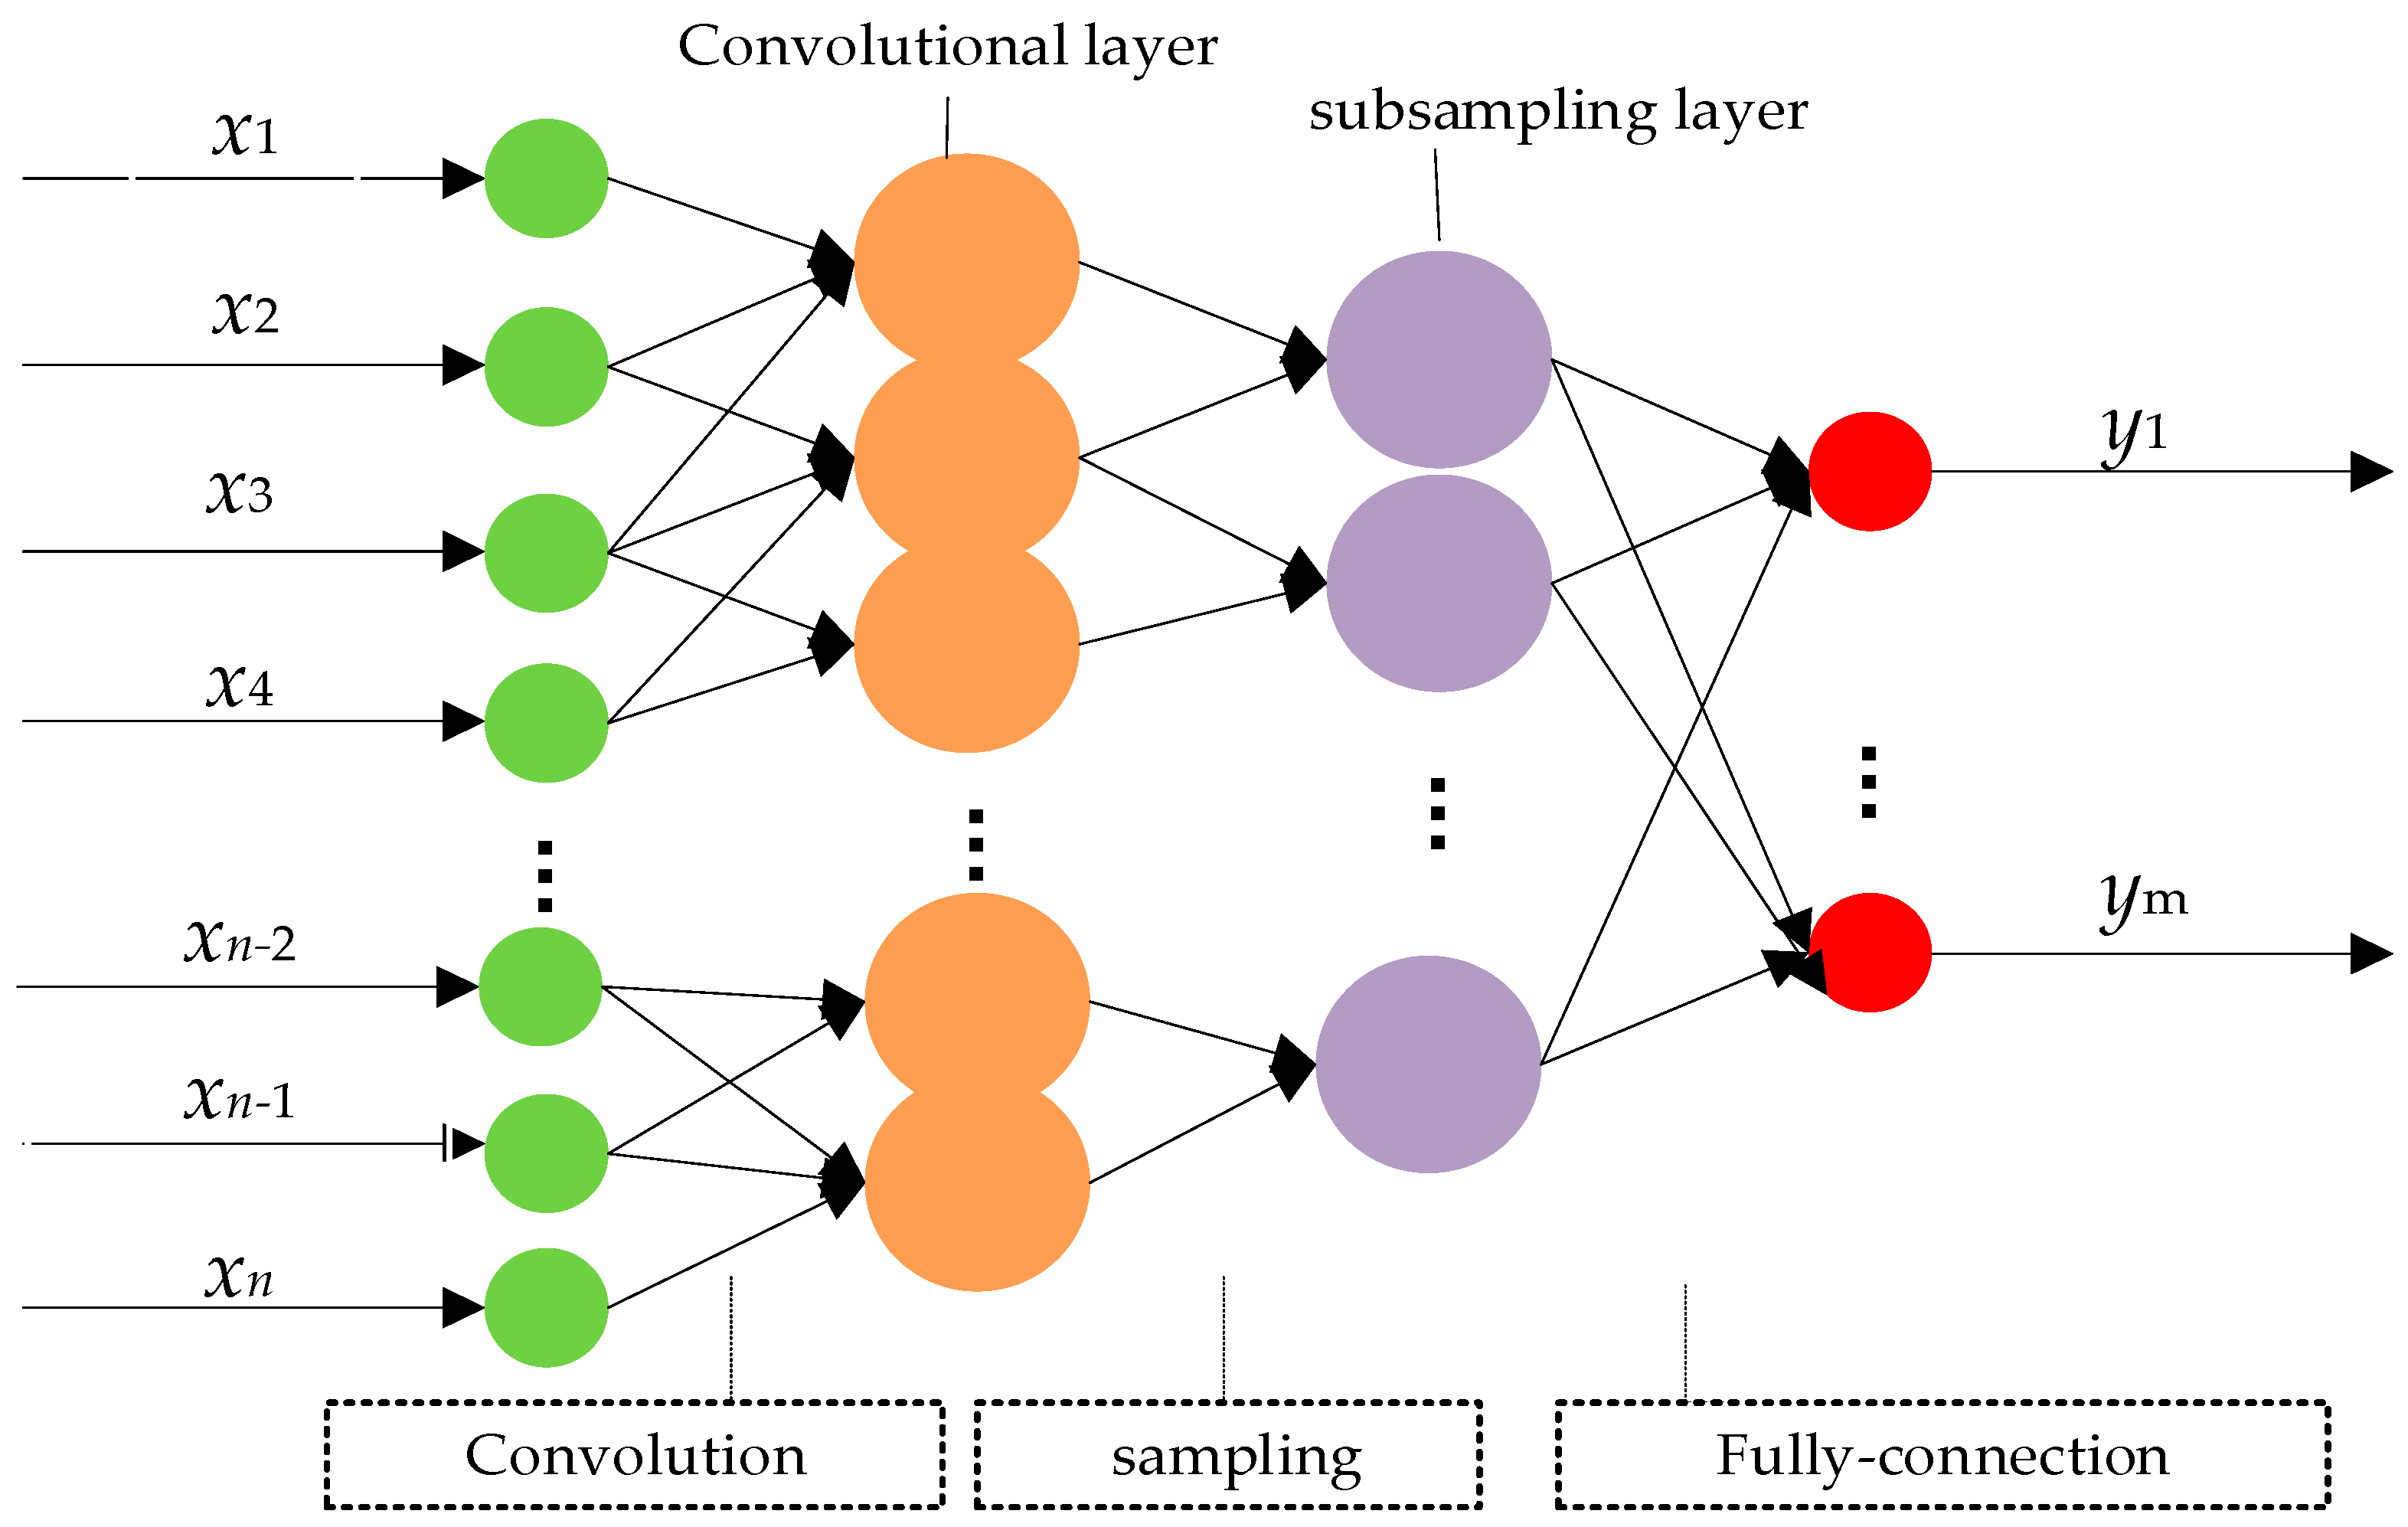
As a kind of ANN with deep learning ability, the CNN achieves local connections and shares the weights of neurons in the same layer [24]. The network consists of 1~3 feature extraction layers and fully connected layers. Each feature extraction layer includes a convolutional one and a subsampling one. The structure of CNN containing a feature extraction layer is shown in Figure 2.
In convolutional layer, the original data is processed by the convolutional kernel to obtain the output, as described in Equation (8).
where , . and represent the output in Layer and the input in Layer , respectively. is the local connection ranging from to . equals the weight and is the bias.
The subsampling process can be expressed as follows:
where represents the function that selects the average or maximum value.
Then, the obtained data is linked to the fully connected layer as presented in Equation (10).
where is the weight from Layer to Layer and represents the output data.
In the above calculation, each convolutional kernel plays a role in all the input via the slide. Different convolutional kernels corresponding to multiple sets of output where the weight of the same convolutional kernel is identical. The output of different groups are combined and then transferred to the subsampling layer. Here, the output in the previous convolutional layer is treated as the input data. At this time, set the range of values and use the average or maximum as the specific values in the range. The data needs to be combined to satisfy a dimensionality reduction. Finally, the results can be derived from the fully connected layer [25].
The application of the CNN model has two main advantages: (a) the existence of deformed data is allowed; (b) the load forecasting efficiency and accuracy can be improved by parameter reduction through local connection and shared weight. However, the stability of the prediction results can not be guaranteed, due to the subjective determination of the weights and thresholds [26]; thus, NILA is proposed to complete the optimal parameter selection in this paper to overcome this shortcoming.
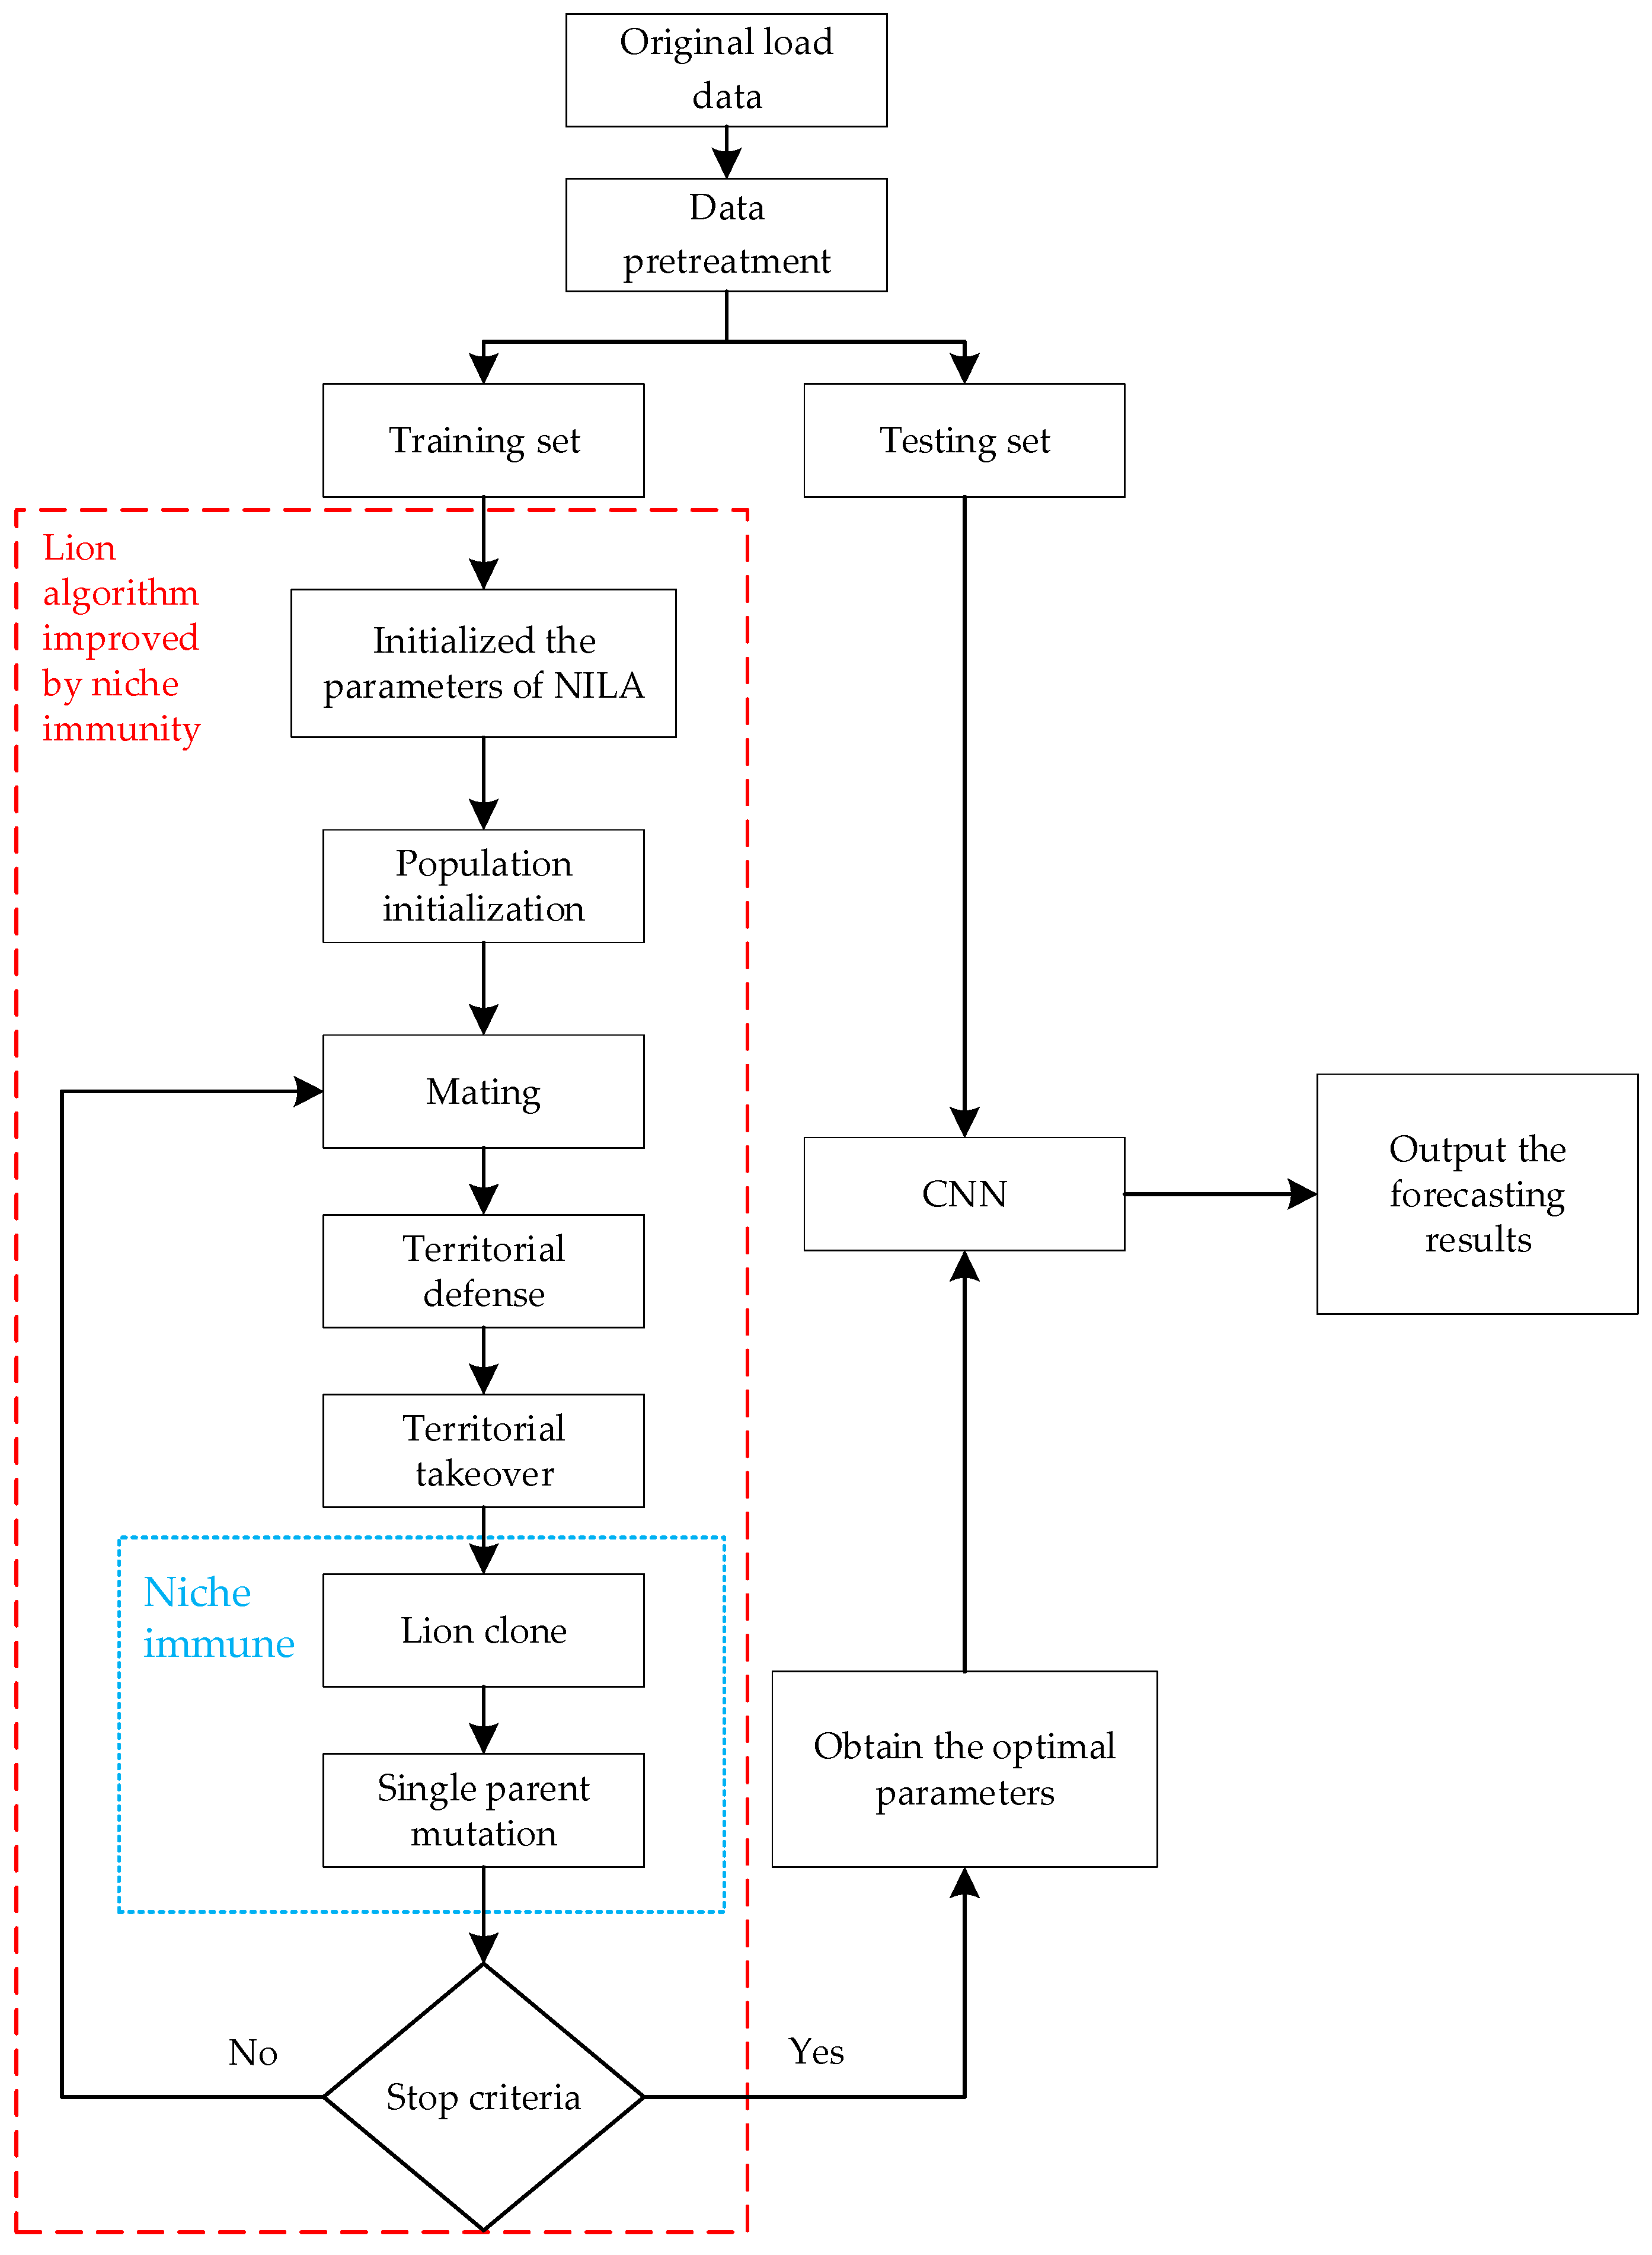
2.3. The Forecasting Model of NILA-CNN
The short-term load forecasting approach for EV charging stations incorporating NILA and CNN is constructed as Figure 3 shows.
On the basis of NILA-CNN model, the optimal parameters of CNN can be derived as follows:
(1) Input selection (xi) and data pre-processing. The initial input set is formed based on the load analysis of EV charging stations and needs to be quantified and normalized. The specific data preprocessing method is shown in Section 4.1.
(2) Parameters initialization. Randomly determine the weights and thresholds of all layers in CNN model from the smaller numerical set.
(3) NILA optimization. Search the optimal weights and thresholds of CNN on the basis of NILA. If the maximum iteration number is reached, the optimal parameters are obtained; if not, repeat the optimization steps until the condition is satisfied.
(4) CNN training. After initialization including the neuron numbers in the input layer, convolutional layer, and subsampling layer, respectively, train the CNN optimized by NILA, and derive the optimal forecasting model.
(5) Simulation and prediction. Forecast the short-term load of EV charging stations based on the trained approach and analyze the results.
3. Analysis of Load Characteristics in Electric Vehicle (EV) Charging Station
The study of influential factors that affect the load in charging station contribute to load forecasting accuracy improvement. This paper selects an EV charging station in Beijing as a case study. It can be seen that the load is heavily influenced by meteorological conditions, seasonal variation, and day types.
3.1. Seasonal Variation
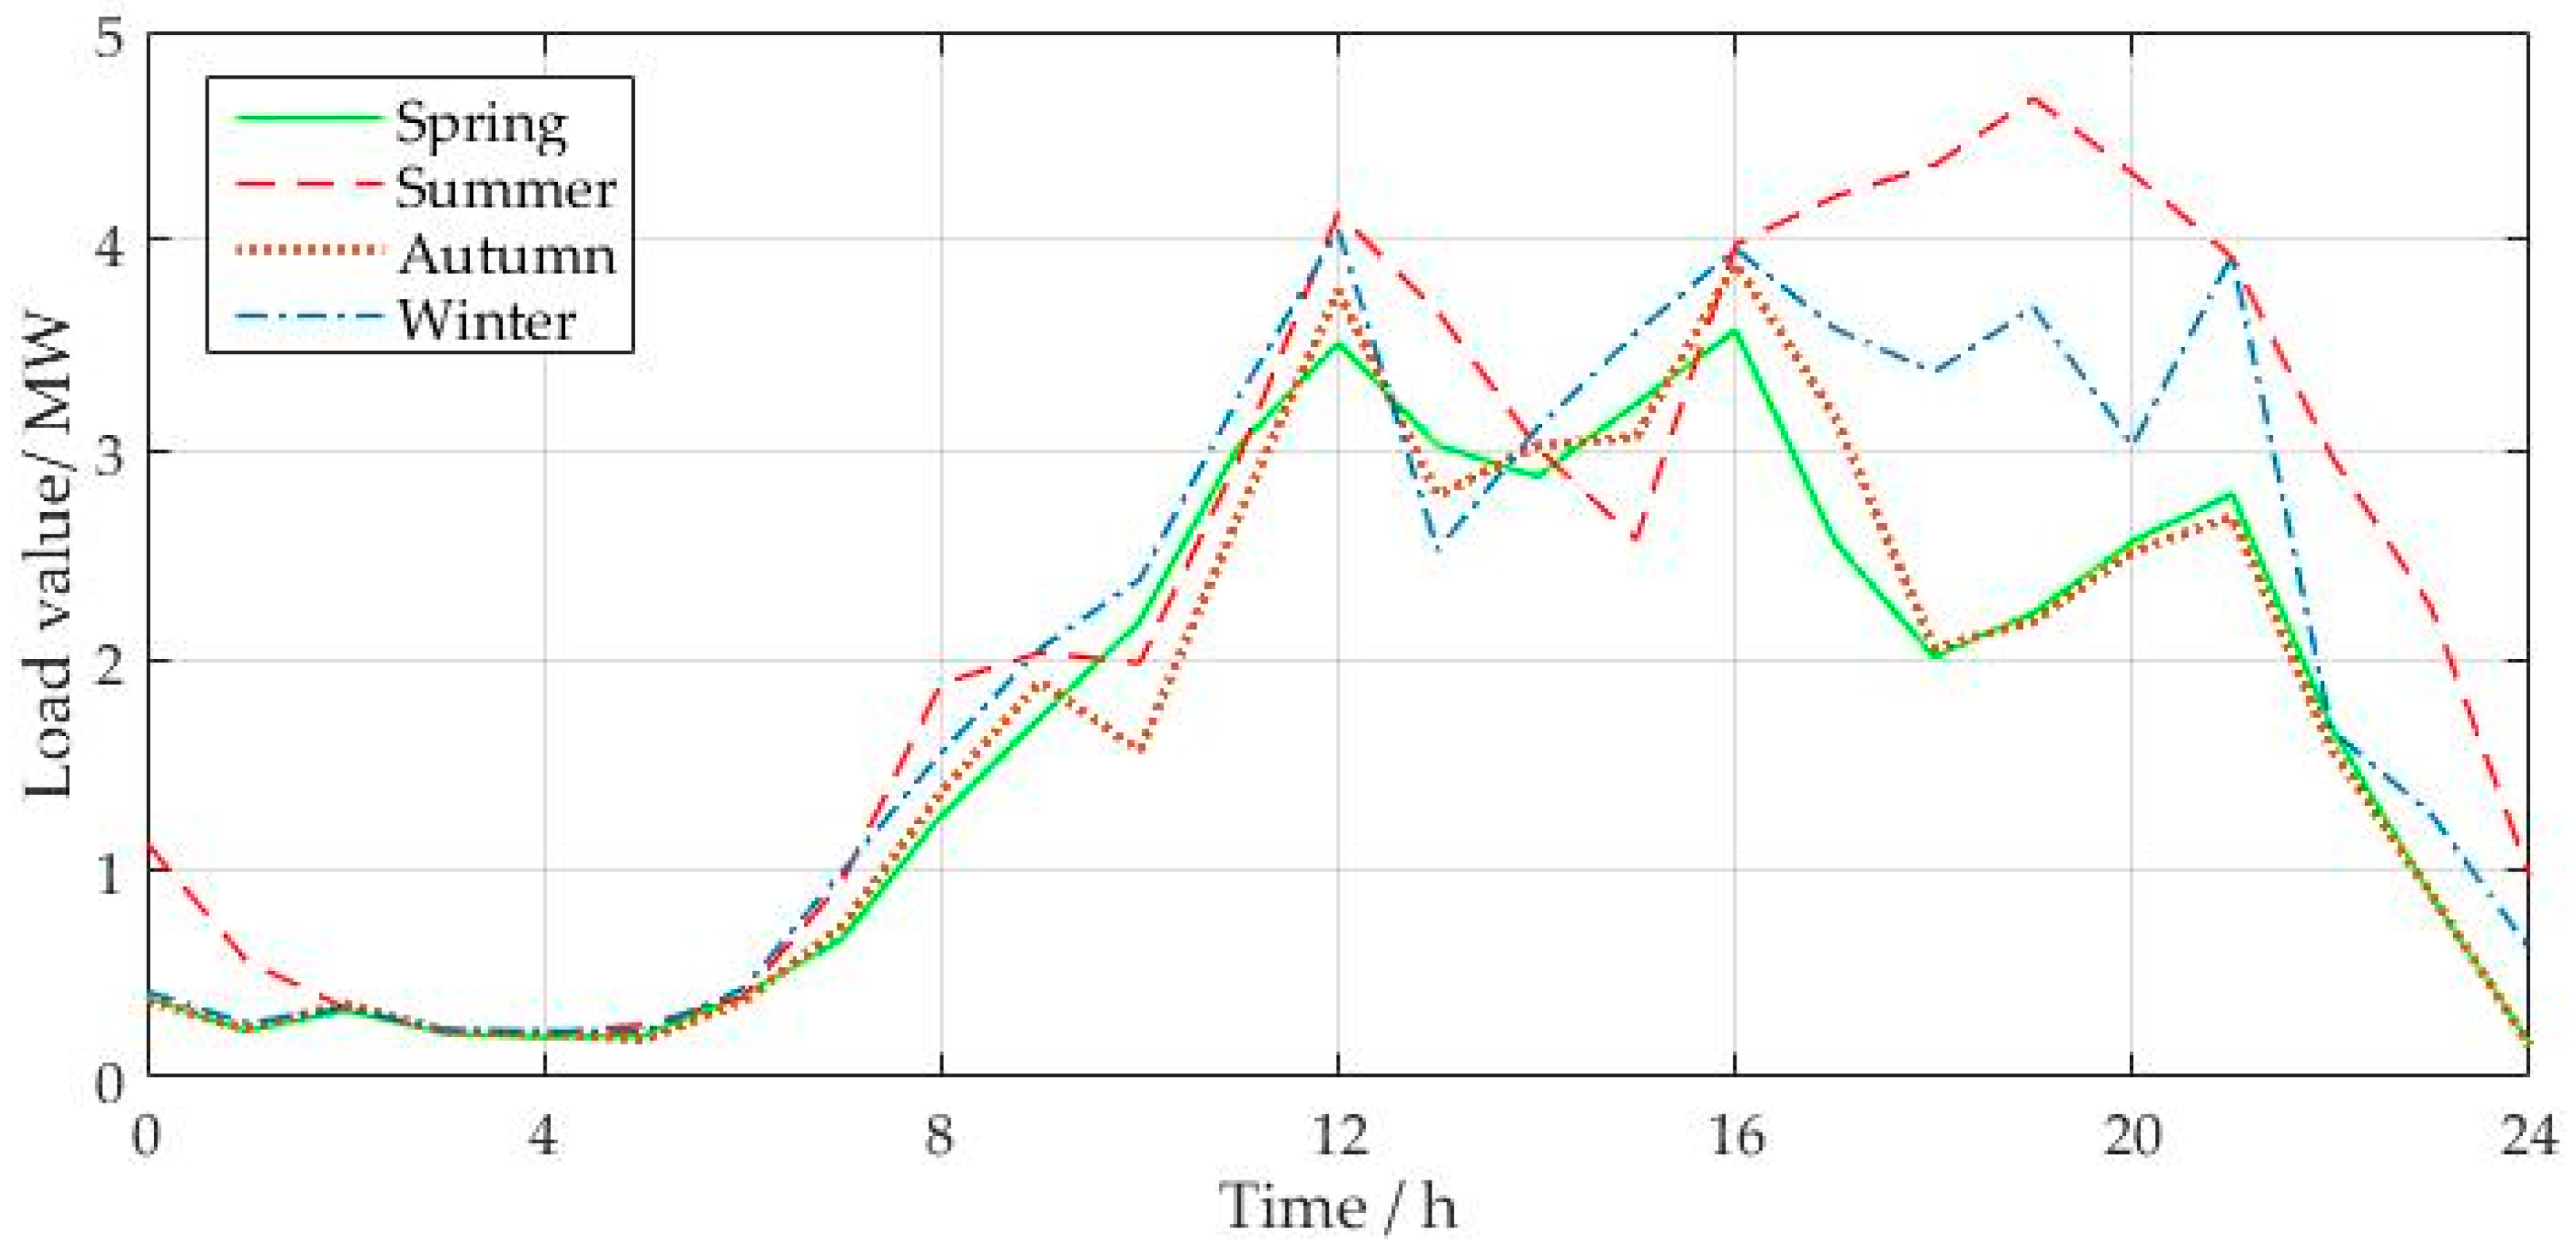
Seasonal variation has an obvious effect on the load characteristics in EV charging station [27]. Therefore, the typical daily load curves in spring, summer, autumn and winter are compared in Figure 4. It should be noted that these four days are all Tuesday, and are all sunny days.
As presented in Figure 4, the load of the EV charging station is relatively high in winter and summer, mainly due to increasing use of air conditioning in these two seasons, which leads to more energy consumption. As a result, air conditioning load can be considered as a vital influencing factor.
3.2. Meteorological Conditions
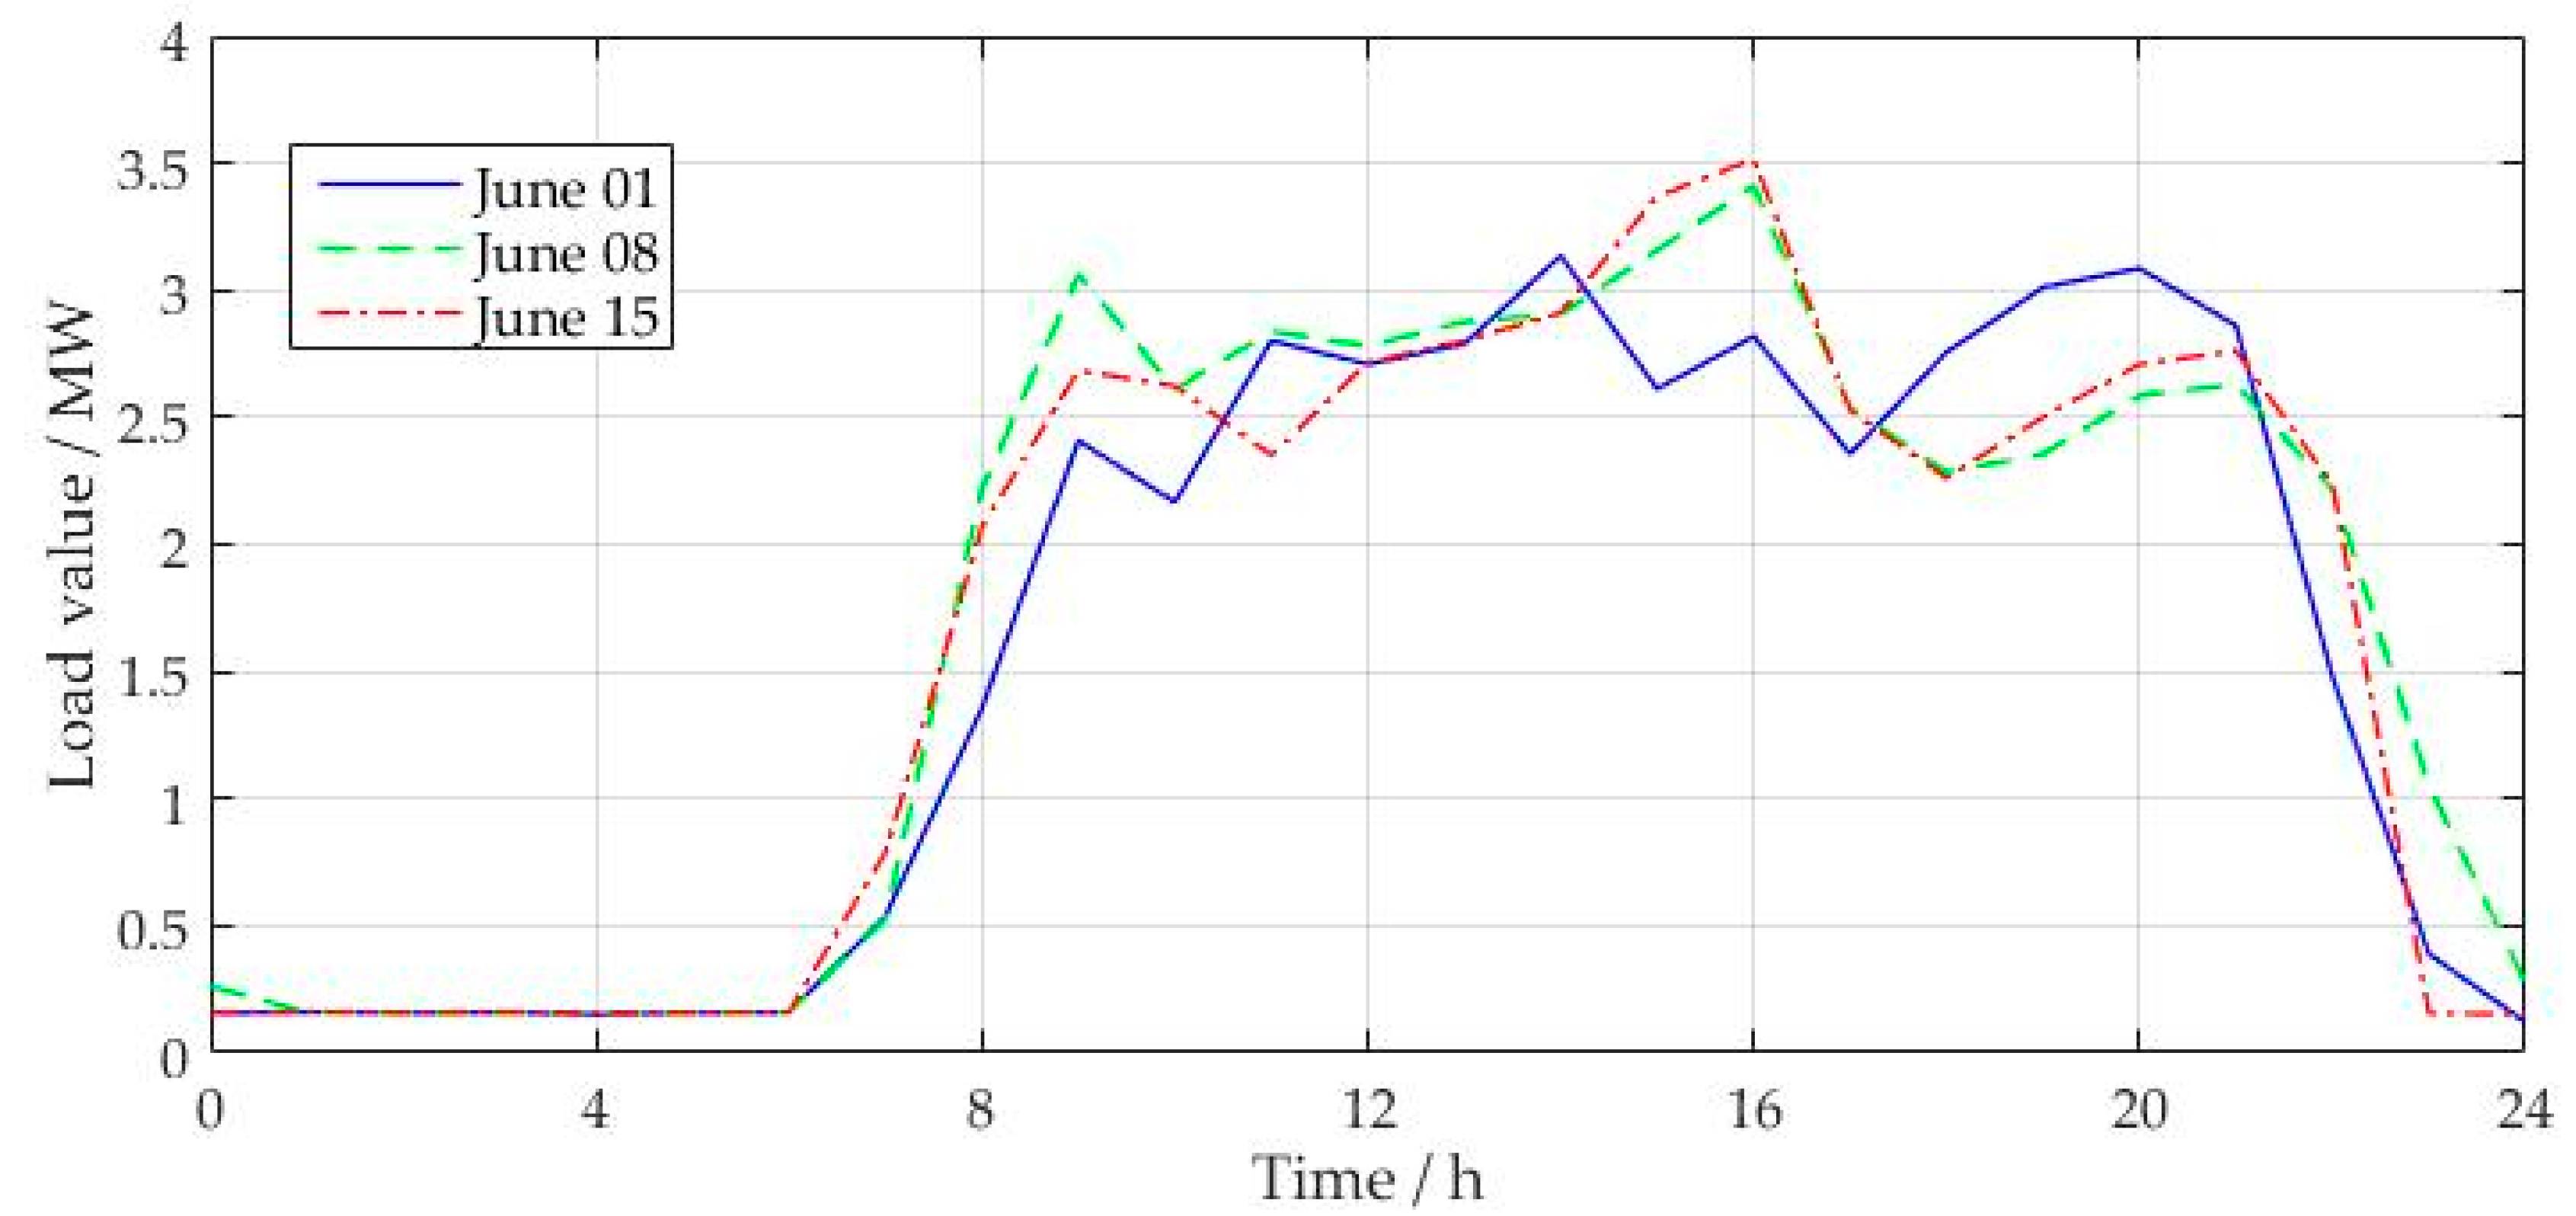
The load in EV charging station is greatly affected by temperature and weather type, while wind and humidity play insignificant roles [28,29]. Here, take the daily load curves on 1 June, 8 June and 15 June in 2017 as examples. The average daily temperatures are 23.5 °C, 27 °C and 31 °C, respectively. It can be seen that there is a positive relationship between temperature and daily load, as shown in Figure 5. Therefore, temperature is selected as the influential factor in this paper.
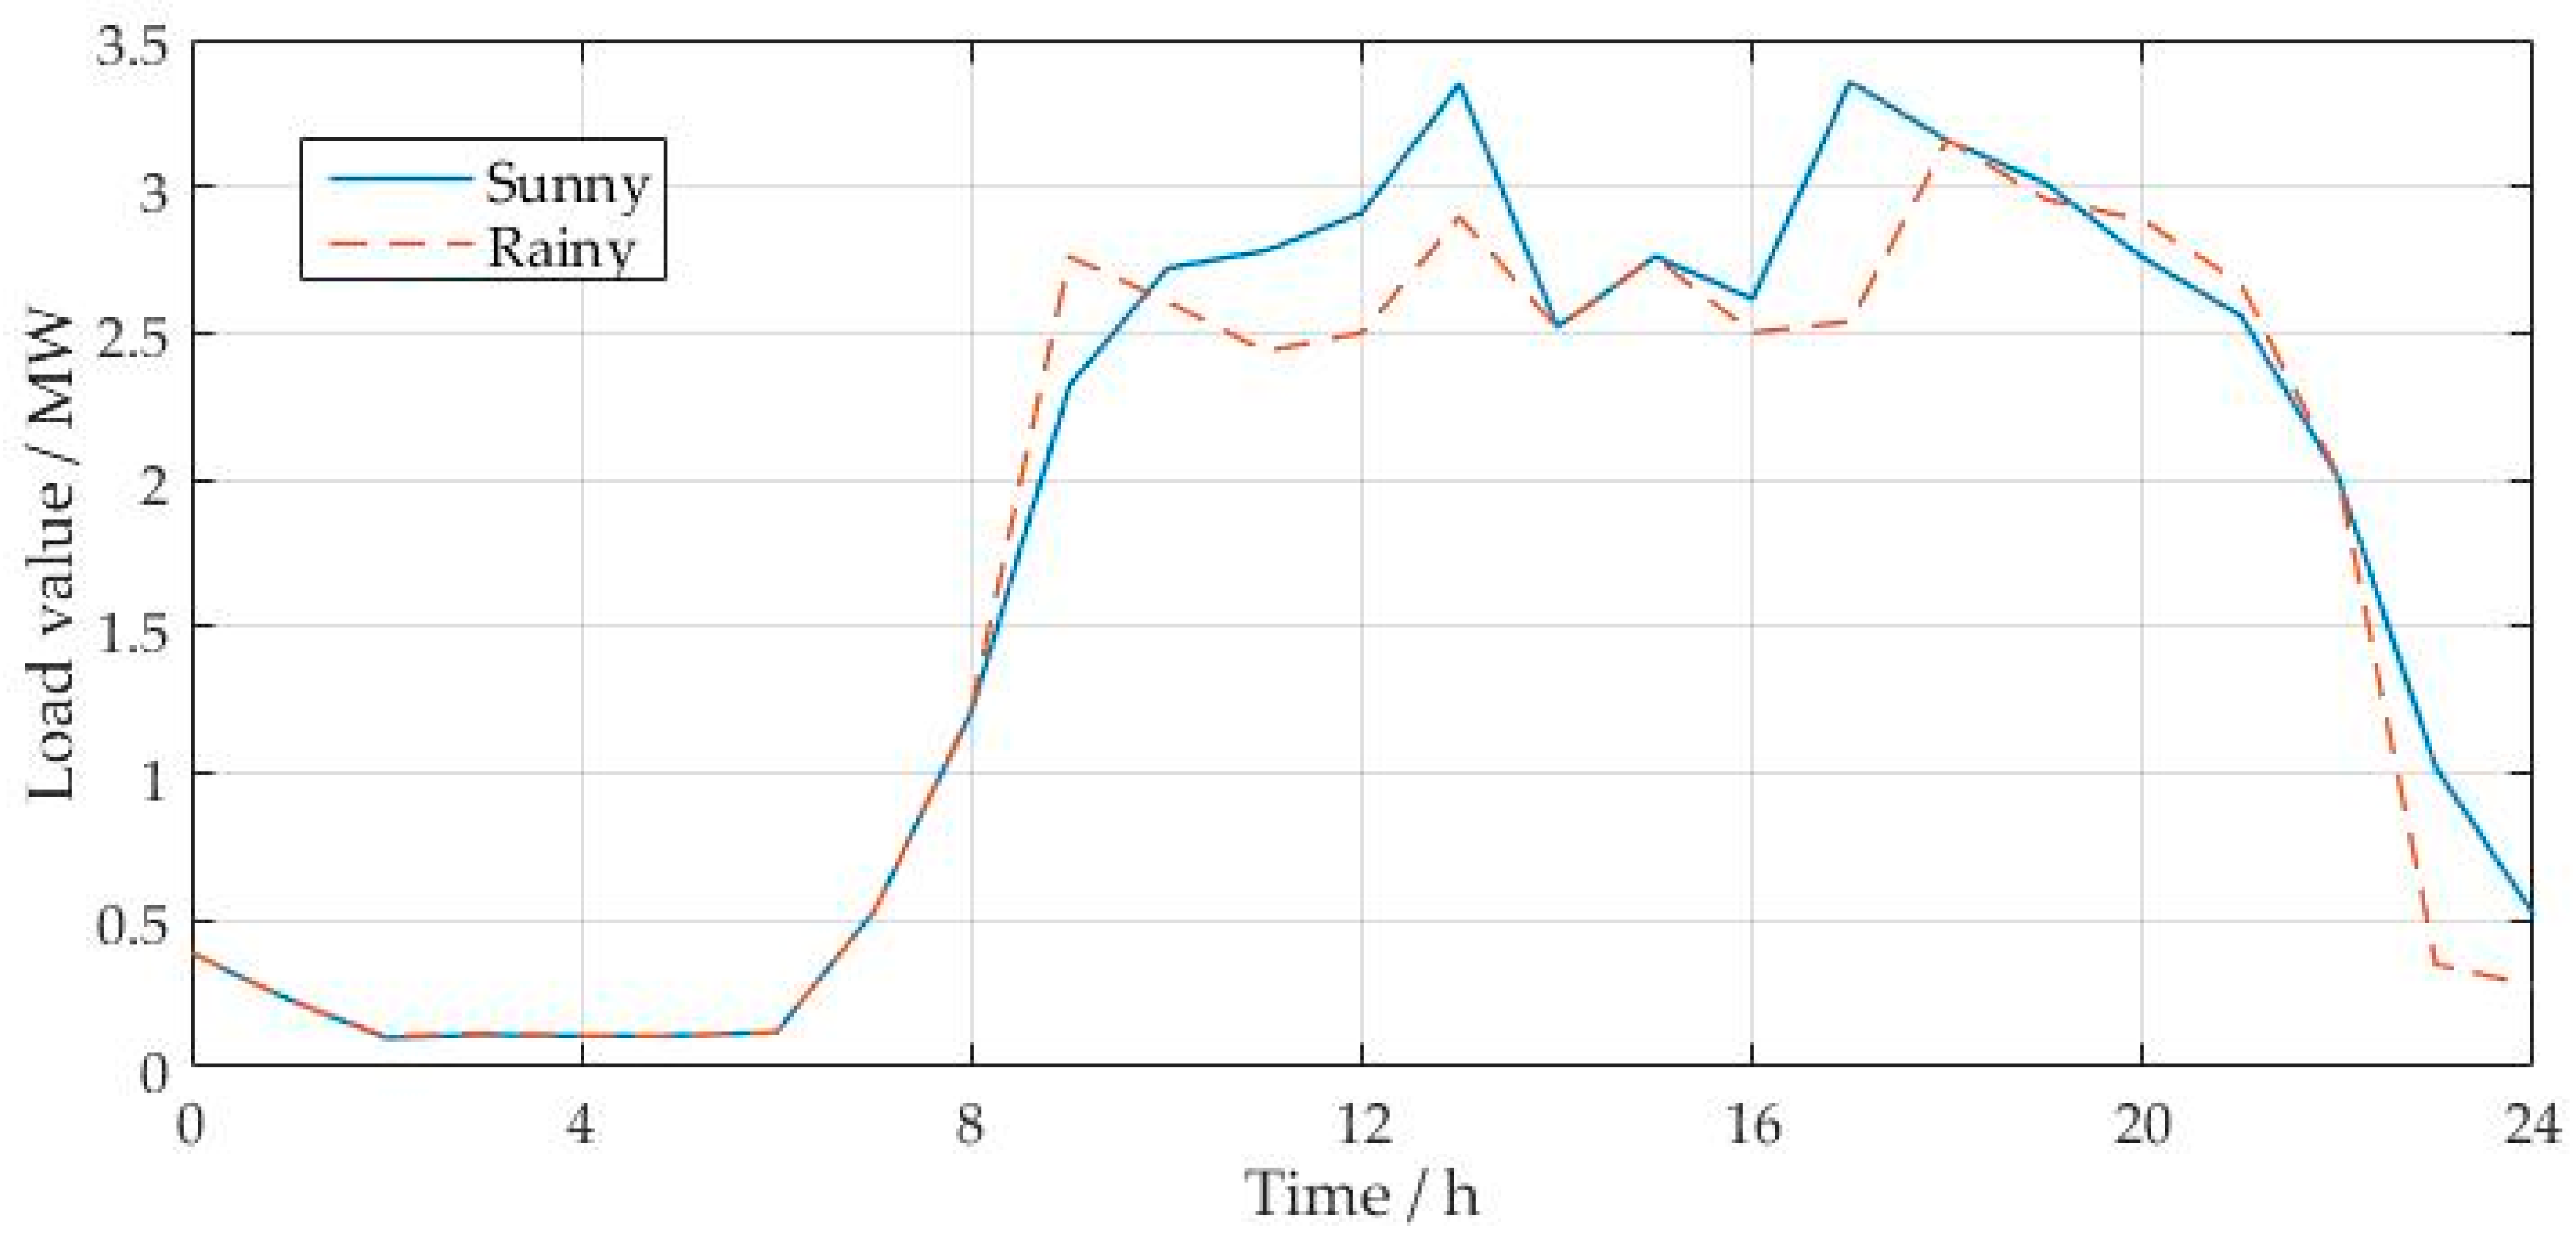
Divide the weather conditions into two categories: sunny days and rainy days. Figure 6 illustrates the relationship between weather conditions and the daily load of the EV charging station on 21 February and 22 February in 2017. It is sunny on 21 February and it is rainy on 22 February. It proves that snow days can reduce the daily maximum load as a result of vehicle’s deceleration, which leads to the decrease of daily driving mileage and charging. Hence, snow is another important influential factor.
3.3. Day Types
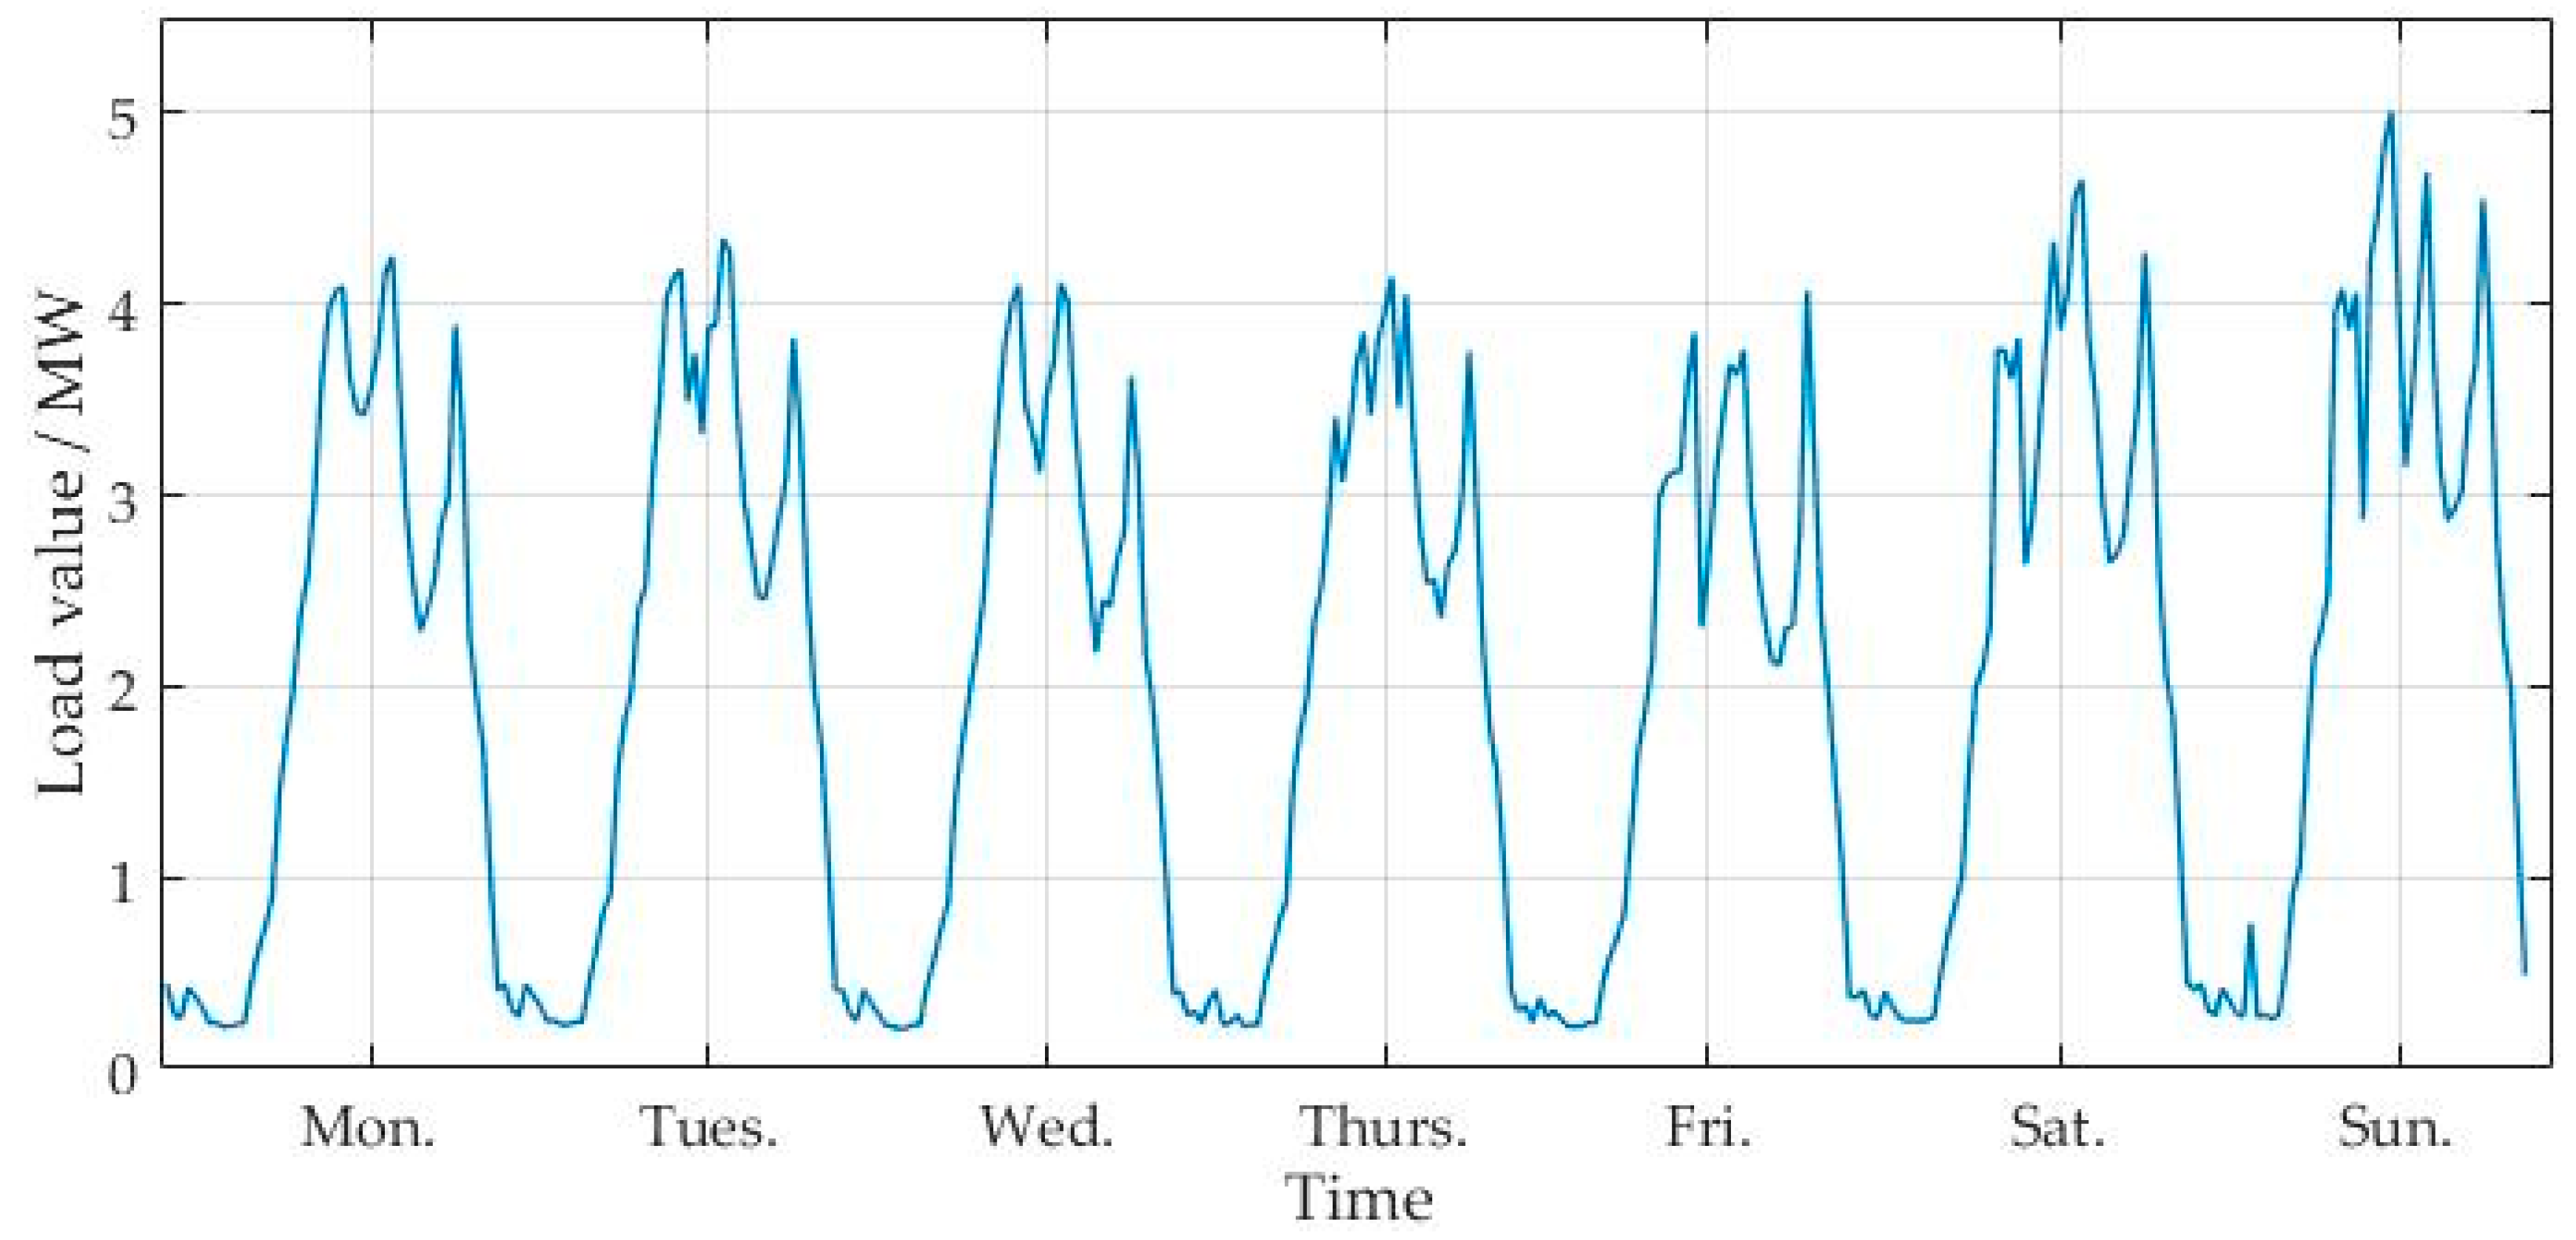
Divide the days into workdays, Saturday and Sunday. Figure 7 describes the relationship between day types and daily load of the EV charging station based on the data from 14 August to 20 August in 2017. It is Monday to Friday from 14 August to 18 August. 19 August and 20 August are Saturday and Sunday respectively. The loads on workdays are slightly lower than those of the weekends. From Monday to Friday, the use of EVs focuses on the period that people go to and from work, while the abundant outdoor activities on Saturday and Sunday increase the use of EVs. To this end, the day type is chosen as an influential indicator in this paper.
4. Case Study
The selected EV charging station in this paper is composed of 5 large power chargers which can be used by batteries with high capacity in a single box, or series batteries with low capacity in three boxes, and 10 small power chargers that can be only employed by a battery with low capacity in a single box. The load data every 30 min from 1 June 2016 to 30 November 2017 are collected from the charging station. The data from 1 June 2016 to 29 November 2017 are selected as training set, and the remaining data on 30 November 2017 are utilized as test set.
4.1. Input Selection and Processing
According to the analysis of the load characteristics for EV charging station, ten influential factors including seasonal category, maximum temperature, minimum temperature, weather condition, day type, and the loads at the same moment in the previous five days are selected as input in this paper. The input features are discussed as follows: (a) the season can be divided into four categories: spring (March, April and May), summer (June, July and August), autumn (September, October, November) and winter (December, January and February), which are set as . (b) Weather conditions are decomposed into two types: sunny and cloudy days, valued at 1, and rainy and snowy days, valued at 0.5. (c) Days can be divided into workdays (Monday to Friday) and weekends (Saturday and Sunday). When quantifying the day type, workdays are valued at 1, and weekends at 0.5. Because the collecting data is not publically available, statistically significant parameters are presented in Table 1.
The temperature and load data should be normalized in accordance with Equation (11).
where is the actual value, and equals the minimum and maximum values in the samples, respectively, represents the normalized load.
4.2. Model Performance Evaluation
This paper assesses the forecasting model by using the following appropriate indicators.
- (1)
- Relative error (RE):
- (2)
- Root mean square error (RMSE):
- (3)
- Mean absolute percentage error (MAPE):
- (4)
- Average absolute error (AAE):where is the actual load of charging station and is the corresponding forecasted load, represents the groups in the dataset. The smaller these evaluation indicators are, the higher the prediction accuracy.
4.3. Results Analysis
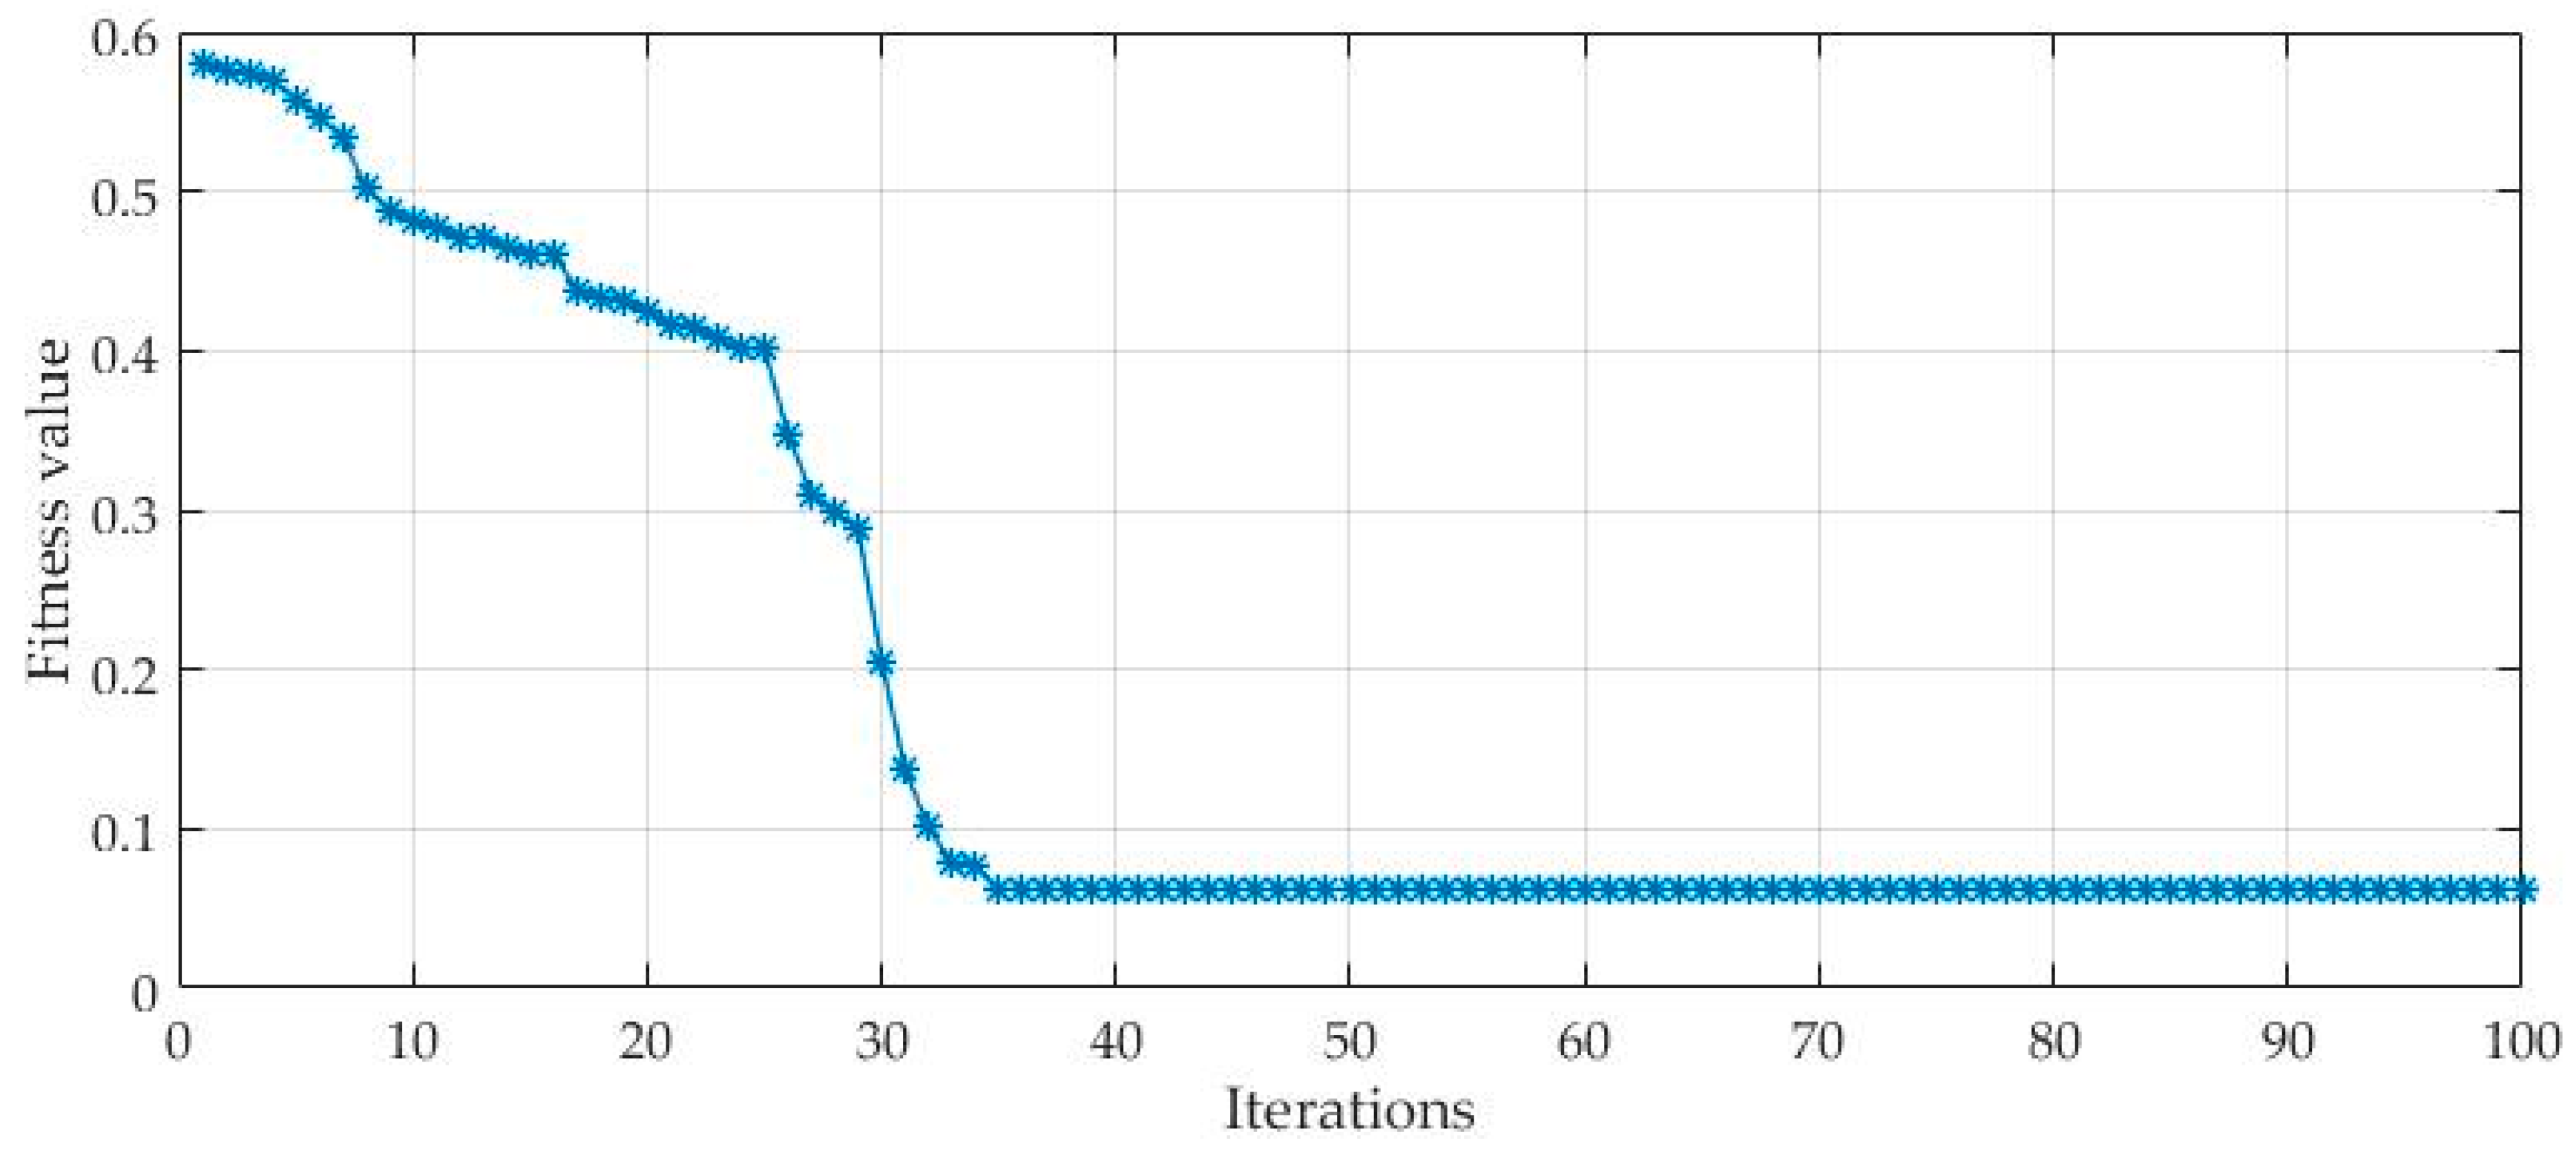
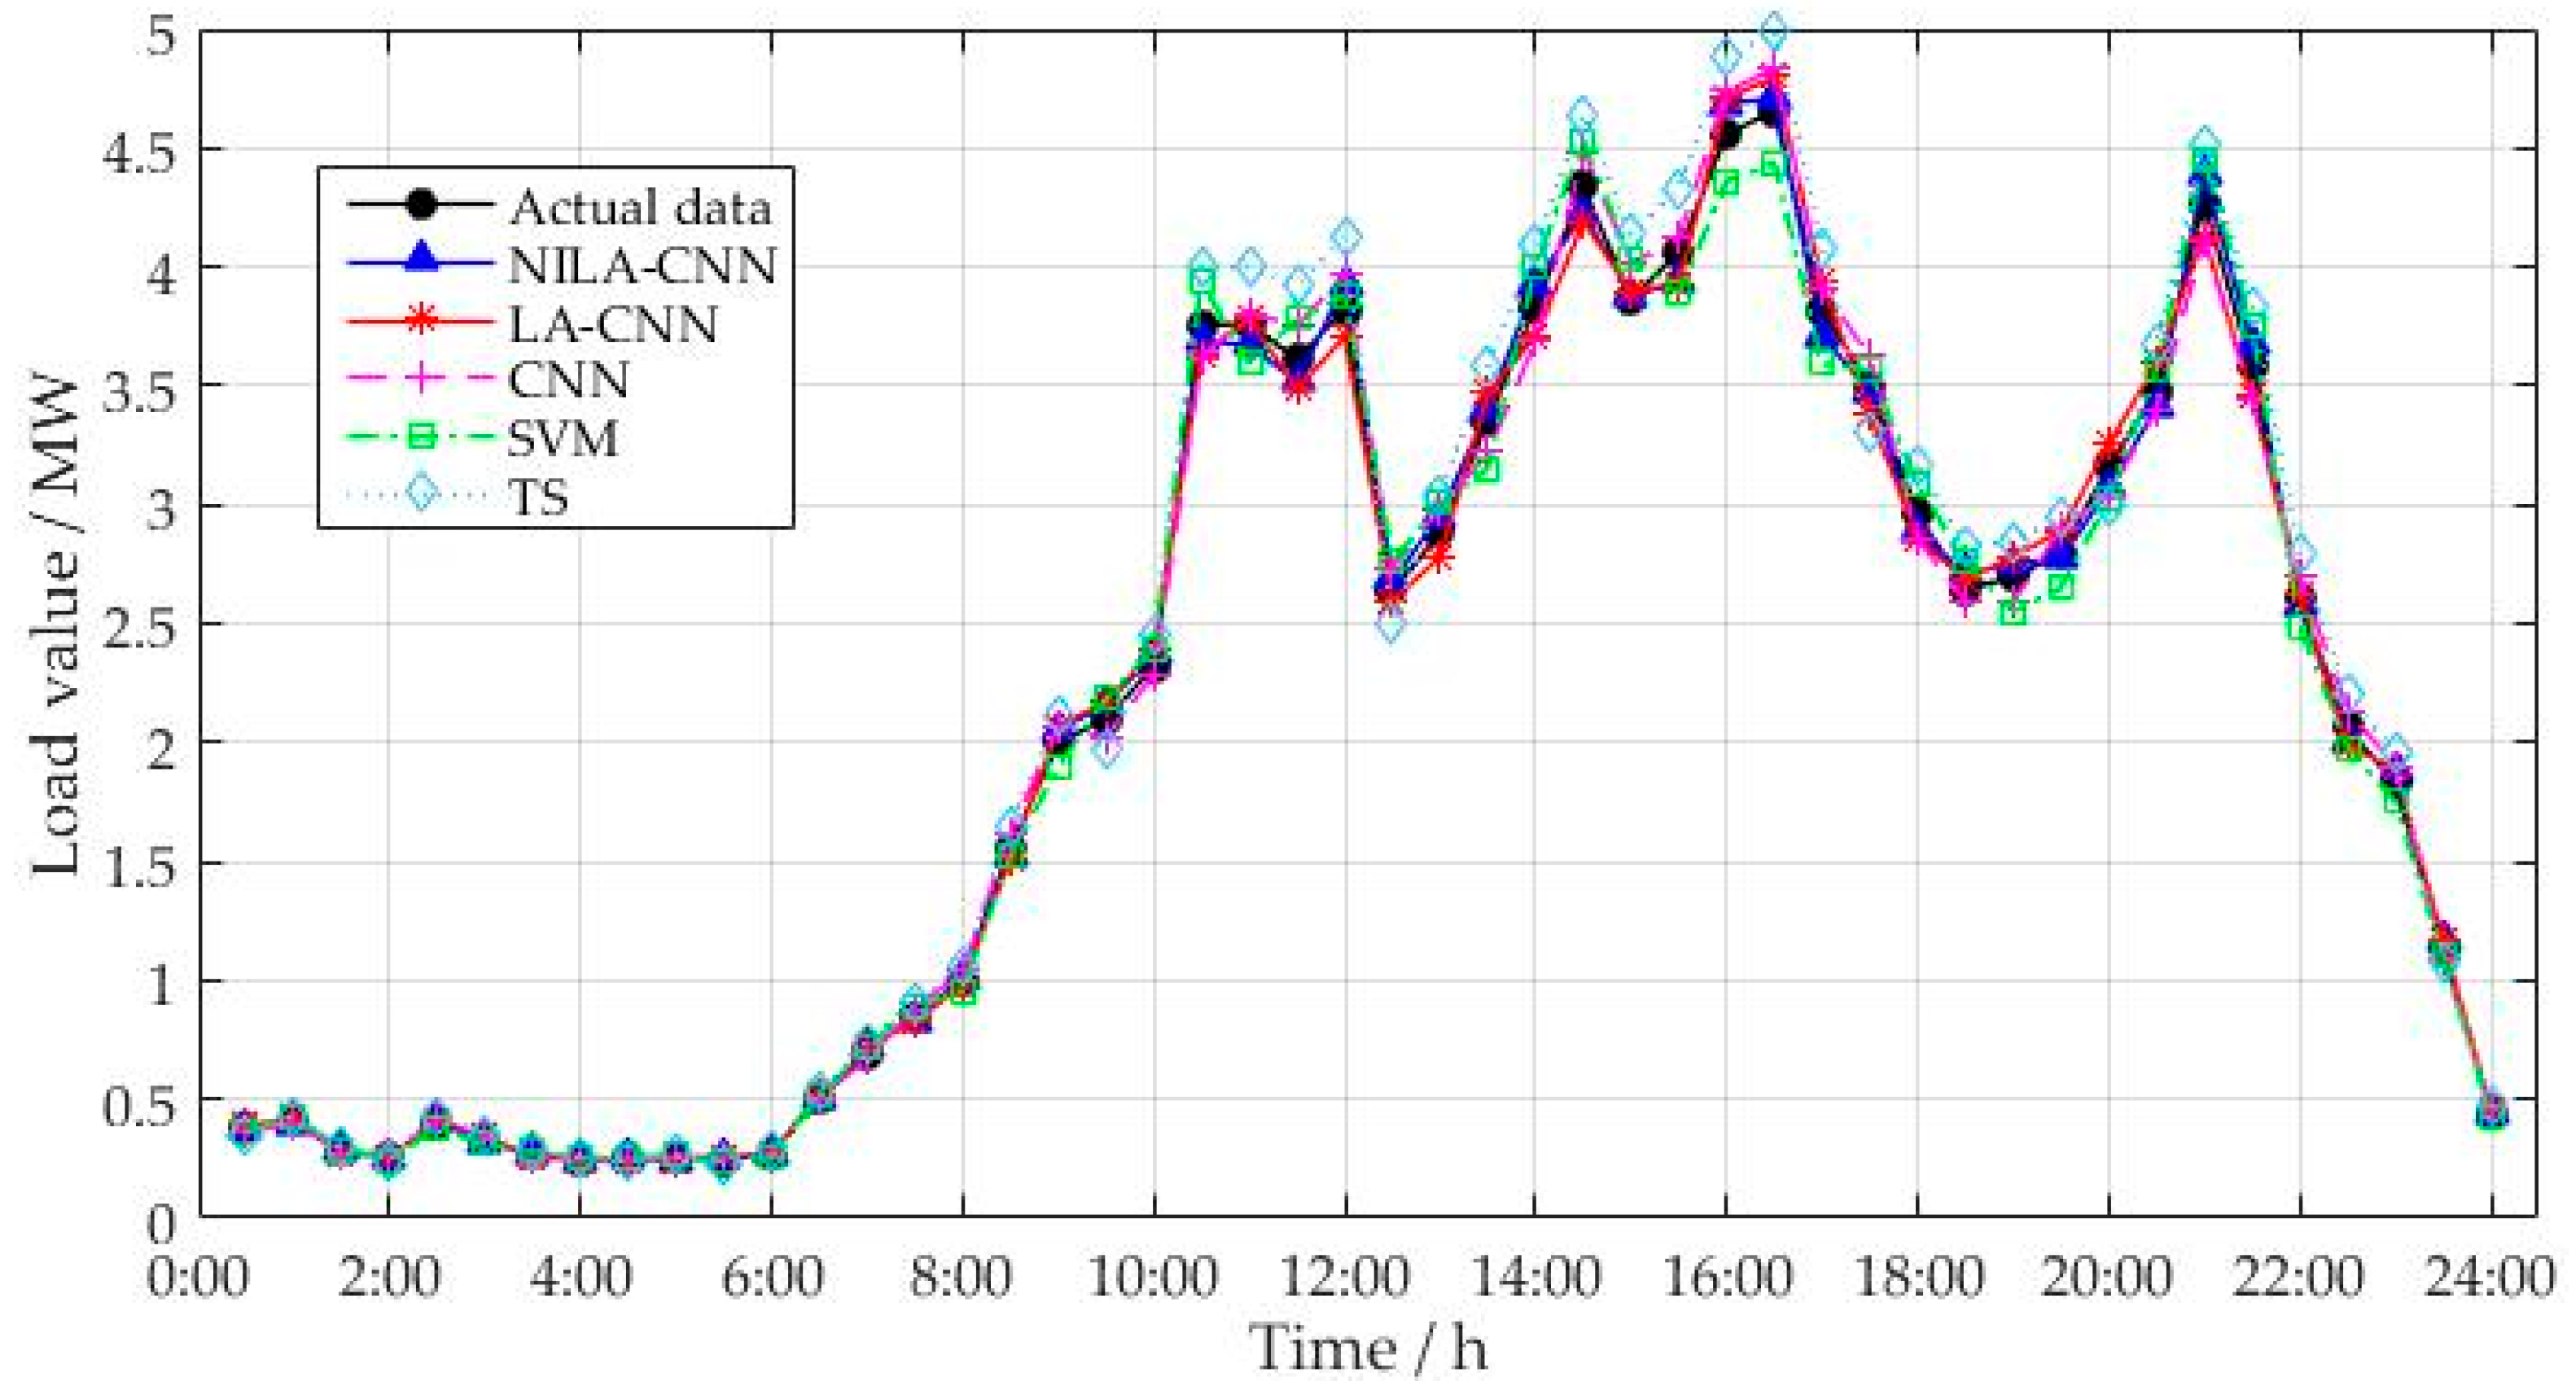
In NILA, set , , the maximum iteration number is 100, , and the specific iteration process is shown in Figure 8. As can be seen in Figure 8, the optimal parameter of CNN is obtained at the thirty-fifth iteration. In order to validate the performance of the proposed technique NILA-CNN, comparisons are made with the final forecasting results from different algorithms involving LA-CNN, single CNN, SVM, and time series (TS). The parameter settings in LA-CNN model are consistent with those in NILA-CNN. The CNN model consists of one feature extraction layer which includes a convolutional layer with 12 neurons, and a subsampling layer with 5 neurons. The maximum number of training times, and the training error, are 200 and 0.0001, respectively. In SVM, the regularization parameter is 9.063, the kernel parameter equals 0.256, and the loss parameter is equal to 3.185. In Table 2, load forecasting results are derived from five different techniques.
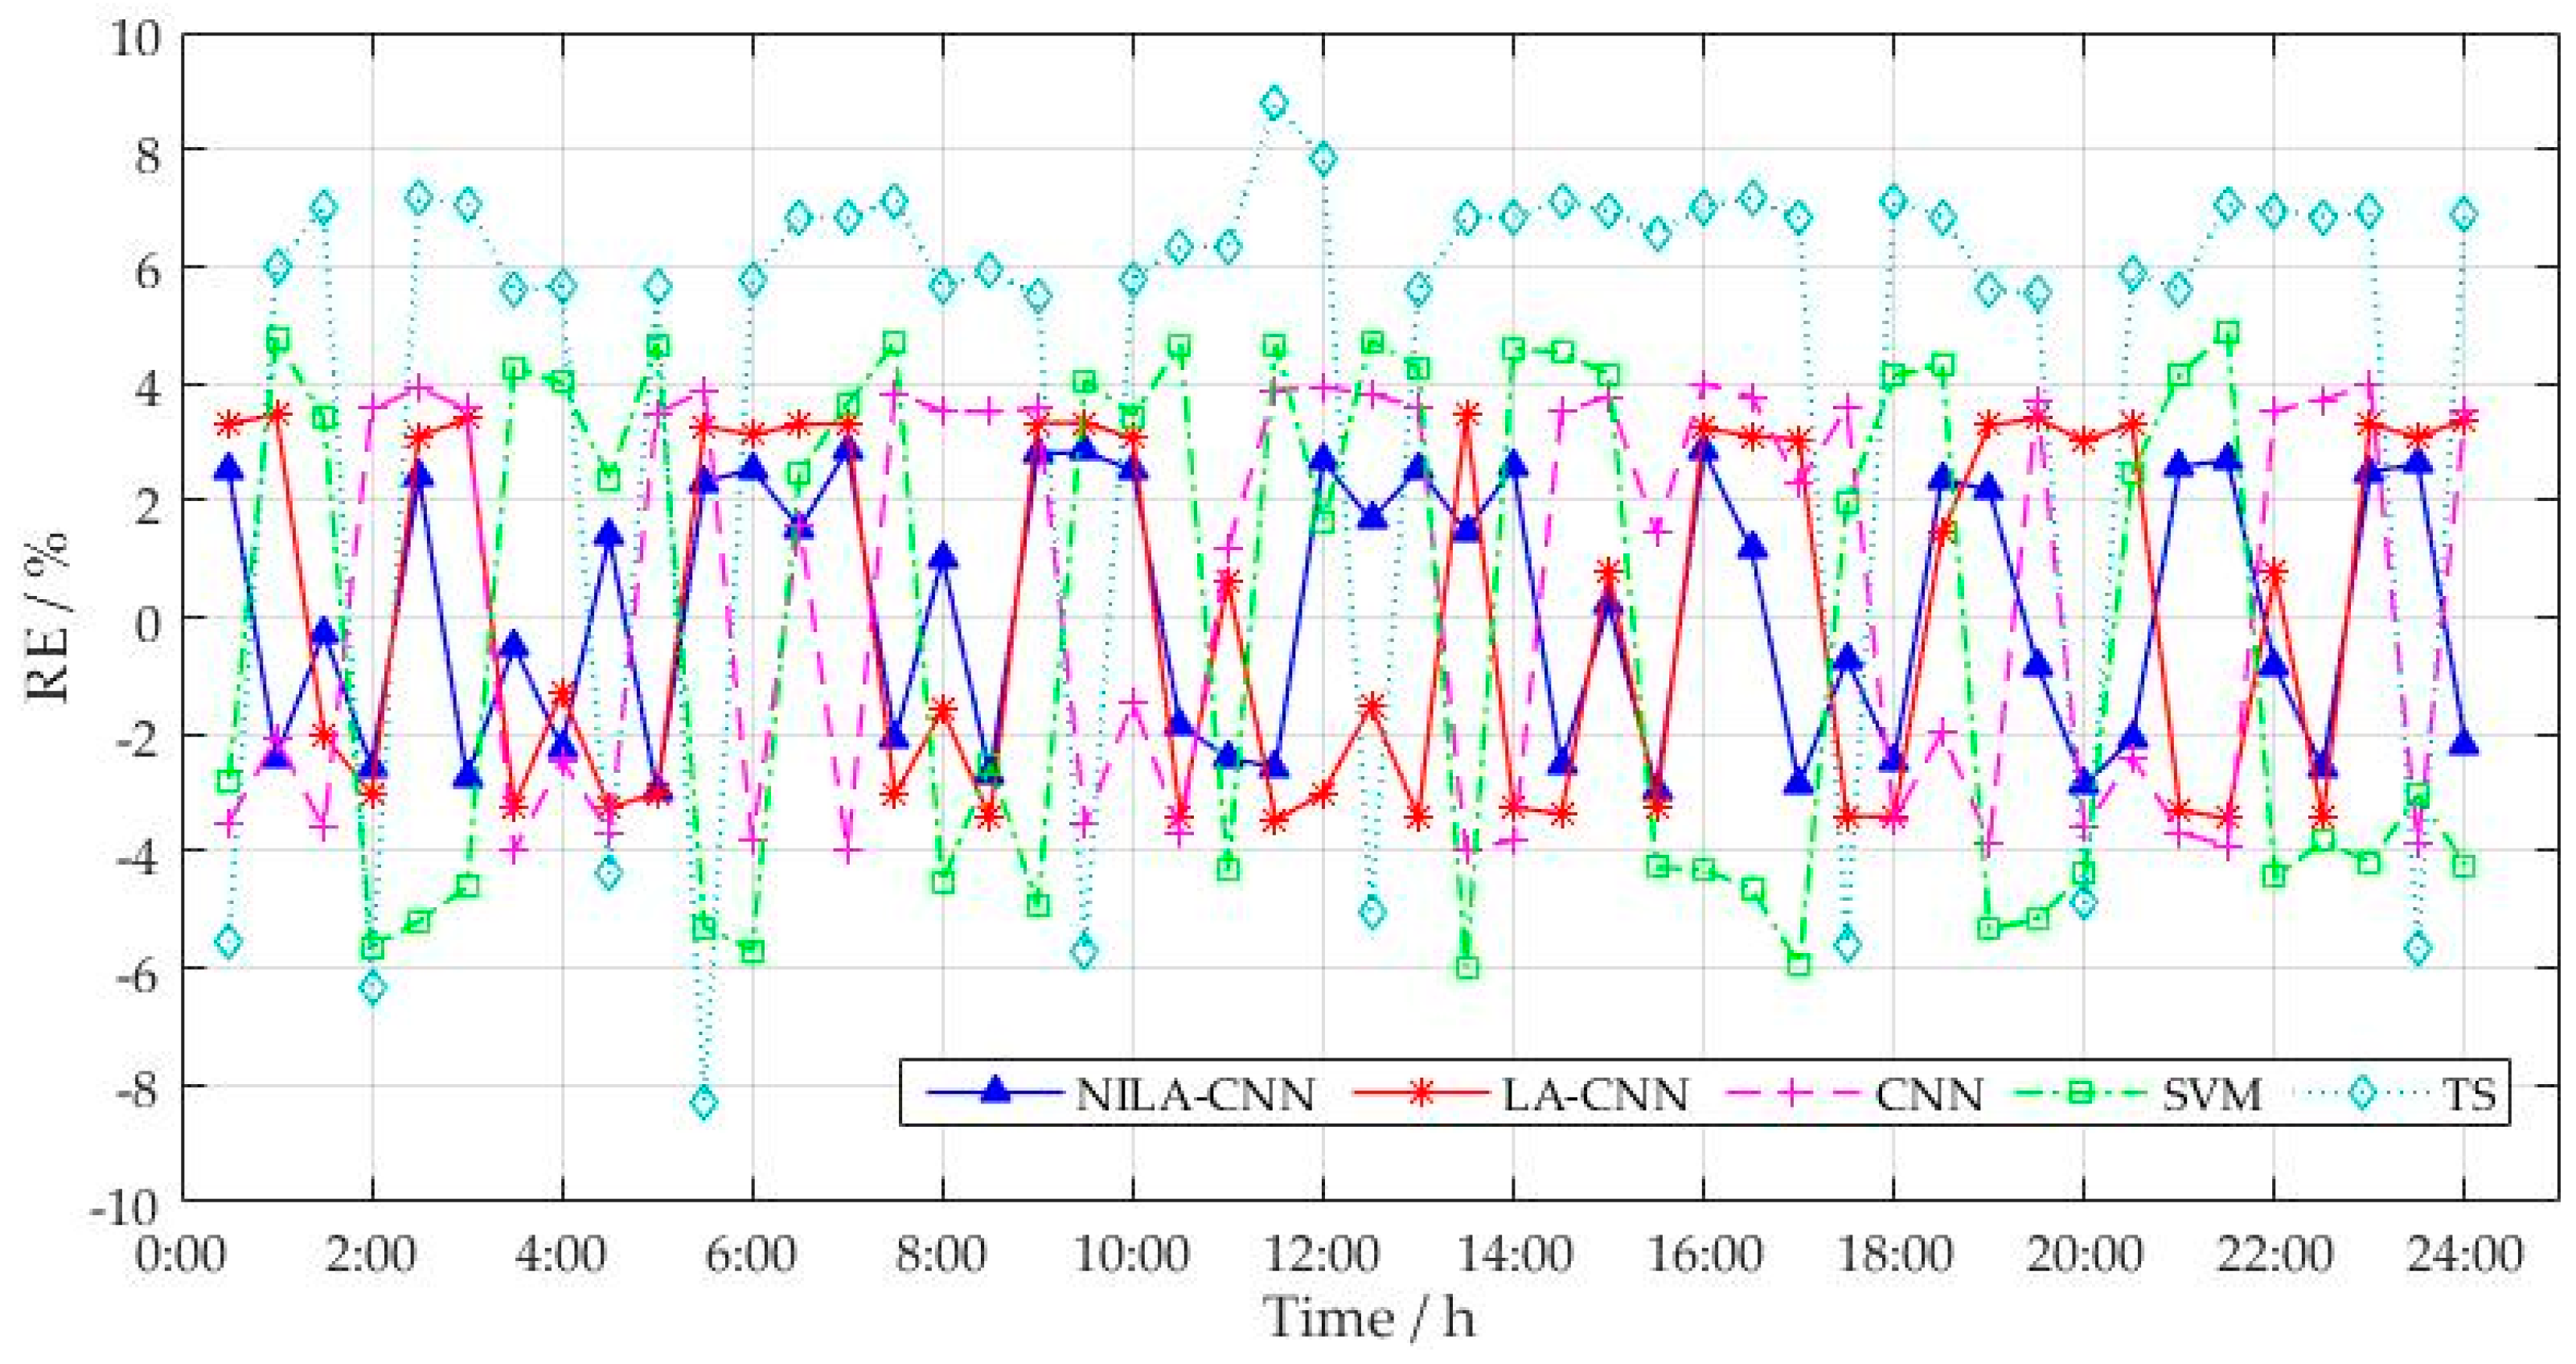
Figure 9 displays the prediction results of Table 2, shown for more intuitive analysis. The values of RE obtained from the forecasting models are illustrated in Figure 10. Under the circumstance of electricity market, the error range between short-term load forecasting and the actual value should be [−3%, +3%]. It can be seen that the prediction error range of NILA-CNN is controlled within [0.23%, 2.86%] while the prediction error ranges of LA-CNN and CNN are [0.62%, 3.47%] and [−4%, 2.28%], respectively. Among them, 6 error points of NILA-CNN are controlled in [−1%, 1%], while the corresponding number of LA-CNN and CNN are 3 and 0. The errors of SVM model mostly range from [−6%, −4%] or [4%, 6%], and additionally, the errors of TS present a large fluctuation ranging, from [−8%, −5%] and [5%, 8%]. Thus, the prediction precision from the superior to the inferior can be ranked as follows: NILA-CNN, LA-CNN, CNN, SVM, TS. This demonstrates that NI can effectively improve the performance of LA. Further, NILA is conducive to high forecasting accuracy, due to the optimal parameter setting in the CNN model. Although the prediction results of NILA-CNN model are greater than other four methods in some points, such as at 10: 30, the overall errors perform the best.
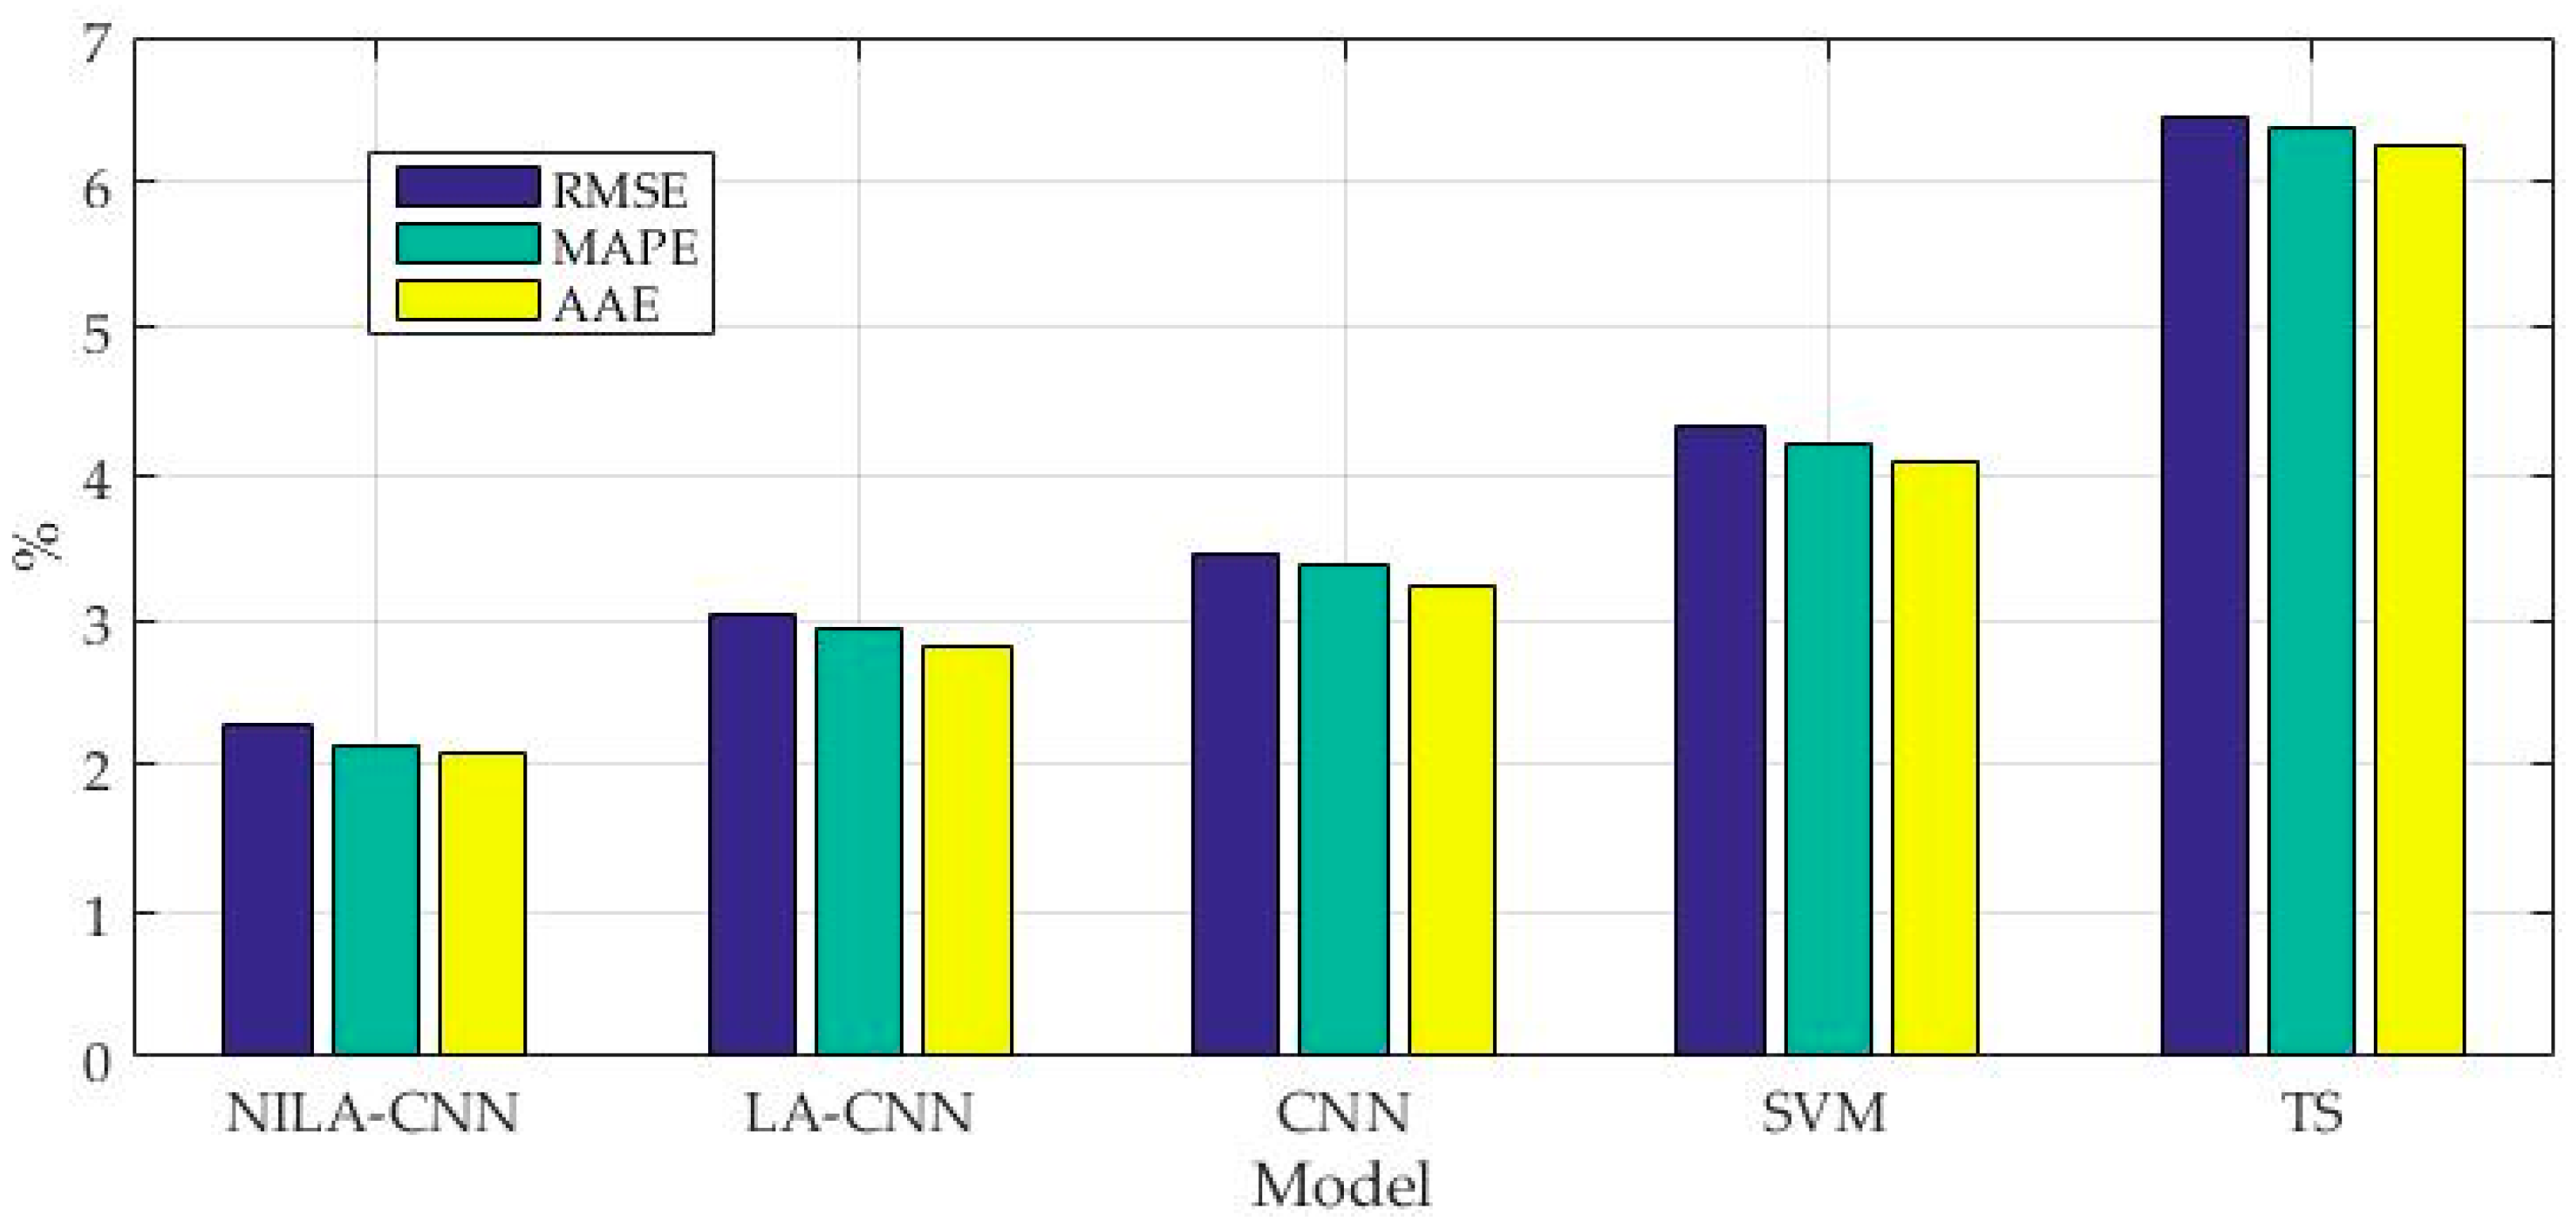
The statistical errors of the five prediction models are displayed in Figure 11. The analysis shows that: (a) NILA-CNN model outperforms other four techniques in terms of RMSE (2.27%), MAPE (2.14%) and AAE (2.096%). (b) Compared with LA-CNN, NI avoids premature convergence based on increasing the diversity of lion population. (c) The generalization ability and prediction accuracy of the CNN model can be improved by parameter optimization. (d) the CNN model can make a deep excavation of the internal relationship between the influential factors and the load of EV charging station in comparison with SVM. (e) ANN can reflect the non-linear relationship more accurately than TS methods.
5. Further Study
In order to further verify the effectiveness of the proposed model, one more case which selects the data from another EV charging station is provided in this paper. The study is carried out with data from 1 June 2016 to 31 May 2017. To reflect the influence of seasonal factors on load, data from 7 days of each season are selected as a test set, with the rest as a training set. The specific data division is shown in Table 3.
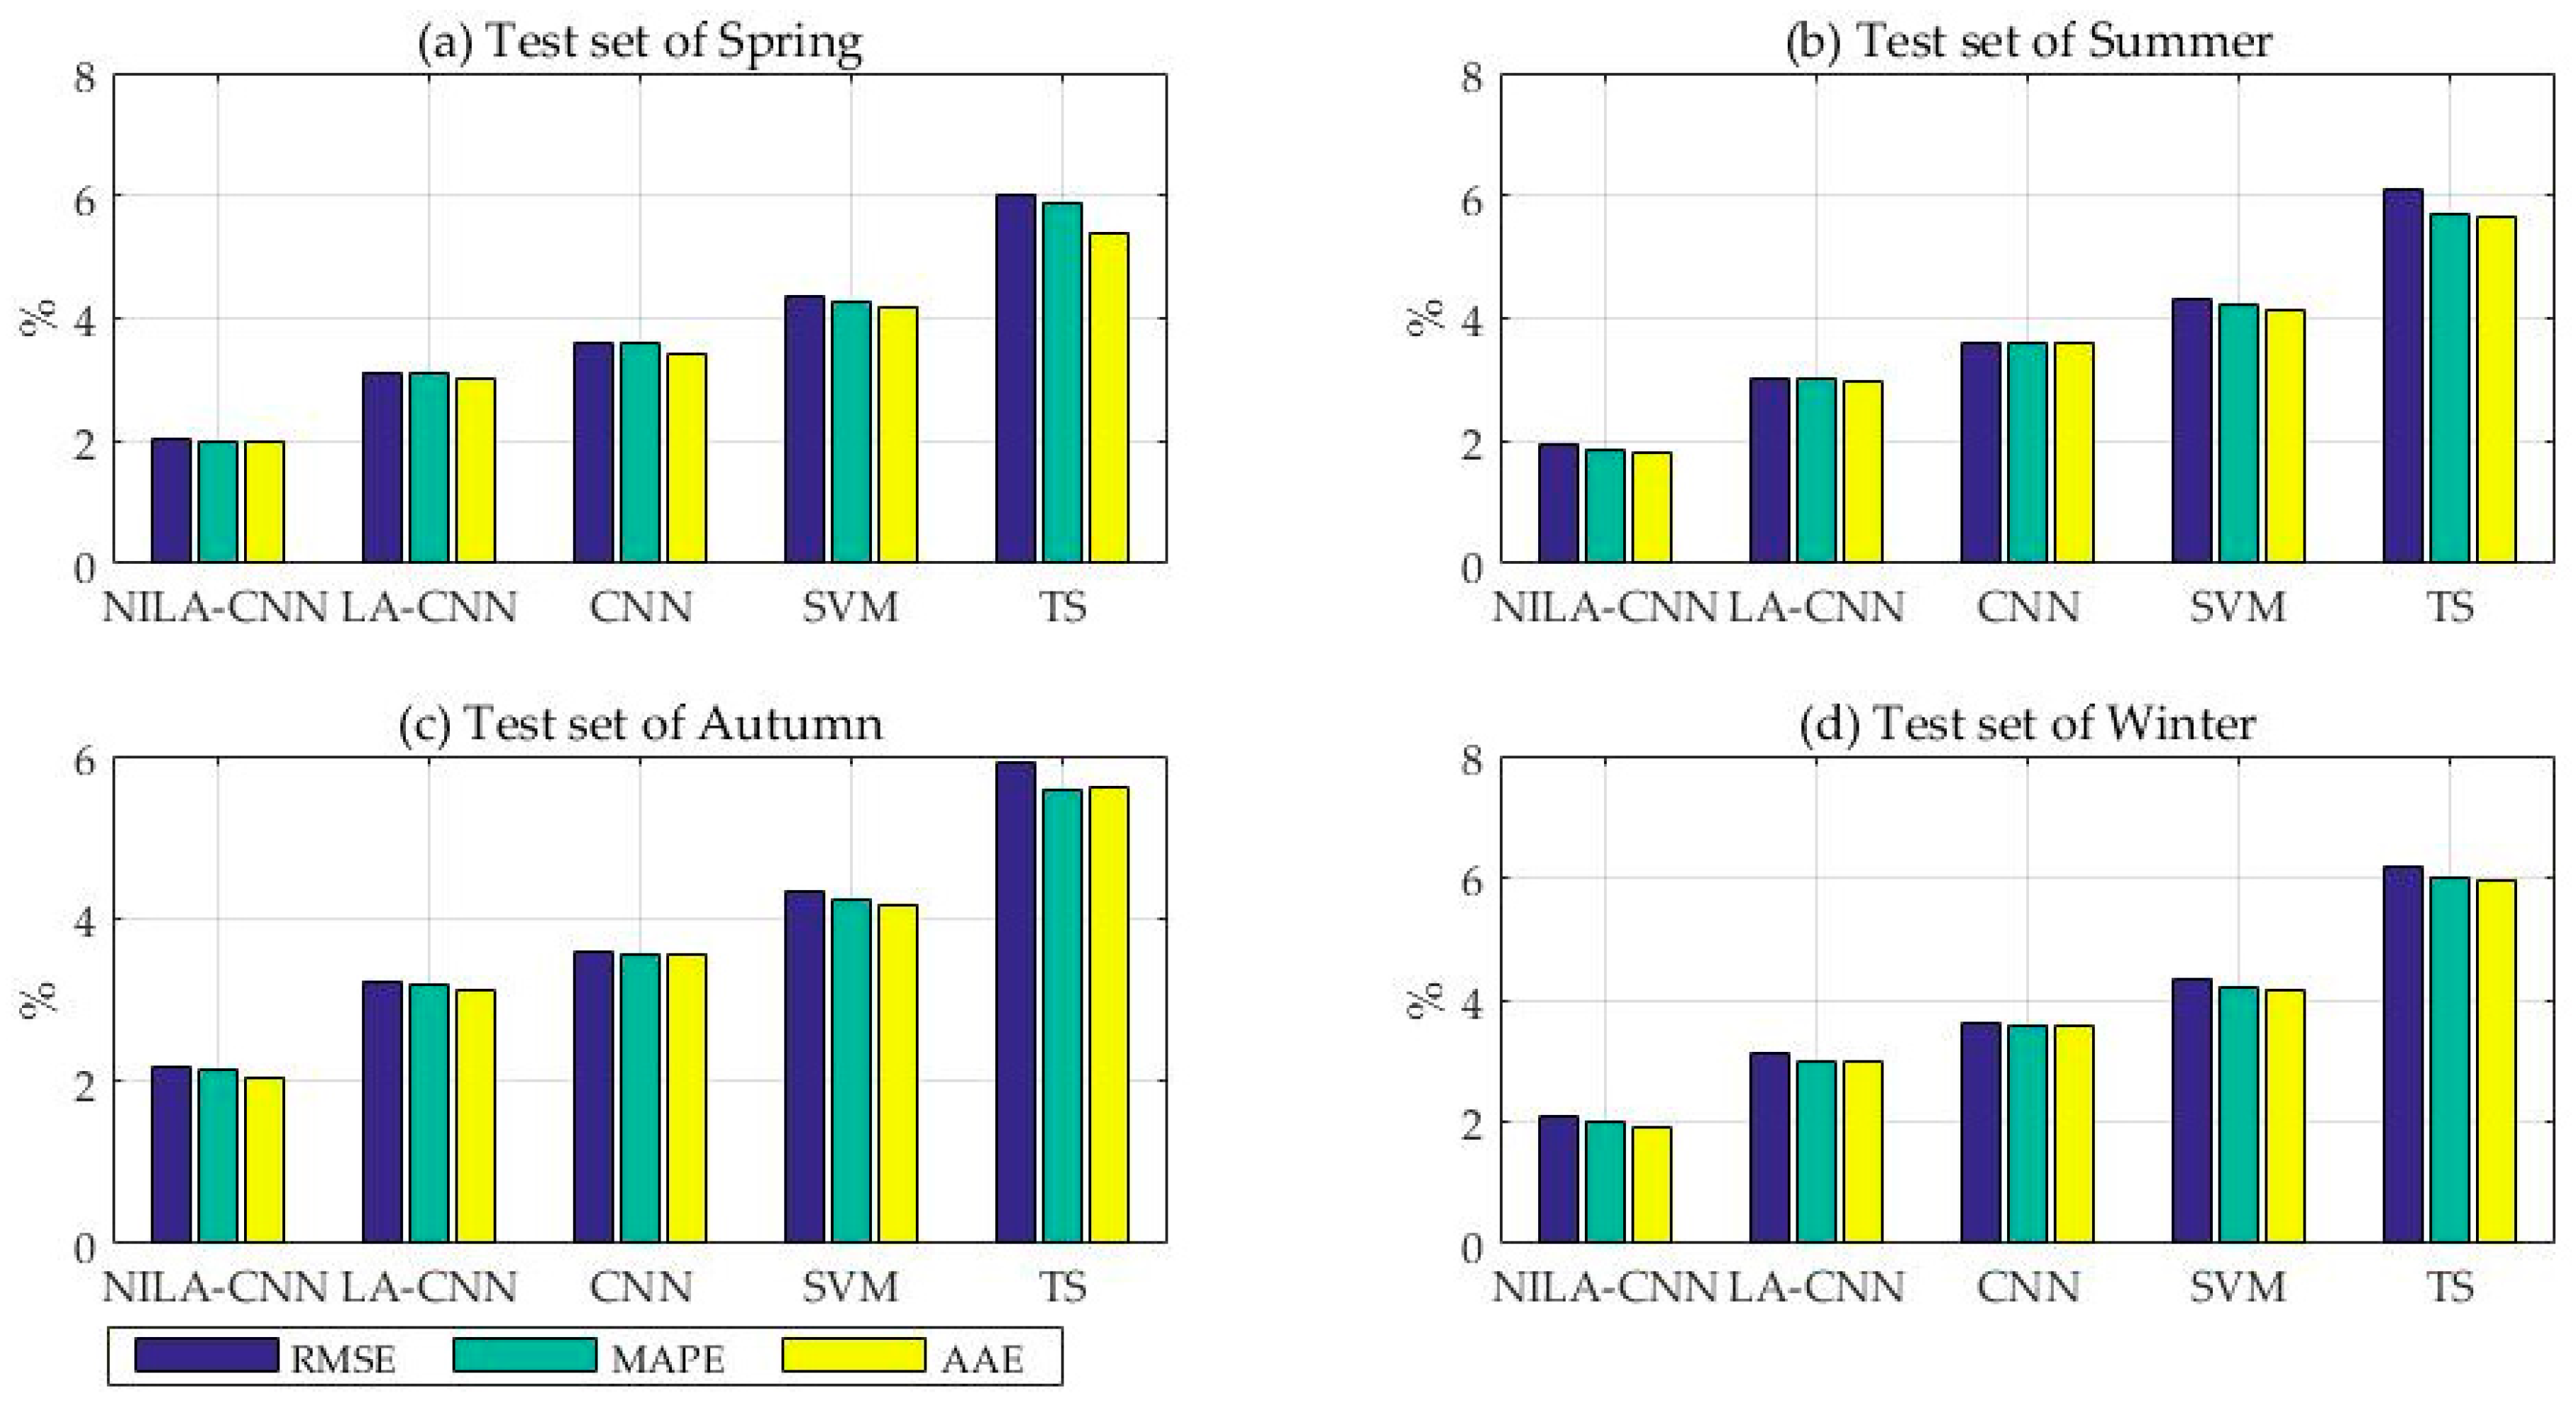
The five models shown above are still used in this experiment, where the parameter settings of NILA-CNN, LA-CNN and CNN are consistent. In SVM, the regularization parameter is 2.0153, the kernel parameter is 0.015, and the loss parameter is 0.013. The statistical errors including RMSE, MAPE and AAE are displayed in Figure 12.
As demonstrated in Figure 12, the values of RMSE, MAPE and AAE of NILA-CNN in four seasons are all the lowest among the forecasting techniques, namely 2.010, 2.00% and 1.97% in Spring, 1.93%, 1.86% and 1.80% in Summer, 2.16%, 2.14% and 2.04% in Autumn, 2.07%, 2.00% and 1.90% in Winter. Meanwhile, it can be noted that the overall prediction accuracy of LA-CNN is better than that of the CNN model, and CNN-based approaches are superior to SVM and TS, which proves the advantages of NI, LA and CNN. Therefore, the short-term load forecasting for EV charging stations based on the NILA-CNN model is efficient enough to compete with existing approaches in prediction precision. As a hybrid algorithm, the proposed model is able to provide accurate data support for economic operation of the charging station.
6. Conclusions
In recent years, with the gradually worsening energy crisis and the intensification of global warming, EVs have become one of the main development directions for new energy vehicles due, to their energy savings and emission reductions. EV charging stations are an important part of the power load; thus, research on their short-term load forecasting is not only of great significance for economic dispatch in the grid, but also contributes to stable operation of the charging station. In this paper, a short-term load forecasting method for EV charging stations combining NILA with CNN is established, where NI is used to improve the optimization performance of LA, and the hybrid technique NILA is introduced to determine the optimal parameters of CNN model, so as to obtain better prediction accuracy. Through analysis of load characteristics in the charging station, ten influential factors are selected as input, including seasonal category, maximum temperature, minimum temperature, weather condition, day type, and the loads at the same moment in previous five days. According to the case studies, CNN integrated with NILA outperforms other models in terms of prediction precision, indicating that NILA-CNN model is a promising technique for short-term load forecasting of EV charging station.
Author Contributions
Y.L. designed this research and wrote this paper; Y.H. provided professional guidance; M.Z. processed the data and revised this paper.
Funding
This research was funded by [the Fundamental Research Funds for the Central Universities] grant number [2014MS146].
Acknowledgments
This work is supported by the Fundamental Research Funds for the Central Universities (Project No. 2014MS146).
Conflicts of Interest
The authors declare no conflict of interest.
Abbreviations
| EV | Electric vehicle |
| CNN | Convolutional neural network |
| LA | Lion algorithm |
| NI | Niche immunity |
| NILA | Lion algorithm improved by niche immunity |
| ANN | Artificial neural network |
| SVM | Support vector machine |
| RBFNN | Radial basis function neural network |
| TS | time series |
| RE | Relative error |
| RMSE | Root mean square error |
| MAPE | Mean absolute percentage error |
| AAE | Average absolute error |
| LA-CNN | Convolutional neural network optimized by lion algorithm |
| NILA-CNN | Convolutional neural network optimized by niche immunity lion algorithm |
References
- Tribioli, L. Energy-Based Design of Powertrain for a Re-Engineered Post-Transmission Hybrid Electric Vehicle. Energies 2017, 10, 918. [Google Scholar] [CrossRef]
- Tan, K.M.; Ramachandaramurthy, V.K.; Yong, J.Y.; Padmanaban, S.; Mihet-Popa, L.; Blaabjerg, F. Minimization of Load Variance in Power Grids—Investigation on Optimal Vehicle-to-Grid Scheduling. Energies 2017, 10, 1880. [Google Scholar] [CrossRef]
- Zhang, Y.; Su, X.; Yan, X.; Li, M.; Li, D.D. A method of charging load forecast based on electric vehicle time-space characteristics. Electr. Power Constr. 2015, 7, 75–82. [Google Scholar]
- Soares, F.J.; Lopes, J.A.P.; Almeida, P.M.R. A Monte Carlo method to evaluate electric vehicles impacts in distribution networks. In Proceedings of the 2010 IEEE Conference on Innovative Technologies for an Efficient and Reliable Electricity Supply (CITRES), Waltham, MA, USA, 27–29 September 2010; pp. 365–372. [Google Scholar]
- Huang, H.; Chung, C.Y.; Chan, K.W.; Chen, H. Quasi-Monte Carlo Based Probabilistic Small Signal Stability Analysis for Power Systems with Plug-In Electric Vehicle and Wind Power Integration. IEEE Trans. Power Syst. 2013, 28, 3335–3343. [Google Scholar] [CrossRef]
- Ashtari, A.; Bibeau, E.; Shahidinejad, S.; Molinski, T. PEV charging profile prediction and analysis based on vehicle usage data. IEEE Trans. Smart Grid 2012, 3, 341–350. [Google Scholar] [CrossRef]
- Bing, Y.; Wang, L.; Liao, C. Charging Load Calculation Method of Large-scale Electric Vehicles with Coupling Characteristics. Autom. Electr. Power Syst. 2015, 39, 76–82. [Google Scholar]
- Huang, X.Q.; Chen, J.; Chen, Y.; Yang, H.; Cao, Y.; Jiang, L. Load forecasting method for electric vehicle charging station based on big data. Autom. Electr. Power Syst. 2016, 12, 68–74. [Google Scholar]
- Kachoosangi, F.T. How Reliable Are ANN, ANFIS, and SVM Techniques for Predicting Longitudinal Dispersion Coefficient in Natural Rivers? J. Hydraul. Eng. 2016, 142, 04015039. [Google Scholar]
- Zhang, W.; Xie, F.; Huang, M.; Li, J.; Li, Y. Research on short-term load forecasting methods of electric buses charging station. Power Syst. Prot. Control 2013, 41, 61–66. [Google Scholar]
- Chang, D.; Ren, J.; Zhao, J.; Duan, X.; Gong, W.; Zhang, Z. Study on short term load forecasting of electric vehicle charging station based on RBF-NN. J. Qingdao Univ. (Eng. Technol. Ed.) 2014, 4, 44–48. [Google Scholar]
- Wang, Z.; Dai, B.; Li, X. Research of Short-Term Load Forecasting Model for Electrical Vehicle Charging Stations based on PSO-SNN. Electr. Eng. 2016, 17, 46–50. [Google Scholar]
- Luo, Z.; Hu, Z.; Song, Y.; Yang, X.; Zhan, K.; Wu, J. Study on plug-in electric vehicles charging load calculating. Autom. Electr. Power Syst. 2011, 35, 36–42. [Google Scholar]
- Schmidhuber, J. Deep learning in neural networks: An overview. Neural Netw. 2015, 61, 85–117. [Google Scholar] [CrossRef] [PubMed]
- Shi, J.; Zhang, J. Ultra Short-Term Photovoltaic Refined Forecasting Model Based on Deep Learning. Electr. Power Constr. 2017, 38, 28–35. [Google Scholar]
- Li, S.; Lin, L.; Sun, C. Click-Through Rate Prediction for Search Advertising based on Convolution Neural Network. Intell. Comput. Appl. 2015, 5, 22–25. [Google Scholar]
- Wallach, I.; Dzamba, M.; Heifets, A. AtomNet: A Deep Convolutional Neural Network for Bioactivity Prediction in Structure-based Drug Discovery. Math. Z. 2015, 47, 34–46. [Google Scholar]
- Sss, K.; Ayush, K.; Babu, R.V. DeepFix: A Fully Convolutional Neural Network for Predicting Human Eye Fixations. IEEE Trans. Image Process. 2017, 26, 4446–4456. [Google Scholar]
- Ruiz, G.R.; Bandera, C.F.; Temes, T.G.; Gutierrez, A.S. Genetic algorithm for building envelope calibration. Appl. Energy 2016, 168, 691–705. [Google Scholar] [CrossRef]
- Chen, Z.; Xiong, R.; Cao, J. Particle swarm optimization-based optimal power management of plug-in hybrid electric vehicles considering uncertain driving conditions. Energy 2016, 96, 197–208. [Google Scholar] [CrossRef]
- Ye, K.; Zhang, C.; Ning, J.; Liu, X. Ant-colony algorithm with a strengthened negative-feedback mechanism for constraint-satisfaction problems. Inf. Sci. 2017, 406, 29–41. [Google Scholar] [CrossRef]
- Rajakumar, B.R. The Lion’s Algorithm: A New Nature-Inspired Search Algorithm. Procedia Technol. 2012, 6, 126–135. [Google Scholar] [CrossRef]
- Liu, J.; Wang, H.; Sun, Y.; Li, L. Adaptive niche quantum-inspired immune clonal algorithm. Nat. Comput. 2016, 15, 297–305. [Google Scholar] [CrossRef]
- Lawrence, S.; Giles, C.L.; Tsoi, A.C. Face recognition: a convolutional neural-network approach. IEEE Trans. Neural Netw. 1997, 8, 98–113. [Google Scholar] [CrossRef] [PubMed]
- Dieleman, S.; Willett, K.W.; Dambre, J. Rotation-invariant convolutional neural networks for galaxy morphology prediction. Mon. Not. R. Astron. Soc. 2015, 450, 1441–1459. [Google Scholar] [CrossRef]
- Li, M.; Ling, C.; Xu, Q.; Gao, J. Classification of G-protein coupled receptors based on a rich generation of convolutional neural network, N-gram transformation and multiple sequence alignments. Amino Acids 2017, 50, 255–266. [Google Scholar] [CrossRef] [PubMed]
- Ovalle, A.; Fernandez, J.; Hably, A.; Bacha, S. An Electric Vehicle Load Management Application of the Mixed Strategist Dynamics and the Maximum Entropy Principle. IEEE Trans. Ind. Electron. 2016, 63, 3060–3071. [Google Scholar] [CrossRef]
- Hu, Z.; Zhan, K.; Zhang, H.; Song, Y. Pricing mechanisms design for guiding electric vehicle charging to fill load valley. Appl. Energy 2016, 178, 155–163. [Google Scholar] [CrossRef]
- Xiang, Y.; Liu, J.; Li, R.; Li, F.; Gu, C.; Tang, S. Economic planning of electric vehicle charging stations considering traffic constraints and load profile templates. Appl. Energy 2016, 178, 647–659. [Google Scholar] [CrossRef]
Figure 1.
Lion defense process.

Figure 2.
Convolutional neural network model.

Figure 3.
Flowchart of Lion Algorithm Improved by Niche Immune (NILA) - Convolutional Neural Network (CNN) algorithm.
Figure 3.
Flowchart of Lion Algorithm Improved by Niche Immune (NILA) - Convolutional Neural Network (CNN) algorithm.

Figure 4.
Typical daily load curves in four seasons.

Figure 5.
Relationship between temperature and daily load of electric vehicle (EV) charging station.
Figure 5.
Relationship between temperature and daily load of electric vehicle (EV) charging station.

Figure 6.
Relationship between weather condition and daily load of EV charging station.

Figure 7.
Relationship between day type and daily load of EV charging station.

Figure 8.
The iterative process of NILA.

Figure 9.
Prediction results.

Figure 10.
RE of prediction methods.

Figure 11.
RMSE, MAPE and AAE of prediction methods (I).

Figure 12.
RMSE, MAPE and AAE of prediction methods (II). ((a) is the error results of test set in Spring; (b) is the error results of test set in Summer; (c) is the error results of test set in Autumn; (d) is the error results of test set in Winter).
Figure 12.
RMSE, MAPE and AAE of prediction methods (II). ((a) is the error results of test set in Spring; (b) is the error results of test set in Summer; (c) is the error results of test set in Autumn; (d) is the error results of test set in Winter).


Table 1.
Statistically significant parameters of the collecting data.
| Statistics | Total Days | Maximum Load (MW) | Minimum Load (MW) | Maximum Temperature (°C) | Minimum Temperature (°C) |
|---|---|---|---|---|---|
| Value | 547 | 5.212 | 0.006 | 36 | −13 |
| Statistics | Number of days in spring (day) | Number of days in summer (day) | Number of days in autumn (day) | Number of days in winter (day) | Number of precipitation days (day) |
| Value | 92 | 184 | 182 | 89 | 76 |
Table 2.
Actual load and forecasting results in 30 November 2017 (Unit: MW).
| Time/h | Actual Data | NILA-CNN | LA-CNN | CNN | SVM | TS |
|---|---|---|---|---|---|---|
| 0:00 | 0.374 | 0.384 | 0.387 | 0.361 | 0.364 | 0.354 |
| 0:30 | 0.408 | 0.398 | 0.422 | 0.399 | 0.427 | 0.432 |
| 1:00 | 0.282 | 0.282 | 0.277 | 0.272 | 0.292 | 0.302 |
| 1:30 | 0.262 | 0.255 | 0.254 | 0.271 | 0.247 | 0.245 |
| 2:00 | 0.402 | 0.411 | 0.414 | 0.418 | 0.381 | 0.431 |
| 2:30 | 0.330 | 0.321 | 0.341 | 0.342 | 0.315 | 0.353 |
| 3:00 | 0.269 | 0.267 | 0.260 | 0.258 | 0.280 | 0.284 |
| 3:30 | 0.247 | 0.242 | 0.244 | 0.241 | 0.257 | 0.261 |
| 4:00 | 0.251 | 0.254 | 0.243 | 0.242 | 0.257 | 0.240 |
| 4:30 | 0.253 | 0.245 | 0.245 | 0.262 | 0.265 | 0.267 |
| 5:00 | 0.246 | 0.252 | 0.255 | 0.256 | 0.233 | 0.226 |
| 5:30 | 0.269 | 0.276 | 0.277 | 0.259 | 0.254 | 0.285 |
| 6:00 | 0.503 | 0.510 | 0.519 | 0.510 | 0.515 | 0.537 |
| 6:30 | 0.696 | 0.715 | 0.719 | 0.668 | 0.721 | 0.743 |
| 7:00 | 0.850 | 0.832 | 0.824 | 0.882 | 0.889 | 0.910 |
| 7:30 | 1.003 | 1.013 | 0.987 | 1.038 | 0.957 | 1.059 |
| 8:00 | 1.560 | 1.518 | 1.507 | 1.615 | 1.521 | 1.653 |
| 8:30 | 1.999 | 2.055 | 2.066 | 2.071 | 1.901 | 2.109 |
| 9:00 | 2.100 | 2.159 | 2.170 | 2.025 | 2.185 | 1.980 |
| 9:30 | 2.316 | 2.374 | 2.387 | 2.283 | 2.396 | 2.450 |
| 10:00 | 3.757 | 3.687 | 3.628 | 3.618 | 3.932 | 3.995 |
| 10:30 | 3.761 | 3.671 | 3.784 | 3.806 | 3.598 | 4.000 |
| 11:00 | 3.612 | 3.519 | 3.486 | 3.752 | 3.780 | 3.928 |
| 11:30 | 3.821 | 3.923 | 3.706 | 3.971 | 3.883 | 4.120 |
| 12:00 | 2.635 | 2.679 | 2.595 | 2.736 | 2.760 | 2.503 |
| 12:30 | 2.882 | 2.955 | 2.783 | 2.985 | 3.004 | 3.043 |
| 13:00 | 3.354 | 3.403 | 3.470 | 3.220 | 3.153 | 3.582 |
| 13:30 | 3.832 | 3.930 | 3.707 | 3.686 | 4.008 | 4.094 |
| 14:00 | 4.335 | 4.225 | 4.189 | 4.487 | 4.531 | 4.643 |
| 14:30 | 3.867 | 3.876 | 3.897 | 4.013 | 4.028 | 4.136 |
| 15:00 | 4.063 | 3.942 | 3.931 | 4.121 | 3.889 | 4.330 |
| 15:30 | 4.559 | 4.688 | 4.707 | 4.741 | 4.363 | 4.879 |
| 16:00 | 4.654 | 4.708 | 4.799 | 4.830 | 4.438 | 4.988 |
| 16:30 | 3.819 | 3.710 | 3.936 | 3.906 | 3.593 | 4.079 |
| 17:00 | 3.498 | 3.472 | 3.379 | 3.623 | 3.566 | 3.303 |
| 17:30 | 2.959 | 2.886 | 2.858 | 2.856 | 3.081 | 3.170 |
| 18:00 | 2.647 | 2.710 | 2.686 | 2.595 | 2.762 | 2.829 |
| 18:30 | 2.695 | 2.753 | 2.783 | 2.591 | 2.551 | 2.846 |
| 19:00 | 2.795 | 2.773 | 2.890 | 2.898 | 2.651 | 2.950 |
| 19:30 | 3.158 | 3.068 | 3.253 | 3.044 | 3.020 | 3.003 |
| 20:00 | 3.479 | 3.407 | 3.594 | 3.396 | 3.565 | 3.684 |
| 20:30 | 4.271 | 4.381 | 4.130 | 4.114 | 4.449 | 4.511 |
| 21:00 | 3.577 | 3.673 | 3.454 | 3.437 | 3.752 | 3.829 |
| 21:30 | 2.605 | 2.583 | 2.625 | 2.697 | 2.489 | 2.787 |
| 22:00 | 2.059 | 2.006 | 1.988 | 2.136 | 1.980 | 2.200 |
| 22:30 | 1.831 | 1.876 | 1.891 | 1.904 | 1.754 | 1.958 |
| 23:00 | 1.135 | 1.165 | 1.170 | 1.091 | 1.101 | 1.071 |
| 23:30 | 0.447 | 0.438 | 0.462 | 0.463 | 0.428 | 0.478 |
Table 3.
The data division of case two.
| Data Type | Data Range | Season Type |
|---|---|---|
| Training set | 1 June 2016–24 August 2016 | Autumn |
| 1 September 2016–23 November 2016 | Winter | |
| 1 December 2016–21 February 2017 | Spring | |
| 1 March 2017–24 May 2017 | Summer | |
| Test set | 25 August 2016–31 August 2016 | Autumn |
| 24 November 2016–30 November 2016 | Winter | |
| 22 February 2017–28 February 2017 | Spring | |
| 25 May 2017–31 May 2017 | Summer |
© 2018 by the authors. Licensee MDPI, Basel, Switzerland. This article is an open access article distributed under the terms and conditions of the Creative Commons Attribution (CC BY) license (http://creativecommons.org/licenses/by/4.0/).
Share and Cite
MDPI and ACS Style
Li, Y.; Huang, Y.; Zhang, M. Short-Term Load Forecasting for Electric Vehicle Charging Station Based on Niche Immunity Lion Algorithm and Convolutional Neural Network. Energies 2018, 11, 1253. https://doi.org/10.3390/en11051253
AMA Style
Li Y, Huang Y, Zhang M. Short-Term Load Forecasting for Electric Vehicle Charging Station Based on Niche Immunity Lion Algorithm and Convolutional Neural Network. Energies. 2018; 11(5):1253. https://doi.org/10.3390/en11051253
Chicago/Turabian StyleLi, Yunyan, Yuansheng Huang, and Meimei Zhang. 2018. "Short-Term Load Forecasting for Electric Vehicle Charging Station Based on Niche Immunity Lion Algorithm and Convolutional Neural Network" Energies 11, no. 5: 1253. https://doi.org/10.3390/en11051253
Note that from the first issue of 2016, this journal uses article numbers instead of page numbers. See further details here.