Is the Fischer-Tropsch Conversion of Biogas-Derived Syngas to Liquid Fuels Feasible at Atmospheric Pressure?


1
School of Chemistry and Chemical Engineering, Queen’s University Belfast, Belfast BT9 5AG, UK
2
School of Mechanical and Aerospace Engineering, Queen’s University Belfast, Belfast BT9 5AH, UK
*
Author to whom correspondence should be addressed.
†
Current address: School of Chemical Engineering and Analytical Sciences, University of Manchester, Manchester M13 9PL, UK.
Energies 2019, 12(6), 1031; https://doi.org/10.3390/en12061031
Submission received: 11 January 2019
/
Revised: 8 March 2019
/
Accepted: 11 March 2019
/
Published: 16 March 2019
(This article belongs to the Special Issue Production and Utilization of Biogas)
Abstract
:Biogas resulting from anaerobic digestion can be utilized for the production of liquid fuels via reforming to syngas followed by the Fischer-Tropsch reaction. Renewable liquid fuels are highly desirable due to their potential for use in existing infrastructure, but current Fischer-Tropsch processes, which require operating pressures of 2–4 MPa (20–40 bar), are unsuitable for the relatively small scale of typical biogas production facilities in the EU, which are agriculture-based. This paper investigates the feasibility of producing liquid fuels from biogas-derived syngas at atmospheric pressure, with a focus on the system’s response to various interruption factors, such as total loss of feed gas, variations to feed ratio, and technical problems in the furnace. Results of laboratory testing showed that the liquid fuel selectivity could reach 60% under the studied conditions of 488 K (215 °C), H2/CO = 2 and 0.1 MPa (1 bar) over a commercial Fischer–Tropsch catalyst. Analysis indicated that the catalyst had two active sites for propagation, one site for the generation of methane and another for the production of liquid fuels and wax products. However, although the production of liquid fuels was verified at atmospheric pressure with high liquid fuel selectivity, the control of such a system to maintain activity is crucial. From an economic perspective, the system would require subsidies to achieve financial viability.
1. Introduction
Global energy consumption is estimated to increase by 77% between 2008 and 2050 [1]; increases to date have been coupled with increases in gasoline and diesel fuel consumption [2]. The combustion of fossil fuels results in damaging environmental effects associated with increasing greenhouse gas (GHG) emissions [3]. New regulations for GHG emissions, together with increasing fuel demands, volatile oil prices, and geopolitical uncertainty of oil supply [4,5,6,7], are driving the development of liquid biofuels which can contribute to meeting fuel demands in a sustainable manner through compliance with legislation such as the EU Renewable Energy Directive (2009/28/EC). Biogas, which mainly consists of carbon dioxide (CO2) and methane (CH4), is a renewable energy source that is generated from the anaerobic digestion (AD) of biomass [8]. Primary energy production from biogas is on an upward trend and in Europe increased from 2.1 Mtoe in 2000 to 16.1 Mtoe in 2016 [9], with the number of biogas plants rising from 6227 to 17,662 between 2009 and 2016 [10]. The majority of biogas is combusted directly on site for electricity and/or heat generation with a growing proportion upgraded to biomethane (i.e., natural gas standard) [9]. Biogas can also be used as a feedstock for syngas production using technologies that are currently applied extensively for reforming natural gas [11]. Syngas is a mixture of hydrogen (H2) and carbon monoxide (CO), and can be utilized in the production of various biofuels, including liquid fuels, through the Fischer-Tropsch (FT) process [12].
As liquid fuels offer compatibility with available infrastructure for electricity, heat, transportation, and storage [13], the investigation of FT synthesis (FTS) and reforming with existing AD plants is an area of considerable interest. While parallel research has investigated the optimization of the reforming process [11], the focus of this paper is on FTS. Although FTS is a well-established technique, it is only recently that the conversion of biomass-derived syngas to liquid fuels via FT has become an area of research interest [14]. A key advantage of FT liquid transportation fuels is that they can directly replace the fossil fuel equivalent, and thus do not affect efficiencies or require changes to existing vehicles [14]. There is a large existing market for oil products in the EU; 595 Mtoe of oil was used in the EU28 in 2016, with the transport sector, which is 94% dependent on oil, accounting for 48% of this [15].
In general, FT products are characterized with a broad carbon distribution (C1 to C30+). Industrially, in order to produce desired fuels (i.e., those in the hydrocarbon range of C5+, such as gasoline, diesel, and kerosene), FT products undergo further chemical transformations such as hydrocracking [16]. Unlike AD, which occurs at atmospheric pressure, current commercial FT processes operate at high pressures of 2–4 MPa (20–40 bar) [17]. These high pressures raise safety concerns and increase the complexity of the process, making plants more expensive to build and operate. Lowering the reaction pressure simplifies the process [18], particularly for small-to-medium scale operations, and allows its direct coupling to AD and reforming systems. Agricultural, rather than large industrial, plants account for the majority of AD installations (70% in the EU) [10], and operation at ambient pressure is therefore a key factor for the practical application of biogas-to-liquids by FT on a typical AD plant. The aim of this paper is to investigate through laboratory experimentation the technical feasibility of the conversion of biogas-derived syngas to liquid fuels by FT at ambient pressure.
FTS has been examined in multiple studies [14,19,20,21,22], and it has been shown that pressure has a profound effect on the product selectivity of FT reactions [23]. Information on ambient pressure FT is, however, scarce in the literature, and focuses largely on the impact of the catalyst formulation on the reaction. Dinse et al. [24] investigated a 12% Co/SiO2 catalyst using a fixed bed reactor and found that at FT conditions of H2/CO = 2 and 493 K (220 °C) with process conditions of 1 atm (0.1 MPa), CO conversion reached 50% with 38% CH4 selectivity and 30% C5+ selectivity. Tavasoli et al. [25] studied the effect of bed residence time on hydrocarbon selectivity at 0.1 MPa (1 bar) and H2/CO = 2 for a 15wt% Co on Al2O3 catalyst. The results showed that up to CO conversion values of 15%, CO conversion is directly proportional to increased bed residence time, after which CH4 selectivity decreases accompanied with an increase in liquid hydrocarbon selectivity. Mirzaei et al. [26] studied the effects of FT reaction parameters (feed ratio, temperature, and pressure) on the CO conversion and product selectivity over a 50%Fe/50%Mn/5wt% Al2O3 catalyst. At optimal conditions of H2/CO = 1 and operating temperature of 633 K (360 °C), it was found that CO conversion reached 84.4% when tested at 0.1 MPa (1 bar), leading to liquid fuel (C5+) selectivity of 13.8% and CH4 selectivity of 29.8%. Most reported studies did not show promising results for C5+ selectivity, with selectivity to CH4 always being higher. However, a recent study by Savost’yanov et al. [27] found that for a 20% Co-2%Al2O3/SiO2 catalyst tested at FT conditions of 0.1 MPa (1 bar), H2/CO = 2, and operating at 463 K (190 °C), the achieved CO conversion was 44% with C5+ selectivity of 74.4%. The objectives of the study were focused on optimization of the catalysts, specifically the effect of Al2O3 promoter loadings, and studying its effect on FT activity over six days. No work was found in the literature where a small-scale Fischer-Tropsch process was undertaken at atmospheric pressure for longer than six days. This paper addresses this gap in knowledge through demonstrating the process for a duration of seven days.
In addition, research on achieving a high selectivity to liquid fuels (C5+) has focused predominantly on the catalysis aspect of the FT reaction with little attention paid to the system as a whole. System analysis is an approach that addresses a subject in terms of interlinked subsystems to create a broader understanding of the key factors affecting the success of the system [28]. Although a systems approach has been used to analyze aspects of biogas and FT fuel production [29,30,31] and optimization [32], no literature was found on liquid fuel production from biogas and none of the literature adopted a systems approach to investigate the effect on overall activity and liquid fuel selectivity of sudden interruptions during operation as could occur in an AD plant, such as feed gas shutdown, temporary electric cut-off, loss of continuous heating, and feed ratio alterations, for more than six days of continuous operation. This knowledge is needed to inform the real-world application of the technology, and this paper addresses this novel area of research. With the overall aim of investigating the feasibility of biogas-derived syngas to liquid fuels by FT at ambient pressure, the objectives of this paper were to (a) show the feasibility of FT at low pressures and to optimize the reaction at 0.1 MPa (1 bar), (b) use a systems approach to investigate the effect on overall activity and liquid fuel selectivity of sudden interruptions during operation, and (c) analyze the economic viability of the process. The research proved the feasibility of producing liquid fuels at 0.1 MPa and 488 K (1 bar and 215 °C), and showed that the process had an overall sturdy response to external factors.
2. Materials and Methods
2.1. Experimental Rig Setup and Reaction Refinement
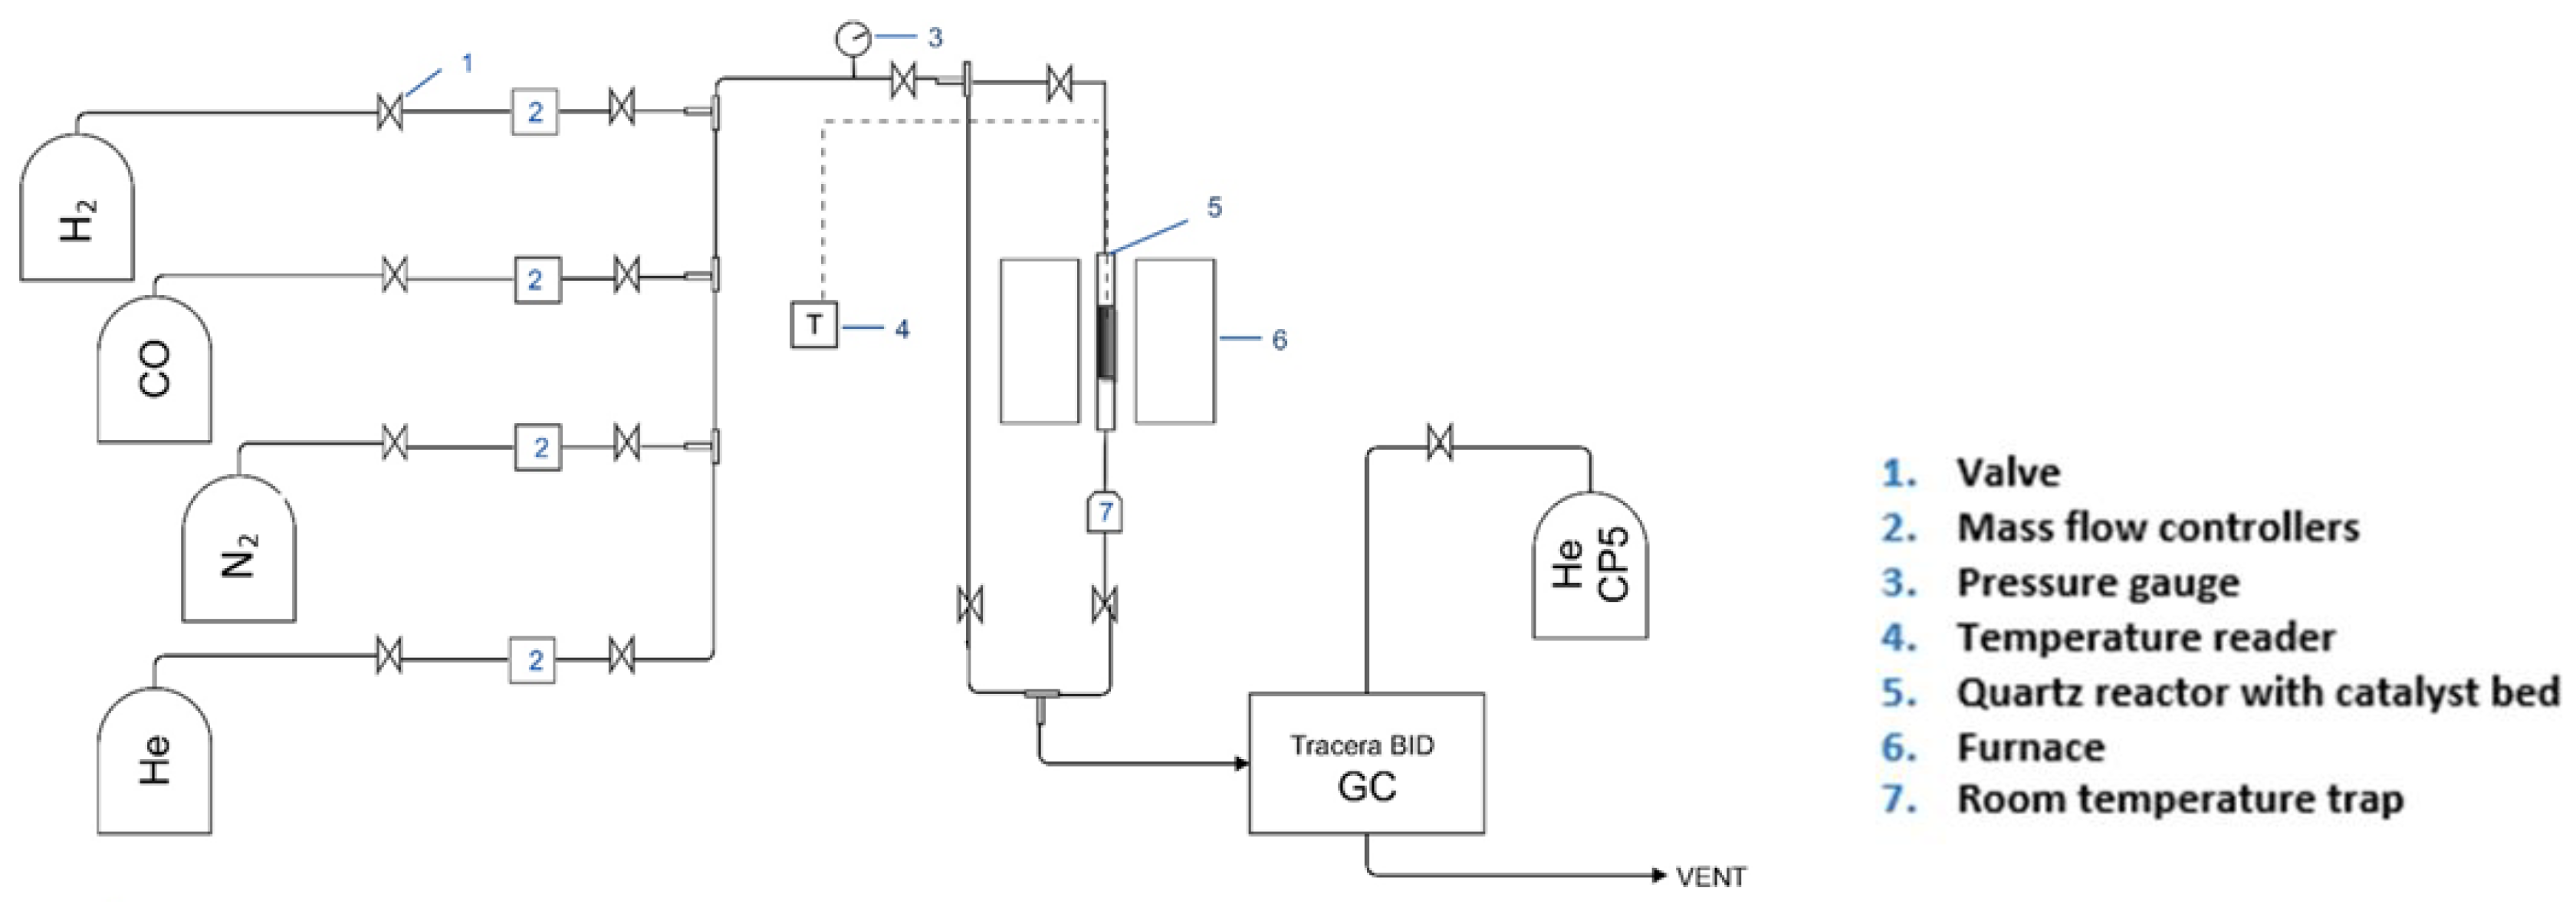
The FTS reaction was carried out in a downflow stainless steel fixed bed reactor (Figure 1). Three reaction tests were conducted with experimental refinement performed at each stage (Table 1 and Table 2) with the aim of increasing the production of liquid fuels in the range C5+. As the focus of the experiment was on system feasibility and robustness rather than on catalyst development, a commercial FT catalyst was used. The catalyst, which was supplied by Clariant®, was in pellet form, and reactions were carried out on the as-received catalyst and also after crushing and sieving the catalyst to 250–300 μm particles. Due to the exothermicity of the FT reaction, the catalyst was mixed with SiC in a 1:2 ratio for all reactions. The catalyst was held in a three-zone furnace (Carbolite SN: 6/01/1603) which allowed temperature consistency over the reactor length. The temperature at the centre of the catalyst bed was monitored with a thermocouple (Type K, Omega). All gases (industrial grade 99.9% purity CO, H2 and N2) were supplied by BOC and the gas flows were controlled by AERA mass flow controllers.
Prior to reaction, the catalyst was reduced in situ in a flow of 40% H2 in He at 26 mL/min. The temperature was ramped up from ambient to 673 K (400 °C) at a rate of 5 K/min (5 °C/min) and held for 16 h after which it was cooled at 5 K/min to 373 K (5 °C/min to 100 °C). This reduction temperature is typical for H2 reduction of Co-based FT catalysts [33], which are the most popular for FTS [34,35]. The reactor was then purged with He for 15 min, before introducing the syngas feed (H2 and CO) at 32.5 mL/min, which included 7.6% volume of N2 as the internal standard. The temperature of the reactor was then increased at 1 K/min (1 °C/min) until it reached the desired operating temperature of 488 K (215 °C). The operating pressure was held at 0.1 MPa (1 bar) (i.e., atmospheric) and a H2/CO ratio of 2 was used for all tests.
The outlet from the reactor passed through heated >373 K (>100 °C) stainless steel tubing to minimize condensation of liquid products and into an online Tracera gas chromatograph (GC) with barrier discharge ionization detector (BID) (Tracera BID-GC solution, Shimadzu, Japan) equipped with three columns provided by Restek. Two of them were packed columns (2 m shin carbon ST 80/100 of 0.53 mm ID and 1 m stainless steel Porapak N packed of 2 mm ID), and were used for the analysis of H2, N2, CO, CH4, and CO2. The third column was a capillary column (30 m RT alumina of 0.53 mm ID), and was used for the analysis of products between C2 and C10. The addition of a room temperature liquid trap to the system allowed collection of liquid/wax products during the reaction; a portion of the liquid sample was removed at intervals during the reaction, diluted in dichloromethane and analyzed by gas chromatography-mass spectrometry (GC-MS) (Agilent Technologies 7890B GC system, 5977A MSD G7038A-USA). Postreaction analysis of the catalyst by thermogravimetric analysis (TGA) (Mettler Toledo TGA/DSC 1 STARe System CH-8603-Switzerland) and thermal desorption GC-MS (Perkin Elmer turbo matrix hs50 head space sampler ATD 400-USA) was also performed to probe the carbon number range of hydrocarbons retained on the catalyst. Further details are given in Appendix A.
Catalyst activity is described by the percentage conversion of CO (Equation (1)) and the percentage hydrocarbon product selectivity (Equation (2)).
where Area (CO bypass) and Area (N2 bypass) are the initial peak areas of CO and N2, respectively, obtained from five bypass runs, while Area (CO reaction) and Area (N2 reaction) are the peak areas of CO and N2, respectively, obtained from the GC postreaction.
where Area (Cn) is the peak area of a hydrocarbon with n number of carbons [36].
2.2. Testing the FTS System’s Robustness by the Introduction of Interruption Factors
R4 (Table 3) was setup based on the findings of the reaction refinement stage, and the system robustness was studied in four different zones in an attempt to regenerate the catalytic activity and to investigate the system’s response to interruption in gas feed ratio, electric shutdowns, or gas stream shutdowns (Table 4). The activity and selectivity were monitored by GC with liquid/wax samples collected at days 3, 6, 11, and 16. The catalyst was collected after 16 days of reaction and analyzed by TGA and temperature programmed desorption (TPD) (also known as thermal desorption (TD)). Further details are given in Appendix A.
2.3. Economic Feasibility of the Fischer-Tropsch Conversion of Biogas-Derived Syngas to Liquid Fuels
The economic feasibility of liquid fuels produced from biogas-derived syngas was investigated for the heat (H) and transport (T) markets, as they are both large existing consumers of fossil liquid fuels and have lagged behind the electricity sector in terms of progress towards renewable energy targets (in the EU in 2016 there was 18% of renewables in final heating and cooling energy and 7% in final transport energy, compared to 30% in the electricity sector [37]). The results were compared to the more conventional routes to market via compressed and liquefied natural gas (CNG and LNG) under the following scenarios.
- Scenario H1/T1: AD » biogas » reforming » syngas » Fischer-Tropsch » liquid fuel » heat/transport
- Scenario H2/T2: AD » biogas » upgrading » biomethane » compression » CNG » heat/transport
- Scenario H3/T3: AD » biogas » upgrading » biomethane » liquefaction » LNG » heat/transport
This case study was based in Northern Ireland, UK; an AD plant producing approximately 860,000 m3/year of biogas from grass silage was assumed based on (a) typical farm size and type in the region [38], (b) previous work by the authors on the analysis of the grass biogas system [39], and (c) the typical size of small to medium scale AD plants in the region, which is <500 kWe [40]. The biogas production cost was assumed to be St£0.4/m3 [41,42] (values in British pounds Sterling). Clean biogas at 55% CH4 and 45% CO2 was assumed.
Profitability calculations were carried out using the return on capital employed (ROCE) technique (Equation (3)). The annual profit is calculated by subtracting the total annual expenditure from the total annual income. Expenditure and income are broken down into variable and fixed components: fixed costs are expenses which do not change with output, e.g., machinery, buildings, depreciation, and interest rates, while variable costs/income vary directly with output, e.g., gas and electricity costs. The annual expenditure is comprised of capital costs and the costs for maintenance and operation (Table 5). Due to a lack of cost information in the literature on small-scale reforming and Fischer-Tropsch, the costs for these technologies were estimated from data from larger plants (Equation (4) [43]) to account for the increased costs per unit output with decreasing plant size. The annual capital investment costs are the yearly costs for the capital loan for buildings, machinery, and any additional equipment required (Equation (5)). Straight line depreciation was applied (Equation (6)) and added to the yearly expenditure. The plant lifetime was assumed to be 15 years [41].
Income was from the sale of the produced fuels and other by-products (Table 6 and Table 7). The Northern Ireland Renewable Heat Incentive (RHI) provided support in the heat sector. The RHI gave an upfront payment of St£2500 and a tariff of St£0.075/kW (2015). However, the RHI incentive was suspended for new customers on the 29th February 2016 due to concerns over the scheme setup. Calculations with and without the support scheme were therefore performed. (When RHI is considered it is simply added to the wholesale gas price (where applicable) in the heating income formula.) To highlight the importance of support schemes in pushing technologies forward, current tariffs were adjusted to profitable values based on the minimum return required from the renewable sector (7.25% ROCE [44], which is seen as a minimum acceptable level for these type of investments due to the high investment risk and the short project lifetime of 15 years). Further details are presented in Appendix B.
where C is the annual repayment amount (St£/y), r is the annual interest rate (fraction), P is the capital invested (St£), and N is the number of payment terms (i.e., number of years to pay back the loan).
3. Results and Discussion
3.1. Iterative Refinement of the FT Reaction at 0.1 MPa (1 bar) (R1, R2, and R3)
As the mass of catalyst was increased from 0.2 g (R1) to 0.4 g (R2), the average CO conversion after three days on stream at 488 K (215 °C) increased from 2% to 7% (Figure 2), however methane was the major product formed with 97% selectivity for the 0.2 g reaction (Figure 3) and 72% selectivity for the 0.4 g reaction (Figure 4). During the time on stream (TOS) of 3.5 days, a small increase in pressure from 0.1 MPa to 0.15 MPa (1 bar to 1.5 bar) was noted in the reactor (R1). TPD and TGA analyses of the catalysts postreaction (3.5 days on stream) were performed to investigate if hydrocarbon products formed were being retained on the catalyst causing this pressure increase during the reaction (Figure A1, Figure A2, Figure A3, Figure A4, Figure A5 and Figure A6). TPD under nitrogen showed hydrocarbons in the C13–C28 range were desorbed from the catalysts after both reactions (0.2 g and 0.4 g), and TGA analysis revealed a weight loss of 18% for the 0.4 g catalyst reaction while only 8% was lost for the 0.2 g reaction. This is in-line with the higher conversion and longer bed length (8 cm vs. 16 cm) for the 0.4 g catalyst reaction.
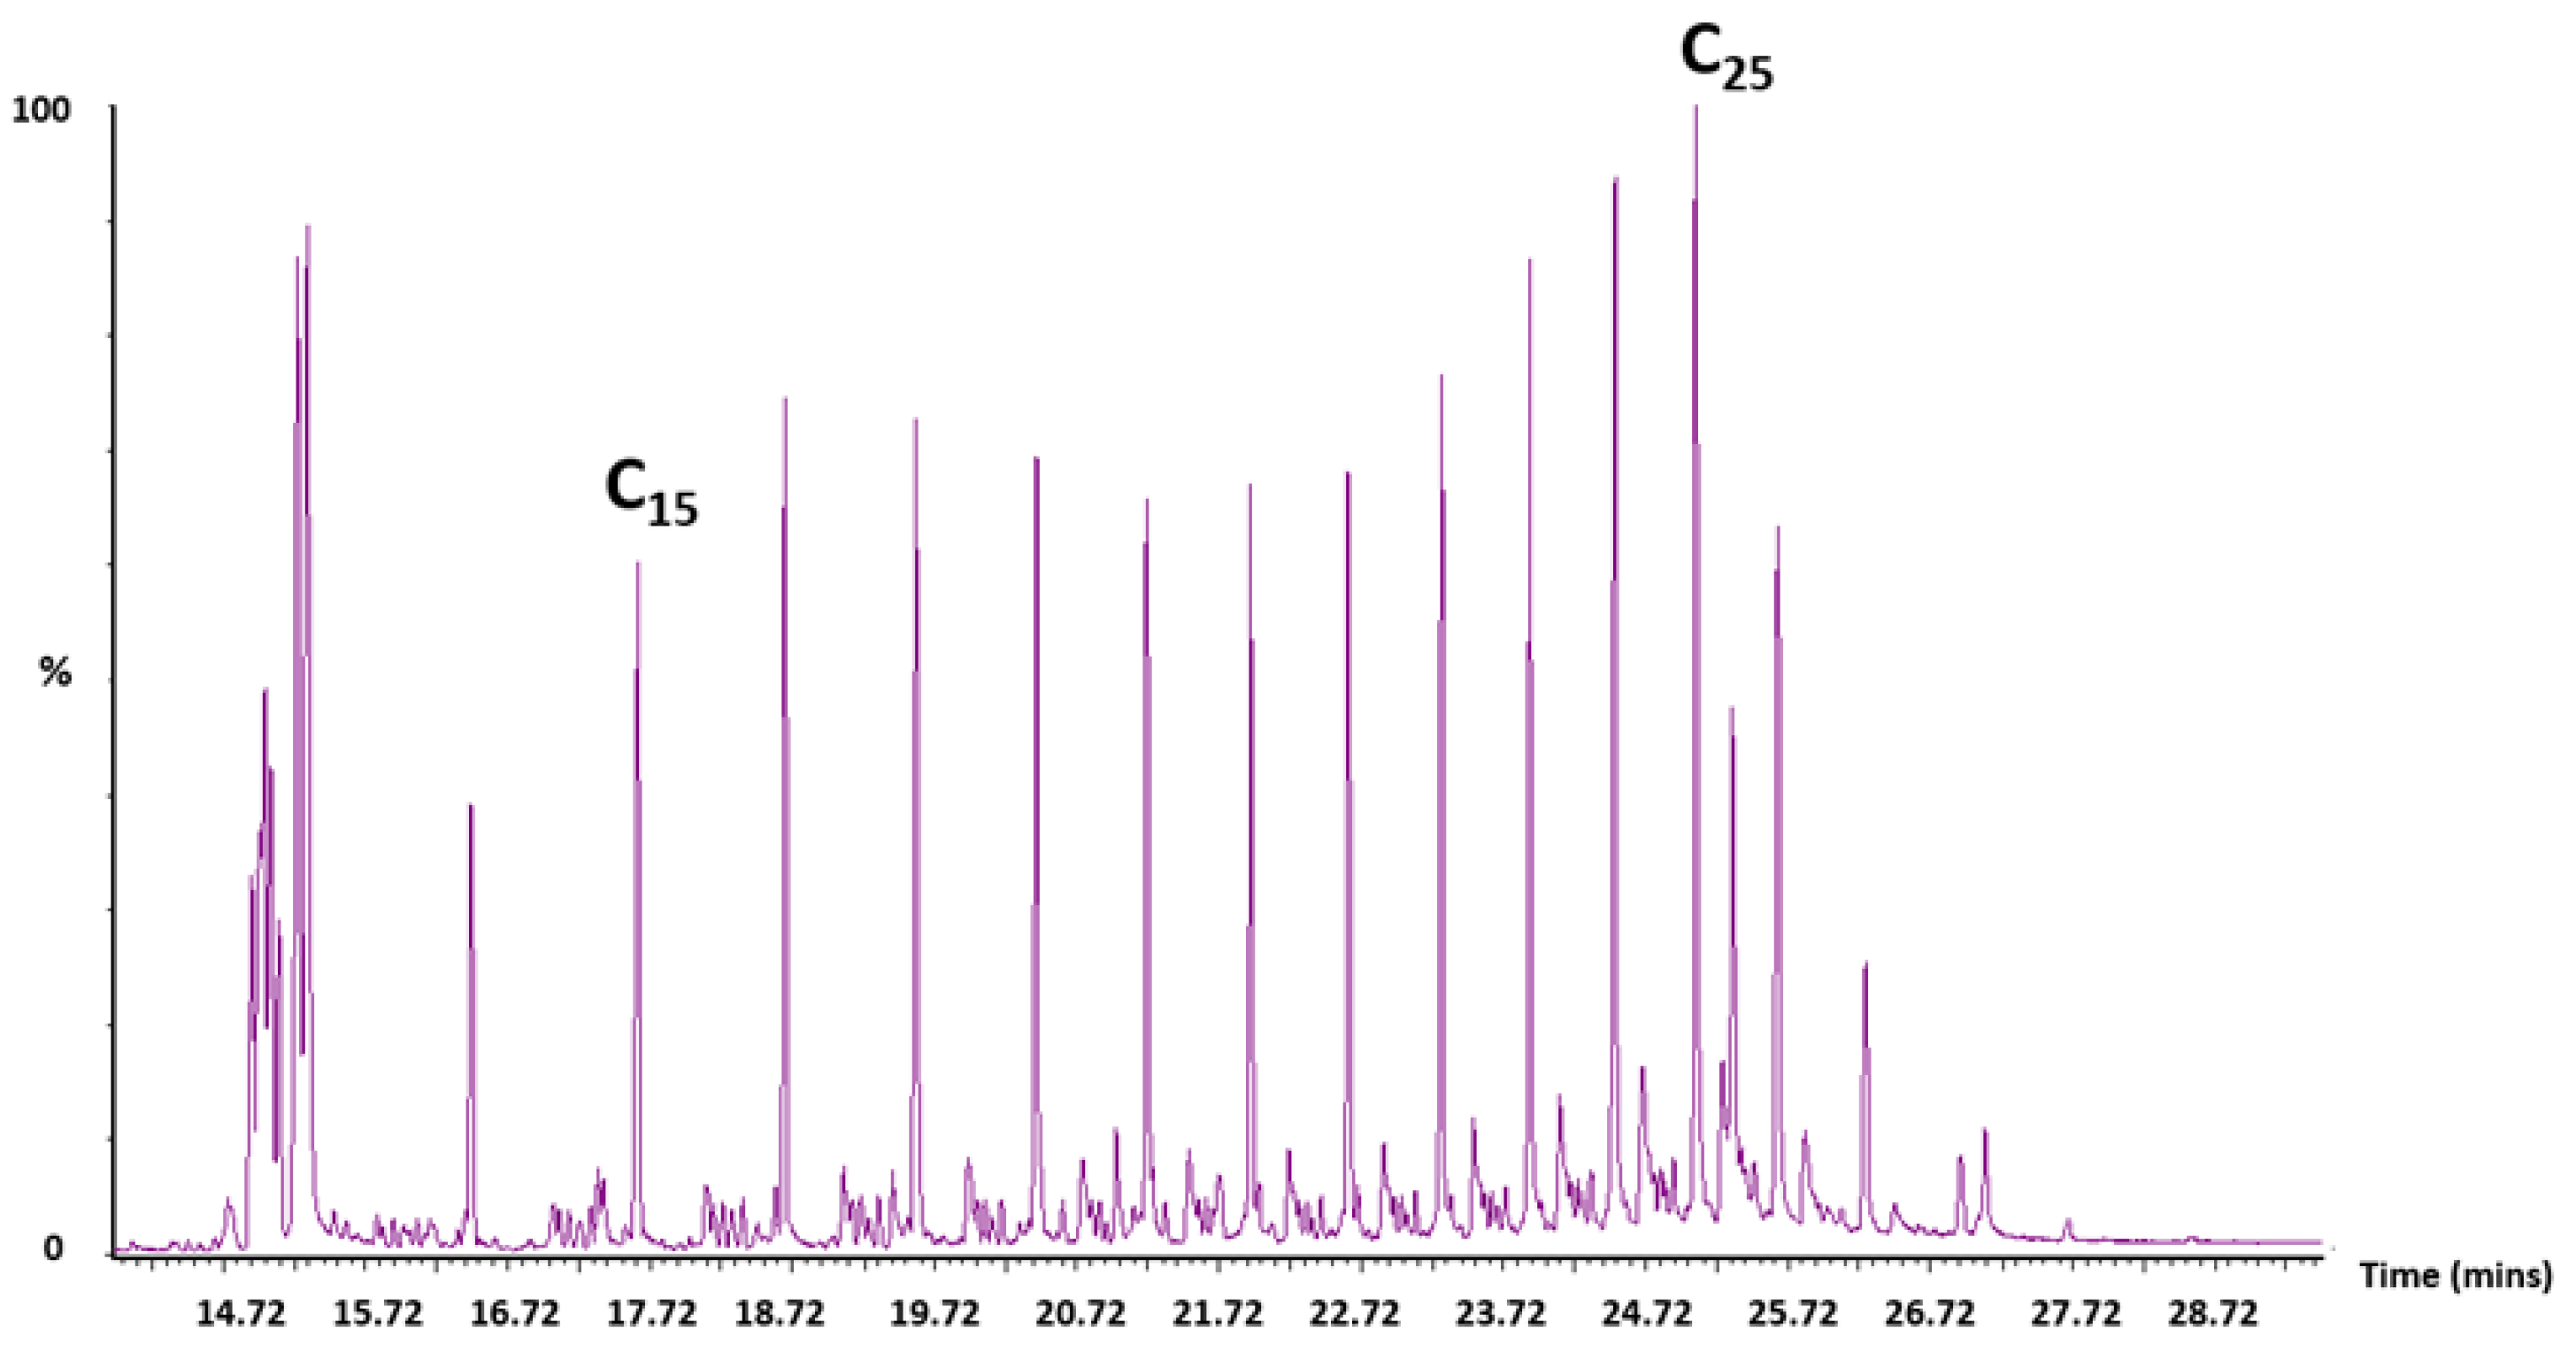
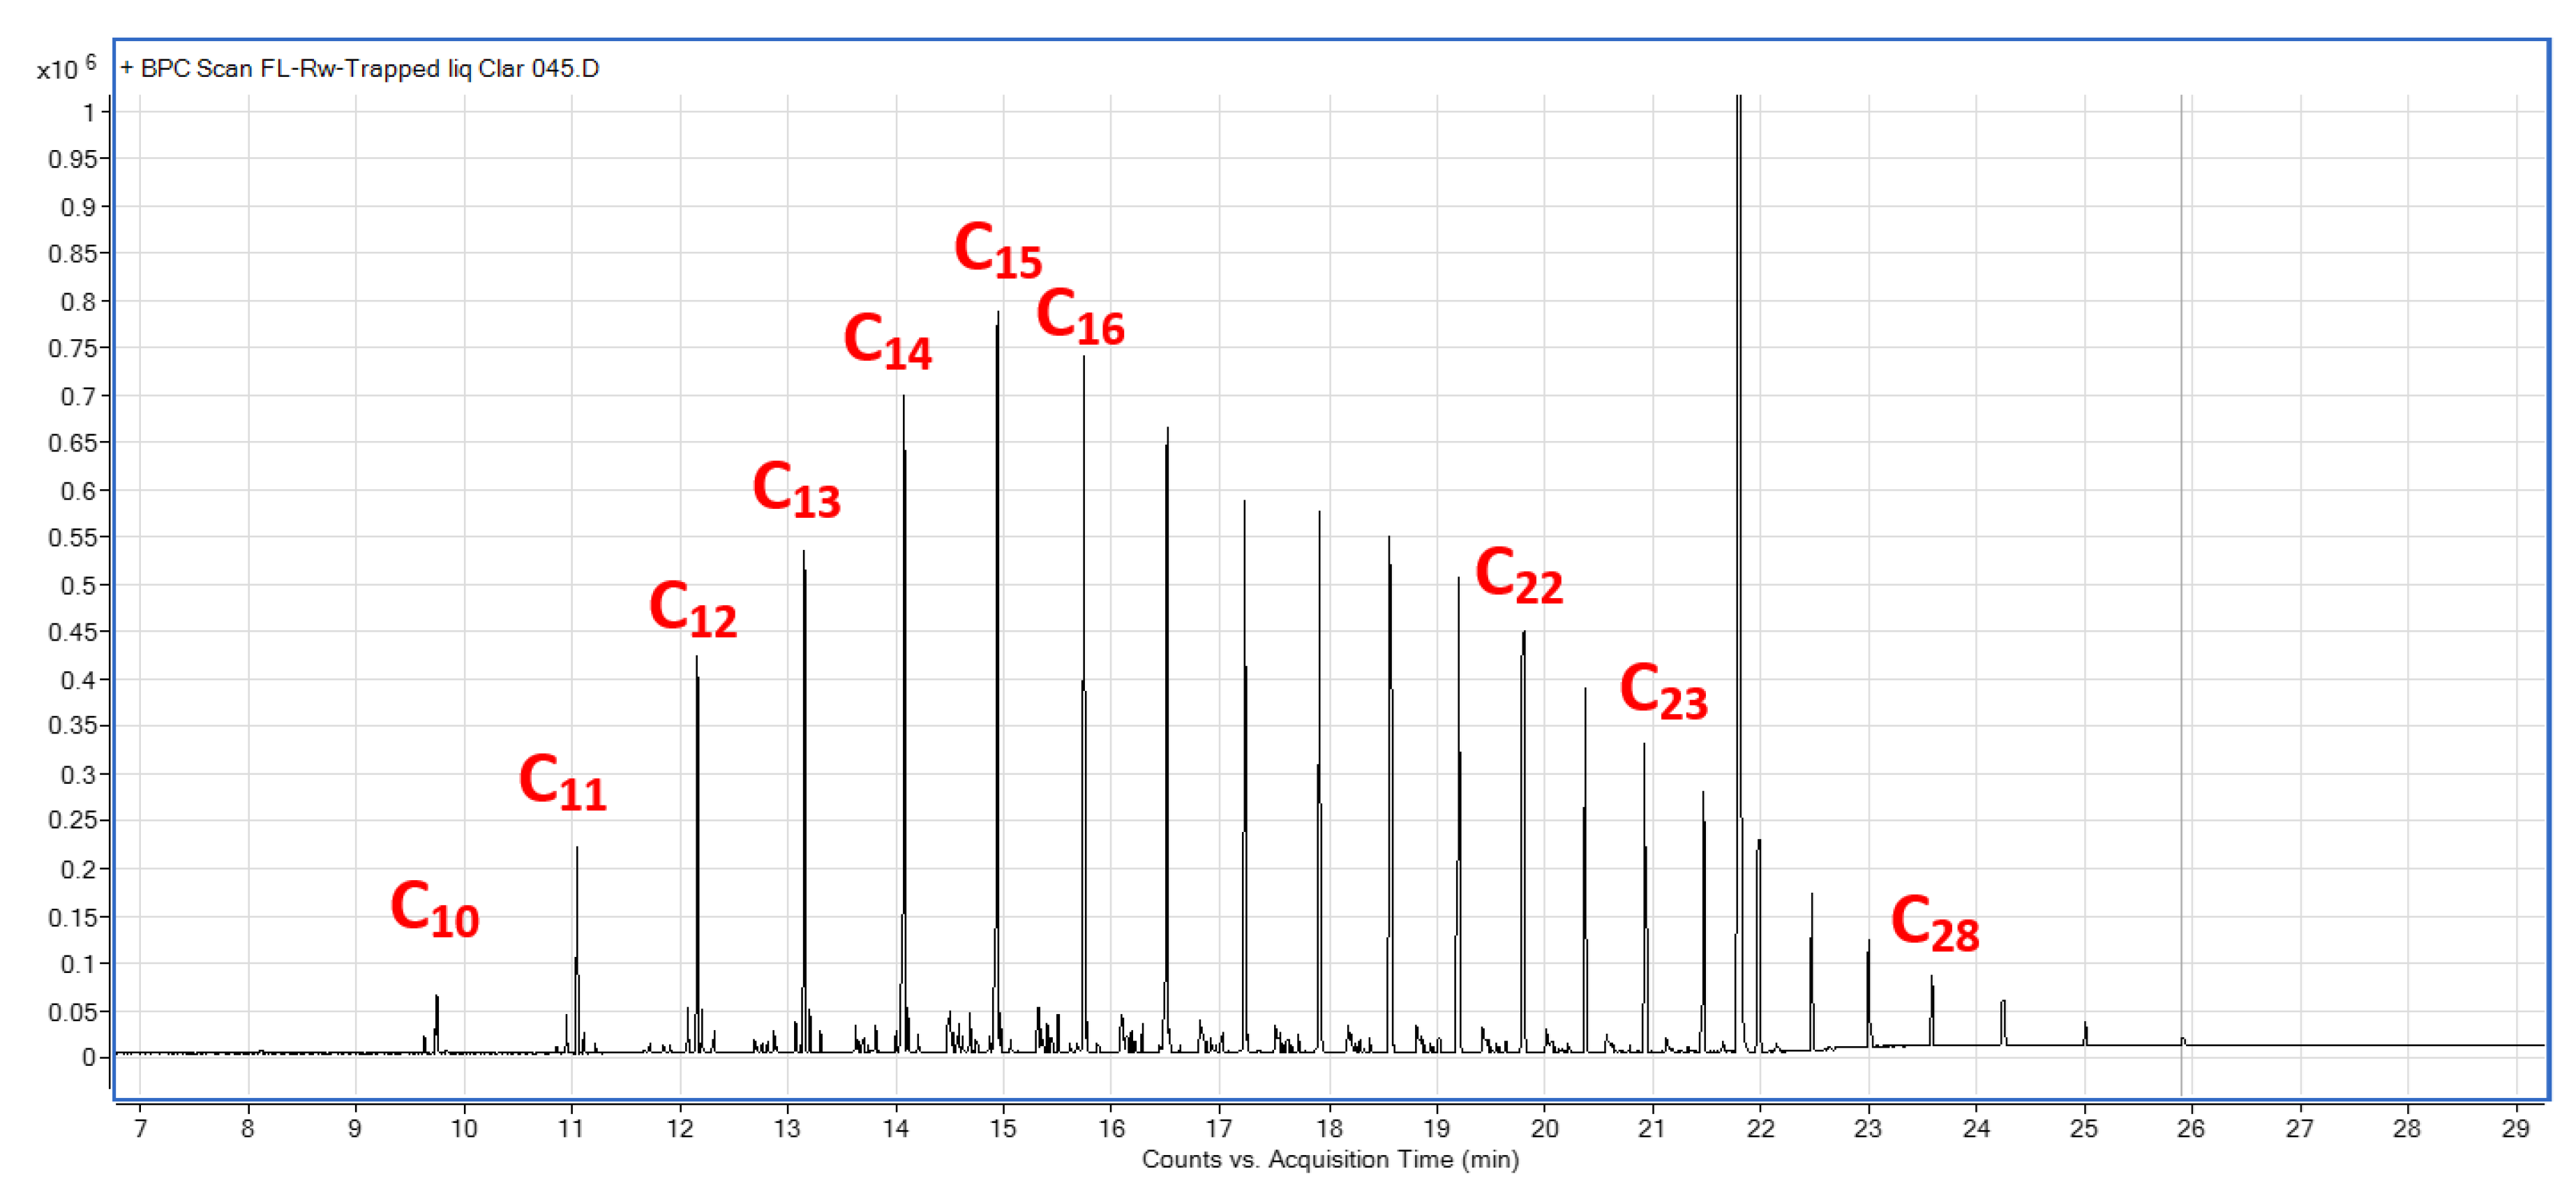
To increase the CO conversion while not increasing the catalyst mass and bed length further, a wider reactor (1.2 cm ID) with 0.4 g of catalyst was used (R3). Increasing the mass of catalyst resulted in a small increase in conversion, with an average CO conversion of 10% after three days on stream (Figure 2). For the reaction in the smaller diameter catalyst, the higher pressure drops resulted in an increase in fluid velocity, reduced residence time and, thus, lower conversion. The pressure during R3 (3.5 days on stream) only reached 0.05 MPa (0.5 bar) and analysis of the catalyst after this reaction again found hydrocarbons in the C15–C26 range (Figure A6). For this reaction the selectivity to methane was, again, still higher than desired to liquid fuel products. However, some liquids and waxy compounds were collected in the trap during the 3.5 days of reaction. Analysis of these products at the end of the reaction showed that hydrocarbons in the C14–C17 and C12–C32 range (peaking at C20) had been collected during the reaction (Figure A8). These products are within the desired range of products and confirm that, at atmospheric pressure, hydrocarbon polymerization was taking place.
3.2. Optimising the Final FTS Refined System Setup (R4)
3.2.1. Conversion and Selectivity Results
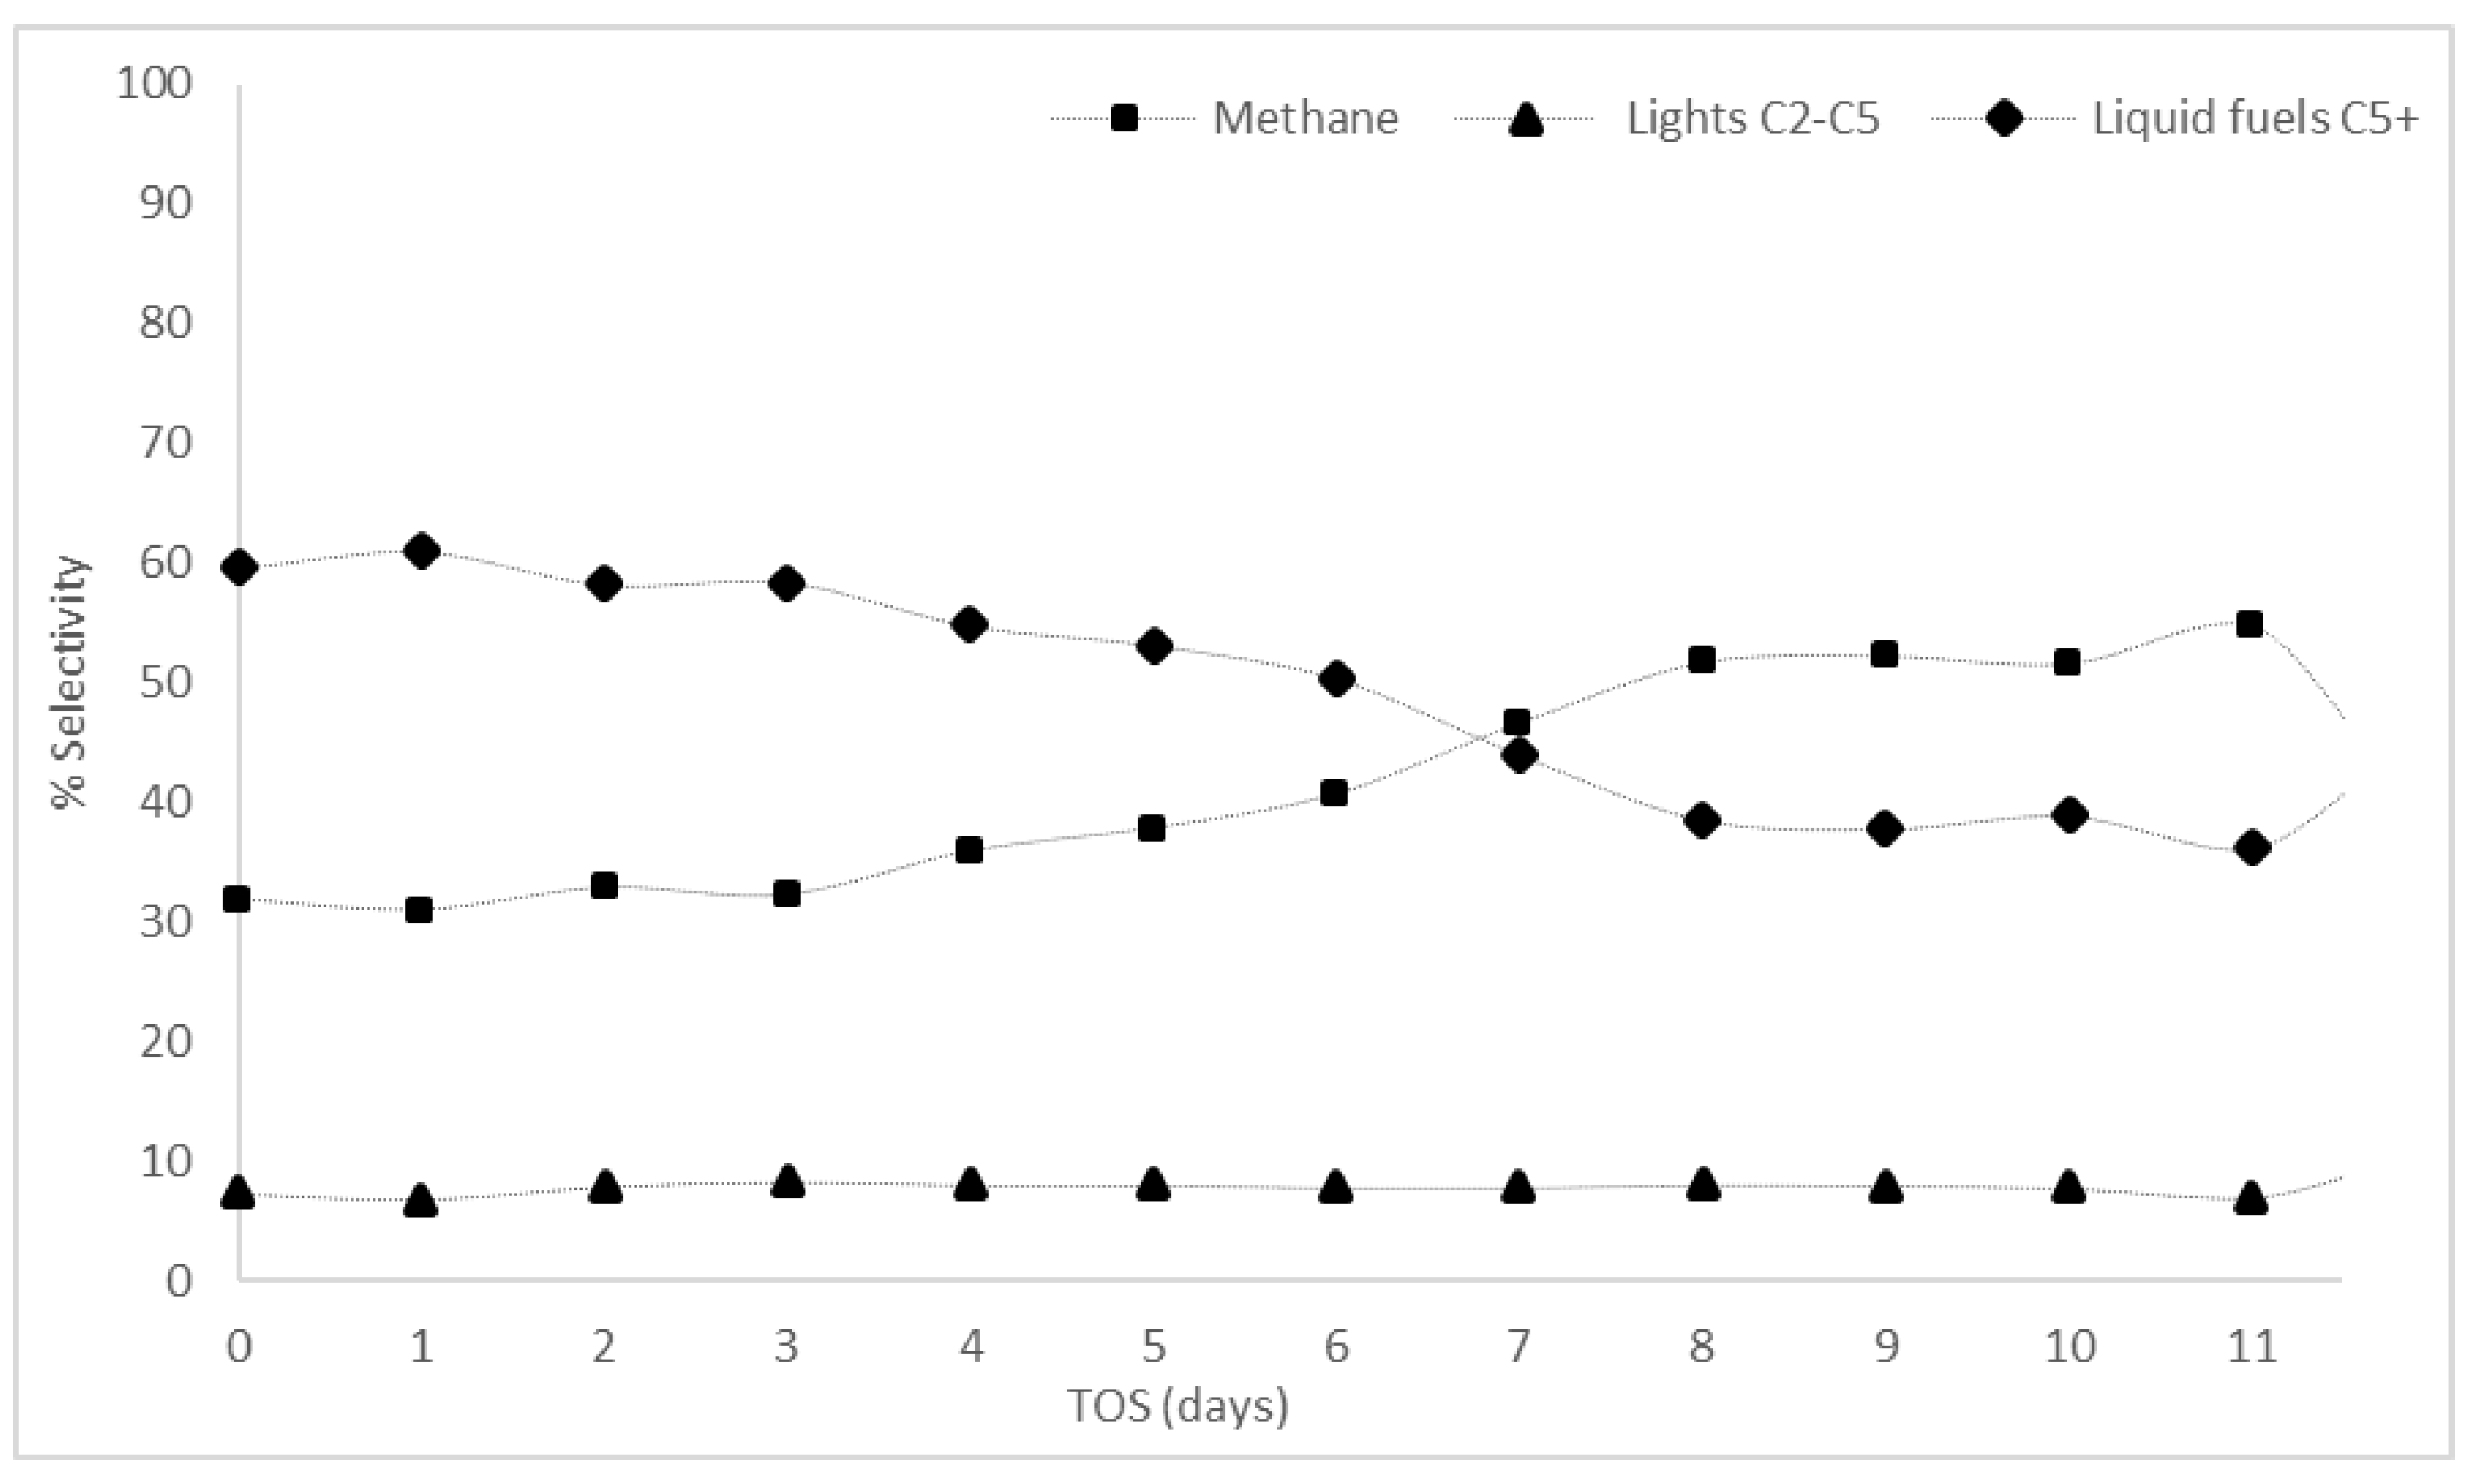
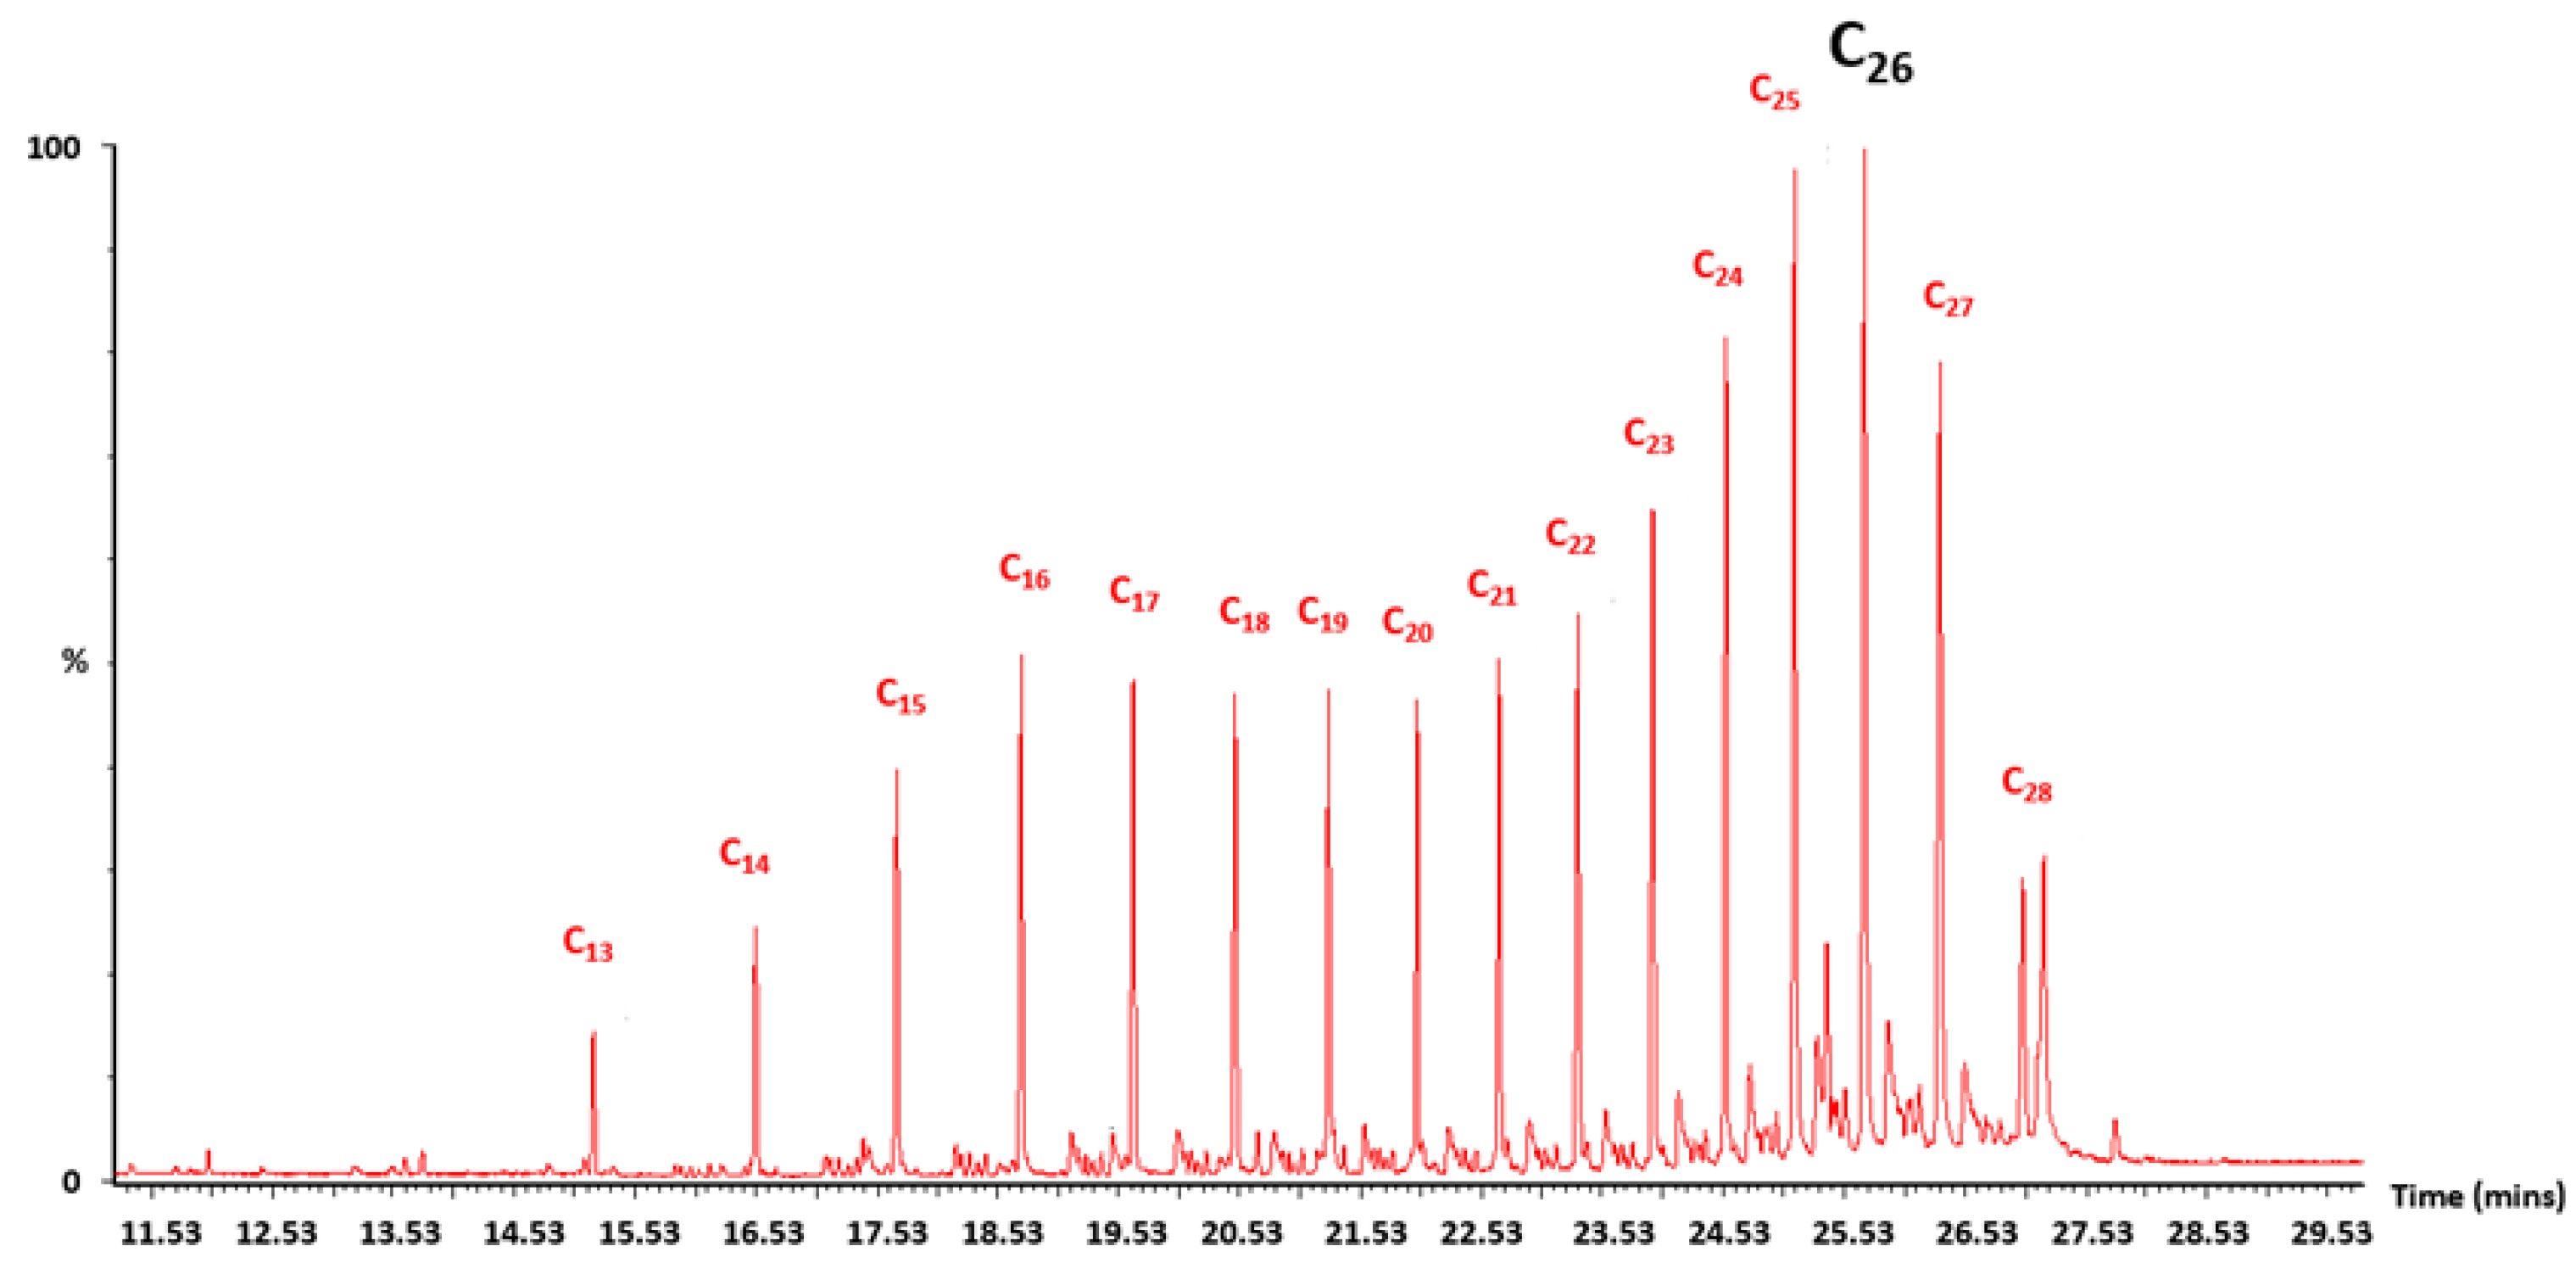
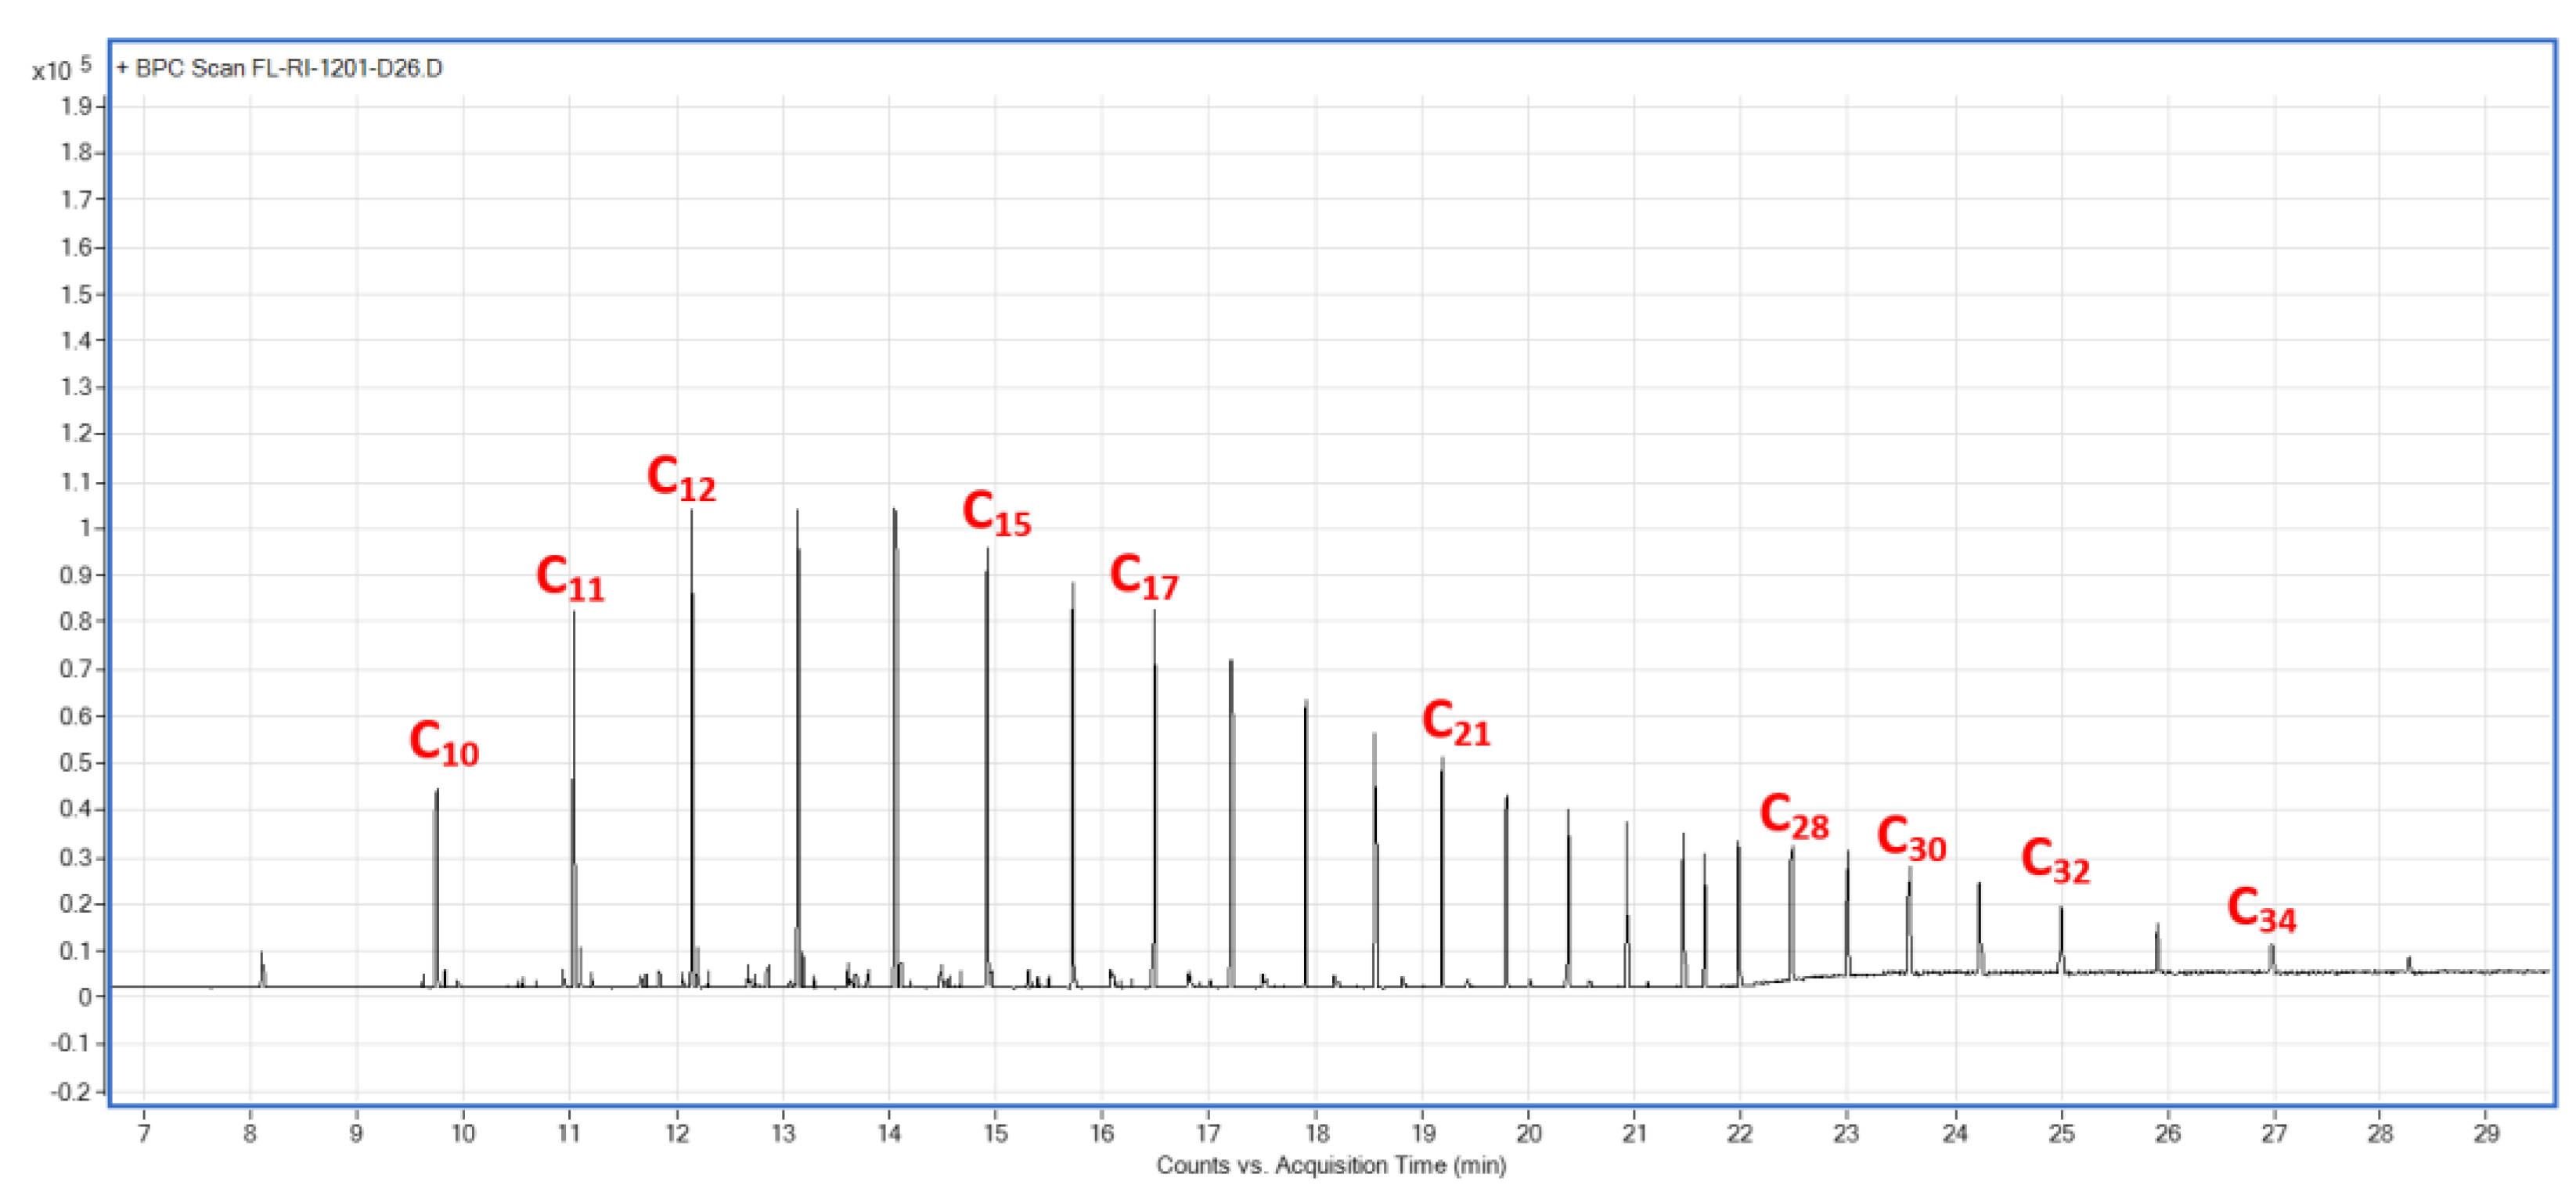
While increasing the reactor diameter reduced the pressure build-up noted during the reactions with the catalyst in crushed powder form, further increasing the catalyst mass under these conditions would not be advantageous. Therefore, a reaction with 1 g of catalyst used in pellet form in the 50 cm × 1.2 cm ID reactor was performed and run for 11.5 days under the FT feed at 488 K (215 °C) (Table 3). The increase in catalyst mass resulted in an increase in the average CO conversion from 10% (0.4 g) to 18% (1 g of catalyst) (Figure 5). Initially, with 1 g of catalyst, the CO conversion reached 25% but an initial deactivation of the catalyst was observed over the first two days of reaction and a steady conversion of 18% was achieved from days 3 to 7. While this reaction provided the highest CO conversion, most importantly, the selectivity to C5+ products was greater than methane. The C5+ selectivity was 54% on average (with a high of 60%) compared to an average of 36% (with a high of 45%) for methane (Figure 6) during this period of the reaction (days 1–7). The collected liquid and wax products (sampled at days 3, 6, and 11) contained hydrocarbons in the range C12–C15 in all samples with the wax products in the range C10–C34, peaking at C14–C16 (Figure A9, Figure A10 and Figure A11). It was not possible to quantify the amount of liquid fuel/wax products formed during the reaction. The higher selectivity to liquid fuel products during the first seven days on stream shows the feasibility of running the FT reaction at lower pressures than those currently used industrially. As the reaction proceeded past day 7, the CO conversion decreased to an average of 15% between days 8 and 11.5 (Figure 5). For all the reaction conditions investigated, deactivation of the catalyst was observed with time on stream. The decrease in conversion came with a decrease in liquid fuel selectivity and an increase in methane selectivity (Figure 6).
It is usually expected that increasing the amount of catalyst while maintaining a constant flow rate will keep increasing the conversion; however, results showed that the rate-determining step in conversion could be limited by the mass transfer of desorbed products. The decrease in conversion, and switch in selectivity from liquid fuels to methane, between days 7 and 11.5, is an expected trend as reported for both iron and cobalt based catalysts [23]. This could be due to the active sites being blocked by the formation and retention of liquid fuels, causing the catalyst’s activity to decrease. Another explanation could be the effect of indigenous water formation during the reaction from days 1 to 7 that inhibits methane selectivity and promotes liquid fuel selectivity. However, after a lengthy time on stream (7+ days), the effect was reversed, which, as discussed by Storsæter et al. [56], could be due to the catalyst being saturated with water up until day 7, after which activity started decreasing and methane became the easiest thermodynamically stable monomer to form. The exact mechanism of the effect of water is still controversial [23] with oxidation of the metal also reported as a cause of deactivation. The water can cause a water-gas shift reaction, thus oxidizing CO to CO2 and H2 and inhibiting the FT reaction. Also, if the metal on the active site of the catalyst becomes oxidized, it might hinder the polymerization reaction [57]. The FT reaction is highly exothermic and can create hot spots in the catalyst when an isothermal state is not attained [58]. A nonisothermal state was possible in R4, as the catalyst (initial pellet form) and the SiC (250–300 µm) were of different particle sizes, causing uneven mixing and potentially leading to overheating in localized spots on the catalyst, thus resulting in gradual deactivation and production of undesired products (high methane selectivity). Along with thermal hot zones, another possible irreversible deactivation scenario is carbon deposition; both can cause the catalyst to lose integrity and become more susceptible to deactivation. However, the exact form of deactivation could not be verified due to the nondisclosure agreement that prohibits catalyst characterization. Catalyst characterization allows for the identification of the active metal phase and the support used to prepare the catalyst. A series of experiments could then be carried out under different parameters to test the exact cause of deactivation. Catalysis is beyond the scope of this paper, which deals with system analysis on a macroscopic level.
3.2.2. Possibility of a Dual α Mechanism
FT product distribution is governed by a factor known as the chain growth probability (α), which varies between 0 and 1. Ideal (Anderson-Schulz-Flory (ASF)) behavior predicts that as α approaches 1, the fuel produced becomes heavier (>C15+). At such high α values, methane formation is expected to be at low values constituting <0.2wt% (refer to van der Laan et al [59] for further details). The competing selectivity of CH4 and C5+ in R4 suggested a deviation from ASF. Previous research [60,61,62,63] proposes that this may be due to the presence of two chain growth probability α values that characterize the catalyst in use. The existence of two sites on the catalyst surface suggests that each site might independently yield the ideal ASF [59]. Based on the results of R4 and comparing the product distribution data to literature, the molar fraction distribution of products in R4 was matched to two chain growth probabilities (Equation (7)), indicating that the commercial catalyst has two different types of active sites: site A promoting methane production and site B promoting liquid fuel production.
where is the molar fraction of carbon number n; is the probability of propagation via site A (responsible for methanation); is the probability of propagation via site B (responsible for the production of higher hydrocarbons); and and are the chain growth probabilities at sites A and B, respectively.
The values for n = 1 – 10 were calculated based on results for the reaction with 1 g of catalyst plotted against the carbon number (n) (Figure 7). Equation (3) was then solved for n = 1 – 10 by altering the three variables, , , and , using MS Excel to find the best fit of the plotted experimental curve. The closest fit to the theoretical (Figure 7) corresponded to two very different α values , as expected.
The developed model (Equation (8)) predicts the product distribution for the commercial catalyst under the test conditions of 0.1 MPa and 488 K (1 bar and 215 °C). The catalyst activity and C5+ selectivity in the reaction showed an overall decreasing trend over the 11 days of on-stream analysis. This could be explained by the high chain growth probability () which suggests that the catalyst is designed to produce hydrocarbons with a higher molecular weight (C20+). The heavy products at such a high α value blocked the pores of the catalyst leading to its gradual decay. The aim of these reactions was to assess the feasibility of obtaining high C5+ selectivity at 0.1 MPa (1 bar) and this has been verified for seven days on stream where C5+ selectivity was higher than methane. Prolonging the activity of the catalyst, and maintaining its high selectivity (>40%) to the desired products beyond the initial seven days, became the focus of the next phase of the research.
3.3. Testing the FTS System’s Robustmess by the Introduction of Interruption Factors
3.3.1. Fluctuation in Feed Gas Flow and Reaction Temperature (Zones A, B, and C)
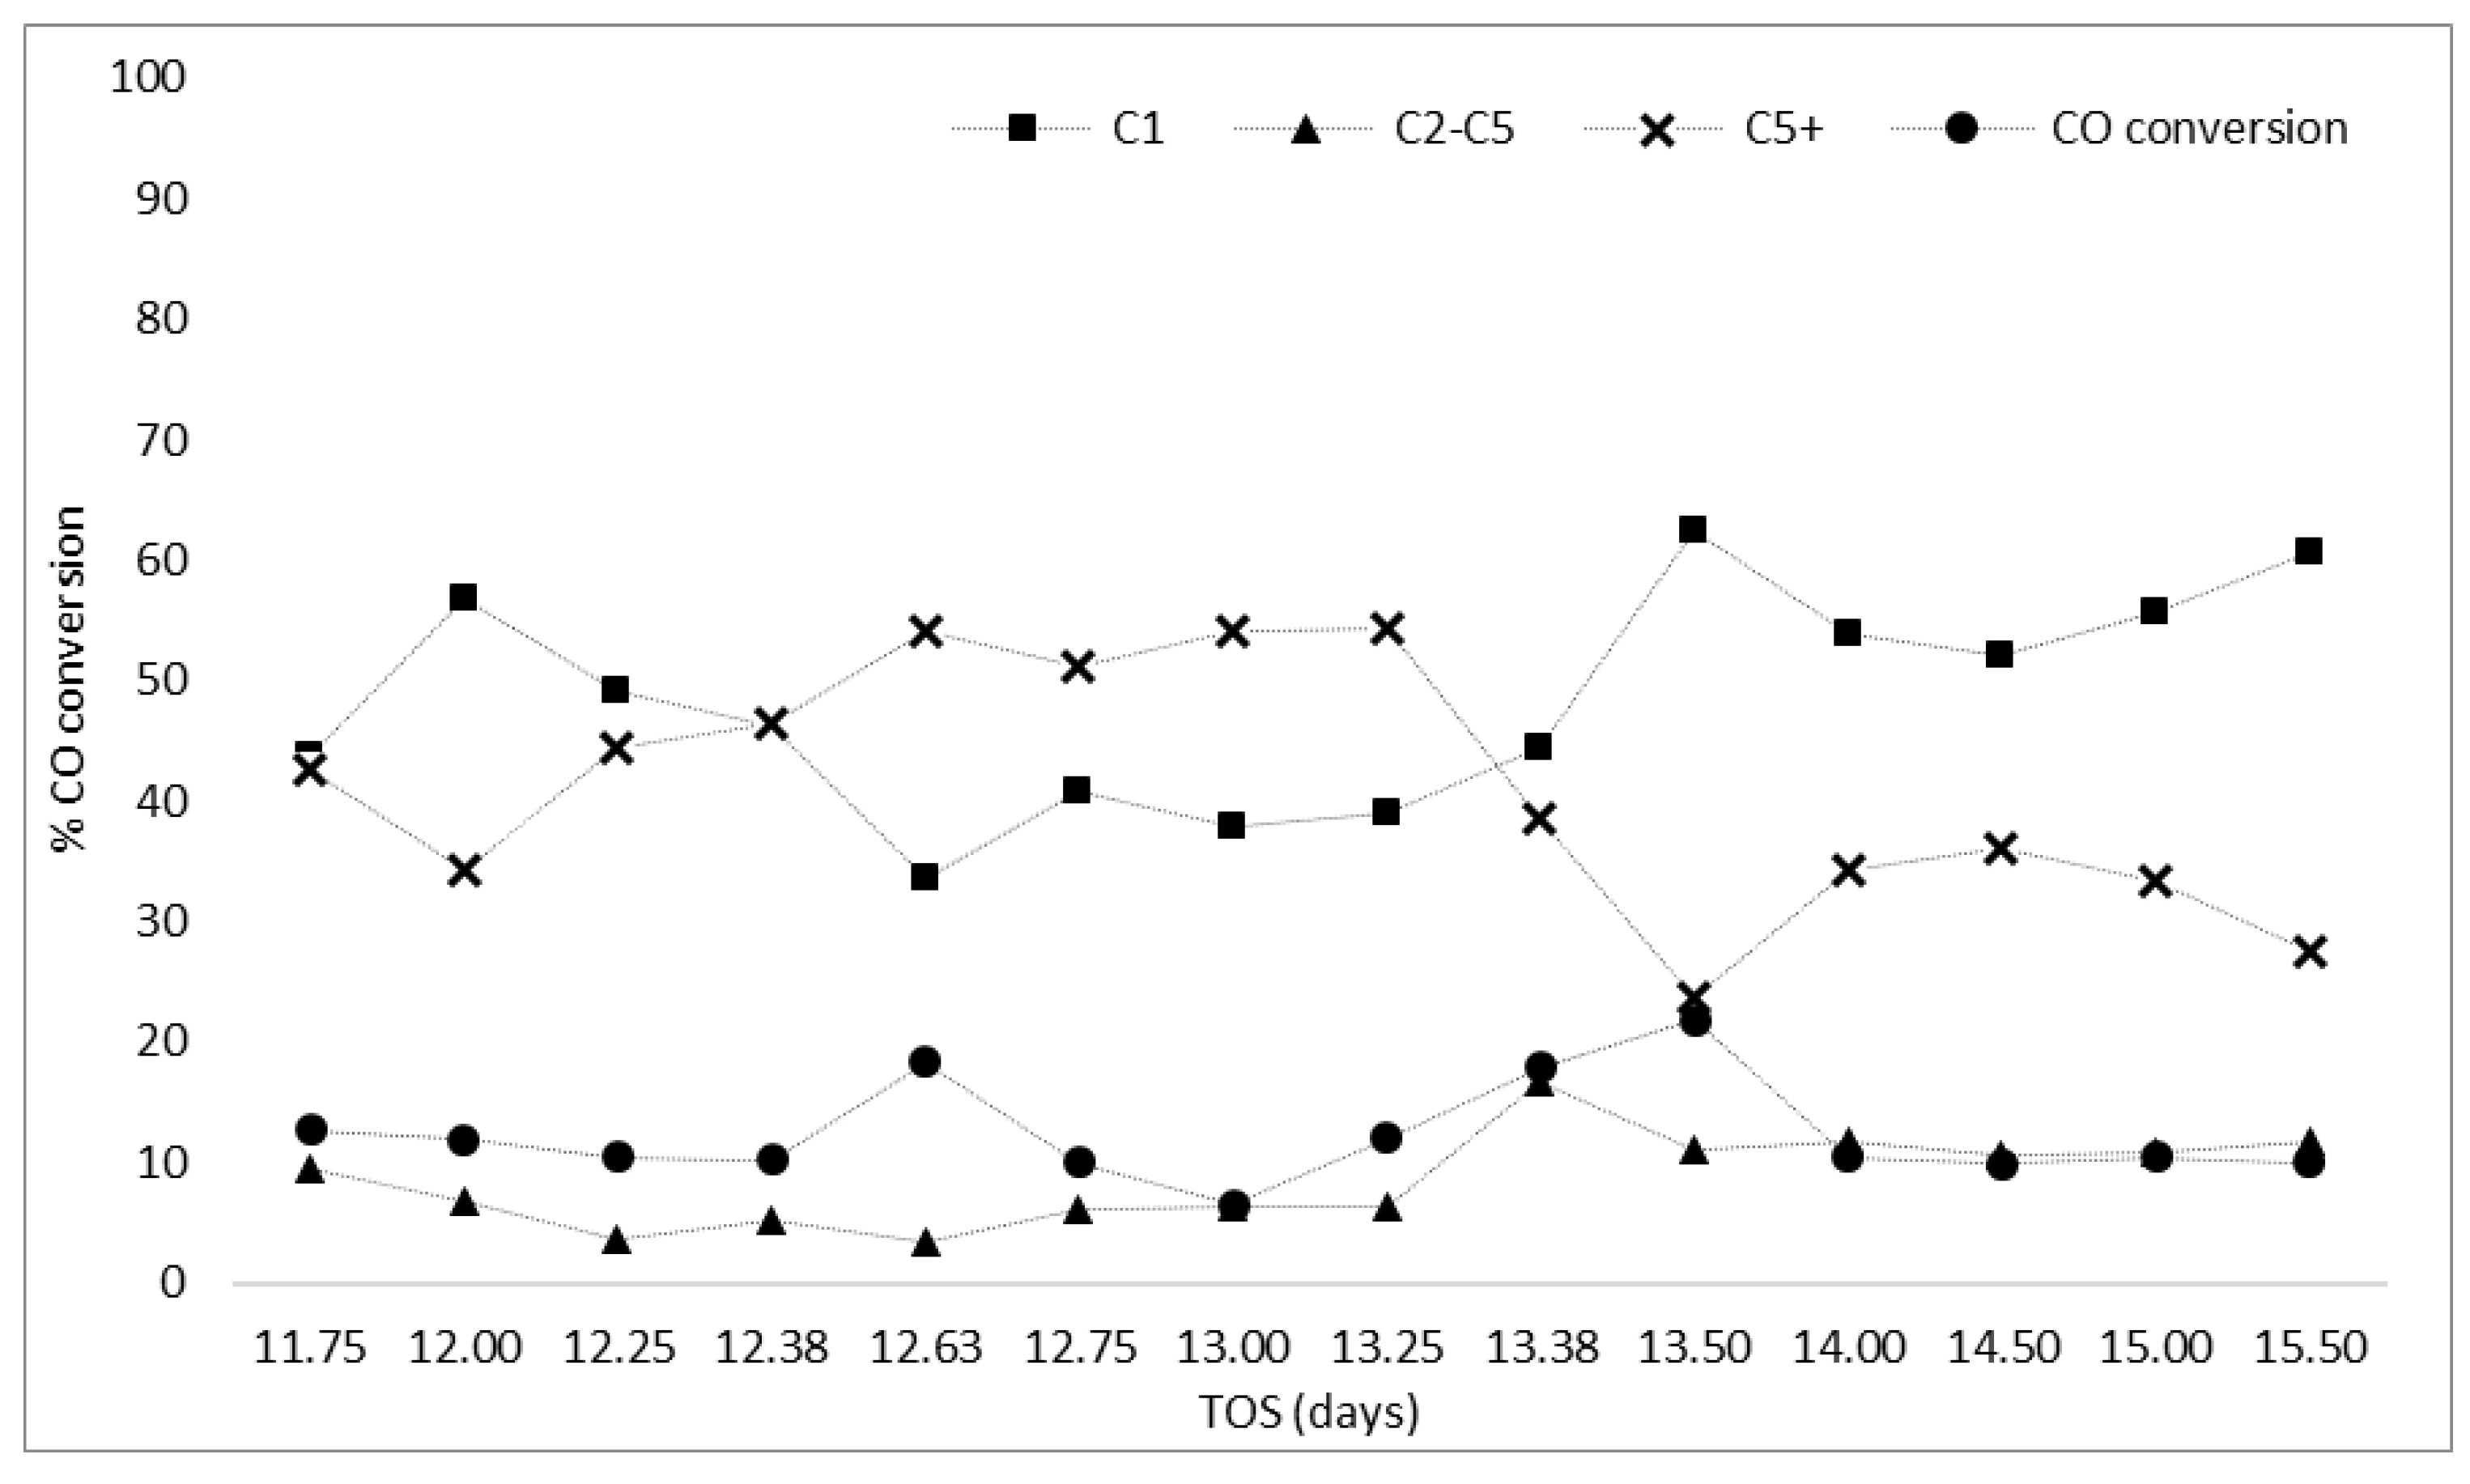
The overall robustness of the FT reaction at atmospheric pressure for small-to-medium scale applications needs to be assessed to determine if the reaction can withstand loss of feed gas flows or heating to the reactor without loss of activity and selectivity to liquid products. If the catalyst/system can maintain activity following shutdown/startup as well as following fluctuations in the feed gas flow and composition, it improves the viability of the reaction for the small-scale generation of liquid fuels. After 11.5 days on stream, the CO conversion was 12% and the selectivities to methane and to C5+ products were stable at 54% and 34%, respectively. At this point, different interruption factors such as loss of feed gas and loss of heating were used to assess if the activity/selectivity could be regenerated (Table 3).
Zone A (Figure 8) shows the CO conversion and selectivity to methane and C5+ products for the period of reaction immediately following a switch from the feed gas to He while lowering the reactor temperature to 373 K (100 °C), before reintroduction of the FT feed and ramping the temperature back to 488 K (215 °C). During the first day of reaction after the interruption, the CO conversion decreased to a minimum of 10% (compared to 12% before the interruption), but then increased to the initial value of ~20% (Figure 8) when the reaction was stopped. Interestingly, as the system stabilized after the interruption, the selectivity to C5+ products increased from 34% to 54% with a drop in the selectivity to methane. This could be due to the switch from CO + H2 to He as the reactor temperature was reduced to 373 K (100 °C), and the elution of some C5+ hydrocarbon products from the catalyst which had formed over the previous 11.5 days of reaction. These hydrocarbons could be eluted under the flow of He, with the effect of cleaning the catalyst surface, and, as the reaction was initiated again (feed reintroduced at 373 K (100 °C) and bought back to 488 K (215 °C)), the catalyst was returned to a more active state (more active sites available for hydrocarbon formation) allowing it to reproduce liquid fuels at higher selectivity (60%).
In a more exaggerated interruption to the reactor, after 12.5 days of reaction, the system underwent complete shutdown with all gas flows to the reactor stopped and the temperature reduced to 303 K (30 °C) before reintroduction of the feed at 303 K (30 °C) and temperature increase to 488 K (215 °C) (Zone B). The selectivity to liquid fuels (C5+) remained higher than methane following shutdown, with values comparable to those after the first interruption event of 53% and 38%, respectively. The active sites regenerated after the first interruption event were not affected by the shutdown of the catalyst. This is interesting as complete loss of gas flow did not result in loss of activity of the catalyst but rather the activity and selectivity reached comparable values after stabilizing upon returning to the normal reaction temperature. However, this regeneration was not sustained, as rapid deactivation began after ~13 days on stream which could have been due to accumulation of higher molecular weight hydrocarbons on the catalyst that were removed in the earlier flush with He. While the catalyst activity could not be regenerated for a sustained period of time, the initial ability to reverse the selectivity in favor of liquid fuel products (by removal of some adsorbed hydrocarbons) and the robustness of the system following complete shutdown are promising for the proposed application. As deactivation was still an issue, after 13.4 days of reaction the system was stopped (set to 303 K (30 °C) under He) and the catalyst was re-reduced (673 K (400 °C) in H2 for 16 h).
Reactivation by hydrogenation is one of the most discussed regeneration techniques [64] and hydrogenation has been reported to allow heavy products, such as wax, to elute from the pores of the catalyst, thus aiding in reactivating sites and regenerating the catalyst to a level close to the original activity [65]. During the reduction step, hydrocarbon products were detected which could be (a) eluting from the catalyst at the reduction temperature of 673 K (400 °C), indicating that the compounds had high hydrocarbon chain length (waxy products C20+ of boiling point >623 K (>350 °C)) and (b) that H2 facilitated wax/hydrocarbon hydrogenation, both of which could regenerate the active sites.
After re-reduction, the activity of the catalyst was found to have returned to that observed for the fresh catalyst (day 1) reaching 23% CO conversion for ~12 h, before decreasing to a stable value of 10% (Zone C, Figure 8), lower than observed previously for days 3–7. With this increase in activity came an increase in the selectivity to methane (from 45% to 65%), while selectivity to liquid fuels and light hydrocarbons decreased from 35% to 25% and from 17% to 13%, respectively (Zone C, Figure 8).
Re-reduction helped the catalyst to regain its activity for only the first hours and the boost in activity was accompanied with a higher selectivity to methane over liquid fuels (C5+). The higher temperature treatment under H2 could have been more effective in removing hydrocarbons from the catalyst, having a negative effect on the selectivity as opposed to the interruption and shutdown events, where hydrocarbons were likely still retained on the catalyst. These hydrocarbons could be acting as a promoter for liquid fuel production, e.g., if C14 was coating the catalyst when the FT reaction started, the C14 would act as a template for polymerization leading to C15, C16, and C17+ (long chain polymerization). Long chain polymerization was prevented after re-reducing the catalyst as the H2 caused hydrogenation/elution of products trapped on the catalyst. As a result, polymerization could begin with CH2, which is the most abundant monomer intermediate of CHx monomers generated on the surface of a catalyst and is readily incorporated in the chain during polymerization [65]. This would result in a higher selectivity to methane over higher hydrocarbons as observed herein.
The remaining active sites on the catalyst were expected to lose activity as the time on stream reached 16 days, hence hindering the possibility of further polymerization for liquid fuel production in line with the further drop in selectivity to C5+ products at day 15.5. Another factor that stimulates polymerization is hydrocarbons readsorbing on the surface of the catalyst. Zones A and C had similar conversions (~14%) and methane selectivity (~60%), but the lights selectivity (C2-C4) increased from A to C (from 8% to 13%), implying that shorter hydrocarbons (C2-C3-C4) were formed and released instead of readsorbing on the surface of the catalyst, as is usually expected [65]. Regenerating the catalyst with H2 hydrogenation resulted in a higher selectivity to methane which was undesirable.
3.3.2. Effect of Feed Ratio on Catalyst Activity (Zone D)
At day 16, the conversion continued at 10% for 9 h, then decreased to ~8%. The H2/CO ratio was then switched to 3:1 for another 15 h after which it was changed to 1:1. Increasing the H2 content to a H2/CO ratio of 3:1 increased conversion to 17% and was accompanied by an increase in methane selectivity from 45% to 53% (Figure 9); decreasing the H2/CO ratio to 1:1 decreased conversion to 7% and methane selectivity to an average of 32%. Various studies have investigated the influence of process variables, specifically H2/CO ratio, on the activity and selectivity of syngas conversion [66,67]. The reactant stoichiometry is important for the selectivity of the FT reaction. Increased H2 in the feed gas, as in the 3:1 feed ratio, decreases the probability of chain growth (less probability of producing liquid fuels) [68,69] because H2 diffuses faster than CO [70] leading to excess H2 moving towards the center of the catalyst and inhibiting the formation of long chains of hydrocarbons. As a result, the selectivity to methane increases.
Decreasing the H2/CO ratio to 1:1 resulted in similar conversions to the 2:1 ratio of ~8%. However, the 1:1 ratio showed lower methane selectivity of 35% as compared to 45% in the 2:1 ratio. The observed decrease in methane selectivity at 1:1 could mean that liquid fuel production was enhanced at this ratio, similar to the results reported by Lualdi et al. [71]. However, according to stoichiometry, the ideal H2/CO ratio is 2:1. This ratio helps to produce water that inhibits methane production over time, while still providing enough H2 for polymerization [72]. As previously mentioned, H2 migrates faster than CO [70], but CO adsorption is stronger than that of H2 on the catalyst which, at a 2:1 ratio, facilitates polymerization for liquid fuel production through carbon-to-carbon coupling instead of releasing short carbon chains. This, in turn, limits methane formation [72].
3.4. Overall Findings for the Technical Feasibility of Liquid Fuel Production from Biogas at Atmospheric Pressure
The iterative refinement steps in R1, R2, and R3 allowed R4 to be sustained and successful in producing liquid fuels at 0.1 MPa (1 bar) (Table 8). External factors were introduced in R4 to test the system’s robustness and to investigate if the high selectivity to liquid fuels could be recovered; positive results in terms of activity showed that the system became resilient to interruption factors and was able to proceed for 16 continuous days without complete loss of activity. However, the catalyst’s ability to maintain high selectivity to liquid fuels decreased with time on stream. Analysis showed that the catalyst was likely characterized by two active sites (dual α), promoting methane and liquid fuel production, respectively, making it difficult to suppress methane production as the catalyst began to deactivate. Our results highlight the importance of having a catalyst cleaning and regeneration section within the system to allow constant cleaning and to maintain high catalytic activity and selectivity to liquid fuel production.
Although further research is required to develop the system, address issues surrounding low CO conversion (which is typical for low pressure FT [73]), and move from laboratory to pilot to full-scale, the laboratory experiments proved that it is feasible to produce liquid fuels from biogas through FT at 0.1 MPa (1 bar). However, it should be remembered that this is not the only route for biogas-to-liquid fuels, with other options including bio-LNG (liquefied natural gas) and plasma reforming. Building on previous work by the authors of this paper [74], it is recommended that a comparative study be undertaken to investigate the technical, economic and environmental aspects of the novel and existing biogas-to-liquid routes in comparison to other biogas utilization routes. The wider options for integrated Fischer-Tropsch systems in the context of energy demands and cost competitiveness are also of interest [75] and warrant investigation. Knowledge of the total environmental impact of transport options is key for informing policy- and decision-making [76].
3.5. Economic Feasibility of the Fischer-Tropsch Conversion of Biogas-Derived Syngas to Liquid Fuels
The small plant size (producing 98 m³/h of biogas) resulted in a loss (Table 9) of ~St£1,200,000/year when biogas is sent via FT to produce liquid fuels for transport and/or heat (T1/H1). The total annual expenditure of T1/H1 was approximately double that of other exploitation routes due to high costs associated with the reforming and FT plants at small scale. When the RHI was excluded, mimicking the real-life scenario, none of the routes were viable and all had negative ROCE values; when the RHI was included, only route H2 (conventional upgrading), used for heating, returned positive results with a ROCE value of 1% (Figure 10). With an expected return of 7.25%, the minimum subsidies required to give the routes at small scale a reasonable return are St£1.55/m³ of biogas for liquid fuels via FT for heat or transport (T1/H1) and ~St£0.40/m³ of biogas for upgrading to biomethane for transport (T2–T5) (Table 9). This analysis assumed a plant lifetime of 15 years (from Smyth et al. [41]); however, future research should investigate extending the plant lifetime to 30 years, which is the typical lifetime for industrial biological treatment plants, e.g., wastewater treatment plants [77].
The unviability of the FT route is in line with Rafati et al. [13], who stated that the production of FT biofuels would only be economically viable at very high oil prices or with a substantial subsidy. Unpredictable crude oil prices, varying from for example $12/barrel in 1998 to over $90/barrel in 2008 [78], mean that the liquid fuel market is risky for investors. There is, however, a strong argument for subsidies, which have historically played an important role in energy markets. The UK coal sector, for example, received funding from the government for years in order to keep it afloat [79], thus supporting indigenous jobs and ensuring secure fuel supply. Looking at the wider context, it has also been argued that wars in the Middle East were initiated to secure access to oil reserves in those regions [80], another form of subsidy. Subsidies are not unprecedented and could play an important role in improving the sustainability of the heat and transport sectors.
4. Conclusions
The ultimate goal of this research is to provide a route to the liquid fuels market for anaerobic digestion plants. The aim of this paper was to investigate the FT conversion of biogas-derived syngas to liquid fuel at atmospheric pressure at laboratory scale. Feasibility at atmospheric pressure is important to ensure ease of operation in typical anaerobic digestion plants, which are based in the agricultural sector. The paper also explored the ability of the system to maintain its operational integrity in response to external interruption factors, which is important for the assessment of possible scale-up. Liquid fuel selectivity of up to 60% was observed under specific FT conditions of 488 K (215 °C), H2/CO = 2, and 0.1 MPa (1 bar) at 25% CO conversion. This result was maintained for almost seven days, longer than any previous work in the literature, beyond which both catalyst activity and liquid fuel selectivity started decreasing, with an accompanying increase in methane selectivity which reached 58% at day 11. The feasibility of producing liquid fuels from biogas-derived syngas at 0.1 MPa (1 bar) and 488 K (215 °C) was verified with an overall sturdy response of activity to external factors; however, the system is not yet ready for scale-up and further research is needed to investigate system operation and control so that continuous production of the desired products (C5+ liquid fuels) can be achieved. A systematic operational procedure that is not dependent on detailed knowledge of the catalyst is required. Under current conditions, the biogas-to-liquid route would require subsidies to ensure financial viability, but such subsidies could be an important driver of change to more sustainable fuels in the heat and transport sectors. Comparison of this biogas utilization route with alternatives in terms of technical, environmental, and economic impacts is advised to build a solid scientific base to support decision-making on biogas utilization.
Author Contributions
Conceptualization, D.R. and G.M.; Methodology, D.R., R.H., and H.D.; Formal Analysis, R.H., D.R., and H.D.; Investigation, R.H.; Resources, D.R.; Writing—Original Draft Preparation, R.H., B.S., G.M., and D.R.; Writing—Review and Editing, R.H., B.S., G.M., H.D., and D.R.; Visualization, R.H., H.D., B.S., and G.M.; Supervision, D.R., B.S., and G.M.; Project Administration, D.R.; Funding Acquisition, D.R. and G.M.
Funding
This research was funded by the European Union’s Seventh Framework Programme for Research, Technological Development, and Demonstration under Grant Agreement No. 316838. This work was completed as part of the ATBEST (Advanced Technologies for Biogas Efficiency, Sustainability and Transport) Marie Curie Initial Training Network. ATBEST is coordinated by the QUESTOR Centre at Queen’s University Belfast (www.atbest.eu).
Conflicts of Interest
The authors declare no conflicts of interest. The funders had no role in the design of the study; in the collection, analyses, or interpretation of data; in the writing of the manuscript, or in the decision to publish the results.
Abbreviations
| AD | anaerobic digestion |
| ASF | Anderson Schulz Flory |
| BID | barrier discharge ionization detector |
| CNG | compressed natural gas |
| FID | flame ionization detector |
| FT | Fischer–Tropsch |
| FTS | Fischer–Tropsch synthesis |
| GC | gas chromatograph(y) |
| GC–MS | gas chromatography–mass spectrometry |
| GHG | greenhouse gas |
| GHSV | gas hourly space velocity |
| ID | internal diameter |
| LNG | liquefied natural gas |
| RHI | Renewable Heat Incentive |
| St | Sterling |
| TD | thermal desorption |
| TGA | thermogravimetric analysis |
| TOS | time on stream |
| TPD | temperature programmed desorption |
| VOC | volatile organic compounds |
| wt | weight |
Appendix A. Additional Information on Testing and Characterization
Appendix A.1. Thermogravimetric Analysis
The thermogravimetric analysis (TGA) technique measures the weight loss of a sample as it is being heated or cooled in a furnace. The sample specimen is exposed to an inert or reactive purge gas which creates a controlled atmosphere as the temperature is monitored over time. The instrument used (Mettler Toledo TGA/DSC 1 STARe System CH-8603- Switzerland) measures weight loss in the form of solvent, water, or any residue that is found on the catalyst. In the case of the Clariant® catalyst, the sample used nitrogen as an inert gas for purging. This allowed the sample to only react to temperature during decomposition, thus undergoing pyrolysis. The TGA gives insight on whether the catalytic pores had been blocked by a certain material to cause inactivity or decrease in activity. It also quantifies the amount that was burned off which in turn varies depending on the size of the catalyst used, the size of the reactor’s internal diameter, and the amount of catalyst used.
A lower onset temperature was observed for R2 indicating the possibility of lower hydrocarbons retained in the catalyst bed. It is worth noting that the increase in material weight removed from the catalyst explained the texture of the catalyst post run, which had the consistency of a wax through visual inspection; liquid products in more significant amounts were formed in this reaction in line with enhanced CO conversion. Upon heating postrun catalyst samples (for the three reaction sets) to 873 K (600 °C) for TGA, materials present on each of the samples started desorbing at different onset temperatures of 559 K (286 °C), 503 K (230.45 °C), and 523 K (>250 °C), corresponding to 8%, 18%, and 5% of the sample weight loss for reactions R1, R2, and R3, respectively (Figure A1, Figure A2 and Figure A3).
Figure A1.
Thermogravimetric analysis (TGA) graph for R1.

Figure A2.
TGA graph for R2.

Figure A3.
TGA graph for R3.

Appendix A.2. Thermal Desorption (TD)
After performing TGA analysis and quantifying the material that was on the catalyst, it became necessary to assess qualitatively the type of material. The technique of the analytical TD instrument (Perkin Elmer turbo matrix hs50 head space sampler ATD 400-USA) is based on using a sorbent onto which volatile organic compounds (VOCs) are collected. The sorbent is heated in the presence of a gas flow which allows the release (desorption) of VOCs. The desorbed compounds are then concentrated into smaller and smaller volumes of gas. This process made GC compatible with low concentration compounds (analytes) which were otherwise impossible to detect with this method. The gas streams were injected in a GC where they were analyzed showing a product distribution of the various compounds found on the catalyst (Figure A4, Figure A5 and Figure A6). It was important to see the nature of products formed on the catalyst as it allowed a full understanding of the relationship between catalyst activity and robustness as the particle size and reactor internal diameter were varied.
Figure A4.
Thermal desorption chromatogram for R1.

Figure A5.
Thermal desorption chromatogram for R2.

Figure A6.
Thermal desorption chromatogram for R3.

Appendix A.3. BID
The GC used (Tracera BID-GC solution, Shimadzu, Japan) involves the BID technology, which is combined with a GC-2010 Plus capillary gas chromatograph. Together, they create a GC system that is sensitive to low concentrations and trace components that can be difficult to identify in any other GC detectors. H2, N2, CO, CH4, and CO2 were separated by Shincarbon- and Porapak-packed columns and analyzed on the BID. Products C2–C10 were separated by an alumina capillary column and quantified on the BID allowing for determination of the C5+ selectivity . A typical GC with a flame ionization detector (FID) cannot differentiate between molecules that elute at similar retention times and a mass spectrometer might result in a similar pattern of ionized fragments. Using a coupled system reduced the possibility of such uncertainty. The relative concentrations of the atomic masses in the generated spectrum were analyzed comparatively via an online spectrum library. This enabled results to be matched with already existing sample characteristics allowing identification of the materials present.
Appendix A.4. GC–MS
The system (Agilent G7038A-USA) utilized a capillary column that promoted separation of molecules in mixtures according to their relative affinity to the column’s stationary phase. The molecules eluted from the column at different retention times; then, the mass spectrometer captured, ionized, and detected them as ionized molecular fragments based on their mass-to-charge. The collected samples were diluted with dichloromethane prior to GC–MS analysis (Figure A7, Figure A8, Figure A9, Figure A10 and Figure A11).
Figure A7.
Trapped liquid chromatogram analysis for R3.

Figure A8.
Trapped wax chromatogram analysis for R3.

Figure A9.
Collected liquid and wax samples postreaction in R4.

Figure A10.
Chromatogram results for collected liquid products on days 3, 6, 11, and 16 in R4.

Figure A11.
Trapped wax chromatogram analysis for R4.

Appendix B. Additional Information on Economic Calculations
ROCE calculations for the heat and transport sectors are presented in Table A1, Table A2, Table A3, Table A4, Table A5 and Table A6.

Table A1.
Expenditure for the reforming of biogas for the production of liquid fuels via FT (routes T1/H1).
Table A1.
Expenditure for the reforming of biogas for the production of liquid fuels via FT (routes T1/H1).
| Details | Capital Expenditure (St£) | Annual Expenditure (St£/year) |
|---|---|---|
| Capital costs | - | - |
| Reforming plant | 1,332,645 | 137,213 |
| FT plant | 3,285,500 | 338,284 |
| Total | 4,618,142 | 475,497 |
| Fixed costs | - | - |
| Reforming operation and maintenance | - | 133,264 |
| FT operation and maintenance | - | 131,420 |
| Depreciation | - | 307,876 |
| Biogas production | - | 334,892 |
| Total | - | 907,452 |
| Combined total cash expenditure | - | 1,382,949 |
Table A2.
Income, profit and ROCE for the reforming of biogas for the production of liquid fuels via FT (routes T1/H1).
Table A2.
Income, profit and ROCE for the reforming of biogas for the production of liquid fuels via FT (routes T1/H1).
| Details | Value |
|---|---|
| Income | - |
| Liquid fuels sold (£/year) | 149,740 |
| Total cash income (£/year) | 149,740 |
| Profit (£/year) | −1,233,209 |
| Profit (£/m3 biogas) | −1.44 |
| ROCE (%) | −89.17 |
Table A3.
Expenditure for conventional upgrading of biogas for use as CNG (routes T2/H2).
| Details | Capital Expenditure (St£) | Annual Expenditure (St£/year) |
|---|---|---|
| Capital costs | - | - |
| Conventional upgrading plant | 341,021 | 35,112 |
| Connection to gas grid | 213,000 | 21,931 |
| Total | 554,021 | 57,044 |
| Fixed costs | - | - |
| Upgrading operation and maintenance | - | 57,056 |
| Depreciation | - | 36,935 |
| Biogas production | - | 334,892 |
| Total | - | 428,883 |
| Combined total cash expenditure | - | 485,926 |
Table A4.
Income, profit and ROCE for conventional upgrading of biogas for use as CNG (routes T2/H2).
Table A4.
Income, profit and ROCE for conventional upgrading of biogas for use as CNG (routes T2/H2).
| Details | Including RHI | Excluding RHI |
|---|---|---|
| Income (H2) | - | - |
| Grid injection | 491,812 | 95,713 |
| Total cash income | - | 95,713 |
| Income (T2) | - | - |
| Grid injection | - | 210,902 |
| Total cash income | - | 210,902 |
| Profit (H2) (£/year) | 5886 | −390,214 |
| Profit (£/m3 biogas) | 0.01 | −0.45 |
| ROCE (%) | 1.21 | −80.30 |
| Profit (T2) (£/year) | - | −275,025 |
| Profit (£/m3 biogas) | - | −0.32 |
| ROCE (%) | - | −56.60 |
Table A5.
Expenditure for conventional upgrading of biogas for use as LNG (routes T3/H3).
| Details | Capital Expenditure (St£) | Annual Expenditure (St£/year) |
|---|---|---|
| Capital costs | - | - |
| Conventional upgrading plant | 341,021 | 35,112 |
| LNG plant | 200,000 | 20,593 |
| Total | 541,021 | 55,705 |
| Fixed costs | - | - |
| Upgrading operation and maintenance | - | 57,056 |
| LNG operation and maintenance | - | 30,000 |
| Transportation of LNG | - | 5639 |
| Depreciation | - | 36,068 |
| Biogas production | - | 334,892 |
| Total | - | 463,655 |
| Combined total cash expenditure | - | 519,360 |
Table A6.
Income, profit and ROCE for conventional upgrading of biogas for use as LNG (routes T3/H3).
Table A6.
Income, profit and ROCE for conventional upgrading of biogas for use as LNG (routes T3/H3).
| Details | Including RHI | Excluding RHI |
|---|---|---|
| Income (H3) | - | - |
| LNG sold | 491,812 | 95,713 |
| Total cash income | - | 95,713 |
| Income (T3) | - | - |
| LNG sold | - | 210,902 |
| Total cash income | - | 210,902 |
| Profit (H3) (£/year) | −27,548 | −423,647 |
| Profit (£/m3 biogas) | −0.03 | −0.49 |
| ROCE (%) | −5.30 | −81.57 |
| Profit (T3) (£/year) | - | −308,458 |
| Profit (£/m3 biogas) | - | −0.36 |
| ROCE (%) | - | −59.39 |
References
- Xu, J.; Zhou, W.; Li, Z.; Wang, J.; Ma, J. Biogas reforming for hydrogen production over a Ni–Co bimetallic catalyst: Effect of operating conditions. Int. J. Hydrogen Energy 2010, 35, 13013–13020. [Google Scholar] [CrossRef]
- BP. BP Statistical Review of World Energy. London, UK. 2018. Available online: https://www.bp.com/en/global/corporate/energy-economics/statistical-review-of-world-energy.html (accessed on 20 December 2018).
- Ashraf, M.T.; Bastidas-Oyanedel, J.R.; Schmidt, J.E. Conversion efficiency of biogas to liquids fuels through Fischer-Tropsch process. In Proceedings of the 23rd European Biomass Conference and Exhibition, Vienna, Austria, 1–4 June 2015. [Google Scholar]
- Lee, C.-Y.; Huh, S.-Y. Forecasting the diffusion of renewable electricity considering the impact of policy and oil prices: The case of South Korea. Appl. Energy 2017, 197, 29–39. [Google Scholar] [CrossRef]
- Nuttall, W.J.; Manz, D.L. A new energy security paradigm for the twenty-first century. Technol. Forecast. Soc. Chang. 2008, 75, 1247–1259. [Google Scholar] [CrossRef]
- Dorian, J.P.; Franssen, H.T.; Simbeck, D.R. Global challenges in energy. Energy Policy 2006, 34, 1984–1991. [Google Scholar] [CrossRef]
- Scholten, D.; Bosman, R. The geopolitics of renewables; exploring the political implications of renewable energy systems. Technol. Forecast. Soc. Chang. 2016, 103, 273–283. [Google Scholar] [CrossRef] [Green Version]
- Scarlat, N.; Dallemand, J.-F.; Fahl, F. Biogas: Developments and perspectives in Europe. Renew. Energy 2018, 129, 457–472. [Google Scholar] [CrossRef]
- EurObserv’ER. Biogas Barometer. Available online: https://www.eurobserv-er.org/biogas-barometer-2017/ (accessed on 10 December 2018).
- European Biogas Association (EBA). EBA Statistical Report 2017; European Biogas Association: Bruxelles, Belgium, 2017. [Google Scholar]
- De Rosa, F.; Smyth, B.M.; McCullough, G.; Goguet, A. Using multi-criteria and thermodynamic analysis to optimize process parameters for mixed reforming of biogas. Int. J. Hydrogen Energy 2018, 43, 18801–18813. [Google Scholar] [CrossRef]
- Siedlecki, M.; De Jong, W.; Verkooijen, A.H.M. Fluidized Bed Gasification as a Mature and Reliable Technology for the Production of Bio-Syngas and Applied in the Production of Liquid Transportation Fuels—A Review. Energies 2011, 4, 389–434. [Google Scholar] [CrossRef]
- Rafati, M.; Wang, L.; Dayton, D.C.; Schimmel, K.; Kabadi, V.; Shahbazi, A. Techno-economic analysis of production of Fischer-Tropsch liquids via biomass gasification: The effects of Fischer-Tropsch catalysts and natural gas co-feeding. Energy Convers. Manag. 2017, 133, 153–166. [Google Scholar] [CrossRef]
- Ail, S.S.; Dasappa, S. Investigations into enhanced wax production with combustion synthesized Fischer–Tropsch catalysts. Energy Convers. Manag. 2016, 116, 80–90. [Google Scholar] [CrossRef]
- Eurostat. Oil Statistics 2016 Update. Available online: https://ec.europa.eu/eurostat/statistics-explained/index.php?title=Oil_and_petroleum_products_-_a_statistical_overview#Use_of_petroleum_products (accessed on 10 December 2018).
- Bolder, F.H.A. Fischer-Tropsch wax hydrogenation over a sulfided nickel-molybdenum catalyst. Energy Fuels 2007, 21, 1396–1399. [Google Scholar] [CrossRef]
- Kumar, A.; Jones, D.D.; Hanna, A.M. Thermochemical Biomass Gasification: A Review of the Current Status of the Technology. Energies 2009, 2, 556–581. [Google Scholar] [CrossRef] [Green Version]
- Gorimbo, J.; Lu, X.; Liu, X.; Hildebrandt, D.; Glasser, D. A long term study of the gas phase of low pressure Fischer-Tropsch products when reducing an iron catalyst with three different reducing gases. Appl. Catal. A Gen. 2017, 534, 1–11. [Google Scholar] [CrossRef]
- van Vliet, O.P.R.; Faaij, A.P.C.; Turkenburg, W.C. Fischer–Tropsch diesel production in a well-to-wheel perspective: A carbon, energy flow and cost analysis. Energy Convers. Manag. 2009, 50, 855–876. [Google Scholar] [CrossRef]
- Choi, Y.H.; Jang, Y.J.; Park, H.; Kim, W.Y.; Lee, Y.H.; Choi, S.H.; Lee, J.S. Carbon dioxide Fischer-Tropsch synthesis: A new path to carbon-neutral fuels. Appl. Catal. B Environ. 2017, 202, 605–610. [Google Scholar] [CrossRef]
- Aluha, J.; Abatzoglou, N. Synthetic fuels from 3-φ Fischer-Tropsch synthesis using syngas feed and novel nanometric catalysts synthesised by plasma. Biomass Bioenergy 2016, 95, 330–339. [Google Scholar] [CrossRef]
- Chein, R.-Y.; Hsu, W.-H. Analysis of Syngas Production from Biogas via the Tri-Reforming Process. Energies 2018, 11, 1075. [Google Scholar] [CrossRef]
- Yang, J.; Ma, W.; Chen, D.; Holmen, A.; Davis, B.H. Fischer–Tropsch synthesis: A review of the effect of CO conversion on methane selectivity. Appl. Catal. A Gen. 2014, 470, 250–260. [Google Scholar] [CrossRef]
- Dinse, A.; Aigner, M.; Ulbrich, M.; Johnson, G.R.; Bell, A.T. Effects of Mn promotion on the activity and selectivity of Co/SiO2 for Fischer–Tropsch Synthesis. J. Catal. 2012, 288, 104–114. [Google Scholar] [CrossRef]
- Tavasoli, A.; Khodadadi, A.; Mortazavi, Y.; Sadaghiani, K.; Ahangari, M.G. Lowering methane and raising distillates yields in Fischer–Tropsch synthesis by using promoted and unpromoted cobalt catalysts in a dual bed reactor. Fuel Process. Technol. 2006, 87, 641–647. [Google Scholar] [CrossRef]
- Mirzaei, A.A.; Vahid, S.; Feyzi, M. Fischer-Tropsch synthesis over iron manganese catalysts: Effect of preparation and operating conditions on catalyst performance. Adv. Phys. Chem. 2009, 2009, 151489. [Google Scholar] [CrossRef]
- Savost’yanov, A.P.; Yakovenko, R.E.; Sulima, S.I.; Bakun, V.G.; Narochnyi, G.B.; Chernyshev, V.M.; Mitchenko, S.A. The impact of Al2O3 promoter on an efficiency of C5+ hydrocarbons formation over Co/SiO2 catalysts via Fischer-Tropsch synthesis. Catal. Today 2017, 279, 107–114. [Google Scholar] [CrossRef]
- Dixit, J.B. Structured System Analysis and Design; Firewall Media, Laxmi Publications: New Delhi, India, 2007; ISBN 8131802663. [Google Scholar]
- Xiang, D.; Yang, S.; Qian, Y. Techno-economic analysis and comparison of coal based olefins processes. Energy Convers. Manag. 2016, 110, 33–41. [Google Scholar] [CrossRef]
- Broberg Viklund, S.; Johansson, M.T. Technologies for utilization of industrial excess heat: Potentials for energy recovery and CO2 emission reduction. Energy Convers. Manag. 2014, 77, 369–379. [Google Scholar] [CrossRef] [Green Version]
- Moret, S.; Peduzzi, E.; Gerber, L.; Maréchal, F. Integration of deep geothermal energy and woody biomass conversion pathways in urban systems. Energy Convers. Manag. 2016, 129, 305–318. [Google Scholar] [CrossRef] [Green Version]
- Zhang, X.; Wang, Y.; Liu, T.; Chen, J. Theoretical basis and performance optimization analysis of a solid oxide fuel cell–gas turbine hybrid system with fuel reforming. Energy Convers. Manag. 2014, 86, 1102–1109. [Google Scholar] [CrossRef]
- Shimura, K.; Miyazawa, T.; Hanaoka, T.; Hirata, S. Fischer–Tropsch synthesis over alumina supported cobalt catalyst: Effect of promoter addition. Appl. Catal. A Gen. 2015, 494, 1–11. [Google Scholar] [CrossRef]
- Chu, W.; Xu, J.; Hong, J.; Lin, T.; Khodakov, A. Design of efficient Fischer–Tropsch cobalt catalysts via plasma enhancement: Reducibility and performance (Review). Catal. Today 2015, 256, 41–48. [Google Scholar] [CrossRef]
- Khodakov, A.Y.; Chu, W.; Fongarland, P. Advances in the Development of Novel Cobalt Fischer−Tropsch Catalysts for Synthesis of Long-Chain Hydrocarbons and Clean Fuels. Chem. Rev. 2007, 107, 1692–1744. [Google Scholar] [CrossRef]
- Rodrigues, J.J.; Lima, L.A.; Lima, W.S.; Rodrigues, M.G.F.; Fernandes, F.A.N. Fischer-Tropsch Synthesis in slurry-phase Reactors using Co/SBA-15 catalysts. Braz. J. Pet. Gas 2011, 5. [Google Scholar] [CrossRef]
- Eurostat. SHARES (RENEWABLES). Available online: https://ec.europa.eu/eurostat/web/energy/data/shares (accessed on 19 February 2019).
- DAERA. The Agricultural Census in Northern Ireland Results for June 2018. 2019. Available online: https://www.daera-ni.gov.uk/publications/agricultural-census-northern-ireland-2018 (accessed on 28 February 2019).
- Smyth, B.M.; Murphy, J.D.; O’Brien, C.M. What is the energy balance of grass biomethane in Ireland and other temperate northern European climates? Renew. Sustain. Energy Rev. 2009, 13, 2349–2360. [Google Scholar] [CrossRef]
- NNFCC Biogas Map (AD Portal Map Site List). Available online: http://www.biogas-info.co.uk/resources/biogas-map/ (accessed on 18 February 2019).
- Smyth, B.M.; Smyth, H.; Murphy, J.D. Can grass biomethane be an economically viable biofuel for the farmer and the consumer? Biofuels Bioprod. Biorefining 2010, 4, 519–537. [Google Scholar] [CrossRef]
- Keatley, P. Farm Business Data 2015; Department of Agriculture and Rural Development (DARD): Belfast, UK, 2015. [Google Scholar]
- Agersborg, J.; Linghed, E. Integration of Power-to-Gas in Gasendal and GoBiGas. Master’s Thesis, Chalmers University of Technology, Göteborg, Sweden, 2013. [Google Scholar]
- Global Capital Finance; Clean Energy Pipeline. The European Renewable Energy Investor Landscape. 2014. Available online: http://cleanenergypipeline.com/Resources/CE/ResearchReports/The European Renewable Energy Investor Landscape.pdf (accessed on 28 February 2019).
- Paturska, A.; Repele, M.; Bazbauers, G. Economic Assessment of Biomethane Supply System based on Natural Gas Infrastructure. Energy Procedia 2015, 72, 71–78. [Google Scholar] [CrossRef] [Green Version]
- Blesl, M.; Bruchof, D. Liquid Fuels Production from Coal & Gas (Technology Brief P06). 2010. Available online: https://iea-etsap.org/E-TechDS/PDF/P06-CTLGTL-GS-gct-AD_gs.pdf (accessed on 5 December 2016).
- Songhurst, B. LNG Price Cost Escalation. Oxford, UK. 2014. Available online: https://www.oxfordenergy.org/wpcms/wp-content/uploads/2014/02/NG-83.pdf (accessed on 2 February 2017).
- Energy Solutions Historical Natural Gas Prices. Available online: www.energybrokers.co.uk/gas/historic-price-data-graph.htm (accessed on 25 January 2017).
- CNG Europe Great Britain CNG Filling Stations. Available online: http://cngeurope.com/countries/great-britain/ (accessed on 12 December 2015).
- Petrol Prices UK Petrol Prices. Available online: www.petrolprices.com (accessed on 1 February 2017).
- UK Government Tax on Shopping and Services. Available online: www.gov.uk/tax-on-shopping/fuel-duty (accessed on 12 February 2017).
- Dransfield, R.; Needham, D. Advanced Business; Heinemann Educational Publishers: Oxford, UK, 2000. [Google Scholar]
- Ofgem The Renewables Obligation (RO) Buy-Out Price (£44.33) and Mutualisation Ceilings 2015-16. Available online: https://www.ofgem.gov.uk/publications-and-updates/renewables-obligation-ro-buy-out-price-44-33-and-mutualisation-ceilings-2015-16 (accessed on 2 March 2019).
- Petersson, A.; Wellinger, A. Biogas Upgrading Technologies—Developments and Innovations. 2009. Available online: https://www.iea-biogas.net/files/daten-redaktion/download/publi-task37/upgrading_rz_low_final.pdf (accessed on 10 December 2016).
- Maitlis, P.M. Greener Fischer-Tropsch Processes for Fuels and Feedstocks; Maitlis, P.M., de Klerk, A., Eds.; Wiley-VCH: Weinheim, Germany, 2013; ISBN 9783527329458. [Google Scholar]
- Storsæter, S.; Borg, Ø.; Blekkan, E.A.; Holmen, A. Study of the effect of water on Fischer–Tropsch synthesis over supported cobalt catalysts. J. Catal. 2005, 231, 405–419. [Google Scholar] [CrossRef]
- Gholami, R.; Alyani, M.; Smith, J.K. Deactivation of Pd Catalysts by Water during Low Temperature Methane Oxidation Relevant to Natural Gas Vehicle Converters. Catalysts 2015, 5, 561–594. [Google Scholar] [CrossRef] [Green Version]
- Marwaha, B.; Luss, D. Hot zones formation in packed bed reactors. Chem. Eng. Sci. 2003, 58, 733–738. [Google Scholar] [CrossRef]
- van der Laan, G.P.; Beenackers, A.A.C.M. Kinetics and Selectivity of the Fischer–Tropsch Synthesis: A Literature Review. Catal. Rev. 1999, 41, 255–318. [Google Scholar] [CrossRef]
- Iglesia, E. Design, synthesis, and use of cobalt-based Fischer-Tropsch synthesis catalysts. Appl. Catal. A Gen. 1997, 161, 59–78. [Google Scholar] [CrossRef]
- Zhan, X.; Davis, B.H. Two alpha f1scher-tropsch product distribution. A role for vapor-liquid equilibrium? Pet. Sci. Technol. 2000, 18, 1037–1053. [Google Scholar] [CrossRef]
- Bukur, D.B.; Todic, B.; Elbashir, N. Role of water-gas-shift reaction in Fischer–Tropsch synthesis on iron catalysts: A review. Catal. Today 2016, 275, 66–75. [Google Scholar] [CrossRef] [Green Version]
- Tavasoli, A.; Nakhaei Pour, A.; Ahangari, M.G. Kinetics and product distribution studies on ruthenium-promoted cobalt/alumina Fischer-Tropsch synthesis catalyst. J. Nat. Gas Chem. 2010, 19, 653–659. [Google Scholar] [CrossRef]
- Argyle, M.; Bartholomew, C.; Argyle, M.D.; Bartholomew, C.H. Heterogeneous Catalyst Deactivation and Regeneration: A Review. Catalysts 2015, 5, 145–269. [Google Scholar] [CrossRef] [Green Version]
- Rytter, E.; Holmen, A. Deactivation and regeneration of commercial type Fischer-Tropsch Co-catalysts—A mini-review. Catalysts 2015, 5, 478–499. [Google Scholar] [CrossRef]
- Calleja, G.; de Lucas, A.; van Grieken, R. Co/HZSM-5 catalyst for syngas conversion: Influence of process variables. Fuel 1995, 74, 445–451. [Google Scholar] [CrossRef]
- Tristantini, D.; Lögdberg, S.; Gevert, B.; Borg, Ø.; Holmen, A. The effect of synthesis gas composition on the Fischer–Tropsch synthesis over Co/γ-Al2O3 and Co–Re/γ-Al2O3 catalysts. Fuel Process. Technol. 2007, 88, 643–649. [Google Scholar] [CrossRef]
- Yates, I.C.; Satterfield, C.N. Hydrocarbon selectivity from cobalt Fischer-Tropsch catalysts. Energy Fuels 1992, 6, 308–314. [Google Scholar] [CrossRef]
- Filot, I.A.W.; Zijlstra, B.; Broos, R.J.P.; Chen, W.; Pestman, R.; Hensen, E.J.M. Kinetic aspects of chain growth in Fischer–Tropsch synthesis. Faraday Discuss. 2017, 197, 153–164. [Google Scholar] [CrossRef] [PubMed] [Green Version]
- Li, H.; Wang, J.; Chen, C.; Jia, L.; Hou, B.; Li, D. Effects of macropores on reducing internal diffusion limitations in Fischer–Tropsch synthesis using a hierarchical cobalt catalyst. RSC Adv. 2017, 7, 9436–9445. [Google Scholar] [CrossRef] [Green Version]
- Lualdi, M.; Lögdberg, S.; Boutonnet, M.; Järås, S. On the effect of water on the Fischer–Tropsch rate over a Co-based catalyst: The influence of the H2/CO ratio. Catal. Today 2013, 214, 25–29. [Google Scholar] [CrossRef]
- Mansouri, M.; Atashi, H.; Tabrizi, F.F.; Mansouri, G.; Setareshenas, N. Fischer–Tropsch synthesis on cobalt–manganese nanocatalyst: Studies on rate equations and operation conditions. Int. J. Ind. Chem. 2014, 5, 14. [Google Scholar] [CrossRef]
- Ma, W.; Jacobs, G.; Sparks, D.E.; Spicer, R.L.; Davis, B.H.; Klettlinger, J.L.S.; Yen, C.H. Fischer–Tropsch synthesis: Kinetics and water effect study over 25% Co/Al2O3 catalysts. Catal. Today 2014, 228, 158–166. [Google Scholar] [CrossRef]
- Hakawati, R.; Smyth, B.M.; McCullough, G.; De Rosa, F.; Rooney, D. What is the most energy efficient route for biogas utilization: Heat, electricity or transport? Appl. Energy 2017, 206, 1076–1087. [Google Scholar] [CrossRef]
- Samavati, M.; Martin, A.; Santarelli, M.; Nemanova, V. Synthetic Diesel Production as a Form of Renewable Energy Storage. Energies 2018, 11, 1223. [Google Scholar] [CrossRef]
- Simonsen, M.; Walnum, H.J. Energy chain analysis of passenger car transport. Energies 2011, 4, 324–351. [Google Scholar] [CrossRef]
- Stefanakis, A.; Akratos, C.S.; Tsihrintzis, V.A. Vertical Flow Constructed Wetlands, 1st ed.; Elsevier: Amsterdam, The Netherlands, 2014; ISBN 9780124046122. [Google Scholar]
- OECD. Crude Oil Import Prices. Available online: https://data.oecd.org/energy/crude-oil-import-prices.htm (accessed on 2 March 2019).
- Couto, R.A. Regional Development within National Industrial Policies: An Analysis of the British Coal Industry. Growth Chang. 1990, 21, 51–68. [Google Scholar] [CrossRef]
- Hossein-Zadeh, I. The Political Economy of US Wars of Choice: Are They Really Oil Wars? In The Nation in the Global Era; Brill: Leiden, The Netherlands, 2009; pp. 185–204. [Google Scholar]
Figure 1.
Experimental rig setup.


Figure 7.
Comparison of measured product distribution with that predicted by the fitted dual α model.
Figure 7.
Comparison of measured product distribution with that predicted by the fitted dual α model.

Figure 8.
Conversion for Zones A, B, and C in R4 (refer to Table 3 and Table 4 for reaction details).

Figure 9.
CO conversion and methane selectivity for different feed ratios in Zone D in R4 (refer to Table 3 and Table 4 for reaction details).

Figure 10.
Return on capital employed (ROCE) for routes in the heat and transport sectors.

Table 1.
Reaction process refinement tests.
| Reaction | Purpose of Test |
|---|---|
| R1 | Preliminary setup to test if the commercial catalyst was active for reaction at atmospheric pressure |
| R2 | To test the impact of catalyst quantity and to verify that the catalyst’s activity and conversion could be boosted by increasing the quantity of catalyst |
| R3 | To test the impact of reactor dimensions and system configuration on conversion and activity |
Table 2.
Testing parameters for R1, R2, and R3.
| Parameters | R1 | R2 | R3 |
|---|---|---|---|
| Reactor length (cm) | 50 | 50 | 50 |
| Reactor internal diameter (ID) (cm) | 0.6 | 0.6 | 1.2 |
| Catalyst mass (g) | 0.2 | 0.44 | 0.44 |
| SiC mass (g) | 0.4 | 0.88 | 0.88 |
| Total catalyst bed height (cm) | 8 | 16 | 4 |
| Feed flow rate (mL/min) | 32.5 | 32.5 | 32.5 |
| Gas hourly space velocity (GHSV) 1 (hr−1) | 862.83 | 430.46 | 463.46 |
| H2 in He reduction gas flow rate (mL/min) | 26 | 13 | 13 |
| Pressure increase during reduction (MPa) | 0.2 | 0.1 | 0.05 |
| Pressure increase during reaction (MPa) | 0.15 | 0.1 | 0.05 |
| System configuration | No trap | No trap | Added trap 2 |
1 GHSV = feed flow rate/reactor catalyst bed volume. 2 This was a room temperature trap located vertically at the bottom of the reactor to facilitate monitoring of the formation of any liquid fuels.
Table 3.
Testing parameters for R4.
| Parameters | R4 |
|---|---|
| Reactor length (cm) | 50 |
| Reactor internal diameter (cm) | 1.2 |
| Unsieved catalyst mass (g) | 1 |
| SiC mass (g) | 2 |
| Feed flow rate (mL/min) | 32.5 |
| H2 in He reduction gas flow rate (mL/min) | 13 |
| Pressure increase during reduction (MPa) | 0.02 |
| Pressure increase during reaction (MPa) | 0.02 |
Table 4.
Zones investigated in R4 for testing the system robustness.
| Zone | Parameter Investigated | Experimental Steps |
|---|---|---|
| A | Feed gas interruption of supply | Reaction was stopped at day 11.5, then cooled in He from 488 K (215 °C) to 373 K (100 °C) at 10 K/min (10 °C/min). Reactor was kept under He flow for 30 min. Reacting feed was introduced at 373 K (100 °C). Temperature was increased under feed conditions from 373 K (100 °C) to 488 K (215 °C) at 1 K/min (1 °C/min). |
| B | Technical problems that could interrupt the reaction 1 | Reaction was stopped at day 12.3. Gas supply was shut down and the reactor cooled to 303 K (30 °C) (by turning off the furnace). Temperature was increased under feed conditions from 303 K (30 °C) to 488 K (215 °C) at 10 K/min (10 °C/min). |
| C | The feasibility of regenerating and reusing the catalyst | Reaction was stopped at day 13.5, then cooled in He (by turning off the furnace) until temperature of 303 K (30 °C) was recorded. Re-reduced in H2 (as per prereaction process). |
| D | The catalyst’s behavior if the feed ratio was interrupted or altered during the reaction | At day 16, after 9 h of reaction, the H2:CO feed ratio was altered from 2:1 to 3:1 for 15 h. The ratio was then changed to 1:1 until day 19. |
1 e.g., electricity shutdown, mass flow controllers malfunctioning, or furnace heating technical problems.
Table 5.
Capital and operation and maintenance costs based on an AD plant producing ~860,000 m3/year of biogas.
Table 5.
Capital and operation and maintenance costs based on an AD plant producing ~860,000 m3/year of biogas.
| Technology | Capital Expenditure (St£) | Operation and Maintenance (St£/yr) | Source |
|---|---|---|---|
| Conventional upgrading (membrane separation) | 341,021 | 57,055 | Average calculated from Smyth et al. and Paturska et al. [41,45] |
| Reforming | 1,332,642 | 133,264 | Estimated from Blesl and Bruchof [46] using Equation (6) |
| Fischer-Tropsch | 3,285,500 | 131,420 | Estimated from Blesl and Bruchof [46] using Equation (6) |
| LNG | 200,000 | 30,000 | Estimated from Songhurst [47] using Equation (4) |
Table 6.
Assumptions and prices (UK) used for income calculations.
| Details | Value 1 | Source |
|---|---|---|
| Wholesale gas price | St£0.0181/kWh | Calculated from Energy Solutions [48] |
| Average CNG price | St£0.89/kg | [49] |
| Average diesel price | St£1.222/litre | [50] |
| Fuel tax duty (diesel, petrol and biodiesel) | St£0.5795 | [51] |
| Fuel tax duty (CNG) | St£0.247/kg | [51] |
| Connection to gas grid | St£213,000 | [41] |
| Cost for transporting LNG per km 2 | St£1.86/km for 36,370 l lorry | [52] |
| Biomethane grid injection RHI | St£0.075/kWh | [53] |
| Average density of liquid fuel | 874.74 kg/m3 | - |
| Methane slip (conventional upgrading) | 0.04% | [54] |
| Liquid fuel conversion efficiency via FT | 33% | [55] |
| CH4 density | 0.69 kg/m3 | - |
| CH4 thermal energy | 11.19 kWh/m3 | - |
| H2 molecular weight | 2 g/mol | - |
| CH4 molecular weight | 18 g/mol | - |
| CO molecular weight | 28 g/mol | - |
| H2 to CH4 molar ratio 3 | 3 | - |
| CO to CH4 molar ratio 3 | 1 | - |
| Steam reforming reaction conversion efficiency (decimal) | 1 | Best case scenario |
| Liquid fuels produced 4 | 233.06 m3 | - |
1 The following exchange rates were used to convert to pounds Sterling; €1.408 to St£1.00; US$1.53 to St£1.00; 13.157 SEK to St£1.00 (rates at 7/12/2015). 2 A distance of 138 km was assumed to represent the distance from an agricultural AD facility in the west of Northern Ireland to the main city in the region, Belfast. 3 This value is based on stoichiometry from methane steam reforming. 4 This calculation assumed 100% methane conversion to syngas (CO and H2) via steam methane reforming and 33% conversion of syngas to FT liquids. Biogas is assumed to be 55% methane, and the assumed methane density is 0.69 kg/m3, so 860,000 m3/year × 0.55 × 0.69 = 328,000 kg of methane. See Table 7 for further details.
Table 7.
Income calculation methodology for the investigated routes in the heat and transport sectors excluding the Renewable Heat Incentive (RHI).
Table 7.
Income calculation methodology for the investigated routes in the heat and transport sectors excluding the Renewable Heat Incentive (RHI).
| Scenario | Calculation Steps |
|---|---|
| T1/H1 | Biogas » reforming » syngas » Fischer-Tropsch » liquid fuel » heat/transport |
| CH4 mass (kg) = biogas production (m3/year) × biogas purity × CH4 density (kg/m3) Mass of H2 produced (kg) = (H2 molecular weight/CH4 molecular weight) × (H:CH4 molar ratio) × [mass CH4 (kg)] × (reaction conversion efficiency) Mass of CO produced (kg) = (CO molecular weight/CH4 molecular weight) × (CO:CH4 molar ratio) × [mass CH4 (kg)] × (reaction conversion efficiency) Liquid fuel produced (m3) = [mass of CO produced (kg) + mass of H2 produced (kg)] × (Fischer-Tropsch conversion efficiency to liquid fuels) × [liquid fuel average density (kg/m3)] Income = (Liquid fuel produced (m3)/1000) × [liquid fuel sale price (St£/l) − diesel fuel tax duty (St£/l)] | |
| T2/H2 and T3/H3 | Biogas » upgrading » biomethane » compression/liquefaction » CNG/LNG » heat/transport |
| CH4 produced (m3) = [biogas production (m3/yr) × CH4 purity] − [CH4 slip during upgrading (m3)] Heating income = CH4 produced (m3) × CH4 energy density (kWh/m3) × wholesale gas price (St£/kWh) Transport income = CH4 produced (m3) × methane density (kg/m3) × [CNG filling station price (St£/kg) − CNG fuel tax duty (St£/kg)] |
Table 8.
Summary of overall findings.
| Parameters Investigated | Conclusions |
|---|---|
| Iterative refinement | |
| R1 | Commercial catalyst was active at 0.1 MPa (1 bar) producing 96% methane |
| R2 | An increase in the amount of catalyst increased the activity and selectivity to liquid fuel production which reached 20% |
| R3 | Doubling the reactor’s internal diameter, while using the same amount of catalyst as R2, increased the catalyst’s activity to an average of 12%, compared to 7% in R2 |
| Optimization | |
| R4 | Using the same reactor as R3 but further increasing the amount of catalyst boosted conversion to an average of 18% within the first week with liquid fuel selectivity reaching 60% |
| System robustness (R4) | |
| Zone A | Cooling the reactor to 373 K (100 °C) in the presence of He helped regain catalyst activity at FT conditions, as CO conversion increased to 20% with higher selectivity to liquid fuels than methane |
| Zone B | Complete shutdown of gas supply and cooling to 303 K (30 °C) caused CO conversion to drop (<10% at FT conditions) but higher selectivity to liquid fuels (53%) was maintained |
| Zone C | Catalyst re-reduction with H2 helped eliminate waxy products stuck on the catalyst but enhanced methane selectivity with a drop in CO conversion (from 23% to 10%) |
| Zone D | H2/CO feed ratio of 2:1 was the most suitable for FT reaction at 0.1 MPa (1 bar) |
Table 9.
Results of economic analysis.
| Scenario 1 | Total Annual Expenditure (St£/year) | Total Capital Expenditure (St£) | Profit Ex RHI (St£/year) | Profit (St£/m3 biogas) | ROCE (%) | Appropriate Profit Level (St£/m3 biogas) 2 | Required Subsidy (St£/m3 biogas) 3 |
|---|---|---|---|---|---|---|---|
| T1/H1 | 1,382,949 | 4,618,142 | −1,233,209 | −1.44 | −89.17 | 0.12 | 1.55 |
| H2 | 485,926 | 554,021 | −390,213 | −0.45 | −80.30 | 0.04 | 0.50 |
| T2 | 485,926 | 554,021 | −275,025 | −0.32 | −56.60 | 0.04 | 0.36 |
| H3 | 519,360 | 541,021 | −423,647 | −0.49 | −81.57 | 0.04 | 0.54 |
| T3 | 519,360 | 541,021 | −308,458 | −0.36 | −59.39 | 0.04 | 0.4 |
1 T1/H1: AD-reforming-FT-liquid fuel; H2/T2: AD-upgrading-compression-CNG; H3/T3: AD-upgrading-liquefaction-LNG. 2 Appropriate profit level is the profit level for 7.25% ROCE. 3 Required subsidy = appropriate profit level − profit.
© 2019 by the authors. Licensee MDPI, Basel, Switzerland. This article is an open access article distributed under the terms and conditions of the Creative Commons Attribution (CC BY) license (http://creativecommons.org/licenses/by/4.0/).
Share and Cite
MDPI and ACS Style
Hakawati, R.; Smyth, B.; Daly, H.; McCullough, G.; Rooney, D. Is the Fischer-Tropsch Conversion of Biogas-Derived Syngas to Liquid Fuels Feasible at Atmospheric Pressure? Energies 2019, 12, 1031. https://doi.org/10.3390/en12061031
AMA Style
Hakawati R, Smyth B, Daly H, McCullough G, Rooney D. Is the Fischer-Tropsch Conversion of Biogas-Derived Syngas to Liquid Fuels Feasible at Atmospheric Pressure? Energies. 2019; 12(6):1031. https://doi.org/10.3390/en12061031
Chicago/Turabian StyleHakawati, Rawan, Beatrice Smyth, Helen Daly, Geoffrey McCullough, and David Rooney. 2019. "Is the Fischer-Tropsch Conversion of Biogas-Derived Syngas to Liquid Fuels Feasible at Atmospheric Pressure?" Energies 12, no. 6: 1031. https://doi.org/10.3390/en12061031
Note that from the first issue of 2016, this journal uses article numbers instead of page numbers. See further details here.