1. Introduction
Developing an efficient and sustainable electricity system under an energy transition approach involves challenges in the system’s design, planning, and operation. This system requires integrating new technologies, such as microgrids and power electronic converters, whose new paradigm is reflected in the modeling and simulation methods used to analyze, control, and manage medium- and low-voltage electrical systems [
1]. Under this new paradigm, MGs play an essential role since they allow for the integration of distributed energy resources (DERs) flexibly and efficiently in distribution systems (DSs), even though they require synchronization and reactive power control mechanisms—in AC MGs’ case, voltage regulation mechanisms, and in DC MGs’ case, power dispatch algorithms—which are characteristics that increase the complexity of EMSs in MGs [
2]. HMGs allow the advantages of AC and DC systems to be exploited in a flexible, reliable, and economical manner under a radial structure in most applications [
3]. However, these structures require voltage regulation strategies since they present drawbacks about voltage surges at the DER coupling points and overloads at the common coupling points (CCPs) of the MG combined with voltage sags at the end of the feeder in the face of high-load-demand events [
4]. Recently, ST-based MHMs have been proposed as an answer to the shortcomings of conventional HMGs since they take advantage of the degrees of freedom of the ST [
5]. This type of MG allows for the forming of several meshed power flow paths by interconnecting the electronic power interface (EPI) of each DER of the MG with the medium- and low-voltage AC/DC ports of the ST; moreover, it allows for eliminating the coupling of an interconnecting converter (IC), typical of HMGs [
6].
For the management of ST-based MHMs, a hierarchical control structure must be integrated. The primary level comprises the control loops of the electronic converters (voltage and current regulation) and power transfer management of the DERs and each stage of the ST. The secondary level is oriented to control power flow, voltage, frequency, and power quality criteria. Finally, the tertiary level seeks to establish decision criteria in the framework of the economic dispatch, the general supervision of the MG, and the generation and demand forecasting, ensuring the optimal operating point of the system [
7]. For the design, simulation, and validation of system performance under a hierarchical control approach, mathematical models relating the DER power flow to the MHM are required to formulate and solve an optimization problem at the upper layer of the control and management of the MHM [
8]. At the secondary and primary levels, low-frequency equivalent models, whose dominant dynamics are by the simulation horizon, are introduced for system performance analysis under a daily scheduling approach based on demand and generation forecasting [
9,
10]; these models must be sufficiently detailed so that the dynamics of interest are accurately identified throughout, while at the same time being simple enough to meet real-time simulation constraints [
11,
12]. Thus, it is necessary to build DRTS schemes with the detail and accuracy required to account for the reliability of both the computational models and the optimal operating point of the MHM.
Off-line (model in the loop—MIL, processor in the loop—PIL, software in the loop—SIL), online, and real-time simulations are the main methods focused on power electronics equipment testing. The digital real-time simulation can be classified into two main categories: (1) an entirely software-based DRTS and (2) hardware-in-the-loop (HIL) RT simulation or HILS. These schemes allow for testing the performance of electrical systems focused mainly on the second and first level of system control. However, with long-term approaches, model adjustments are required to capture relevant dynamics in the study while maintaining the generality of the simulation horizon [
13].
Table 1 summarizes the review results of the principal published articles compared with the approach proposed in this paper. First, we seek to identify the publication date and the simulation method. We also determine whether it focuses on converter control (transient analysis) or power flow microgrid management (steady state) and whether ST integration is considered. Finally, we introduce the type of modeling, where equivalent or switched models are considered according to the simulation approach.
According to the information reported in
Table 1, it is observed that the HILS method is typically used for analysis under a transient approach considering detailed or switched models. In most cases where a long-term analysis is considered, equivalent models are developed to reduce the computational load [
18]; however, some works present hybrid models, switched models in the lower control layers, and equivalent models for long-term system management [
29]. On the other hand, it is identified that the DRTS approach presents good performance in both switched models and equivalent models, in addition to the functionalities presented about the steady-state analysis of the system, mainly for long-term analysis for optimal power flow. Finally, it is observed that the reported works that present the study of the ST propose switched structures under an HILS method, focusing mainly on the performance of the control loops of the different ST stages.
Although DRTS and HILS models have been widely implemented to validate the performance of controllers in power electronic converters, even with a long-term approach, no works have been identified that take advantage of the benefits of ST-based MHMs in terms of the EMS performance and availability of ancillary services such as active and reactive power dispatch under a simulation approach, either DRTS or HILS, integrating equivalent and power flow models with a 24 h operation horizon. In this context, a gap is identified regarding DRTS simulation in ST-based MHMs for day-ahead operation and reactive power dispatch; therefore, the main contributions of this work are as follows:
- ✓
A low-frequency equivalent model is proposed for both the ST with decoupled control loops and the PEIs MHM to develop accelerated DRTS models under long-term simulation tests.
- ✓
A power flow model from a decoupled ST and PEI structure is proposed to formulate and solve an optimization problem in the MHM’s upper control and management layer for day-ahead operational planning.
- ✓
A methodology for implementing ST-based MHMs’ DRTS-accelerated models allows for analyzing the system response according to the hierarchical control layer structure under a system daily operational planning approach.
This paper presents the development of a simulation model of an ST-based MHM under the Simulink® environment of Matlab® 9.12 for its subsequent implementation within a DRTS scheme under the OPAL-RT® platform. The feasible solution to the OPF problem is verified from the system performance at the first and second levels of the hierarchical control structure. The management algorithm (third level) provides the optimal system operating points by setting the criteria for active power injection on both the AC and DC sides. Reactive power control is based on the availability of the PVG resource and the battery energy storage system (BESS) (second level). These criteria are translated into references for the operating point of each MG converter, voltage, and current control (first level). On the other hand, the decoupled structure of the ST allows for the control of the power flow between the AC and DC sides of the MHM since the third stage of the ST is considered an active voltage source converter (VSC) whose operating point is set by the management algorithm.
The rest of this paper is organized as follows:
Section 2 proposes the power electronic interface, modeling, and power flow equation, as well as the workflow of the DRTS approach;
Section 3 presents simulation results and discusses them; while
Section 4 concludes this paper.
2. Power Electronic Interface, Modeling, and Power Flow Equation
This section presents the ST’s modular model and the equivalent model averaged to implement the simulation model and the power flow equations. Likewise, the third stage of the ST supports the explanation of the electronic converters’ modeling for coupling the DER and the DC microgrid with the AC microgrid. On the other hand, the power electronic interface converters used for the DER on the AC and DC sides are modeled from the averaged approach proposed in [
32,
33].
2.1. Smart Transformer Modeling and Control
The ST is a multi-stage, multiport low- and medium-voltage converter for interconnection with hybrid AC-DC systems. In addition to providing services that allow for the replacement of low-frequency transformers (LFTs), the ST is conceived as an energy router since it will enable integrating algorithms for the injection or absorption of active and reactive power, mitigating harmonics, attenuating voltage drops, and limiting the current in case of short-circuit faults [
34], among other aspects that allow for forming hybrid meshed microgrids.
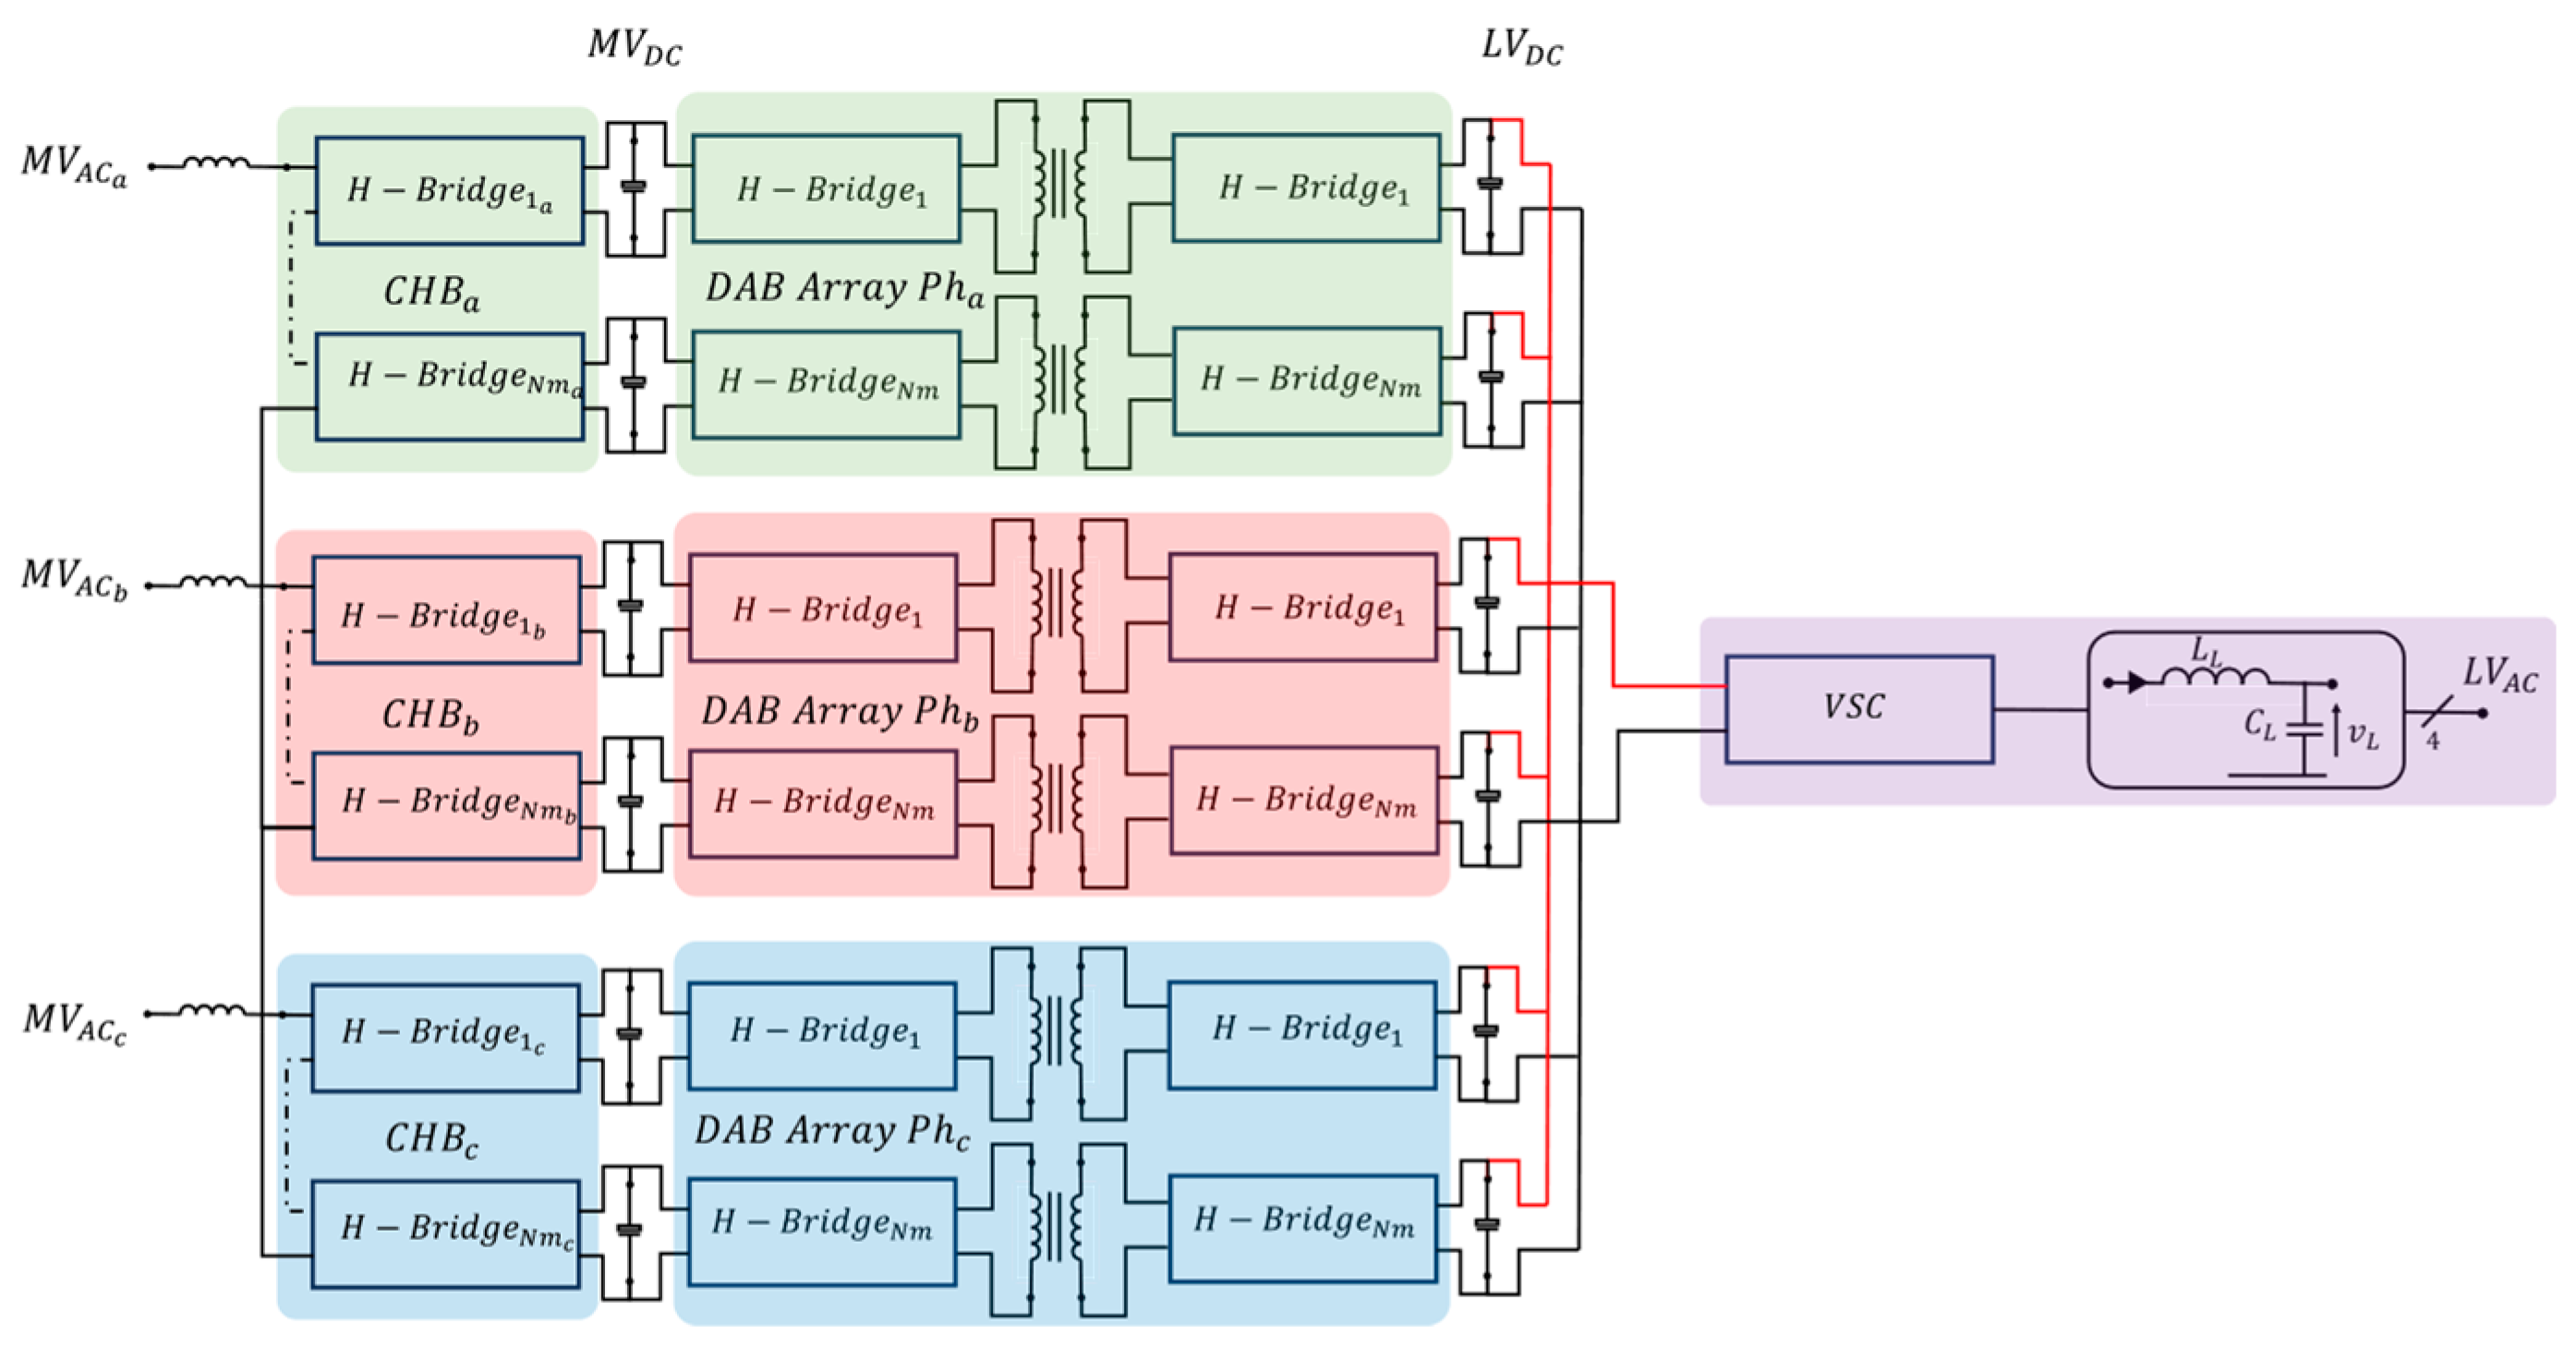
A multi-stage modular structure is implemented since the first stage of the ST is connected to the medium-voltage grid. This structure is composed of cascaded H-bridge converter-type modules to increase the reverse voltage input to the AC-DC converter, thus obtaining a configuration of
modules in series at the converter’s input for each phase of the medium-voltage network. The parallel medium-voltage DC outputs, one for each module, are individually connected to the input port of the second stage of the converter, consisting of a dual active bridge (DAB) converter for each module of the first stage. The secondary of the DAB is connected to a common DC bus, which has multiple functionalities, among them, to couple low-voltage DC lines or as a connection port for the input port of the third stage of the ST, formed from a VSC.
Figure 1 shows the modular structure of the ST converters.
A hierarchical and decoupled control structure for each stage of the ST is presented in
Figure 2. According to the planned economic dispatch at the third level, the power balance in each stage of the ST is established at the secondary level. Finally, these power requirements are translated into set points for each power converter associated with the ST so that each ST stage can work decoupled, keeping the power balance according to the grid requirements. Under this approach, the ST can work in two modes of operation concerning the direction of the power flow, from medium-voltage to low-voltage (buck mode) or vice versa (boost mode).
In the first stage of the ST, we typically find a cascaded H-bridge converter. The voltage controller of this converter sets the modulation index (). This way, power injection or absorption from the main grid can be controlled. The boost mode adjusts the MV current injection () into the mains grid according to power quality criteria. The buck mode regulates the on the DAB primary. The references of the current regulator (, ) are adjusted by the power flow control mechanism.
The second stage of the ST consists of a dual active bridge integrating a high-frequency galvanic coupling. The DAB functionality allows for bidirectional power transfer between the medium- and low-voltage DC ports limited by the maximum power and minimum power (; ) from the modulation index () of the DAB. This index is set by the power flow controller based on the required voltage level at and from the conditions set by the power reference block and the ST operating mode, which set the reference and .
The main component in the third stage of the ST is the voltage source converter (VSC). In this stage, ports are coupled on the AC and DC sides, allowing for bidirectional power flow control. In this way, the ST can work as a grid shaper or follower, depending on the connection and disconnection maneuver of the main grid at the common coupling point. On the other hand, this stage’s AC and DC ports allow for the connection of DERs on both AC and DC buses, given the bidirectional control of the ST and the requirements of the MG. According to the first and second levels, the controller sets the modulation index of the converter (). For each converter operating mode, the reference voltage and current (,) are adjusted to maintain the , where the output of the ST is at a voltage level and frequency suitable to meet the demands of the MG in grid-former mode and current source control in grid-follower mode.
The analysis approach of the simulation models of this work is based on low-frequency models of the electronic converters with the dynamics associated with the response of the controllers, both voltage and current, and the corresponding steady-state response according to the static models of the optimal power flow problem. Thus, the switching elements of each of the ST stages are averaged based on the methodology proposed in [
35]. According to the analysis presented in [
36], the equivalent low-frequency model of each stage of the ST is shown in
Table 2, as well as the transfer function of the linearized small-signal model used to tune the current and voltage controller loops (primary control), according to the active and reactive power requirements (secondary control) set from the optimum operating solution in each hourly period (1 h) with a 24 h horizon.
The control loops for each ST stage are implemented in cascade in the reference plane
dq; the faster dynamics are set for the current loop and the slower dynamics for the voltage loops. Each control loop is composed of a PI controller, and the tuning process of the
and
constants are performed from the transfer functions in
Table 2 using tuning techniques based on the system’s frequency response, ensuring phase margin and gain margin conditions per the process shown in [
37]. Under these conditions, the ST can work in either step-down or step-up mode. However, given the nature of the optimization problem addressed in this work, the first and second stages are set in buck mode, so the control loops of the first stage seek to regulate the DC medium-voltage output (
) and those of the second stage seek to regulate the DC low-voltage output (
). For its part, the third stage acts as an inverter for the bidirectional flow control of active power, both on the DC and AC sides, by controlling the amplitude and phase of the inverter current (
).
2.2. Power Electronics Interface
PVGs and BESSs are integrated into the microgrid via power electronic interfaces. Power electronic converters are responsible for integrating DERs and local demands into the system in a controlled manner. The most common AC microgrid converter is the VSC, as are DC-DC converters, either unidirectional (PVG) or bidirectional (BESS). As for the mode of operation of power electronic converters, three models can be distinguished: grid-forming, grid-following, and grid-supporting. According to this work’s approach, the converters on the AC side operate in grid-following mode [
38]. In contrast, on the DC side, the second stage of the ST operates as a grid-former since it regulates the DC voltage level, and the other converters operate in grid-following mode.
Table 3 presents the basic structures of the PEIs used in the MHM. For the connection of the BESSs on the AC side, a VSC is used, whose dynamics and control are like those presented by the third stage of the ST, where the objective is to control the charging or discharging current of the BESS (
). This same VSC structure is used to couple the PVGs on the AC side; however, in addition to the PI controller in the dq frame, a DC voltage regulator must be added from a feed-forward compensator [
39] coupled to a maximum power point tracking (MPPT) algorithm. As for the DC side, the bidirectional DC-DC converter, whose control objective is to regulate the coil current (
), is used to couple the BESS in the DC microgrid, and, for the PVG, a DC-DC boost configuration with an MPPT algorithm is used, whose objective is to control the current injected into the DC microgrid according to the DER availability (
). All power converter structures are proposed from equivalent models averaged for subsequent implementation according to the simulation model.
2.3. Power Flow Modeling
In this paper, the ST, the VSC, and the BESS are optimized for active and reactive power dispatch control, increasing efficiency and reducing the operational costs of the HMG. To address the optimal power flow problem, equivalent models relating to the power flow between the terminals of the ST, VSC, and DC-DC converters are considered.
2.3.1. Voltage-Sourced Converter Power Flow Model
The VSC allows for the control of the active and reactive power independently for both the PVG and the BESS on the AC side, depending on the expected availability of the resource in the PVG and the state of charge (SoC) of the BESS during a day of operation.
Three approaches to modeling VSCs are presented in
Figure 3. The commutated model is ideal for converter and control loop performance analysis based on the dynamic response of the variables of interest in the converter with reasonable accuracy. The averaged model is a model that represents the dominant converter dynamics (low-frequency component) suitable for analysis under a simulation approach with a daily operation horizon, and the power flow model is used to pose and solve the optimization problem, whose optimal solution sets the operating point of each converter in the system.
The approach of the power flow equations as a function of the variables on the AC side—the voltage and phase at the bus
(
,
)—and on the DC side—to the voltage on the bus
(
)—is realized from power balance Equation (1) according to active power on the AC side (
) and active power on the DC side (
) together, the losses (
) associated with the switching of the VSC IGBTs [
40] as a quadratic function of the inverter current (
) (2), and the loss Equation (3), where the coefficients
,
, and
depend on the power and inverter characteristics.
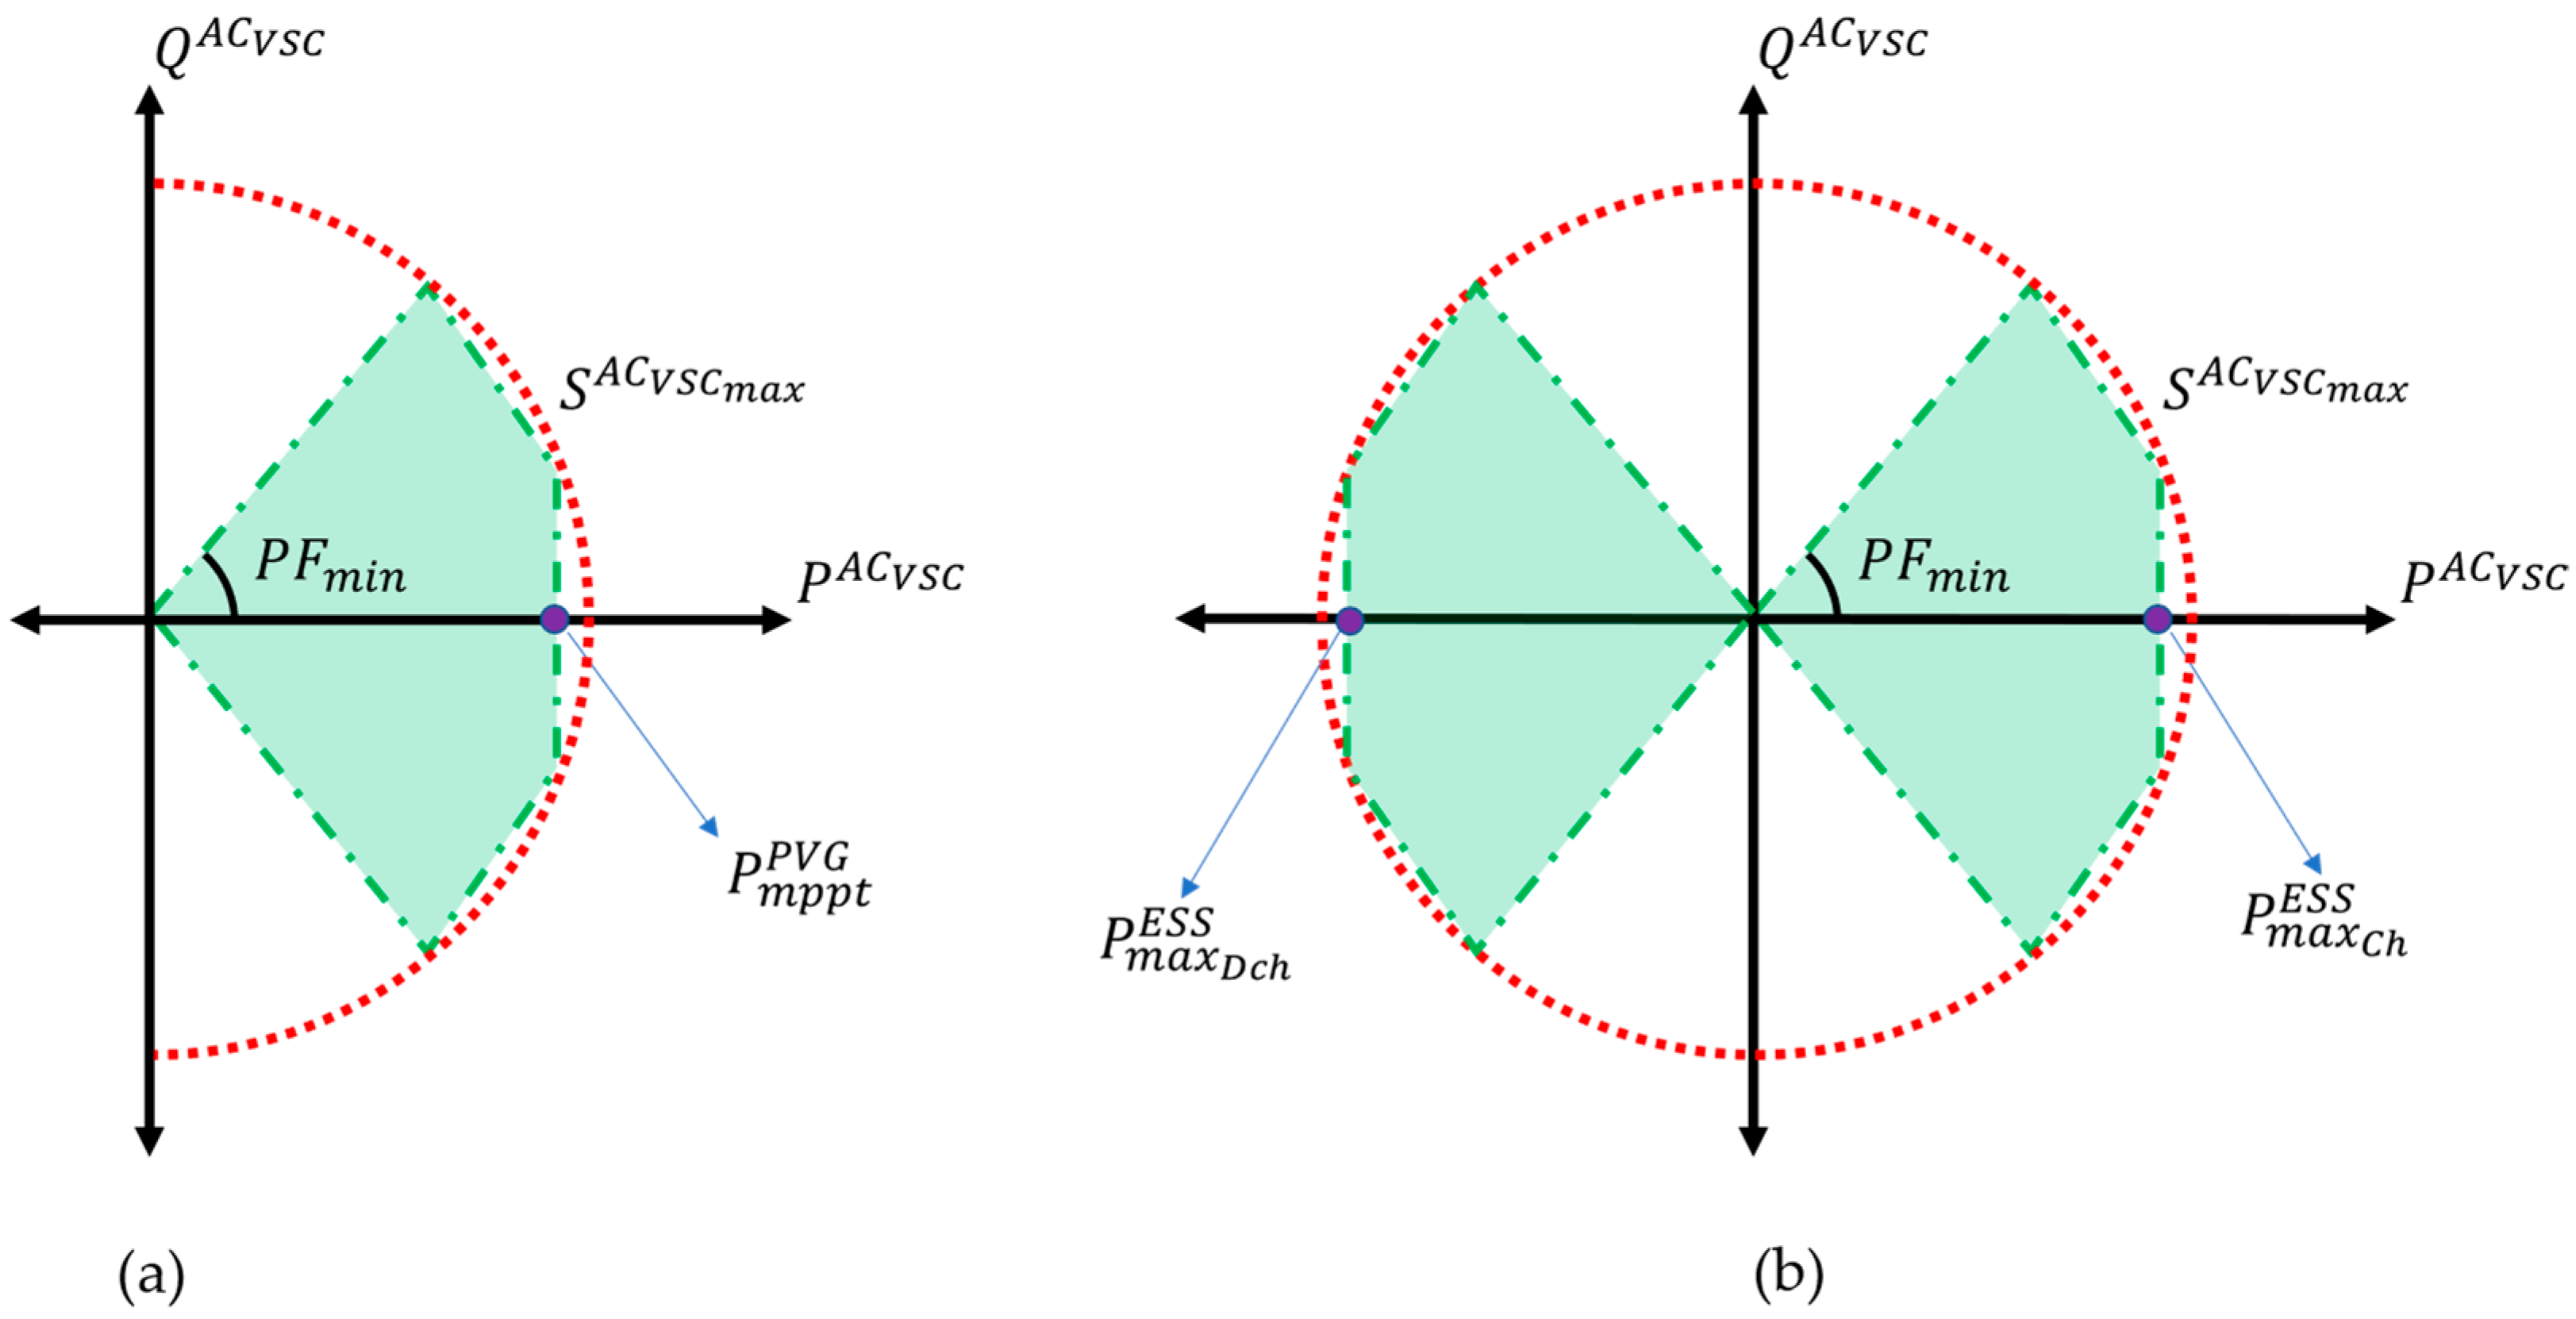
The apparent power rating (
) limits the dispatch of active and reactive power in the VSC of the inverter on the AC side. The operating space of the inverter can be seen in a PQ plane representing the semicircle around the positive active power axis. The behavior of this semicircle is defined according to the operation of the VSC [
41].
Figure 4 shows the VSC operating region for the PVG (a) and BESS (b) in the PQ plane. In this region, a minimum power factor (
), which sets the operating limit of the VSC, is considered. Thus, the reactive power (
) available for dispatch is restricted to the amount of active power (
) available in the PVG based on a maximum power point tracking (MPPT) algorithm, whereas, for the BESS, an operation in the four quadrants of the PQ plane is observed since the BESS operates in charge (
) or discharge (
) mode limited by the maximum active power in the VSC and physical characteristics of the BESS.
In both modes of operation, the BESS VSC can control the reactive power injection
. So, the operational restrictions of the reactive power injection at all times
, limited by
defined by the inverter characteristics, are described as follows in (4) and (5). The OPF algorithm adjusts the control variable
and
at each time instant according to the following operational constraints.
2.3.2. ST Equivalent Power Flow Model
Given the proposed structure in
Table 2 and
Figure 1 and
Figure 2, a hierarchical and decoupled control structure is identified. This structure allows for the integration of independent and bidirectional power flow control mechanisms, enabling additional freedom for power flow control on both the AC and DC sides.
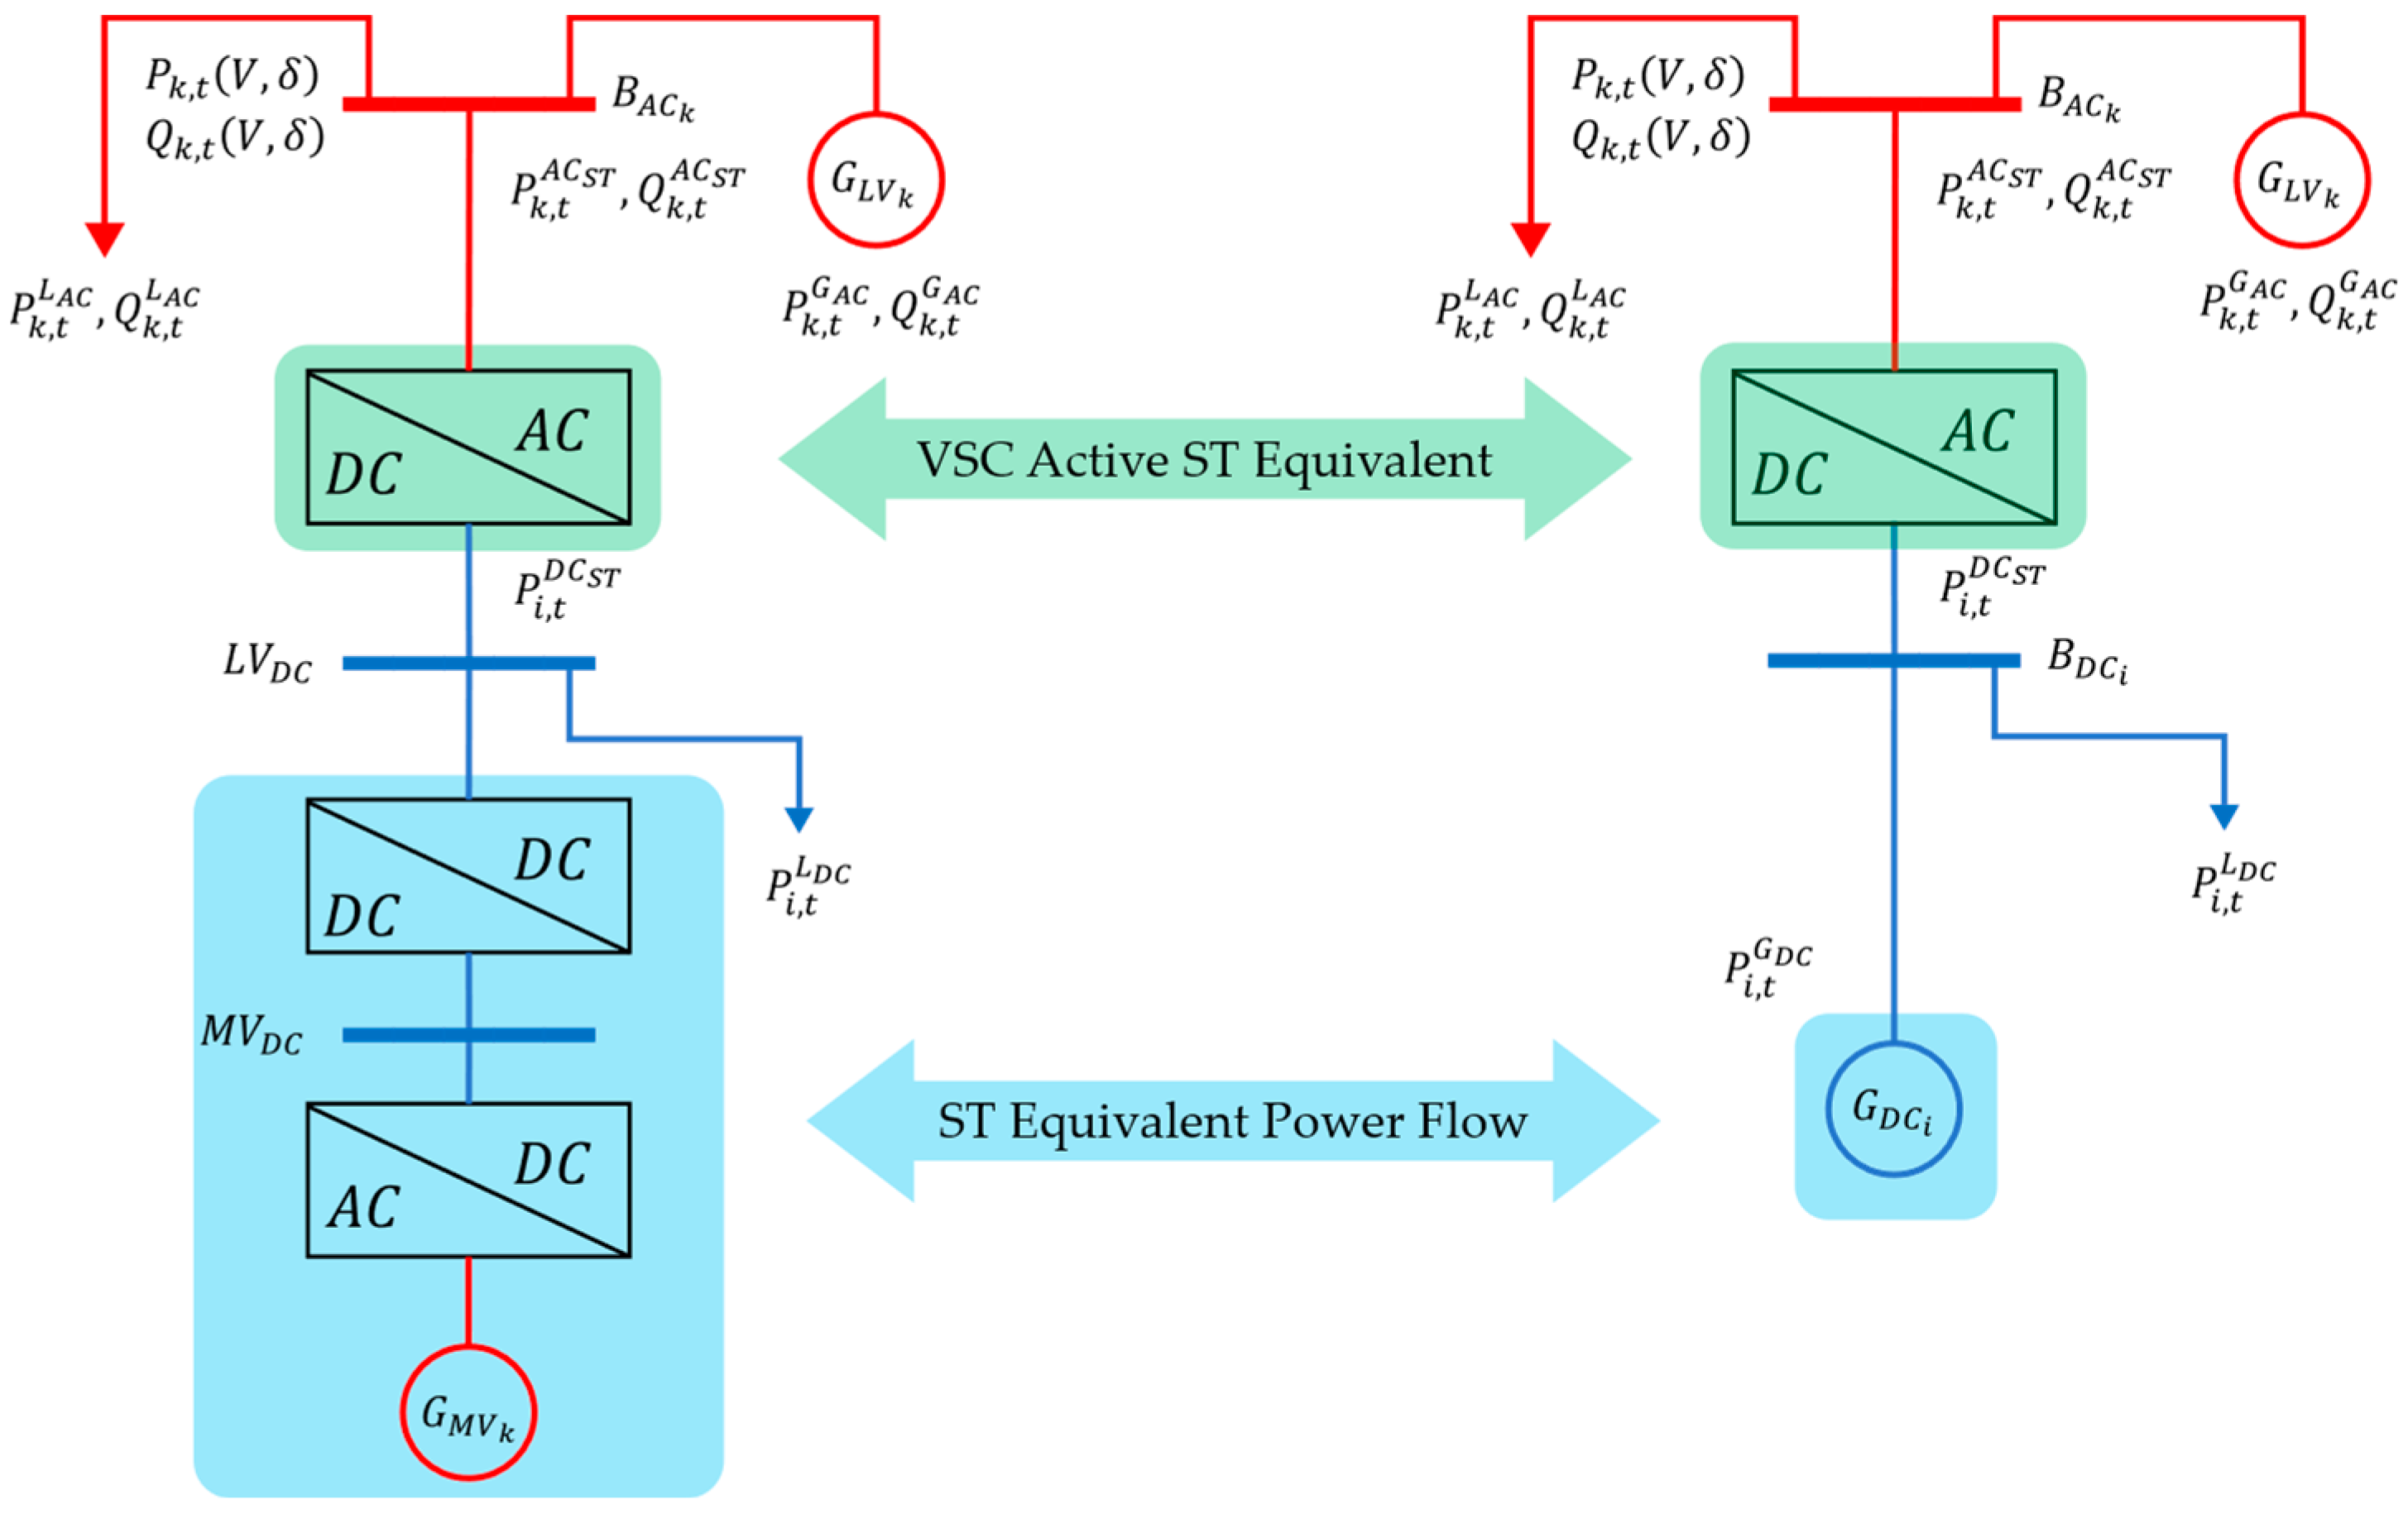
Based on
Figure 5, an equivalent active VSC of the ST is presented to pose the power flow equations at the low-voltage ports on both AC and DC sides. Thus, the first (cascade H-bridge) and second (DAB) stages of the ST are modeled as an equivalent controlled DC feeder (
) considering the generator-coupling bus as a slack node that regulates the voltage on the DC side of the MHM, with an available power (
). For its part, the third stage (VSC) of the ST allows for controlling the injection of active power (
) and reactive power (
on the AC side or active power (
) on the DC side. The power balance equations are described by (6), (7) for the AC side, and (8) for the DC side. The active power balance in the VSC is defined in the same way as in (1) to (3) and that of the reactive power is defined as proposed in (4) and (5).
2.3.3. DC-DC Converters Equivalent Power Flow Model
The model representing the power supplied by the PVG on the DC side during each period is presented in (9).
where
corresponds to the maximum power that the PVG can inject in period
,
is the productivity coefficient associated with the solar panel and the efficiency of the converter, and
corresponds to the irradiance measured in
perpendicular to the surface of the solar panel in each period
.
The BESS power flow model shapes the constraints associated with the energy storage elements on both the AC and DC sides. The power flow equations for all time to the BESS, from (10) to (14), are based on the model proposed in [
42].
where, for the
BESS,
represents a binary variable indicating BESS charging,
represents a binary variable indicating BESS discharging,
and
represent the charging and discharging power, respectively, and
and
represent the charging and discharging efficiency of the BESS and DC-DC converters. Finally, the battery state of charge is represented by
. The model of the
battery on the AC side is similar to those presented in Equations (10)–(14), with the corresponding changes to the indexes, superscripts, and VSC’s dynamic. The reactive power dispatch of the BESS on the AC side is given by (5).
2.4. Optimal Power Flow Modeling
Power flow constraints are established on the MHM’s AC and DC sides. On the AC side, the equations are formulated in polar form from the network admittance matrix based on the pi model of the line. On the DC side, the equations are developed from the conductance matrix and the voltage at the DC buses. The array
represents the series admittance of the line while
represents its susceptance on the AC side. On the DC side, the conductance is represented by
. The active power
and reactive power
flowing through the line on the AC side, in per unit (p.u.), is calculated from (15) and (16).
where
. The active and reactive power balance is presented according to (17) and (18).
where
are the nodes directly connected to node
. The active power
flowing through the line on the DC side, in per unit (p.u.), is calculated from (19). The active power balance at a node
is given by (20), where
are the nodes directly connected to node
.
The optimization problem aims to minimize the expected operational cost, loss, and voltage regulation over various time horizons (24 h) while satisfying various physical constraints of the MHM. Specifically, the objective function (
), for all time
, should include (i) the operation cost (
); (ii) network losses (
); and (iii) voltage deviation (
), due in (21).
,
, and
are the weight factors of network losses (
), voltage deviation (
), and operation cost (
), and
.
where
,
,
, and
correspond to the costs of energy exchange with the main medium-voltage grid and the operating costs of the BESS, both on the AC and DC sides, respectively. On the other hand,
,
,
,
,
,
,
, and
relate to the generator set, BESS set, PVG set, and loads set on both AC and DC sides, respectively.
2.5. Digital Real-Time Simulation Testing
The MIL and SRTS approach is used to test the PEI controllers’ performance and the MHM power balance based on the solution of the OPF problem. The platform for the DRTS application is the FPGA-based real-time hardware simulator RCP/HIL from the manufacturer OPAL-RT® Technology, which provides a reliable real-time digital simulation tool focused on power system network modeling and associated controls prototyping and system evaluation, either with averaged or switched models.
Before starting tests with the MHM through DRTS, an MIL simulation approach was used, in which the behavior and performance of the individual equivalent models in
Table 2 and
Table 3 were tested, as well as the control loops and dominant dynamics associated with each PEI and DER. These equivalent models were programmed into the Simulink
® interface of Matlab
® 9.12 using the Simscape
® toolbox (MathWorks, Natick, MA, USA). The data collected during the MIL simulation served as a reference during the DRTS phase since this phase integrates the individual models with the control loops to form the MHM and the benchmarks set by the OPF algorithm.
Under a DRTS approach, the RT simulator must reproduce the internal variables of the models and generate computational results accurately in the same time frame as the real physical system would. Thus, RT simulations run all operations during a fixed sampling period to avoid overloads and overlapping of operations in successive sampling periods. The models proposed in this work have been implemented in the OP4510 simulator (OPAL-RT®, Montréal, QC, Canada) with a field-programmable gate array (FPGA) based on Xilinx® Kintex® 7 (AMD, Wixom, MI, USA). To enforce the models in the RT simulator, they must pass an MIL process in Simulink® and then be compiled and optimized in the RT-Lab® 2023.1 and executed on the OP4510 platform (OPAL-RT®, Montréal, QC, Canada). The visualization of the model signals develops on the host (personal computer) with the general-purpose operating system. On the other hand, high-performance codes representing the model under analysis are executed on the target node (RT simulator). Synchronization between the host and the RT simulator is performed via a UDP/IP communication link.
A conceptual model of the MHM model workflow under a DRTS approach is presented in
Figure 6. The feasible solution to the optimization problem for the daily scheduling of the MHM is transferred from the third level of the hierarchical control structure to the second level from a CSV file. In this file, the feasible operating points of each converter associated with the MHM are set at intervals of 1 h. From the second level, the operating modes of each converter and the set points for the voltage and current controllers at the first level of control are determined. Thus, it is necessary to scale the sampling periods at each control level. Hence, the first level updates the feasible solution every 1 s (1 s of simulation is equivalent to 1 h), and the second level takes the same time to update the references. For its part, the primary level works at the same sampling frequency set in the RT simulator, 100 μs, according to the dominant dynamics of each converter. The signals of the MHM variables are displayed on the host and stored with the DataLogger tool in the RT-Lab
® 2023.1 environment.
3. Simulation Results and Discussion
This section presents results and discussions on the proposed computational model to evaluate its performance from an ST-based MHM simulation scheme under a DRTS approach on the OPAL-RT® platform.
The multiobjective optimal power flow problem posed in (1) through (21) was programmed in Python 3.9.5. The Spyder 5.4.2 integrated development environment under the Pyomo 6.5.0 framework was used. The feasible solution at each period was determined from the
Ipopt solver, given the nonlinearities in the power flow equations of the system. The set of feasible solutions generated by the optimization algorithm was imported from the DRTS simulation model from a flat file. In this file, an optimal operating point of each DER’s PEI, each ST stage, and each feeder is related to the demand profiles and PVG profiles in each hour of operation for a 24 h horizon.
Figure 7 shows the load and PVG profiles in p.u. (50 kW base) that were used to formulate and solve the proposed OPF. The profiles were imported into the simulation model in Simulink
® under the DRTS approach.
The benchmark reported in [
43] is taken as a reference, in which the parameters of the three-phase lines, balancing nominal demand and bus connections of the low-voltage DS with a radial structure, are related. An equivalent schematic of a modified MHM line is shown in
Figure 8. It comprises four DC buses (blue line), six AC buses (red line), an ST, and a VSC. The ST allows for the coupling of a second AC medium-voltage feeder on the first stage of the ST. The MHM consists mainly of loads, a BESS, PVG, and feeders on the AC and DC sides. The power electronic interface (PEI) of each DER, implemented in the simulation model, is a low-frequency equivalent model whose dominant dynamics are associated with the energy storage elements’ power transfer and time constant, according to the models in
Table 3.
Two approaches are used to analyze the system performance. The first approach is oriented to the analysis of the response of the PEI and ST stages according to the primary and secondary control levels to reference changes in the active and reactive power levels reflected in the instantaneous response of voltage and current. On the other hand, the second approach seeks to determine the system performance according to the tertiary level of control based on the optimal response of the OPF decision variables. These variables are associated with the power flow to the active () and reactive () power of the ST, Equations (6) and (7), as well as to the equivalent power of the DC generator at the ST output () in (8). Similarly, other variables associated with the active and reactive power generation profiles (; ) of the AC feeder connected to the C0 bus on the AC side are taken as reference.
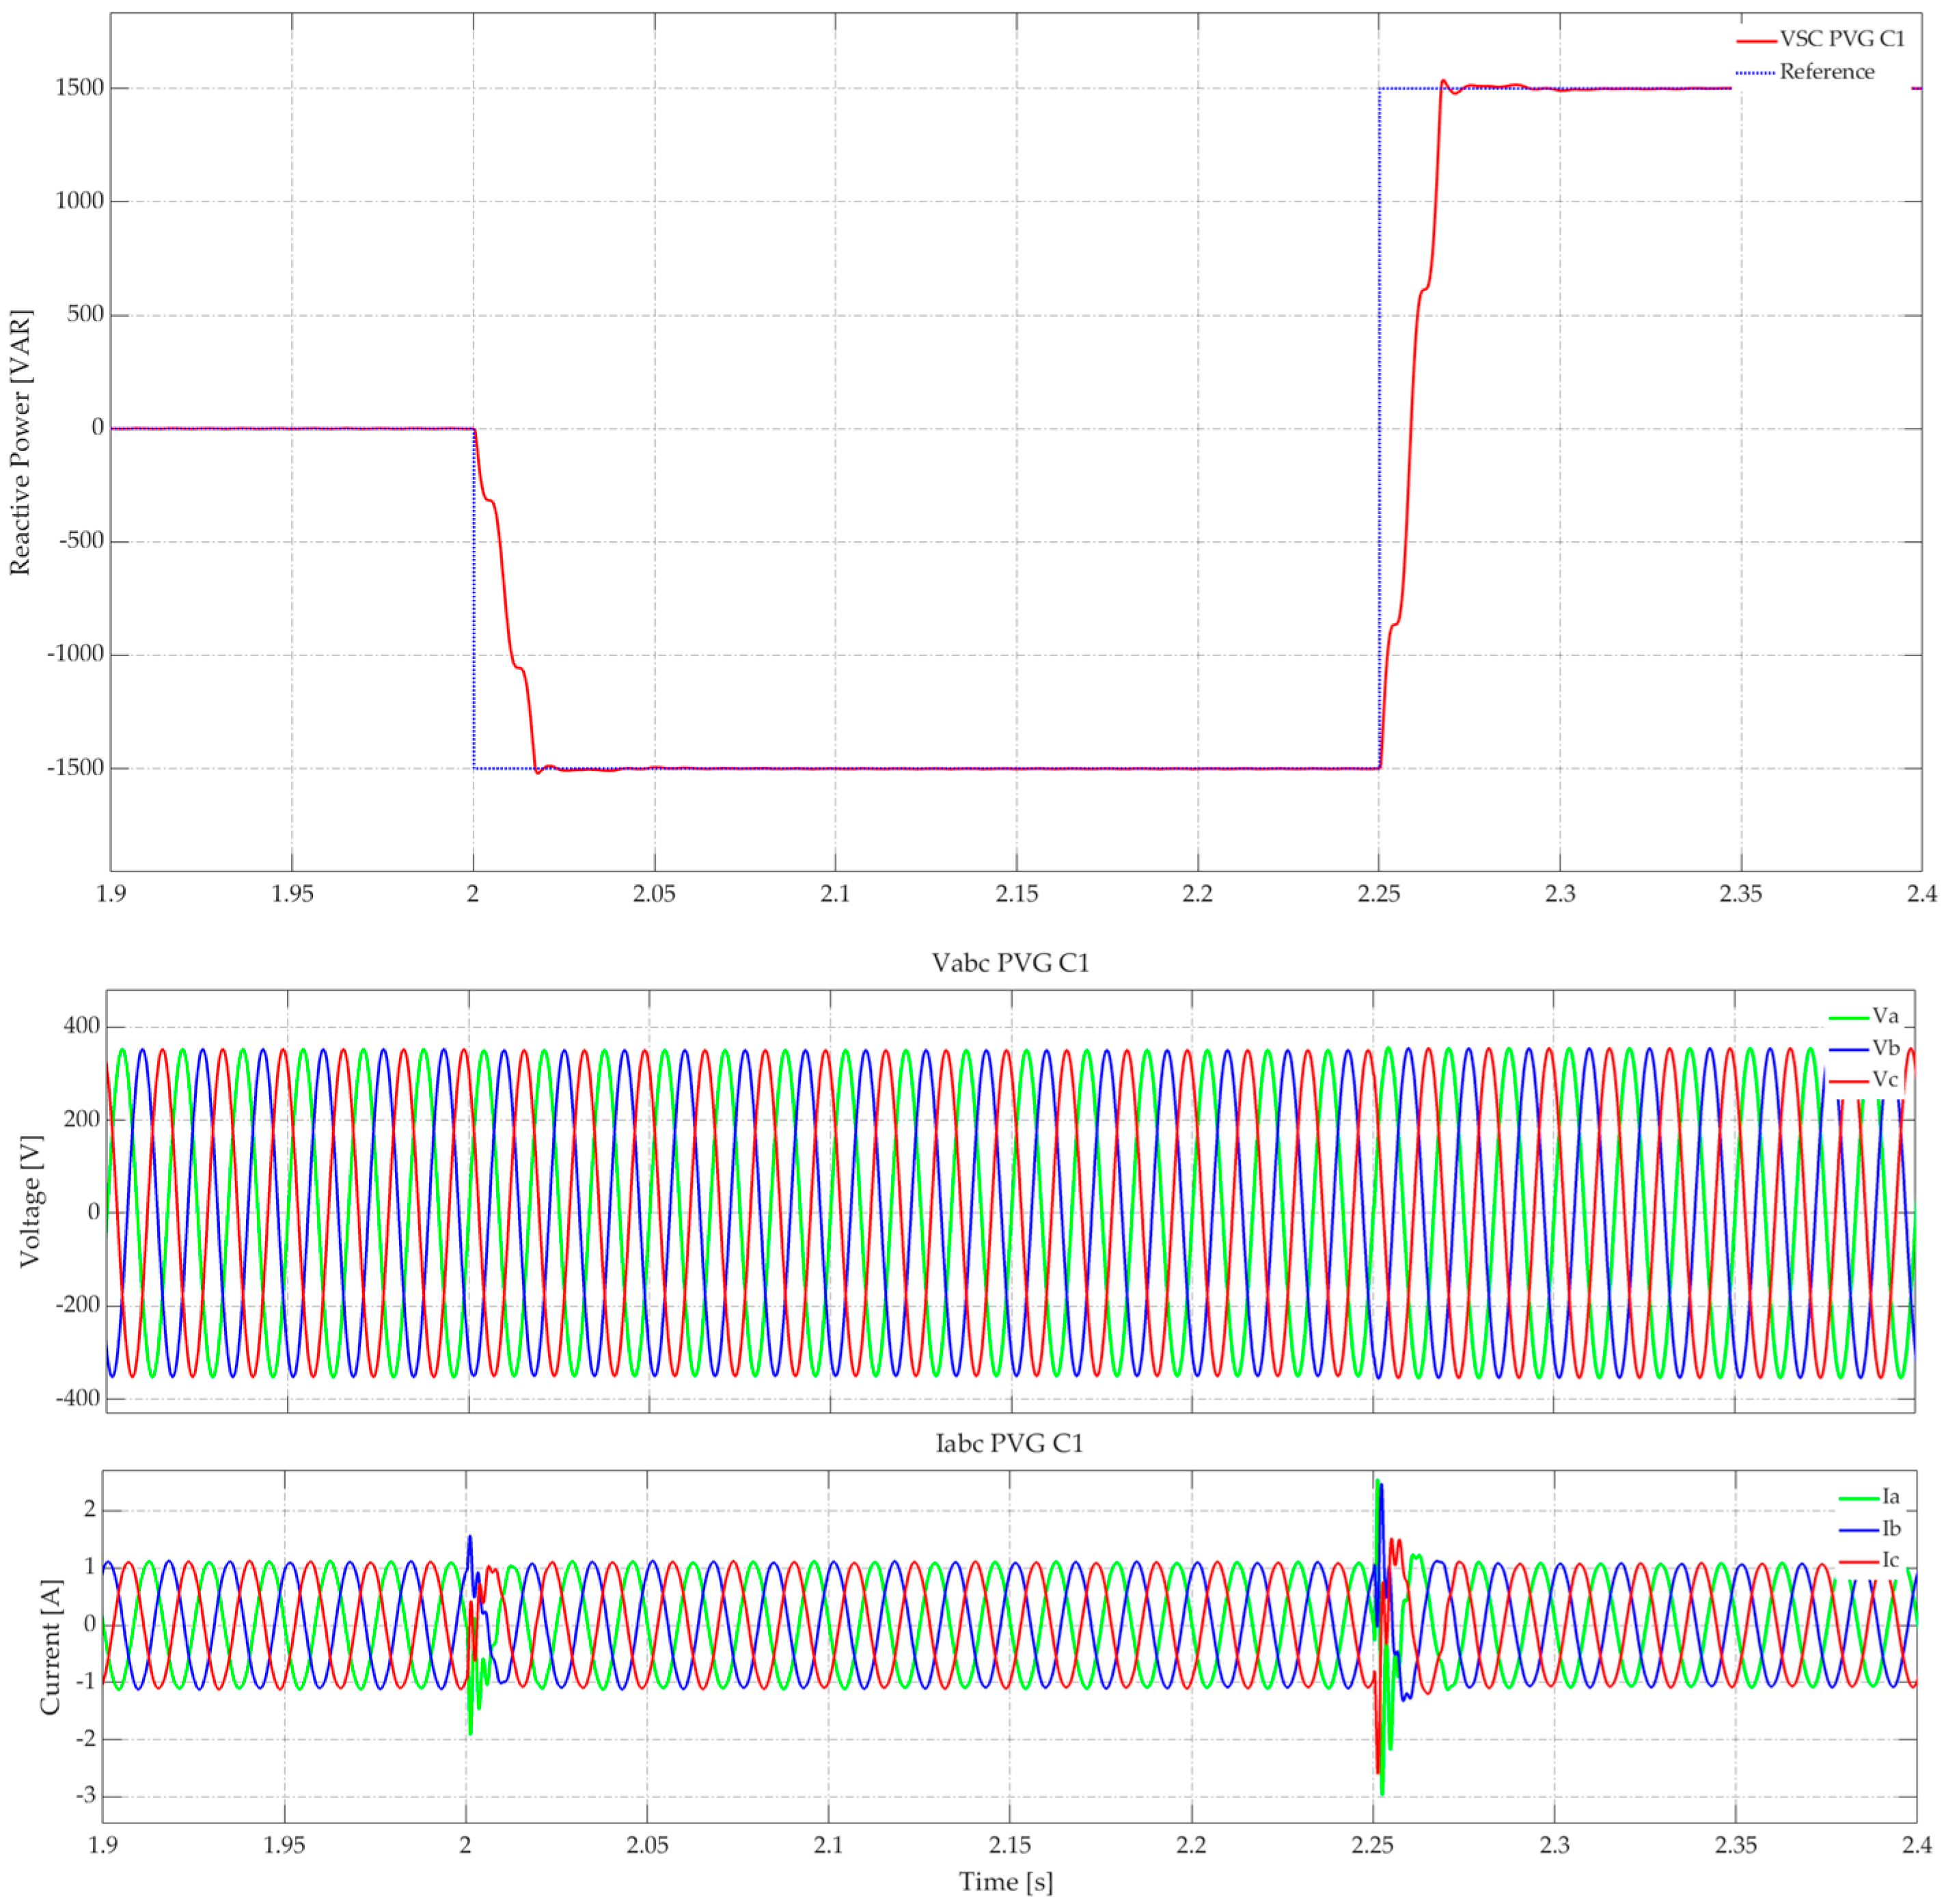
Figure 9 shows the response of the VSC’s voltage and current control loop connected to the PVGs on the AC side of the MHM. This converter only allows for reactive power control since the active power depends on the irradiance, according to (9). The VSC is subjected to changes in the level of reactive power injected into the grid.
Figure 9 shows the phase shift of the current according to the variation in the power factor given by the reference change between −1.5 kVAR and 1.5 kVAR. This variation in the power factor is reflected by the phase shift of the current between 2 s and 2.25 s of simulation. The response of the power control loop has a settling time close to 10 ms. This time is a reference for scaling the simulation period, and reference changes for a 24 h horizon in 24 s.
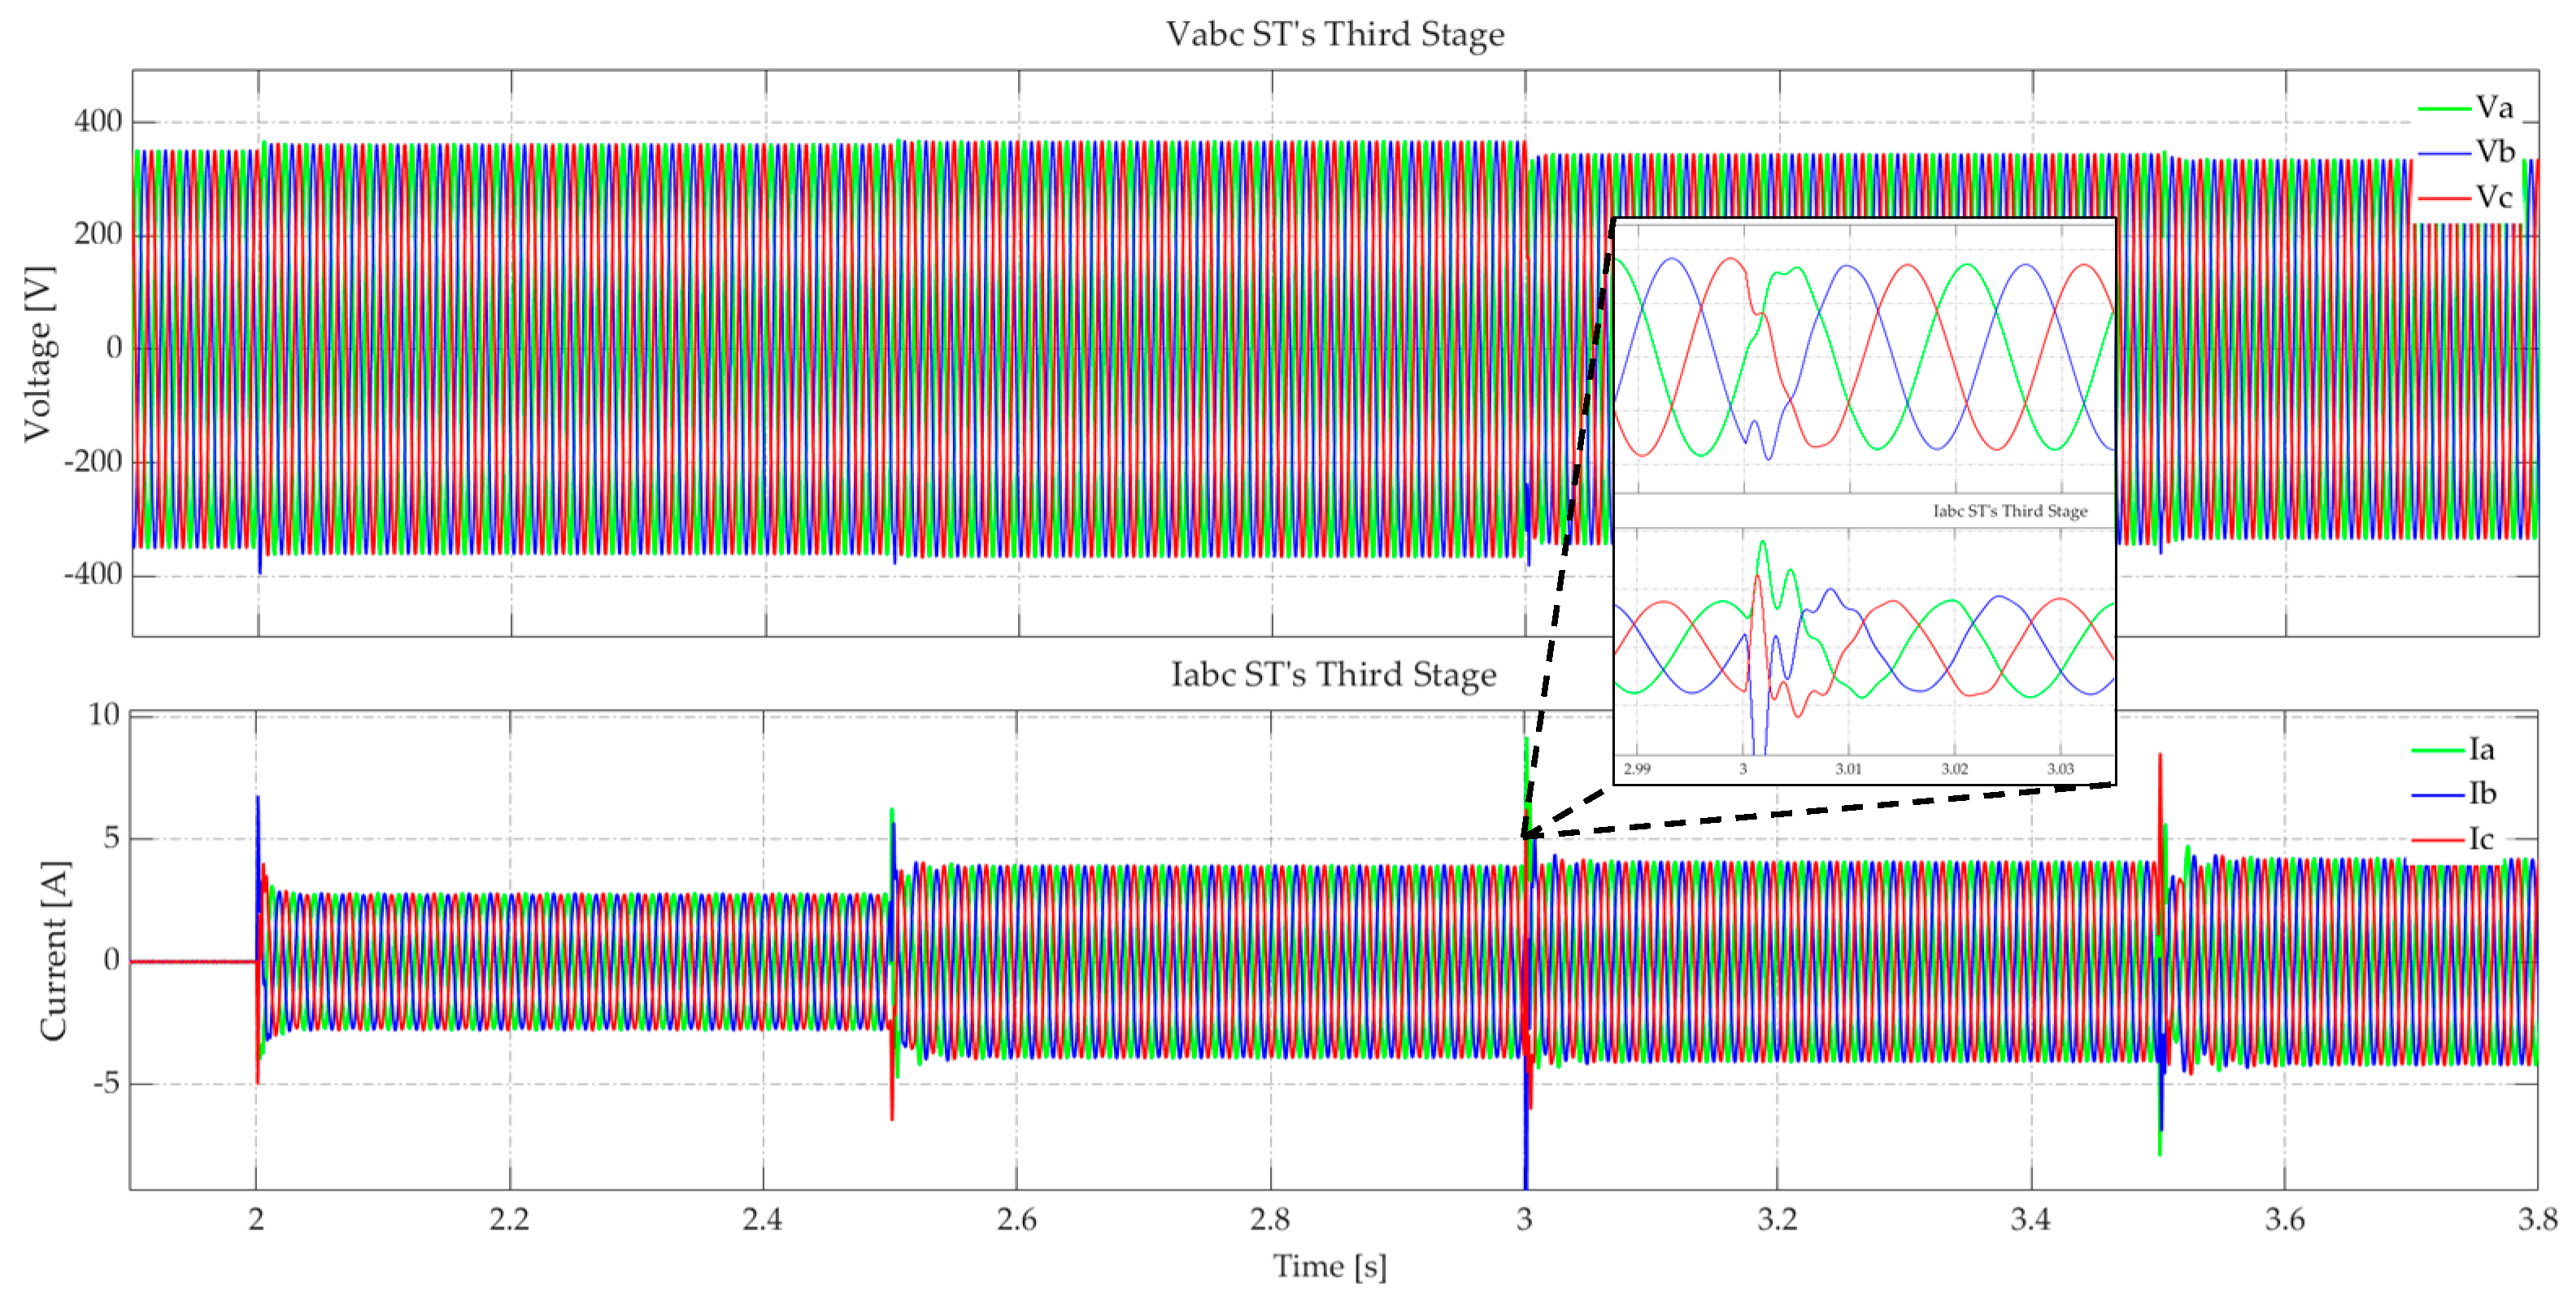
The VSC connected in the third stage of the ST has a particular feature: the DC port is regulated by a DAB (second stage of the ST). In addition, this converter allows for the independent control of active and reactive power according to the operating point set by the EMS. In this way, the response of the control loops at the second and first levels is validated. Changes are made in the active and reactive power reference points, −2.5 kW to 2.5 kW and −1.25 kVAR to 1.25 kVAR, respectively. With these changes in active and reactive power injection, the transient response of the power controller is shown in
Figure 10. The effect of active and reactive power on the voltage and current at the bus connection is also observed. The reactive power directly affects the voltage amplitude and current phase. In contrast, the active power has a more significant effect on the current amplitude, thus allowing for bidirectional power flow control and, at the same time, voltage regulation according to the optimization objective, voltage deviation reduction. The combination of the reference changes allows us to validate the performance of the third stage of the ST in the four quadrants of the
plane, like the one presented in
Figure 4b.
The low-voltage DAB output is a reference point since this port of the ST serves as a coupling point for the DC side of the MHM. This output supplies active power to both the VSC input of the third stage of the ST and the DC bus of the MHM and, at the same time, serves as a slack node on the DC side since the DAB control loops regulate the voltage on the DC bus. Thus, the DAB output is posed as a DC feeder in the power flow equations for the OPF problem.
Figure 11 shows the response of the power supplied to the DAB output of the ST
under a DRTS approach. A slight shift is observed between both curves since the optimal solution is derived from models that only consider static conditions in the load and DER’s PEI. On the other hand, the low-frequency equivalent model of the converters shows proper transient operational responses of the system state variables and the nonlinear conditions of the power transfer elements, which are typical conditions of power electronic converters.
Finally, according to the equations and power balance, the third stage of the ST functions as a rectifier that, together with the equivalent DC generator at the output of the DAB, injects active power into the MHM on the DC side to supply the load needs and optimize the utilization of the BESS according to SoC.
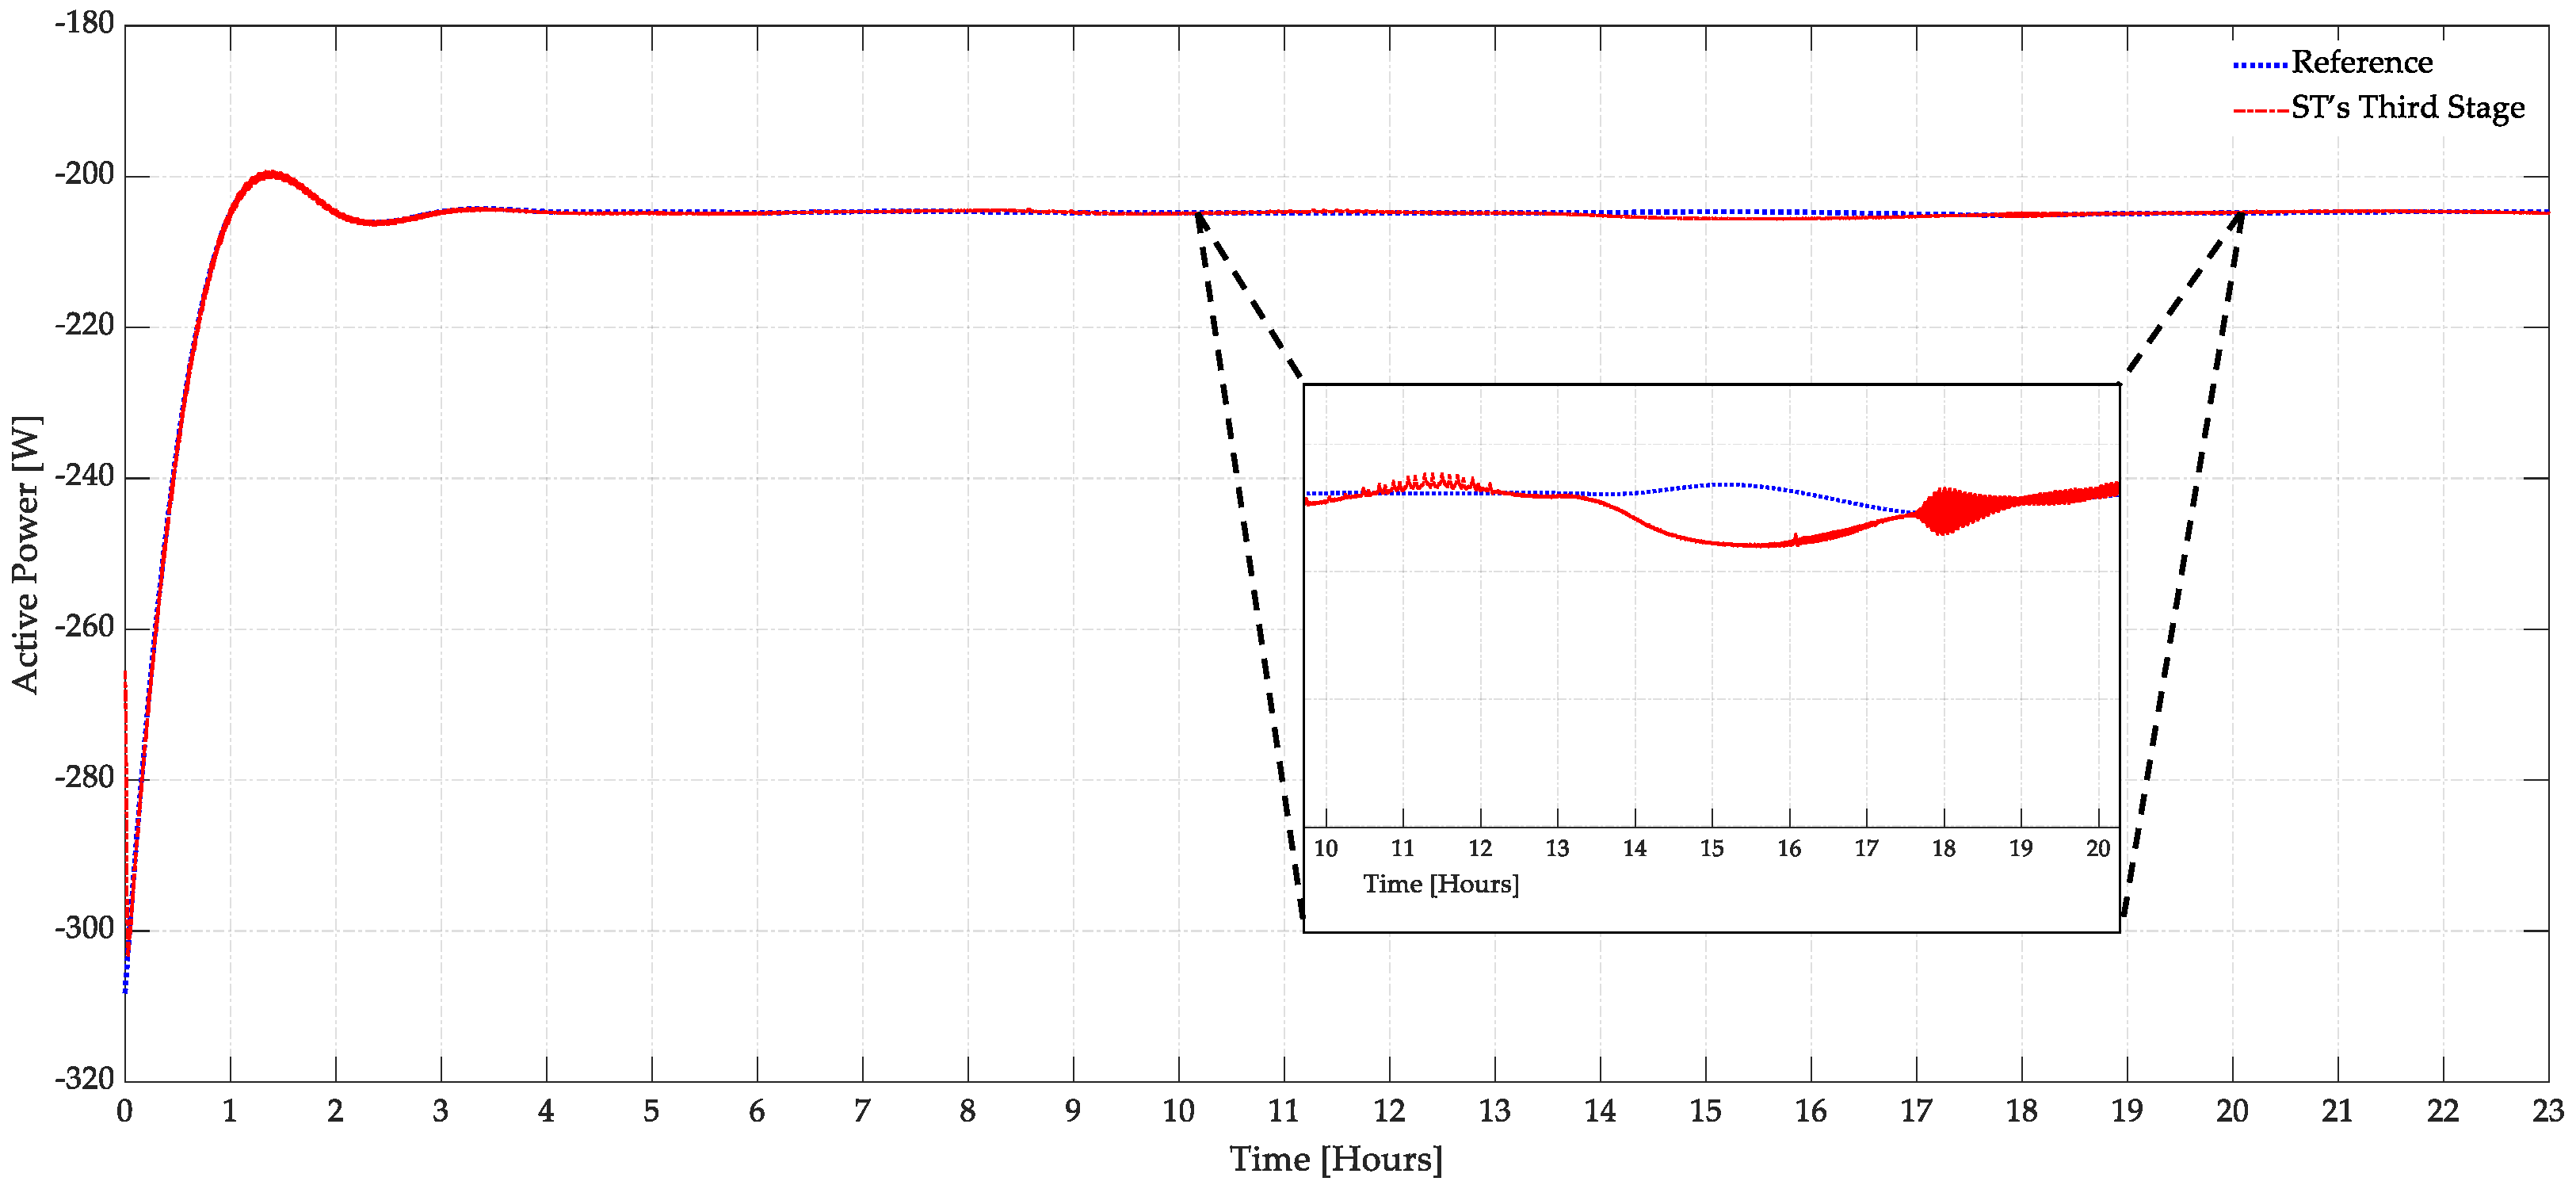
Figure 12 and
Figure 13 present the active and reactive power response, respectively, at the low-voltage output of the ST. The red colored curves represent the feasible operating points of the ST, set as a reference for the VSC control loops of the third stage of the ST. Regarding the active power, it is observed that the system response presents a tracking close to the reference, presenting a deviation between 14:30 h and 19:00 h, given that the peak demand occurs at this point, according to
Figure 7. This scenario produces a change in the operating point of the PEI and, consequently, affects the performance of the ST control loops.
On the other hand, the reactive power response shows a tracking close to that expected based on the reference curves generated by the solver of the OPF problem. In the time interval, the peak demand occurs between 16:00 and 20:00 h, and the reactive power injection is increased to compensate for the demand and regulate the voltage. This feature shows that an ST is a versatile device for routing power from the AC or DC sides to compensate for the grid requirements for optimal operation.
Figure 14 and
Figure 15 show the response of both the active and reactive power of the AC power supply coupled to bus 0 on the AC side. The active and reactive power response shows a slight deviation concerning the expected value at each time instant based on the optimal solution and power balance according to the OPF model. Given the dynamics not contemplated in formulating and solving the OPF problem, this feature is expected. These variables are representative of the validation of the equivalent models’ accuracy and the solver’s feasible solution. These variables allow for determining the overall power balance of the system from the AC side. Since the general power balance presents a high coincidence with the reference values, it indicates that the balance of each element of the MHM is adequate.
Table 4 presents metrics to compare the reference data array with the data obtained from the real-time model, such as root-mean-square error (RMSE), mean absolute percentage error (MAPE), and Pearson’s linear correlation coefficient (Rho).
The error and correlation metrics in
Table 4 demonstrate the degree of accuracy of the results of the validation process and performance analysis of the DRTS model. Regarding the error, variables with a high error compared to others are identified, mainly due to the transient component of the system response. In contrast, when observing the Pearson coefficient, the analyzed variables present a high linear correlation regarding signal shape and trend. Thus, it is identified that, even though the signals have an offset, given the dynamics not modeled in the system, the computational model of the OPF, the low-frequency equivalent models, and the approximation of the ST as an active VSC are adequate and accurate approximations for the analysis of these types of systems.
4. Conclusions
A simulation model with an MIL and SIL approach is proposed that seeks to validate the equivalent power flow model of the ST as an active VSC coupled to a DC generator. An OPF model is presented from each DER’s ST and PEI power flow models. These results establish the reference points in each MG converter control loop to set the operating point for optimal MG operation according to the optimization algorithm.
The decoupled structure of the TS, under a hierarchical control scheme, allowed the approach of power flow equations to formulate and solve an optimization problem in the upper control and management layer of the MHM for daily operational planning. In this way, it was possible to validate the performance of an equivalent low-frequency model for both the ST with decoupled control loops and the PEIs MHM from the results of the DRTS tests. Finally, it was possible to apply a methodology for implementing accelerated DRTS models of the MHM based on an ST to analyze the system response according to the hierarchical control layer structure under a daily operational planning approach.
As future work, the system needs to validate the performance of the system under an HILS approach, which integrates specialized ST hardware and enables integration with an energy management algorithm, thus allowing for the validation control loops and, at the same time, validating the overall performance of the system with a daily planning horizon. On the other hand, to improve the transient response of the control loops of the ST stages, it is required to implement strategies that integrate feedforward compensation loops.


 ,
, 


