1. Introduction
Structural Health Monitoring (SHM) as a technology offers the promise of reduced maintenance costs and increased operation safety for a wide range of engineering structures, including mechanical, aerospace and civil application. In general, SHM combines sensors, signal processing, feature extraction techniques, and modelling strategies in order to perform the automated diagnosis of structural components. This includes, on one hand, load monitoring, that identifies extreme load scenarios like those related to impacts, and on the other hand, damage identification, e.g., due to fatigue ageing or corrosion [
1,
2,
3,
4,
5], that comprises anomaly detection, damage type evaluation, localization, quantification, and the final prognosis of its future evolution.
Focusing on impact monitoring, two complementary approaches are mainly adopted in literature for impact detection and, subsequently, for the estimation of potential impact damage. The first method, namely passive monitoring [
2,
3,
4,
5], often referred to as impact force reconstruction [
6], identifies an impact by analyzing the time-series strain data generated by the impact itself, which provide information about impact occurrence, location, and force. The second approach, namely active monitoring [
1], can be performed by generating travelling waves, typically by means of piezoelectric transducers, which propagate inside a specimen at ultrasonic speed and are then detected by a distributed sensor network. Several features can be identified in the acquired signals, which can be directly related to specific structural impact damages that occurred along the wave path. If bounded media with relatively small thickness are concerned, like in most of the cases reported in literature [
3] and in the present work, this method is often referred to as Lamb wave monitoring [
7,
8,
9].
Both passive and active monitoring strategies involve the acquisition of dynamic signals generated either by the occurrence of an impact or by an active transducer, thus requiring the sensor network to be associated with high frequency acquisition systems. This has been done so far by means of strain gauges and accelerometers [
10], typically exploiting a network of piezoelectric transducers connected to high sampling rate oscilloscopes (MS/s) [
11]. More recently, optical fiber sensors (OFSs) have been also proposed for impact monitoring [
12,
13], impact force reconstruction [
6], and Lamb wave monitoring [
14] due to their greater sensitivity and reliability, reduced size and weight, cost-effectiveness, and immunity to electromagnetic interference, which make them attractive especially for those applications where safety represents a critical issue. However, most of the works reported in literature have been performed by means of Fiber Bragg Gratings (FBGs) [
3,
12], which ensure good reliability and high signal-to-noise ratios. Nevertheless, their acquisition systems become all the more demanding as the frequencies of the monitored phenomena increase. Monitoring of mechanical wave propagation inside composite materials has been also recently proved by exploiting dynamic strain Brillouin sensors [
15,
16], which can provide appealing strain distributed information along the entire sensing fiber, yet requiring a complex and expensive interrogation HW. In this framework, optical fiber interferometers represent a valid alternative for acoustic and ultra-acoustic sensing due to their extensively proved, highly-sensitive monitoring capabilities with bandwidth up to MHz [
12], resulting in an interesting compromise every time a specific punctual SHM applications requires HW simplicity and reduced costs.
The interferometric approach is adopted in this study to acquire dynamic signals for active and passive impact monitoring in metallic structures. In particular, it exploits a novel sensing solution based on standard optical fibers associated to an innovative phase-diversity coherent detection scheme, which retrieves in a completely passive way the high-frequency phase information carried by the optical signal. The sensing fiber can be configured in different layouts in order to meet the requirements of the specific monitoring application, finding the proper tradeoff between the required sensitivity and need for a local measure. As an example, as suggested by several works related to ultrasonic wave detection with FBG [
17,
18,
19], an accurate detection of high frequency signals reasonably requires a relatively short gauge length, which, in turn, can limit the sensitivity of the sensor itself. In this work, the sensing fiber is arranged into multiple loops glued only for a short length to the structure in order to increase the interferometric sensitivity while still guaranteeing a localized measurement, as required for the acquisition of very high frequency dynamics. A first experimental proof of this solution, which combines sensing fiber coils with an interferometric approach has been recently demonstrated in [
20,
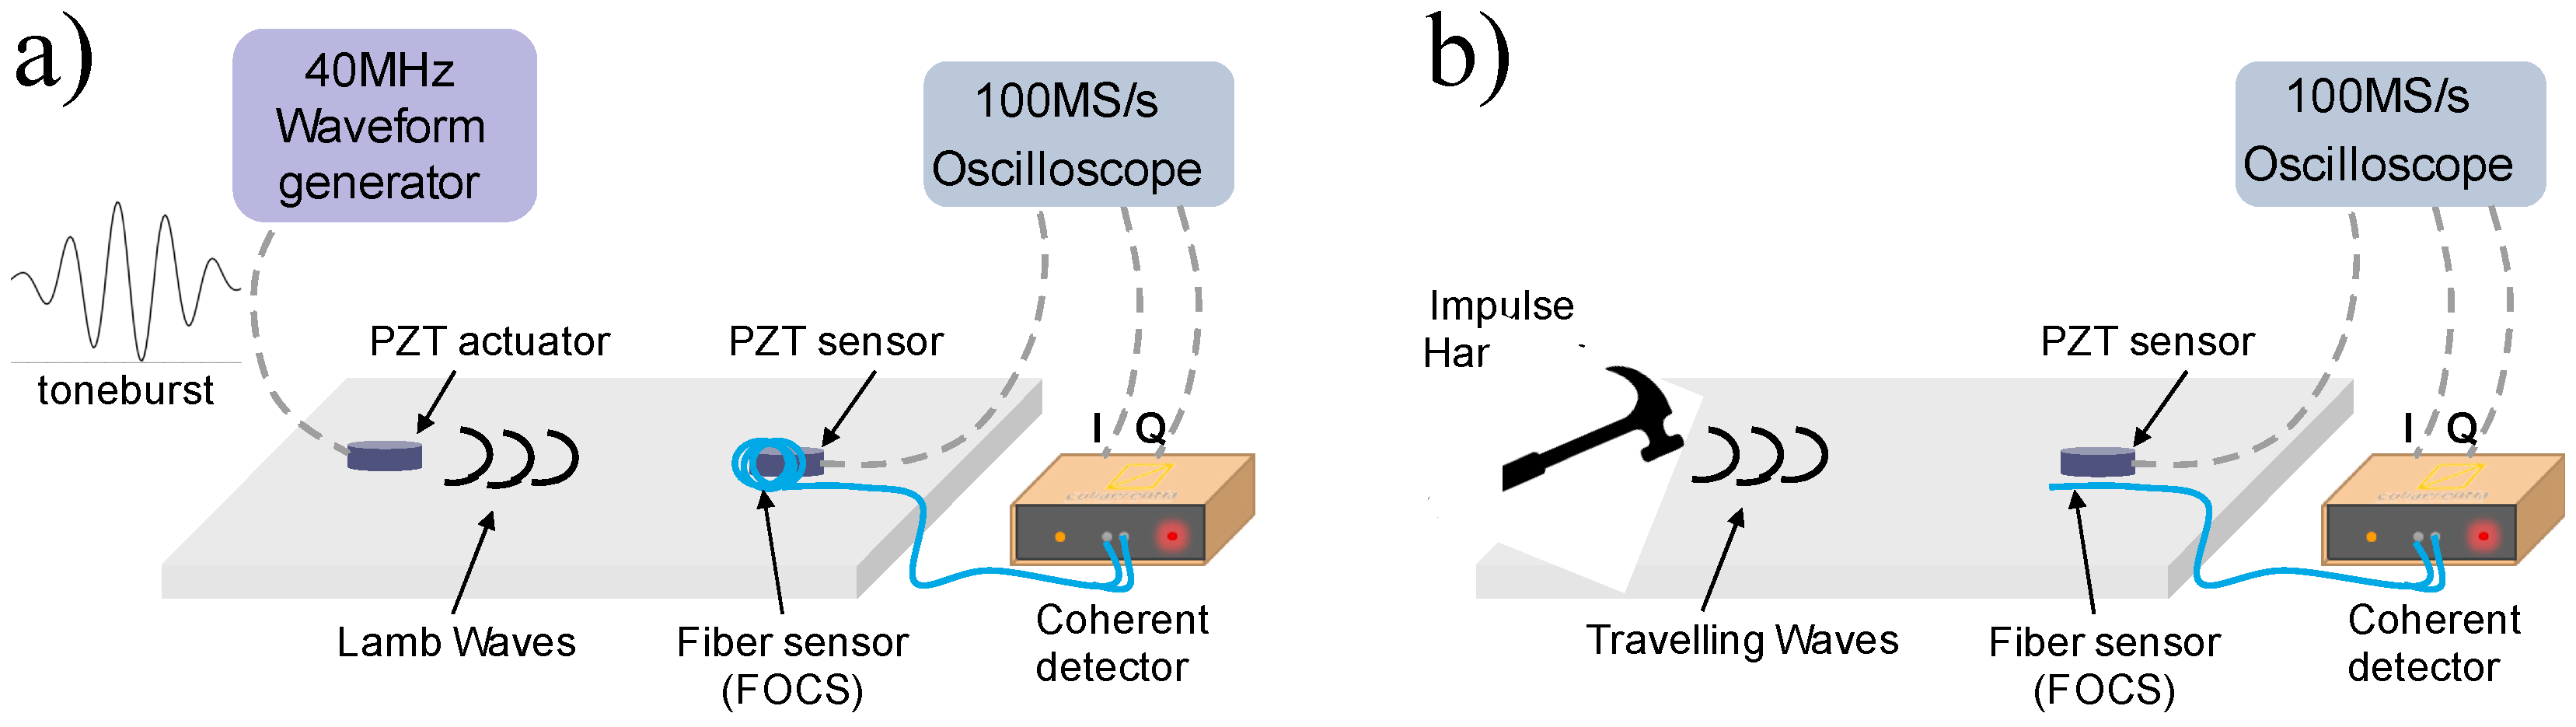
21] for both passive monitoring of acoustic emission and active damage monitoring based on ultrasonic wave scattering. In this work, for the first time, we describe in detail how the sensor configuration, intended as the gauge length and the number of the optical fiber loops, can been selected to maximize the performances of the coherent fiber optic monitoring solution for two highly dynamic cases, namely Lamb and impact strain wave signals, for active and passive impact monitoring applications. Specifically, the focus of this work is the analysis of the quality of the acquired sensor signal in different layouts and not the inference on either the impact or the impact damage features. The strain waves generated first by a piezoelectric transducer and then by an impulse dynamometric hammer on an aluminum skin panel are acquired by the fiber optic coherent (FOC) sensor and then signals are verified by comparison with a numerical Finite Element Model (FEM) and with traditional piezoelectric (PZT) sensors.
A detailed introduction to the sensing principle is presented in
Section 2, followed by a description of the experimental setup in
Section 3.
Section 4 provides information on the adopted Finite Element (FE) modelling strategy. Results for active monitoring and passive impact identification are shown in
Section 5 and
Section 6, respectively. A conclusive section is finally provided.
2. Sensing Principle
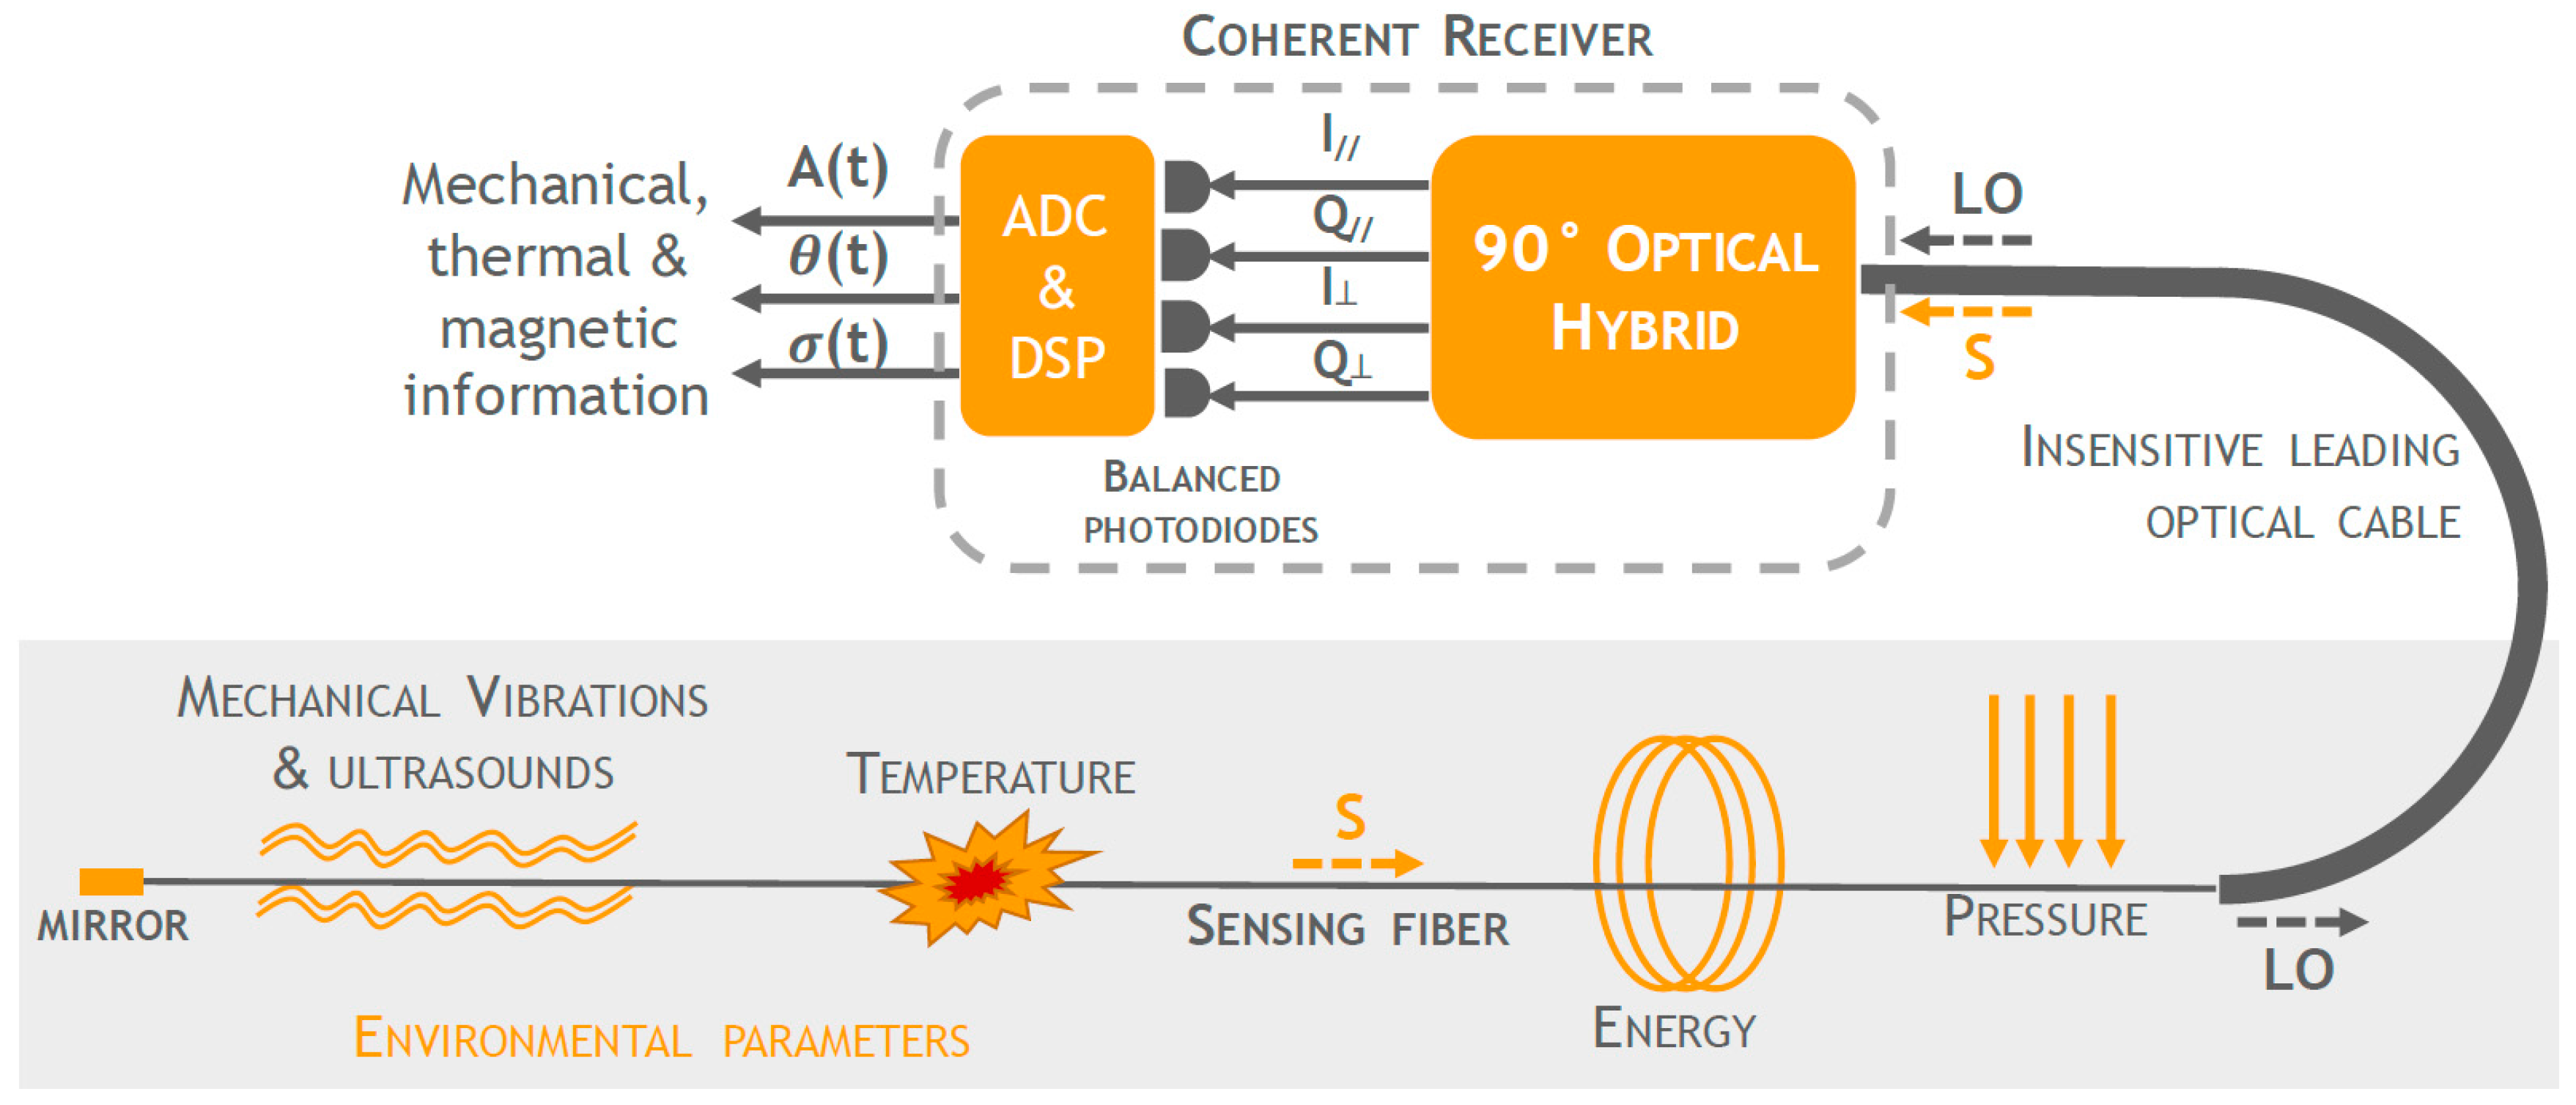
The interferometric fiber optic sensing solution exploited in this work for ultrasonic strain wave detection relies on a novel and recently patented phase-diversity coherent detection scheme [
22]. The proposed approach exploits a standard, disposable optical fiber as the sensing element capable to monitor different parameters related to health conditions of mechanical, civil, and aerospace structural systems, such as temperature, deformations, vibrations, ultrasounds, and even presence of electromagnetic fields, thus replacing the need of a plurality of conventional sensors. All these parameters induce fiber elongations and refractive index changes, which, in turn, result in variations of the amplitude
A(
t), phase
θ(
t), and polarization
σ(
t) of the optical field S that propagates in the fiber. Differently from conventional interferometric approaches, the key element of the proposed approach is represented by a new polarization and phase diversity coherent demodulation scheme (
Figure 1) where the signal S, back-reflected from the sensing fiber end, and a local oscillator (LO) are combined in a 90° optical hybrid [
23,
24,
25], enabling the extraction of phase, amplitude, and polarization of the optical field S. Indeed, the outputs of the 90° optical hybrid, used in combination with balanced photodetectors, provide the in-phase
I and the quadrature
Q signals for both polarization
σ(
t) components (// and ⏊) of S, where
and
. The four in-phase
I and quadrature
Q signals are then digitalized and post-processed with demodulation algorithms exploited in coherent optical communications [
26,
27], allowing the recovery of
A(
t),
θ(
t), and
σ(
t) in a completely passive way without the need of complex active feedbacks for quadrature point stabilization as in conventional fiber optic interferometric and polarimetric schemes [
28,
29]. Moreover, in the configuration of
Figure 1, the signal S and the LO follow the same path inside a leading cable until the area to be monitored so that the useful information results exclusively that integrated along the sensing fiber length and all environmental perturbations acting on the leading cable result in a common-mode phase noise which is not detected at the receiver.
As mentioned, the proposed approach allows even magnetic fields measurements (i.e., current or voltage measurements), carried out by analyzing the evolution of the polarization
σ(
t) of the back-reflected signal S. However, when the monitoring of
σ(
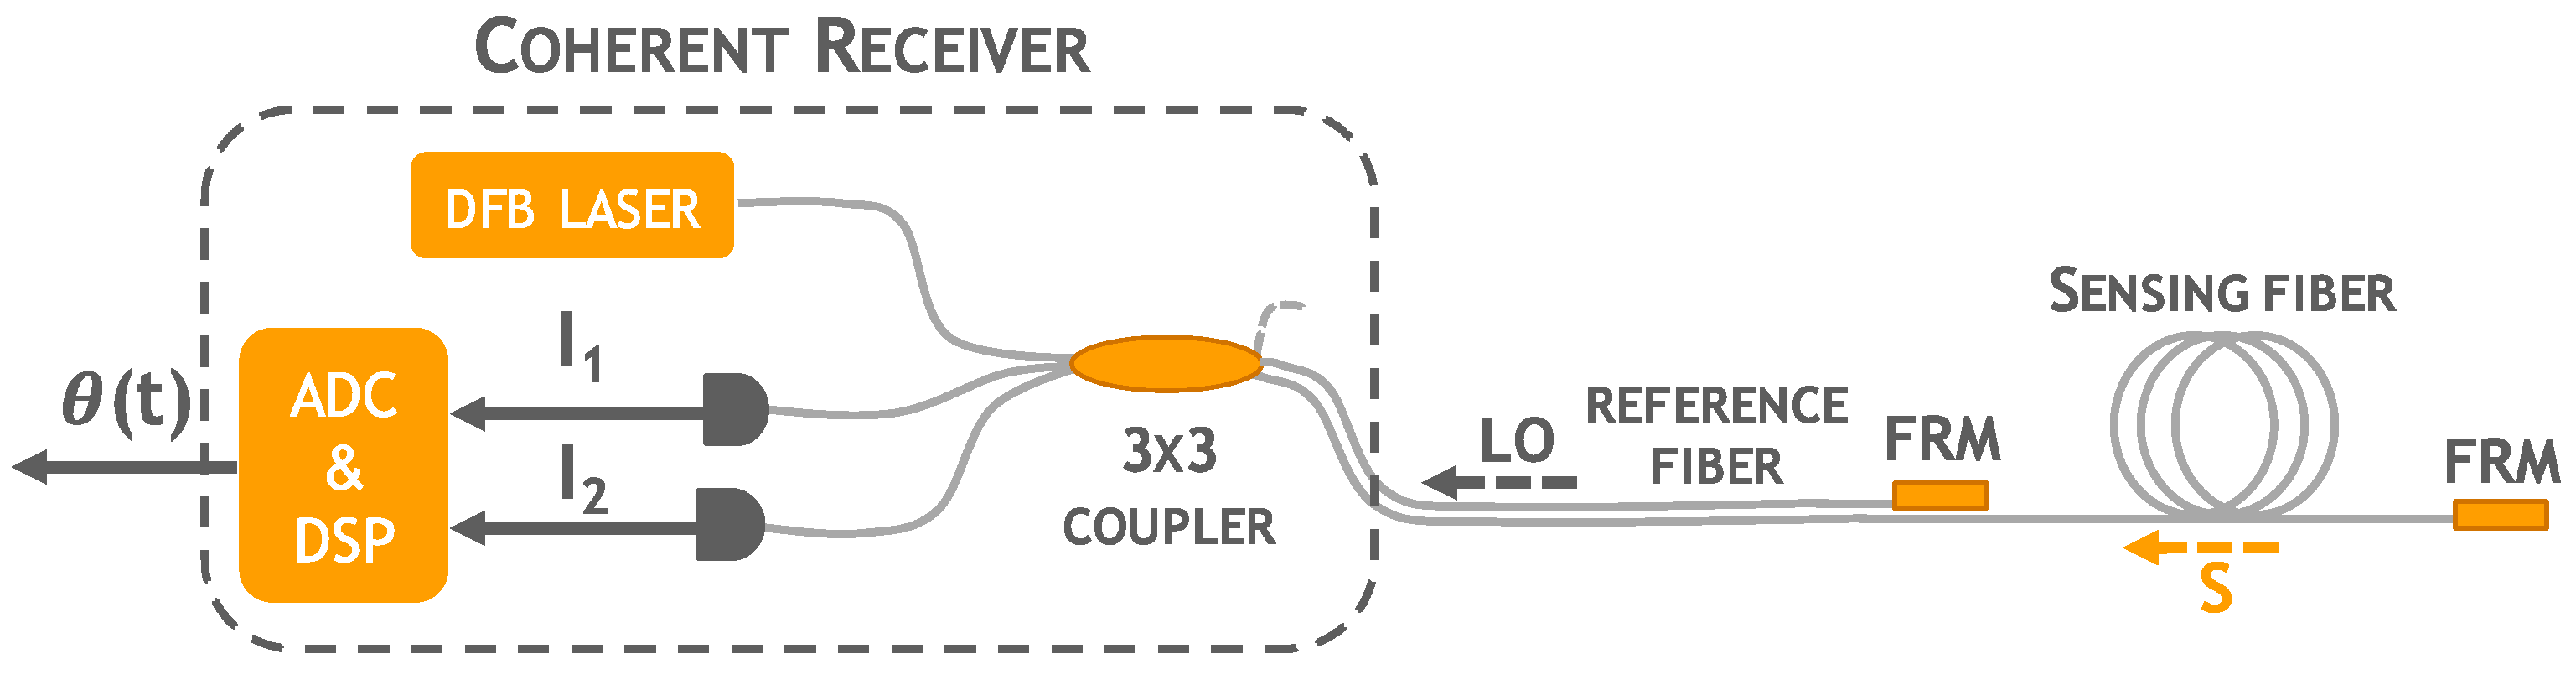
t) is of no interest, as in the present application, the 90° optical hybrid of
Figure 1 can be replaced by a simpler phase-diversity coherent receiver recovering just phase
θ(
t) and amplitude
A(
t) information of S. In this case the coherent receiver comprises only a 3 × 3 optical coupler (
Figure 2) where two of the three output fibers, constituting the sensing and reference arms of the interferometer, are both terminated with Faraday Rotator Mirrors (FRM) which retrace the S and LO polarizations [
30] and always guarantee a mutually parallel fixed polarization state at the 3 × 3 coupler, thus ensuring maximum visibility of the signals I and Q. In this way,
θ(
t) and
A(
t) can be properly reconstructed regardless of random signal polarization fluctuations that inevitably occurs along the fiber and which may cause signal fading in conventional interferometric detection schemes [
31].
A standard telecommunication distributed feedback laser (DFB) at 1550 nm and spectral linewidth of Δ
ν = 10 MHz, corresponding to a coherence length
Lc of approximately 6 m, is coupled to one input of the 3 × 3 coupler and the optical signal split through both reference and sensing arms. The back-reflected optical signals S and LO are then collected at the two other input ports of the 3 × 3 coupler and detected by a pair of photoreceivers which provide the following normalized output signals [
32]:
In (1),
B and
C are constants that depend on the 3 × 3 coupler and
θ(
t) is the phase difference induced by strain variation Δ
L sensed by the sensing arm according to the following relation:
where
λ is the optical wavelength,
n refractive index,
ν the Poisson’s ratio, and
Pij the strain-optic tensor of the optical fiber. Compared with the coherent receiver of
Figure 1 the 3 × 3 coupler provides two output signals
I1 and
I2 displaced by 120° and not by 90°. Yet, several demodulation methods can be exploited [
32] which yield the in-phase
I and the quadrature
Q components of the optical signal S, from which, by calculating the arc-tangent of the ratio between
I and
Q, the phase difference
θ(
t) is retrieved.
In the present work, the phase-diversity coherent approach is exploited to retrieve high-frequency information induced in the phase
θ(
t) of the optical signal by the propagation of ultrasonic Lamb waves in metallic structures. Indeed, the proposed sensing solution offers the possibility of a real-time broadband spectral analysis, mainly limited by the acquisition bandwidths (MSamples/s) of the Analog to Digital Converter (ADC) and the Digital Signal Processing (DSP), and is therefore suitable to monitor and detect even fast transients and ultrasounds. Furthermore, the high linearity and sensitivity of coherent detection [
33] guarantees sensitivity in phase measurements down to μrad which, combined with an optimized choice of the sensing fiber length and its arrangements, can result in strain resolutions in the order of με with wide dynamic ranges of ±10
4 με.
4. Finite Element model
A numerical model is used in this work to verify the features of the signals provided by the FOC sensor. An axis-symmetric Finite Element (FE) model has been developed in order to numerically reproduce the strain wave propagation caused by both a toneburst (
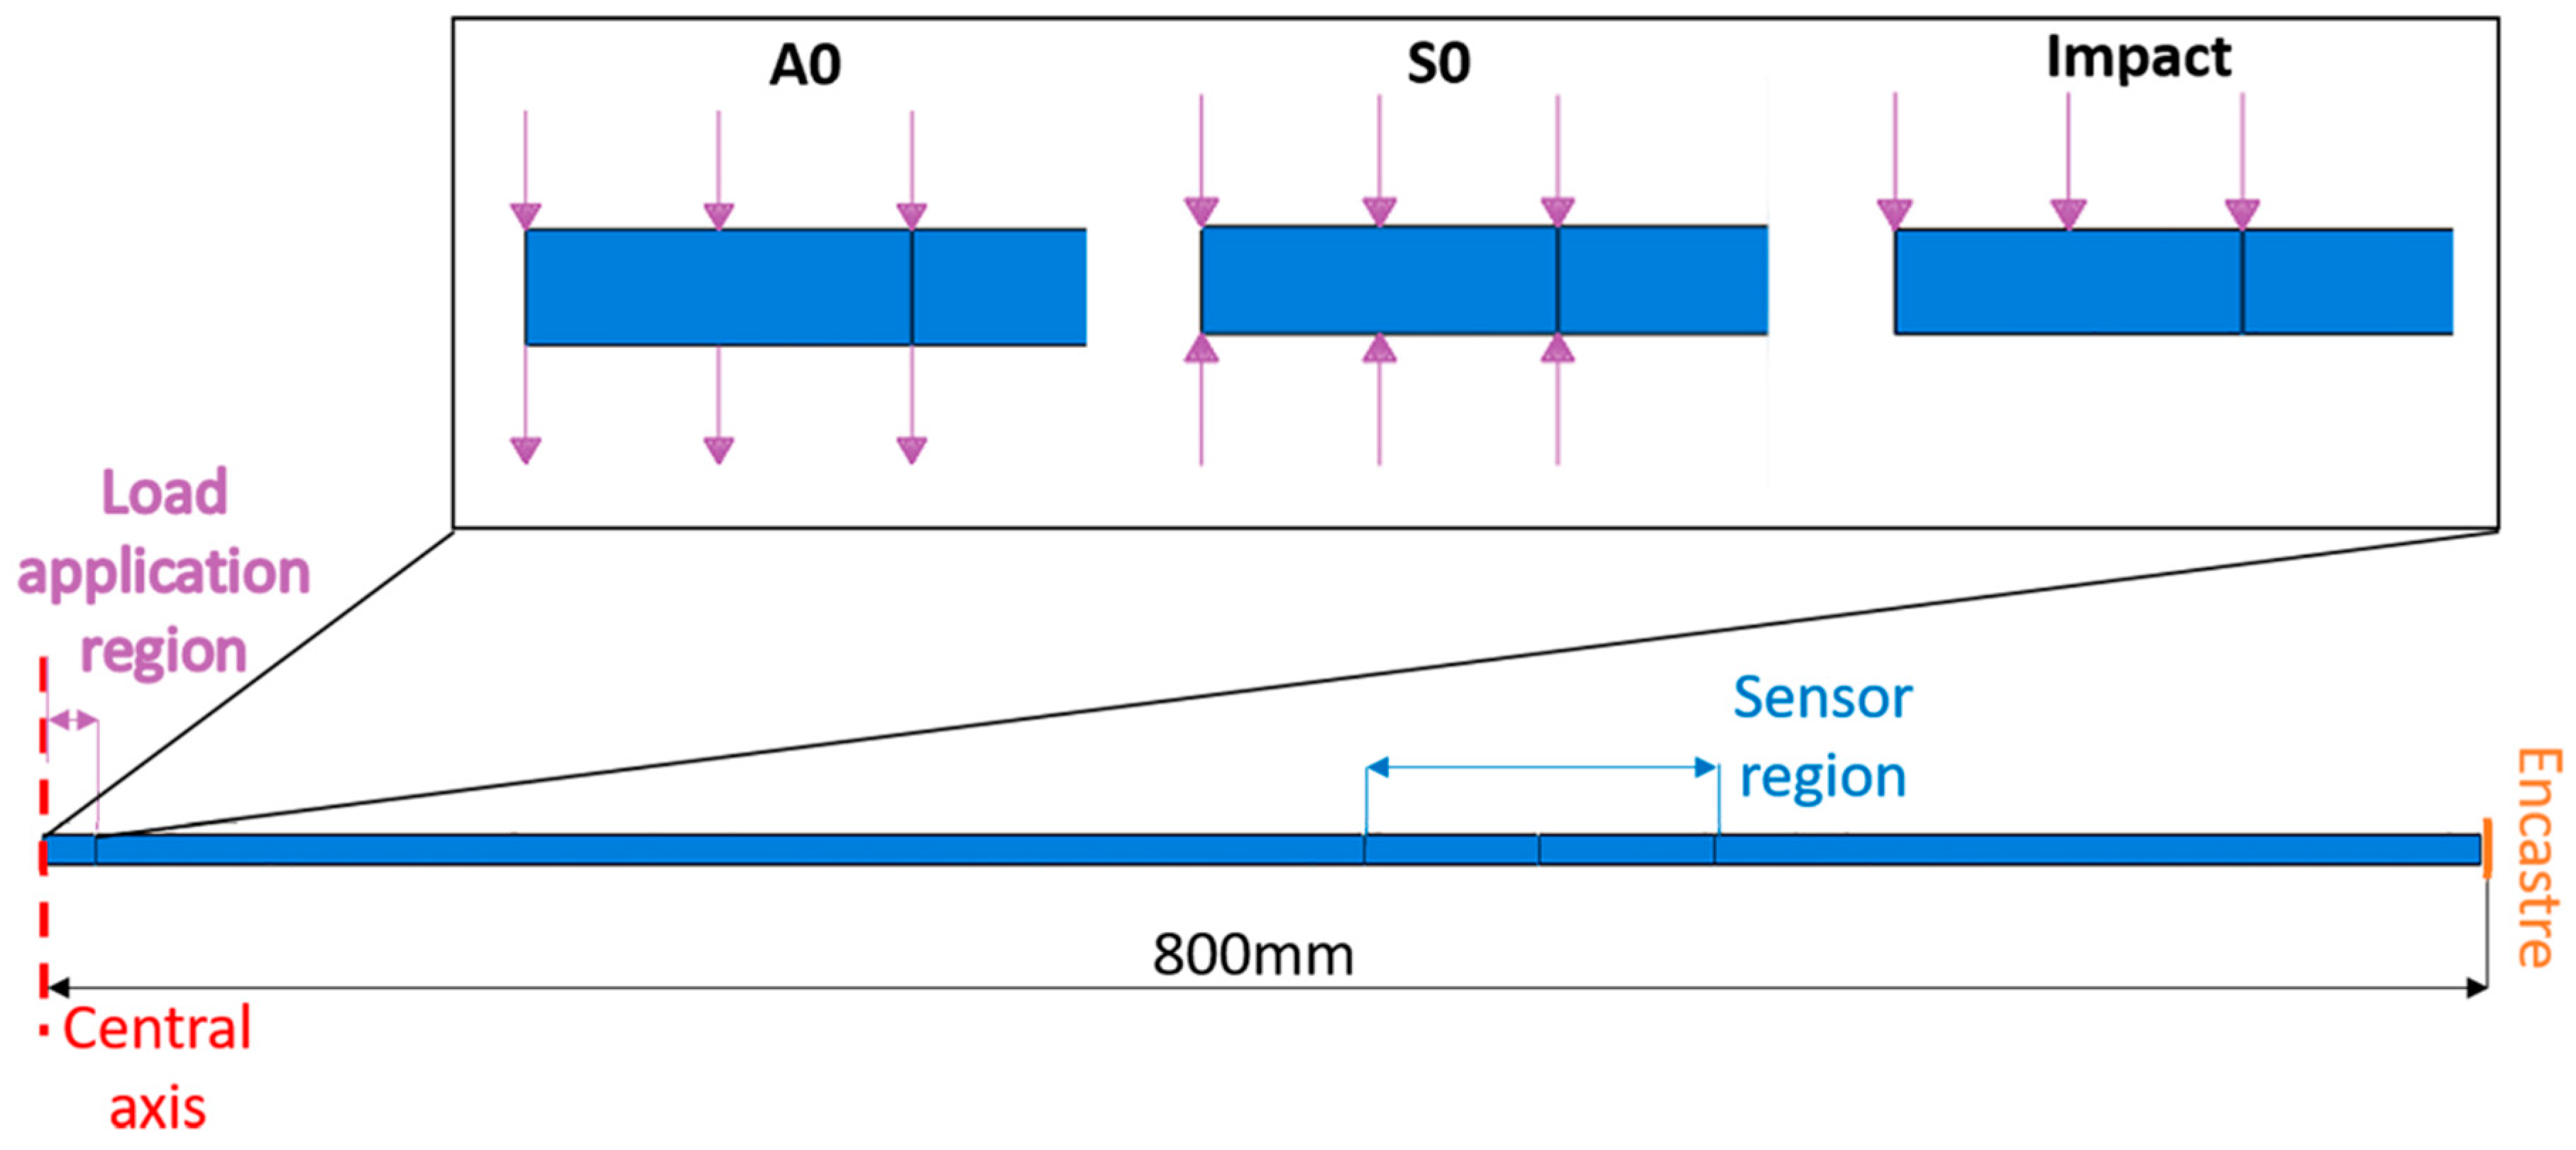
Figure 6) and a real impact, for active and passive impact monitoring respectively. An axis-symmetric structure model, reasonable for this specific scenario, has been selected to reduce computation costs. It is worth mentioning that axis-symmetric modelling can be exploited only in cases when both the geometry and the load are axis-symmetric. In the present case, the load is central but the real specimen geometry is square. However, in this work the numerical model is used to verify the portion of the signal that is relative to the arrival of the first wave packets at the sensor location. This specific part of the signal is not affected by the size and the boundaries of the target as long as the sensor location is enough far away from the boundaries to neglect the effect of wave reflections. In practice, the FE model is a disk with an 800 mm radius, while the real structure is a 400 mm × 400 mm square plate. The position of the sensors in the numerical model is selected in order to reproduce the experimental distance between the load application point and measurement distances. In
Figure 7, the FE model is reported without the mesh. It shows the central rotation axis, the area where the load is applied, and the location of the sensor.
As reported in
Figure 7, a clamp boundary condition is applied on the external side of the target plate, thus fixing all the degrees of freedom. As mentioned before, the numerical plate size is properly selected so that the signal associated to the first fundamental mode wave passing through the sensor is not affected by boundary conditions, thus allowing a direct comparison with the experimental signals. The input of the model is a load vs. time curve representing a tone-burst with a certain frequency or the load vs. time curve measured by the load cell of the dynamometric hammer, to emulate both, respectively, active and passive monitoring cases. Such load is applied to the plate in terms of a pressure acting on an area corresponding to either the PZT actuator area or the contact area of the dynamometric experimental tip, for active and passive monitoring, respectively. Note that, as a model of the PZT actuator is not included into the analysis, the A0 and S0 modes have been separately considered in different simulation models, specifically providing a pressure excitation as schematized in
Figure 7. The output of the model is the strain measured on the top surface in the sensor area. In particular, the output strain signal is proportional to the integral of the strain in the sensor region, whose dimension changes as a function of the exploited fiber optic gauge length.
The FE model has been built using the commercial software ABAQUS 2016 and its explicit solver. The explicit solver is recommended for very non-linear applications or, like in this case, for reproducing highly dynamic problems. Reduced axisymmetric CAXAR elements have been adopted having a size of 0.1 × 0.1 mm, thus including 15 elements along the plate thickness. In total, the entire model includes 75,000 elements. The calculation time with an Intel Xeon 16 CPUs at 2.4 Ghz workstation is approximately one hour.
5. Results for Active Lamb Wave Monitoring
In this section FOC sensor performances in terms of sensitivity are evaluated for the active monitoring case, as a function of both the number of optical fiber loops (
Section 5.1) and the gauge length (
Section 5.2), that is the length of the fiber actually attached to the monitored specimen. The FOC sensor behavior in response to increasing tone-burst frequencies of the PZT actuator is finally presented in
Section 5.3 for a specific sensor configuration. Both the analytical model, based on dispersion curves, and the numerical model, based on Finite Element simulations, are used as a term of comparison to verify the acquired experimental signals. Specifically, the analytical model is used to predict the arrival times of the wave packets associated to the fundamental modes while the numerical model provides a better understanding of the detected signal shape.
5.1. Effect of a Different Number of Optical Fiber Loops
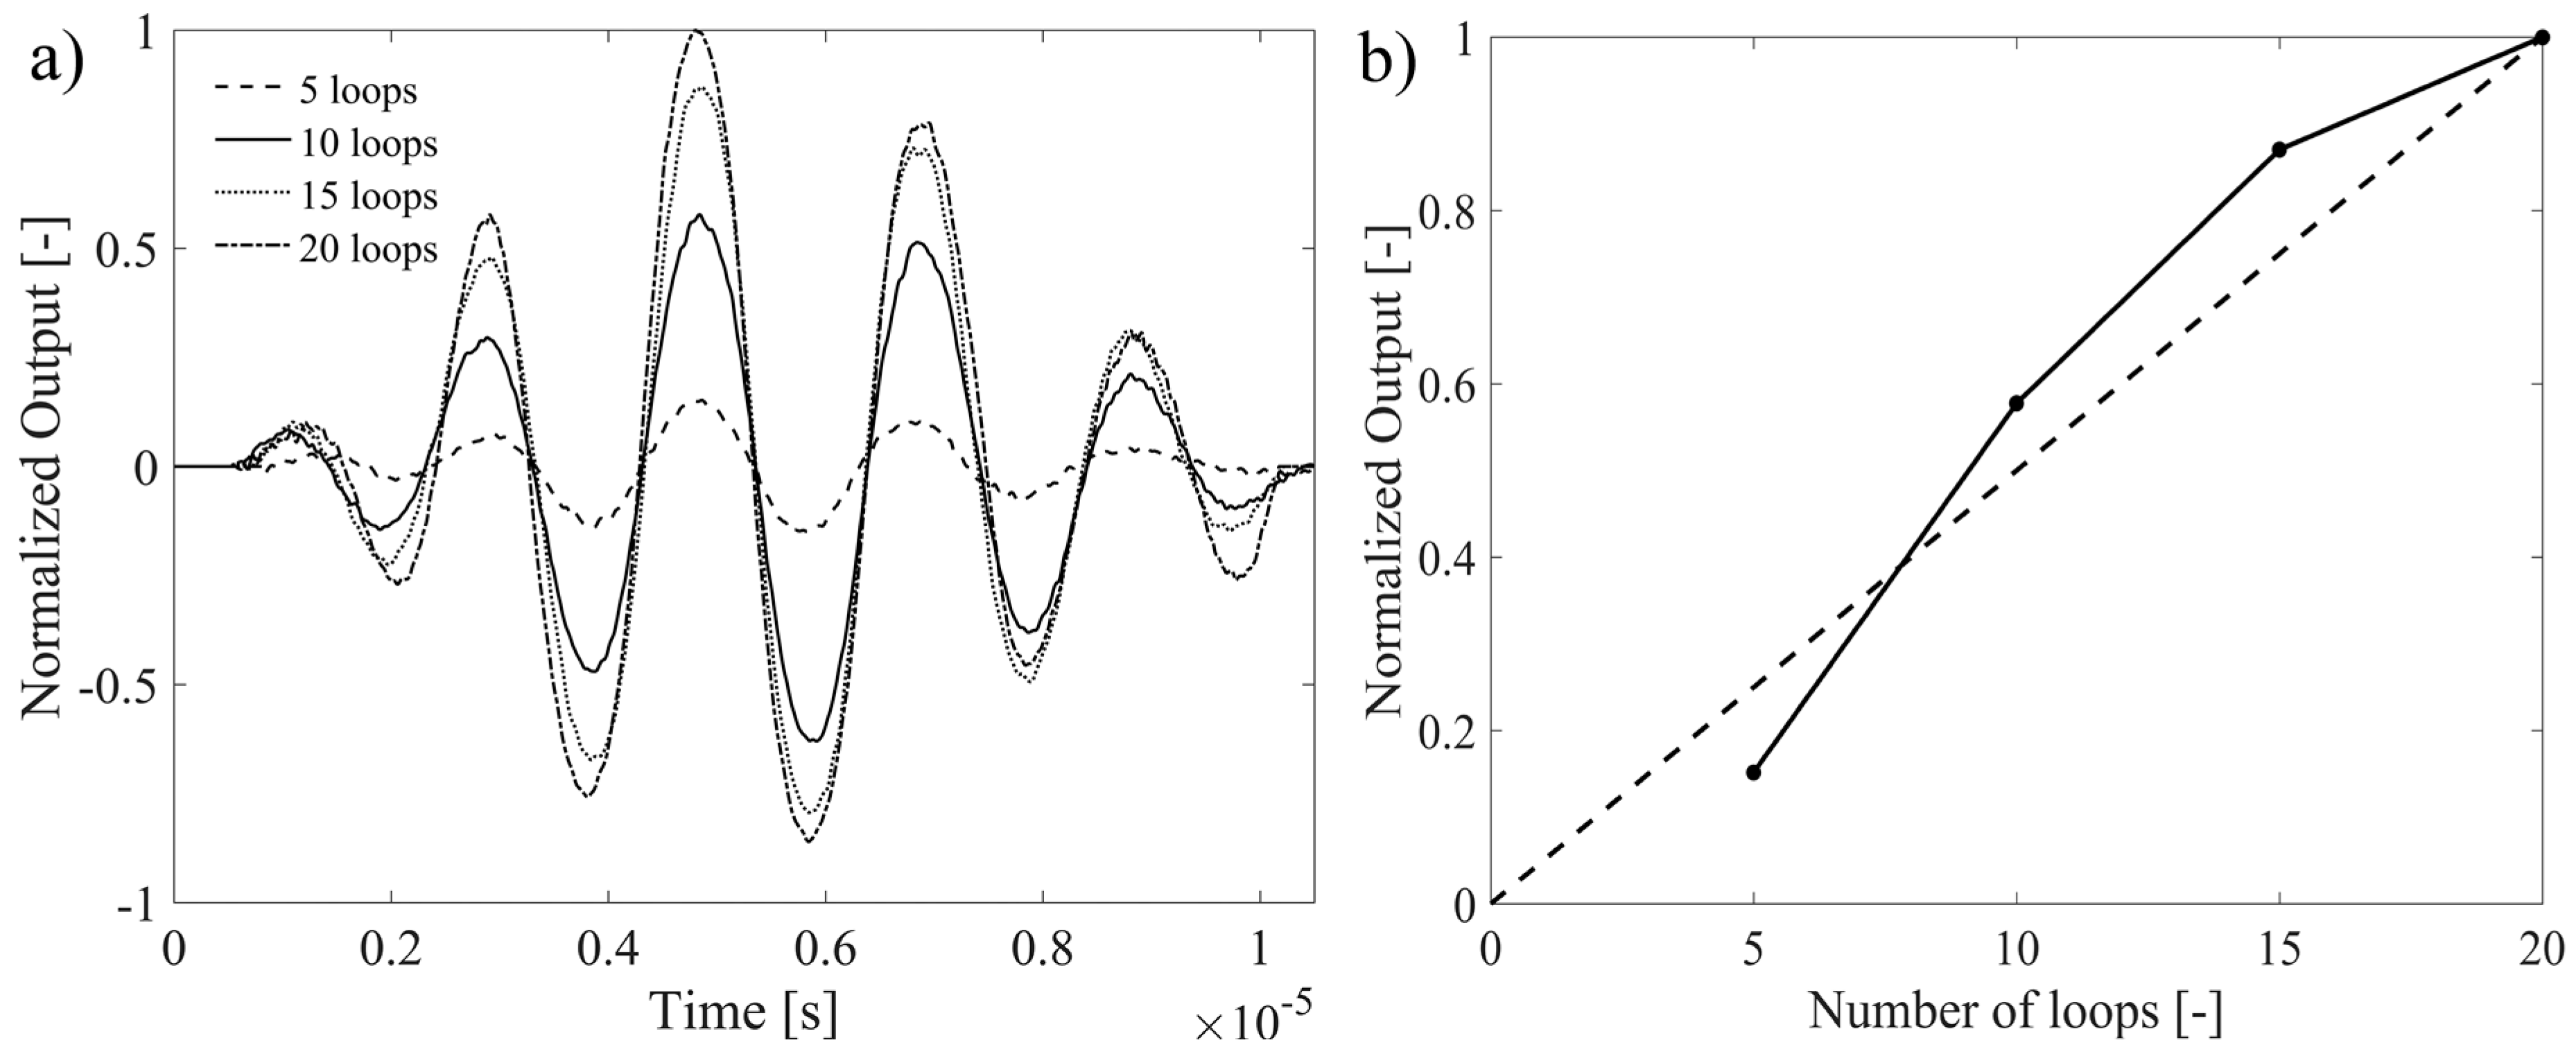
The effect of a different number of optical fiber loops on the FOC sensor signal is investigated in the range between 5 and 20 loops. The lower limit is imposed by the required minimum sensitivity, while the upper bound is provided by practical difficulties in the manual arrangement of loops. In particular, the minimum strain sensitivity was limited in this experiment to only few mε due to the 15 resolution bits of the high-bandwidth oscilloscope, but sensitivity down to με, as those of FBG, can be achieved with higher performance ADC acquisition boards. Yet, one great advantage of coherent (interferometric) sensors, with respect to FBG, is that their sensitivity can be increased by exploiting longer sensing length. Thus, the same FOC sensor coil has been connected and disconnected several times from the test specimen, each time adding further 5 loops. In particular, cyanoacrylate glue has been used to attach the FOC sensor coil to the aluminium plate, which facilitates the optical fiber disconnection with respect to a typical bi-component epoxy glue. The length of the glued coil section was fixed to approximately 4 mm and the toneburst frequency was driven at 50 kHz.
The acquired toneburst signals are reported in
Figure 8, focusing on the time window associated with the first A0 wave packet. Signals have been normalized with respect to the maximum peak measured by the 20-loops configuration. Considering that the FOC sensor response corresponds to the integral of the strains over the entire sensing fiber length, a linear magnification of the signal peaks is expected as a function of the loop number. In fact, this is true when looking at signals relative to 10 and 15 loops, while a slight departure from linearity is found for the remaining cases. This is due to several factors influencing the strain transfer from the aluminium plate to the FOCS, such as (i) the thickness of the bonding layer, as indicated in [
34]; (ii) the stiffness of the bonding layer itself and (iii) the repeatability of the actual gauge length in sequential sensor installations.
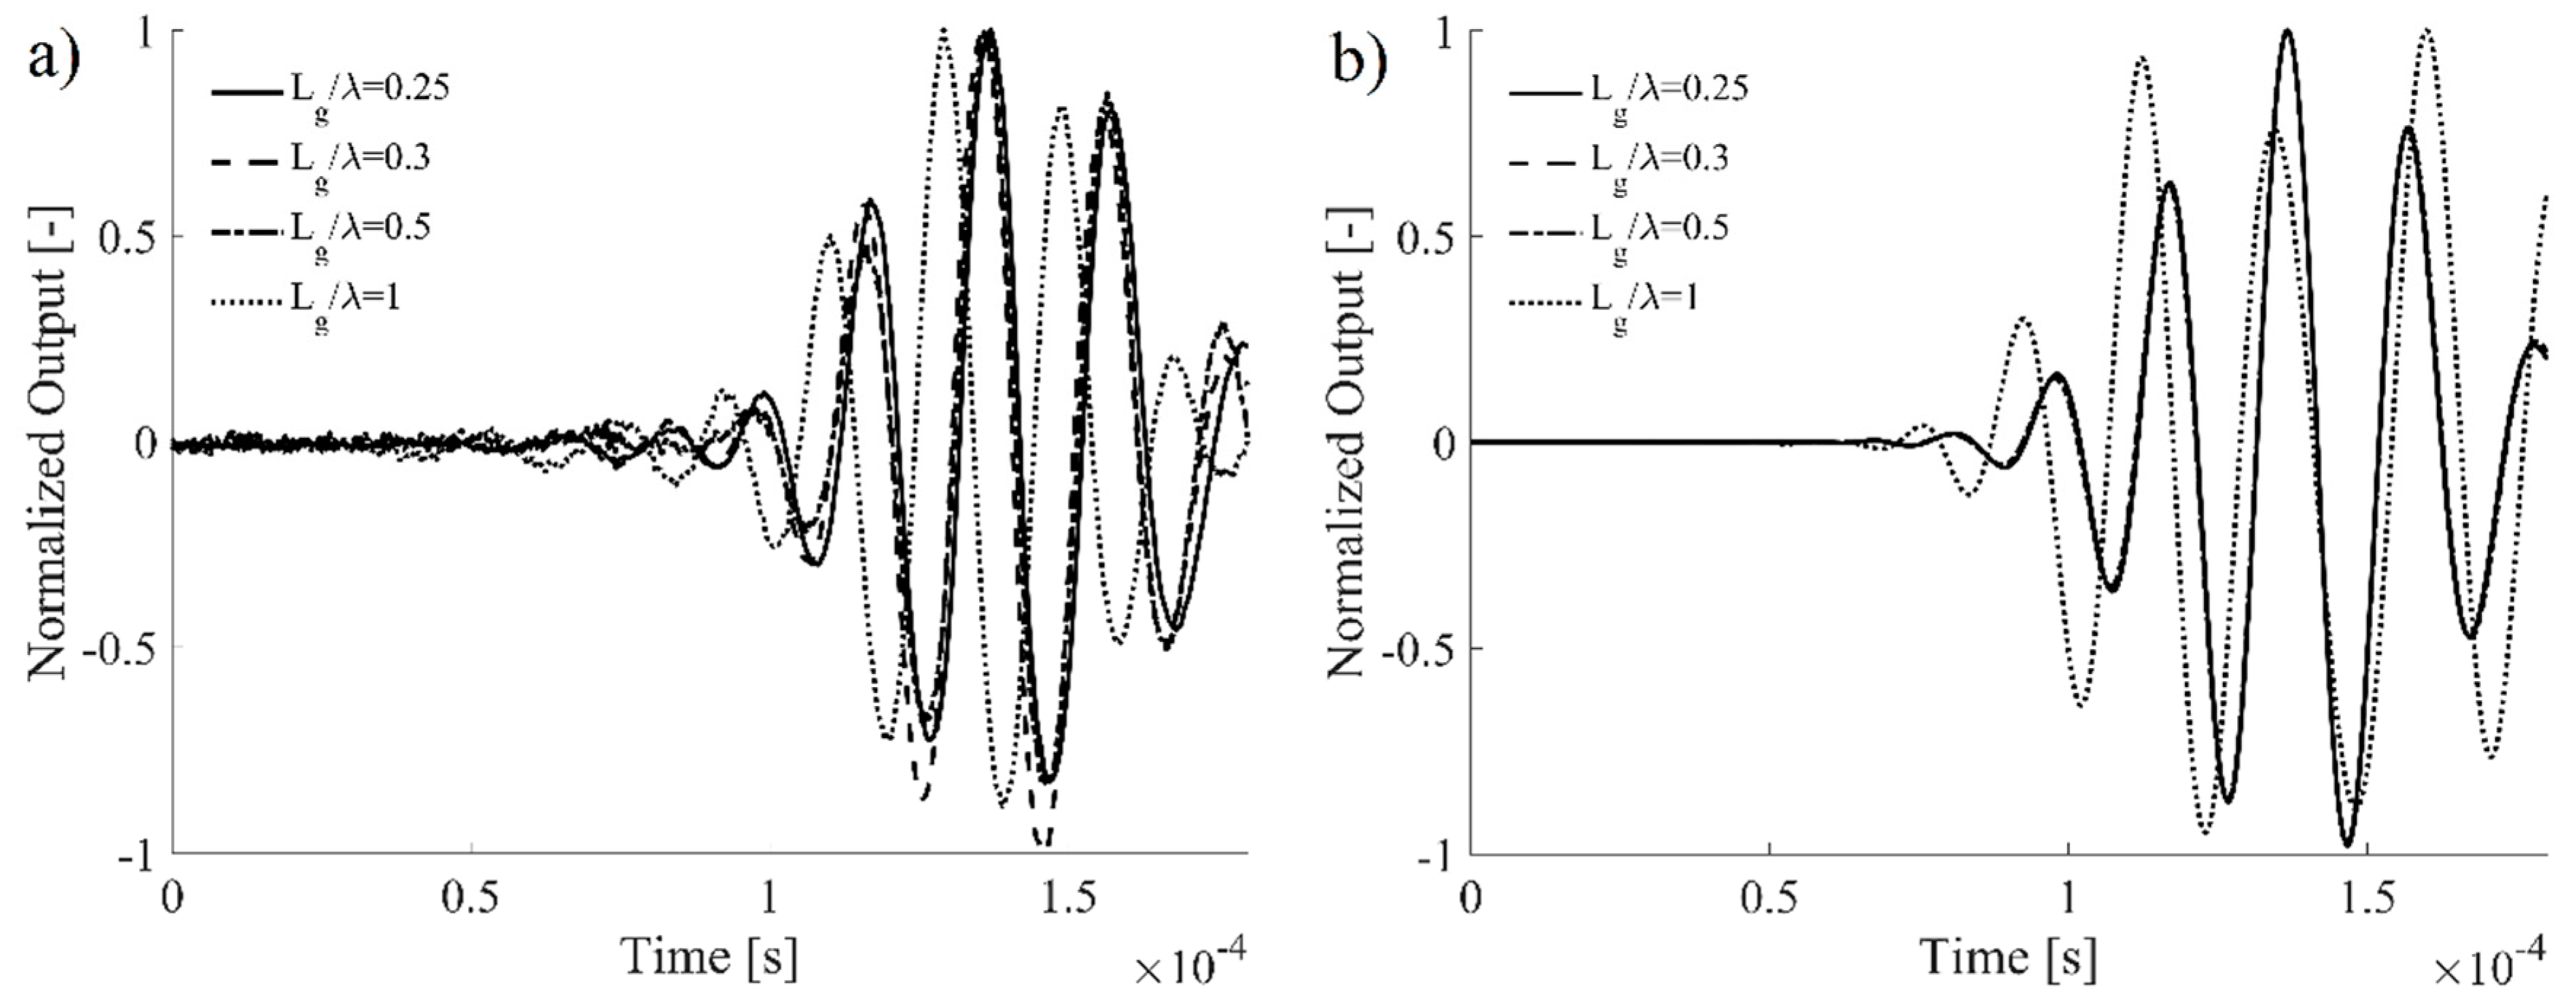
5.2. Effect of Different Gauge Lengths
The effect of different gauge lengths on the acquired FOC sensor signal is investigated in this section with a two-fold objective: (i) understanding the effect of increasing spatial integrations on the detected FOC sensor signal quality, in comparison with a numerical model and (ii) defining a threshold ratio
, below which a reliable measure of the ultrasonic wave dynamics is guaranteed. This has been carried out specifically for the A0 wave propagation mode, as it has been identified as the most critical in
Section 3.2. The toneburst frequency was set to 50 kHz and the ratio
was gradually increased from 0.25 (corresponding to
) to approximately 1 (corresponding to
).
The time signals acquired by the FOC sensors are shown in
Figure 9a and compared with the numerically simulated signals in
Figure 9b. For a proper comparison, signal amplitudes have been normalized in order to obtain a unitary maximum strain peak. Looking at the A0 first wave packet, a very high correlation was experimentally found among the acquired FOCS signals characterized by
less than 0.5. This is confirmed by the FEM analysis, which provides perfectly superposed signals when
is less than 0.5. In proximity of a unitary ratio of
, the signal manifests an apparent phase shift, caused by the spatial integration of a non-axis-symmetric wave packet. Moreover, a good agreement between experimental and numerical results is found at small
in terms of signal shape for different gauge lengths.
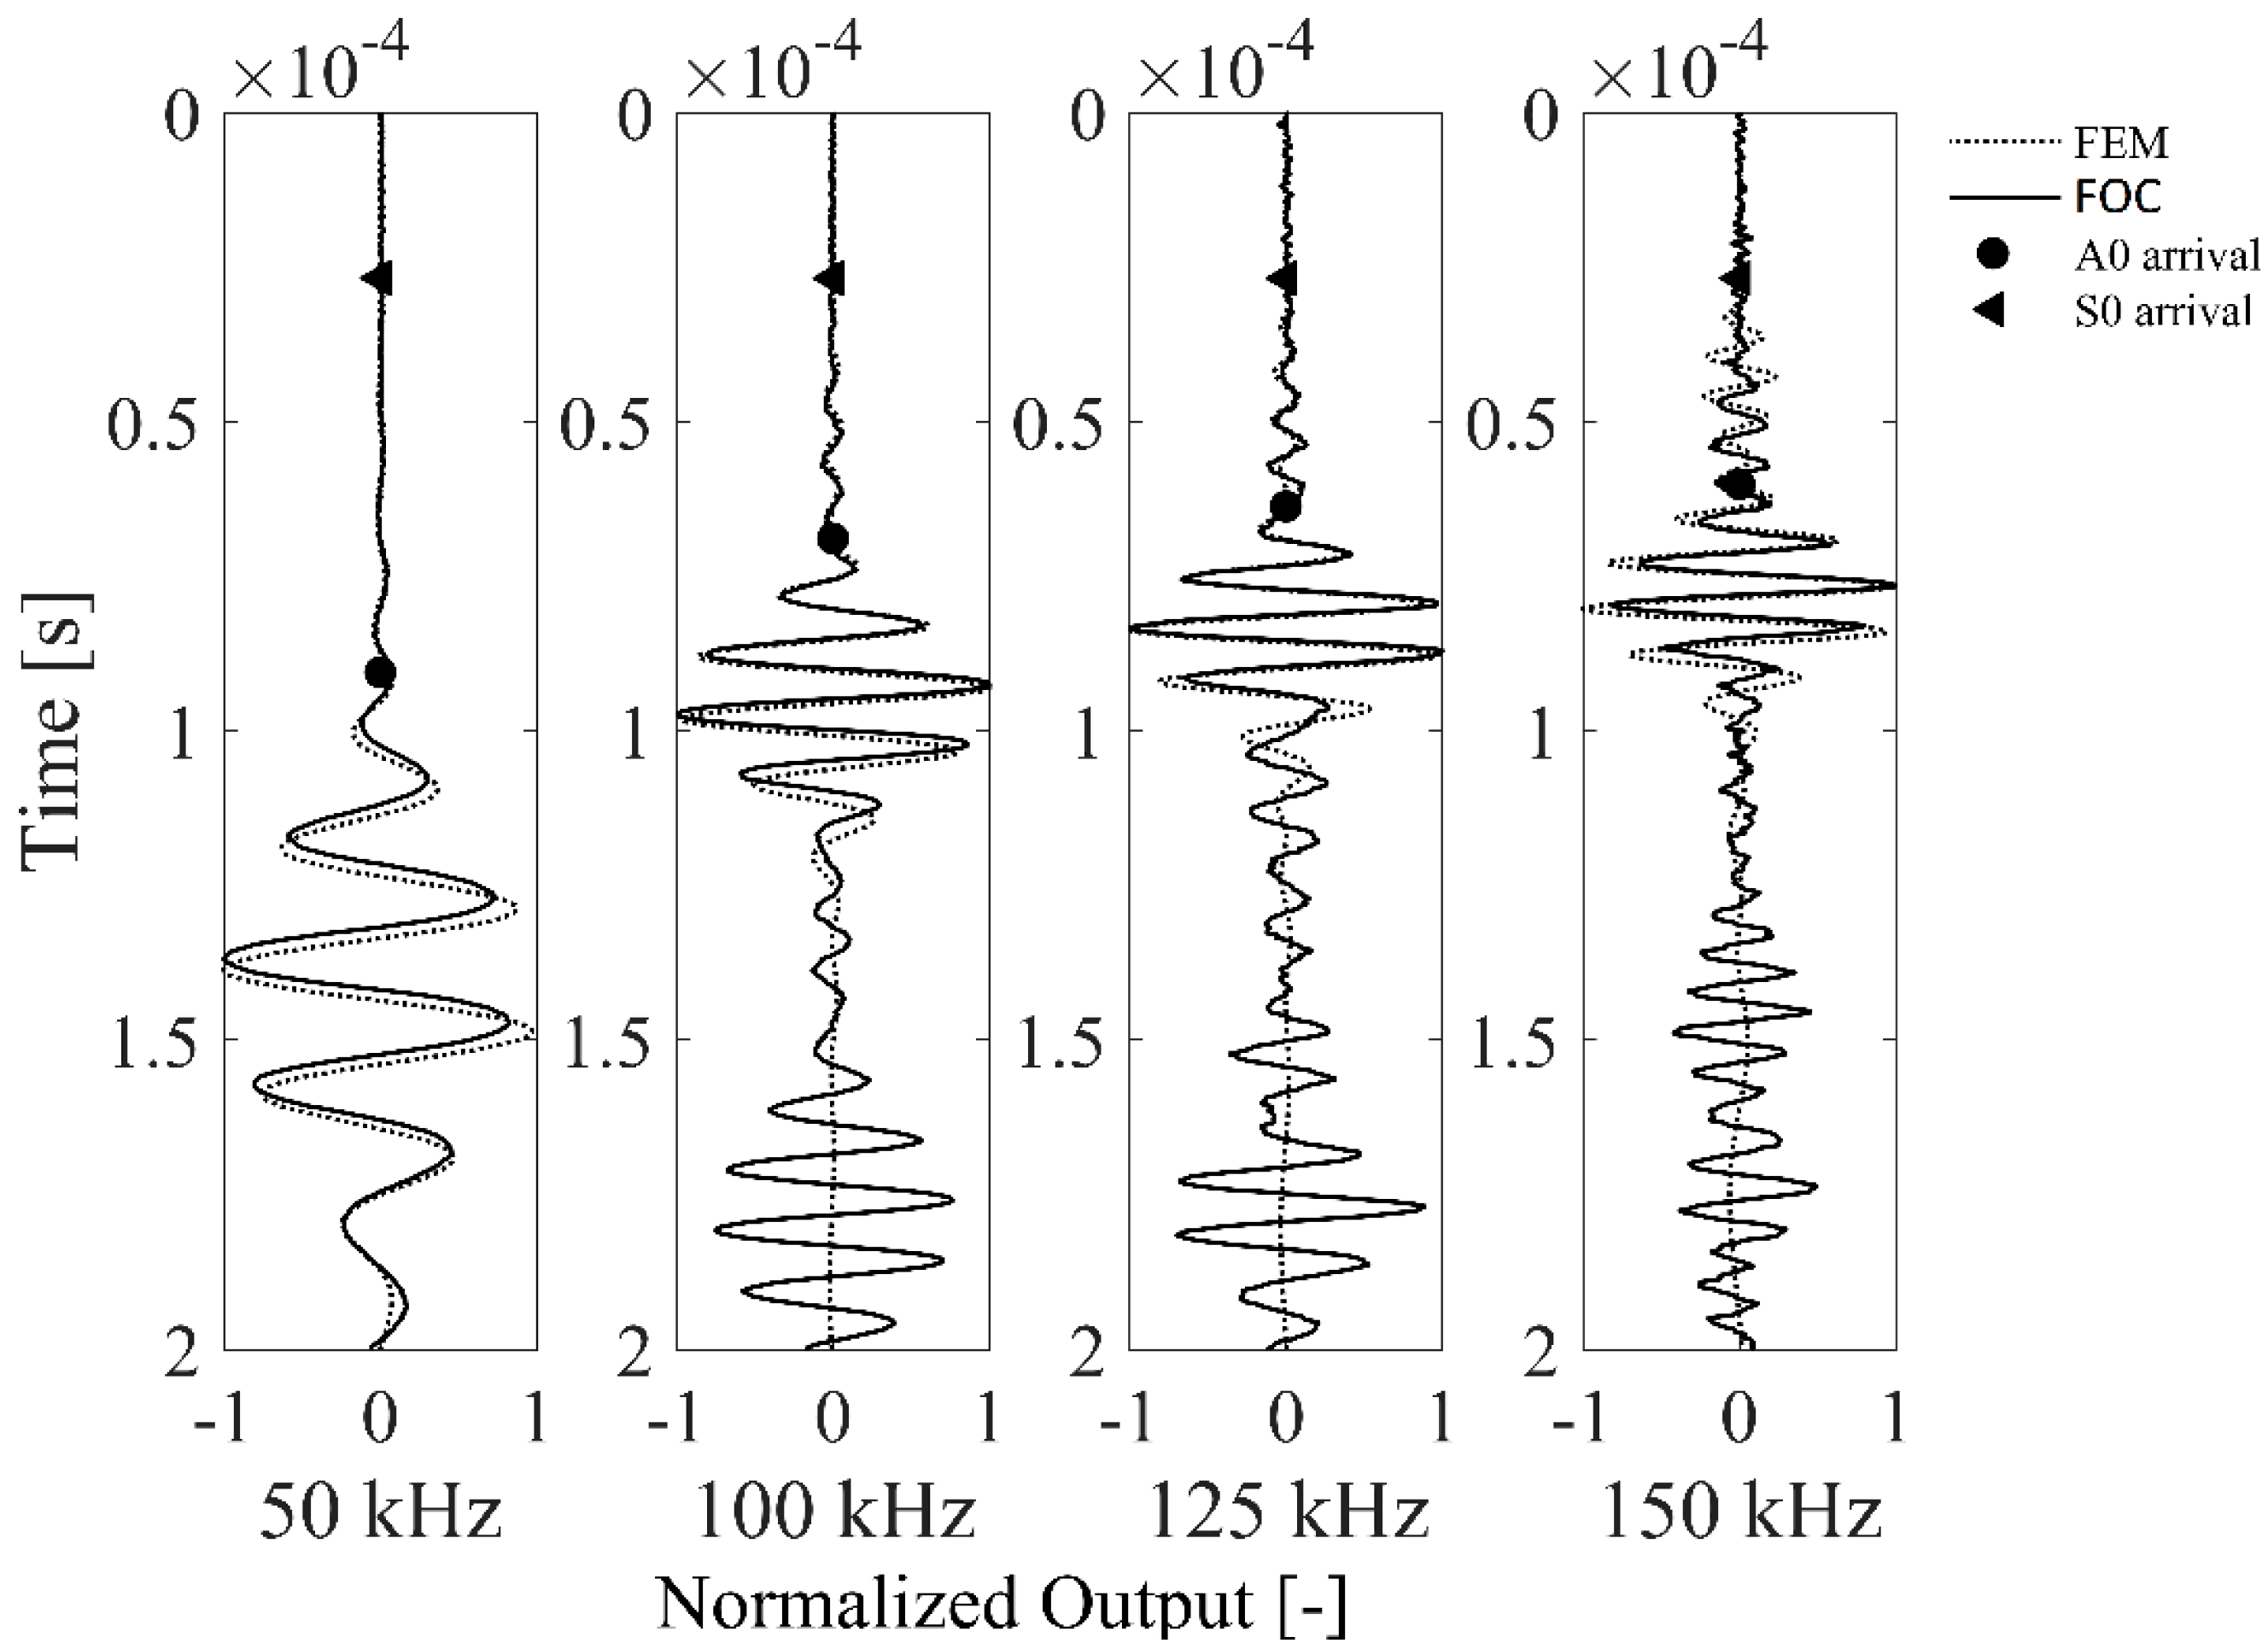
5.3. Effect of Increasing Toneburst Frequency
The FOC sensor signal behavior for increasing toneburst frequencies is now investigated in comparison with the numerically simulated results.
Figure 10 shows the FOC sensor and the FE signals relative to four different toneburst frequencies, namely 50 kHz, 100 kHz, 125 kHz, and 150 kHz. The FOC sensor was arranged in 20 optical fiber loops and the gauge length (
Lg) was fixed to 2 mm, meaning a different ratio
at each investigated frequency, respectively 0.12, 0.18, 0.20, and 0.22, according to the phase velocity of the A0 wave propagation mode reported in
Table 1. The foreseen analytical ToA for A0 and S0 modes is also reported as reference in
Figure 10. Several considerations can be set out.
First, a very high correlation between the FOC sensor signals and numerical prediction is found up to 150 kHz; this proves the validity of the axis-symmetric modeling approach and allows a correct interpretation of the experimental signal components. It is known from previous studies reported in the literature that different sensitivities to fundamental strain wave modes exist as a function of the toneburst frequency [
35]. Thus, two separate simulation models have been run at each frequency for the A0 and S0 fundamental modes, respectively, and the resulting simulated time-series have been linearly superposed to fit the experimental signals. Accordingly, the FOC sensor signal manifests a predominant sensitivity to the A0 mode at lower frequencies, that becomes comparable to the S0 sensitivity at higher frequencies. It must be remind that the FEM simulation do not account for boundary reflections as a wider circular plate with 800 mm radius has been chosen purposely.
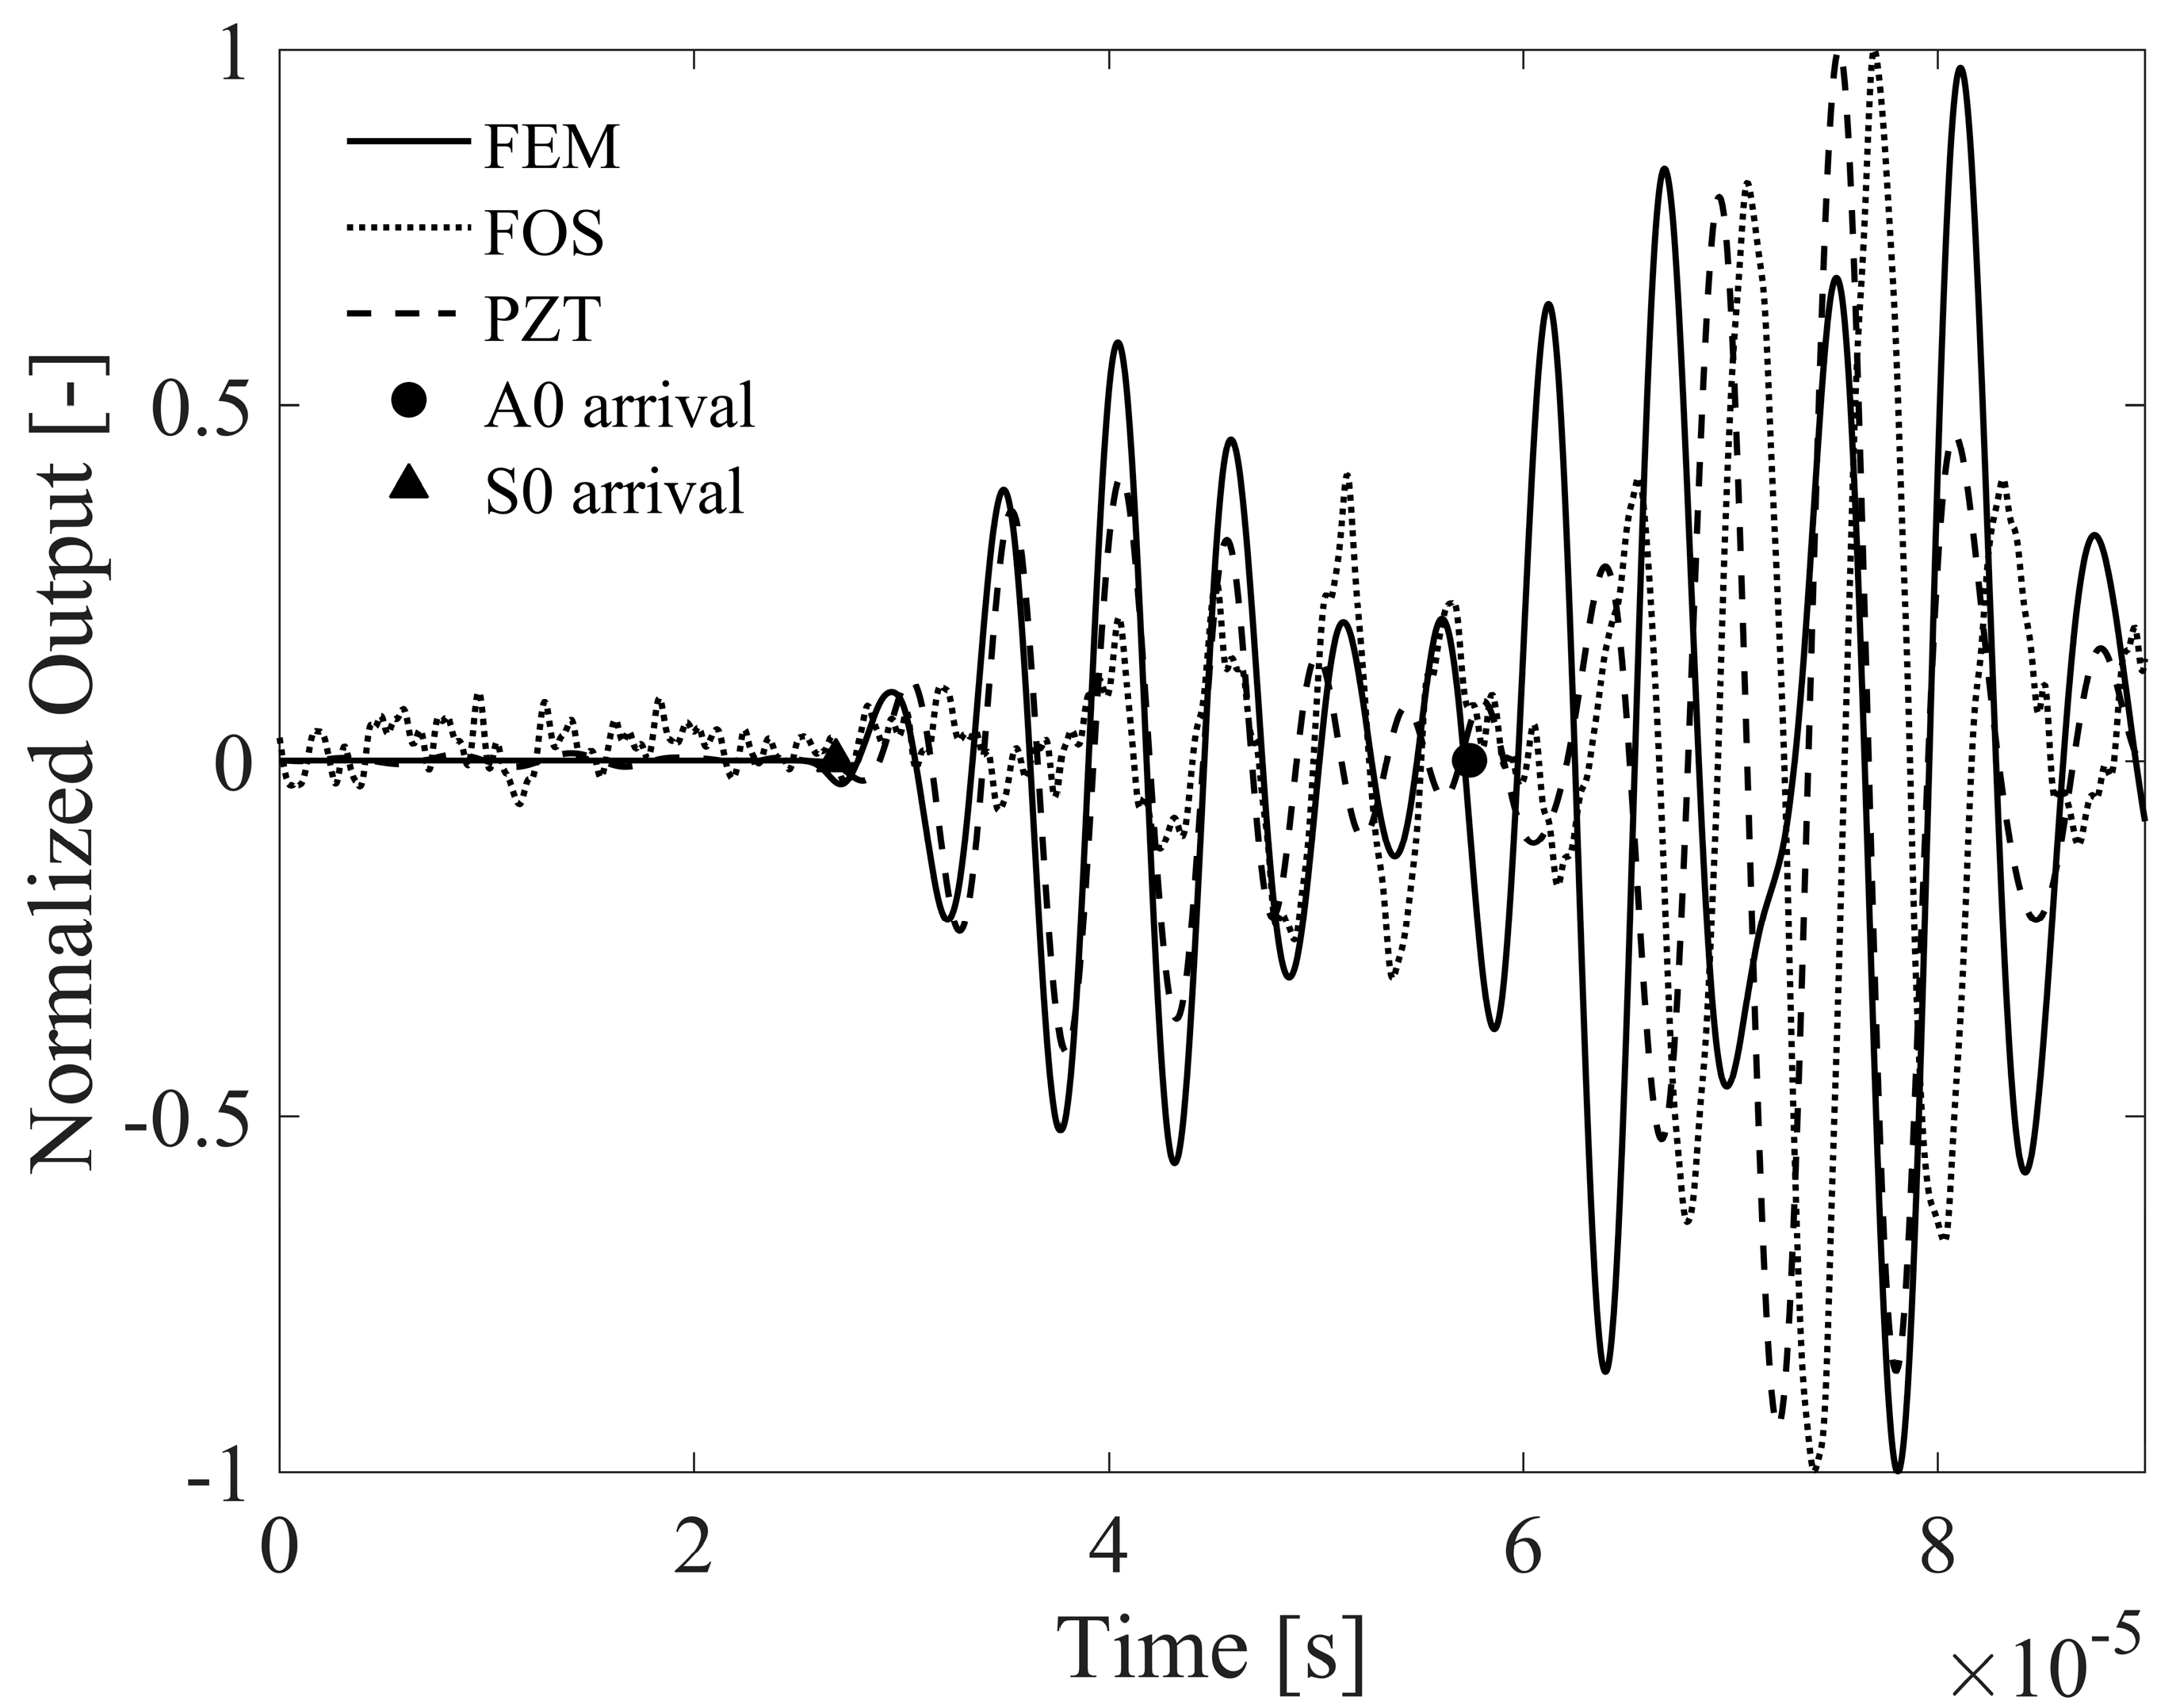
Second, a lower sensitivity of this FOC sensor configuration to the S0 mode is found, specifically at higher frequencies, which hampers an exhaustive signal comparison with the FEM. This is confirmed in
Figure 11, where the normalized FOC sensor signal is shown along with the numerical simulation and the signal simultaneously measured by a PZT sensor in presence of a 175 kHz toneburst. The FOC sensor sensitivity is reduced not due to a limit in its bandwidth, neither due to an excessive gauge length, but because of the limited strain transfer capability of the bonding layer and in turn of the optical fiber coating. The measured PZT signal instead indicates that the FE model correctly predicts the signal behavior also at higher frequencies.
Finally, referring to
Table 1, it is clear that the S0 mode is characterized by larger spatial wavelengths, thus allowing for a longer gauge length compared with A0. In fact, it was proven experimentally (though not reported here) that if a bigger sensitivity to S0 is required, a larger gauge length needs to be selected, although hampering the A0 mode acquisition.
6. Results for Passive Impact Monitoring
After having proved the feasibility of the FOC sensor for detection of high frequency phenomena in an active monitoring set-up, further measurements have been carried out to acquire strain travelling waves caused by an impact, as typically occurs in passive monitoring. The same test specimen as for active monitoring is considered hereafter. The FOC sensor is configured as explained in
Section 3.3 and FOC signals have been compared with both a PZT sensor and the FEM results in
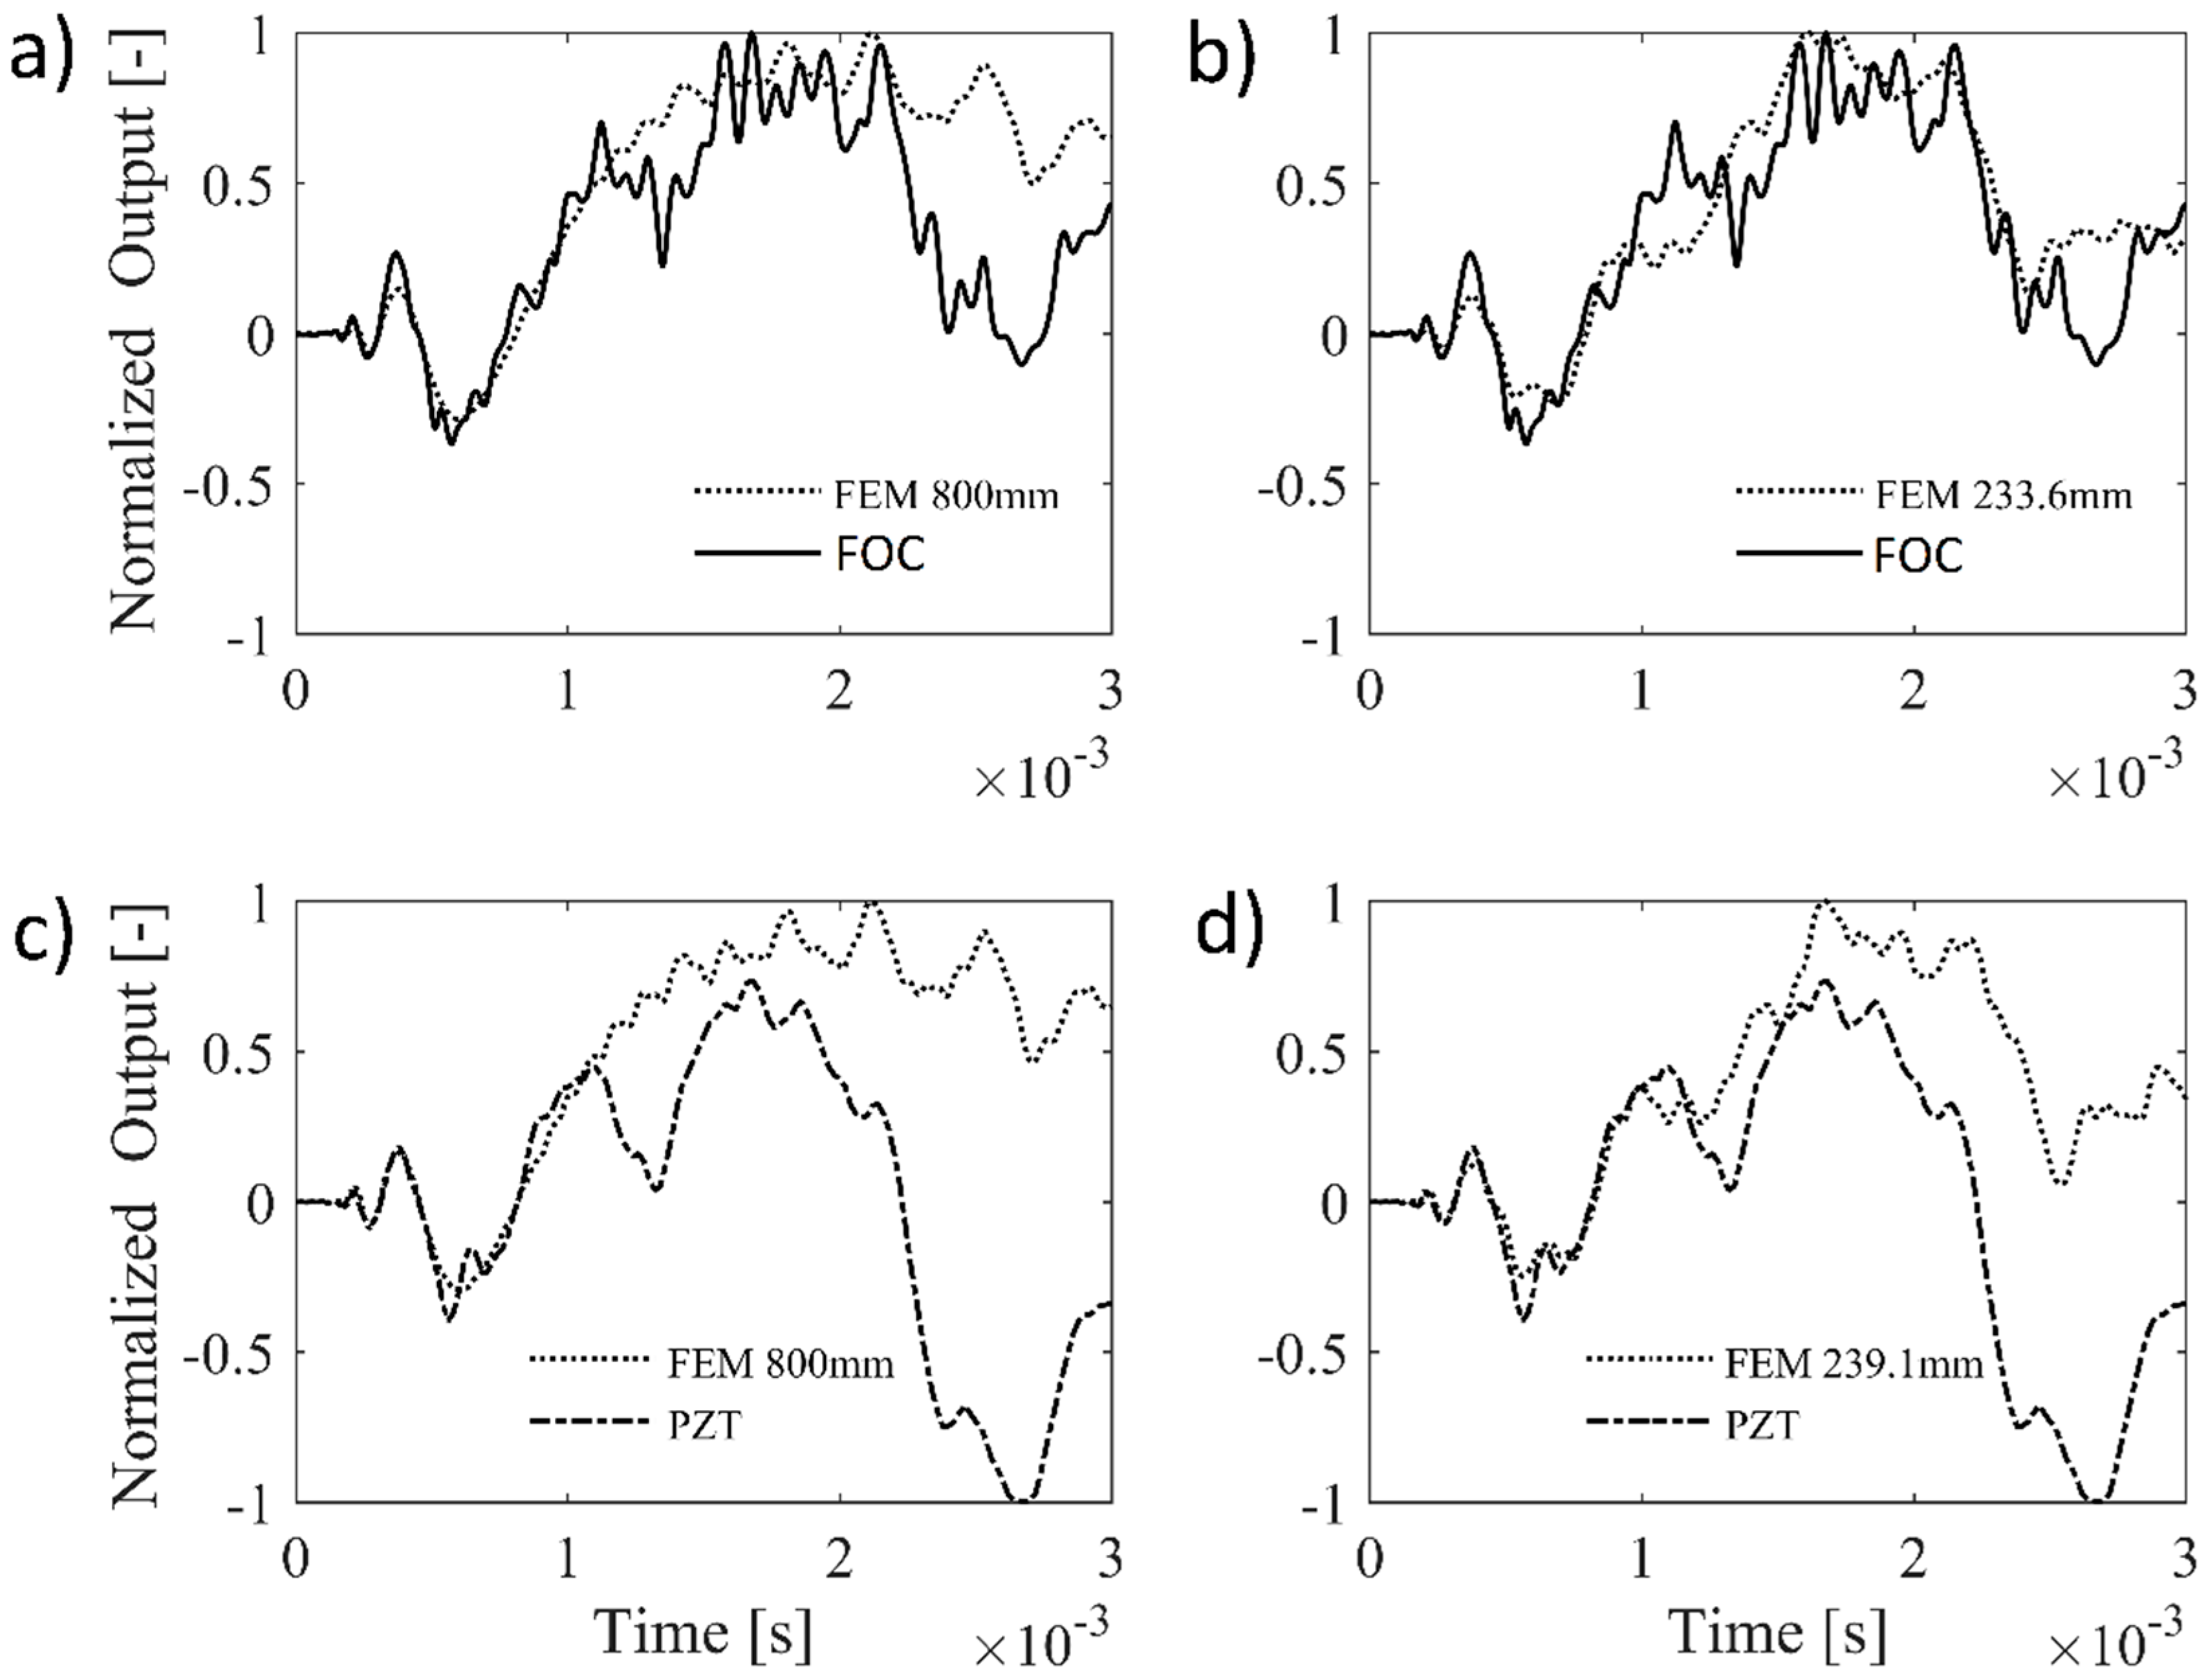
Figure 12.
Figure 12a,c reports the FOC and PZT sensor signals, respectively, compared with numerical solutions calculated for a circular plate with 800 mm radius to exclude any boundary reflection during simulation time. It can be noted that both the FOC and the PZT sensors provide a signal that is consistent with the numerical prediction in the first instant after the impact (within 1 ms). Then, due to wave reflection and wave mode superposition, the strain field becomes more complex and the difference between the two sensor curves and the FEM increases. Furthermore, the two sensors respond in a different way to the propagating strain wave: in particular, the FOC has a preferential direction for strain measure, which in turn makes the comparison with the FEM more accurate after 1 ms.
A more realistic version of the FEM has been subsequently designed in order to take the first strain wave boundary reflection into account, thus allowing a better understanding of the features of the acquired sensor signals. Referring to
Figure 13, the radius of the axis-symmetric model has been selected in order to guarantee consistence with the smallest travelling path among those available for reflections in the A-B-C domain (generically defined as
d + r in the figure). Due to a non-perfect coincidence of the FOC and PZT sensor positions, two FE models have been used in
Figure 12b,d, with radius 233.6 mm and 239.1 mm for the FOC and PZT sensor signal model, respectively. This provides further improvements of numerical simulation, especially for the FOC signal.
These first results demonstrate that the FOC sensor can be a valid alternative to PZT (and FBG sensors [
3]) for the extraction of useful information for passive impact identification, i.e., the identification of the ToA of the elastic waves induced by the impact.
7. Conclusions
A fiber optic sensing technique exploiting a novel coherent detection scheme has been proposed for both active and passive impact monitoring. The proposed approach allows different sensing fiber layouts in order to fulfil the requirements of the specific experimental measure.
For active impact monitoring relying on ultrasonic Lamb waves measurements, the sensor consists in a fiber optic coil of several loops that are bonded to the monitored specimen with a proper gauge length. The effect of loop number and gauge length on the quality of the acquired signal has been investigated, specifically for acquisition of toneburst Lamb wave signals. It has been proved that increasing the number of optical fiber loops achieves a higher sensitivity, though the improvement does not linearly scale if the bonding layer thickness is not perfectly controlled and if the strain transfer capability of the bonding layer is limited. On the contrary, it has been highlighted that an increase in the gauge length causes a larger spatial integration which, in turn, may hamper the sensor capability in detecting the actual high-frequency phenomena. In fact, on one hand a large gauge length is indeed needed to maximize sensor sensitivity, but on the other hand, a threshold integration gauge length exists strictly depending on the travelling wave speed to be measured, above which the acquired fiber optic signal is distorted.
For passive impact monitoring, the fiber coil layout causes unwanted coil oscillations during the impact, thus hampering the acquisition of the actual travelling strain wave. Yet, in this case, the sensor sensitivity could be improved by simply increasing the attached gauge length without arranging the optical fiber into multiple loops. This was possible due to the lower frequencies involved in passive impact monitoring compared with those occurring in Lamb wave active monitoring.
The feasibility of the fiber optic coherent sensor for active and passive impact monitoring has thus been demonstrated through comparison of the fiber optic sensor signals with results from both a numerical axis-symmetric Finite Element model and characterizations with conventional piezoelectric sensors. Very good agreement was found between experimental and simulated signals for both active and passive impact monitoring scenarios. This further demonstrates that FEM can be used as a valid tool to support SHM system design.


