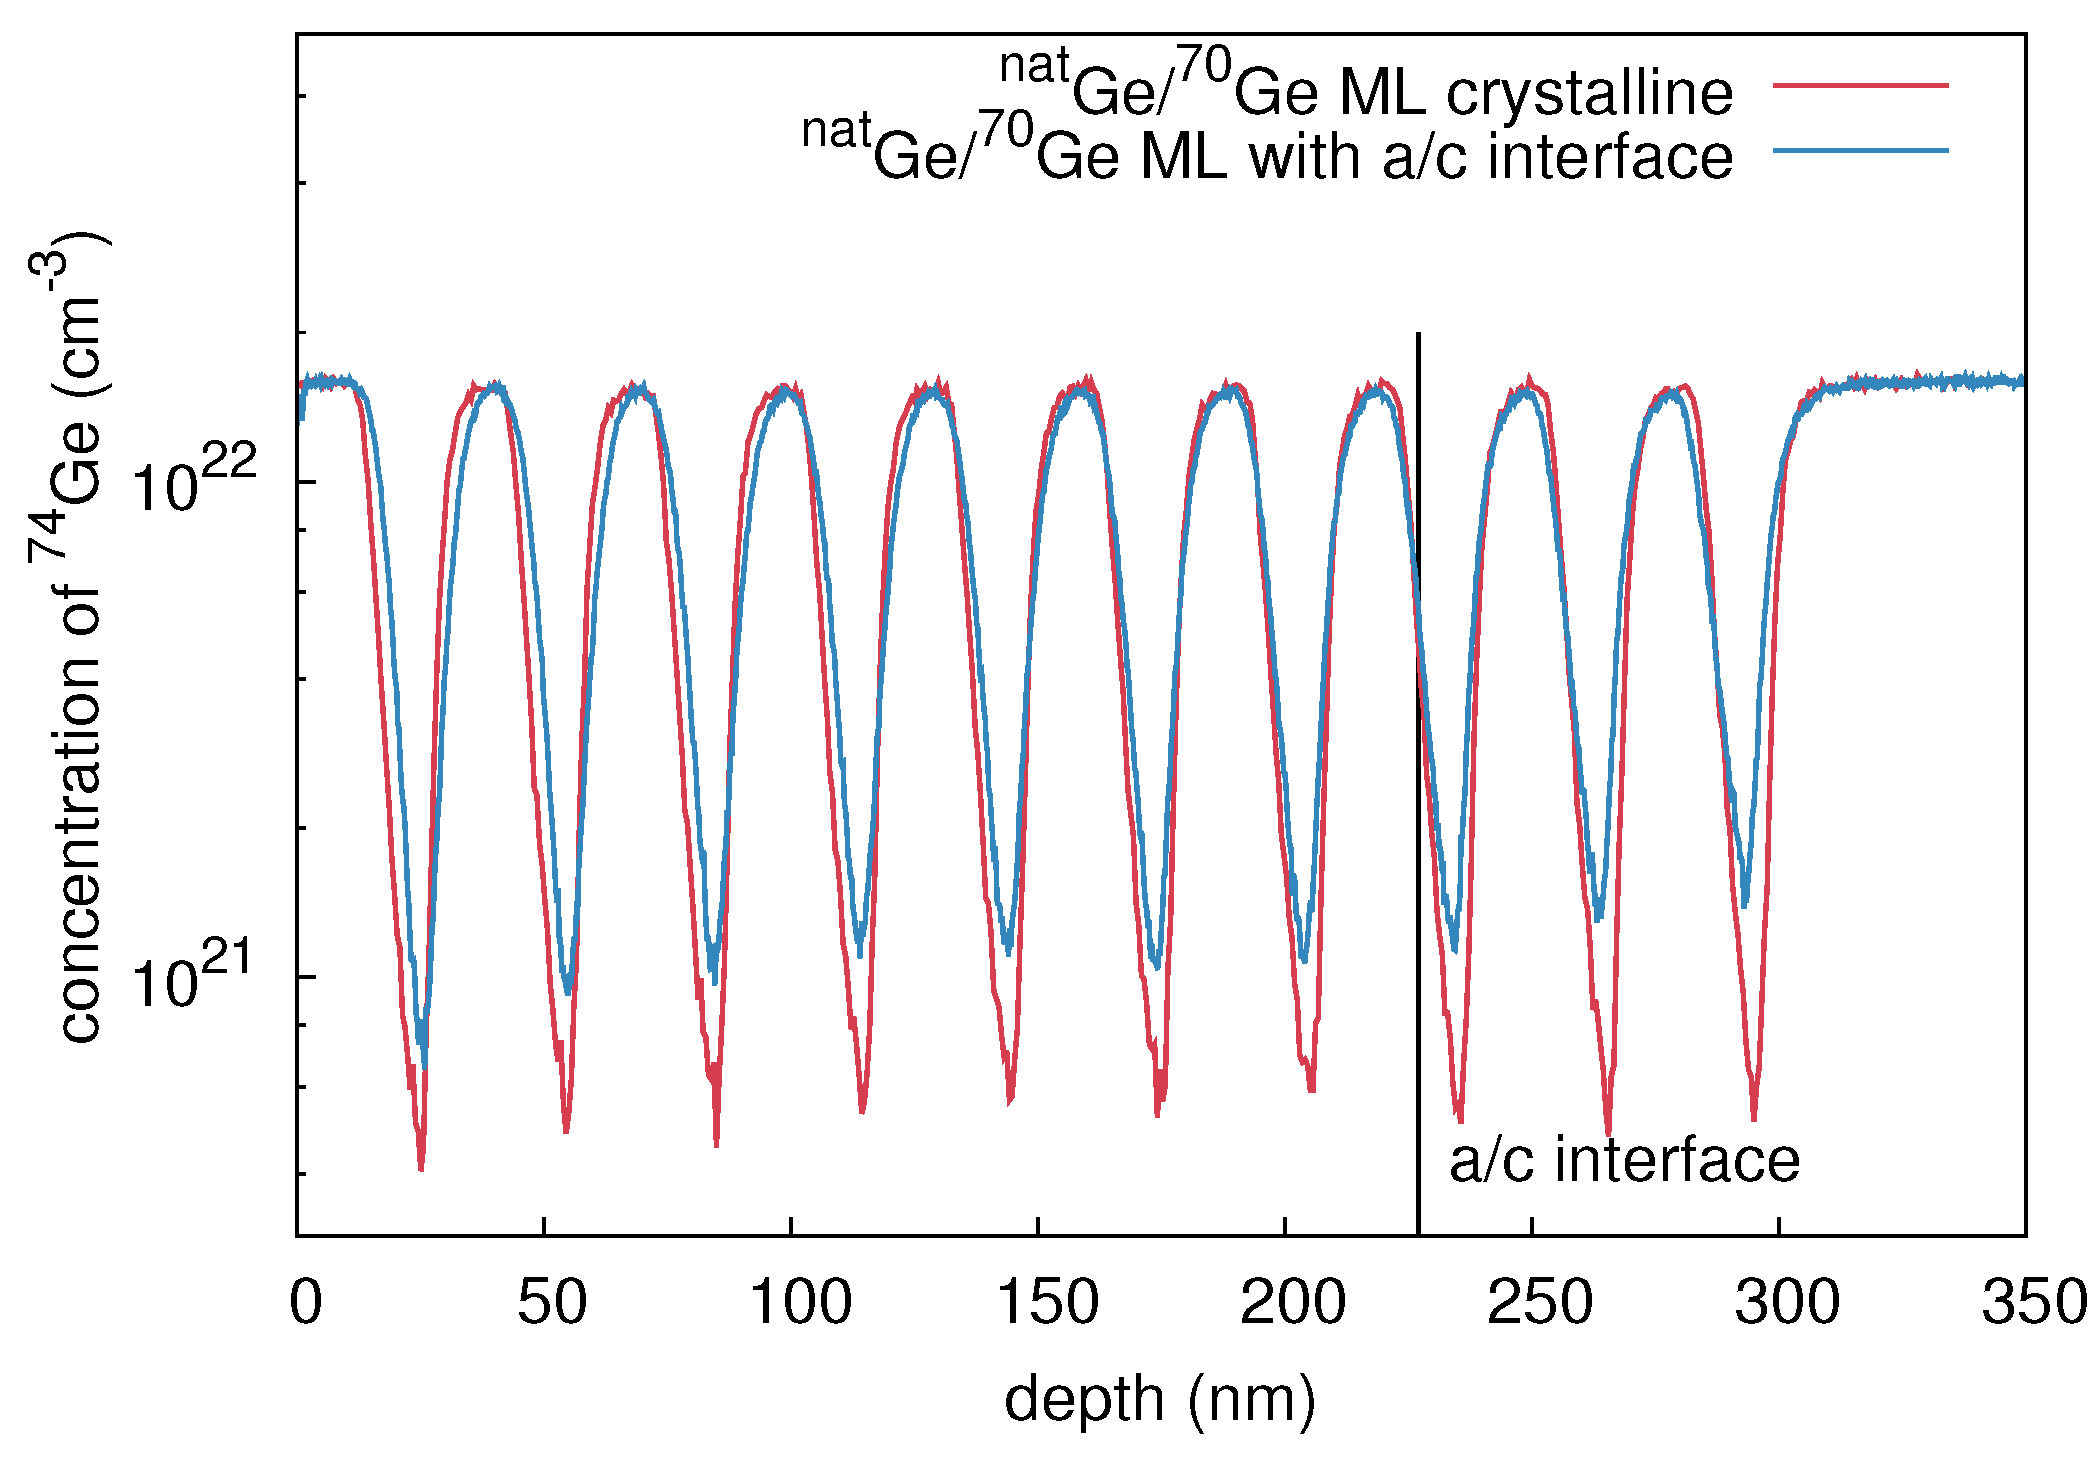
Figure 1.
Ge concentration depth profiles measured with secondary ion mass spectrometry (SIMS) before (red) and after preamorphization (blue) by 310 keV Ge ions at an ion fluence of cm. The molecular beam epitaxy (MBE) grown multilayer stack consists of 10 bilayers of Ge and Ge with an individual layer thickness of about 15 nm.
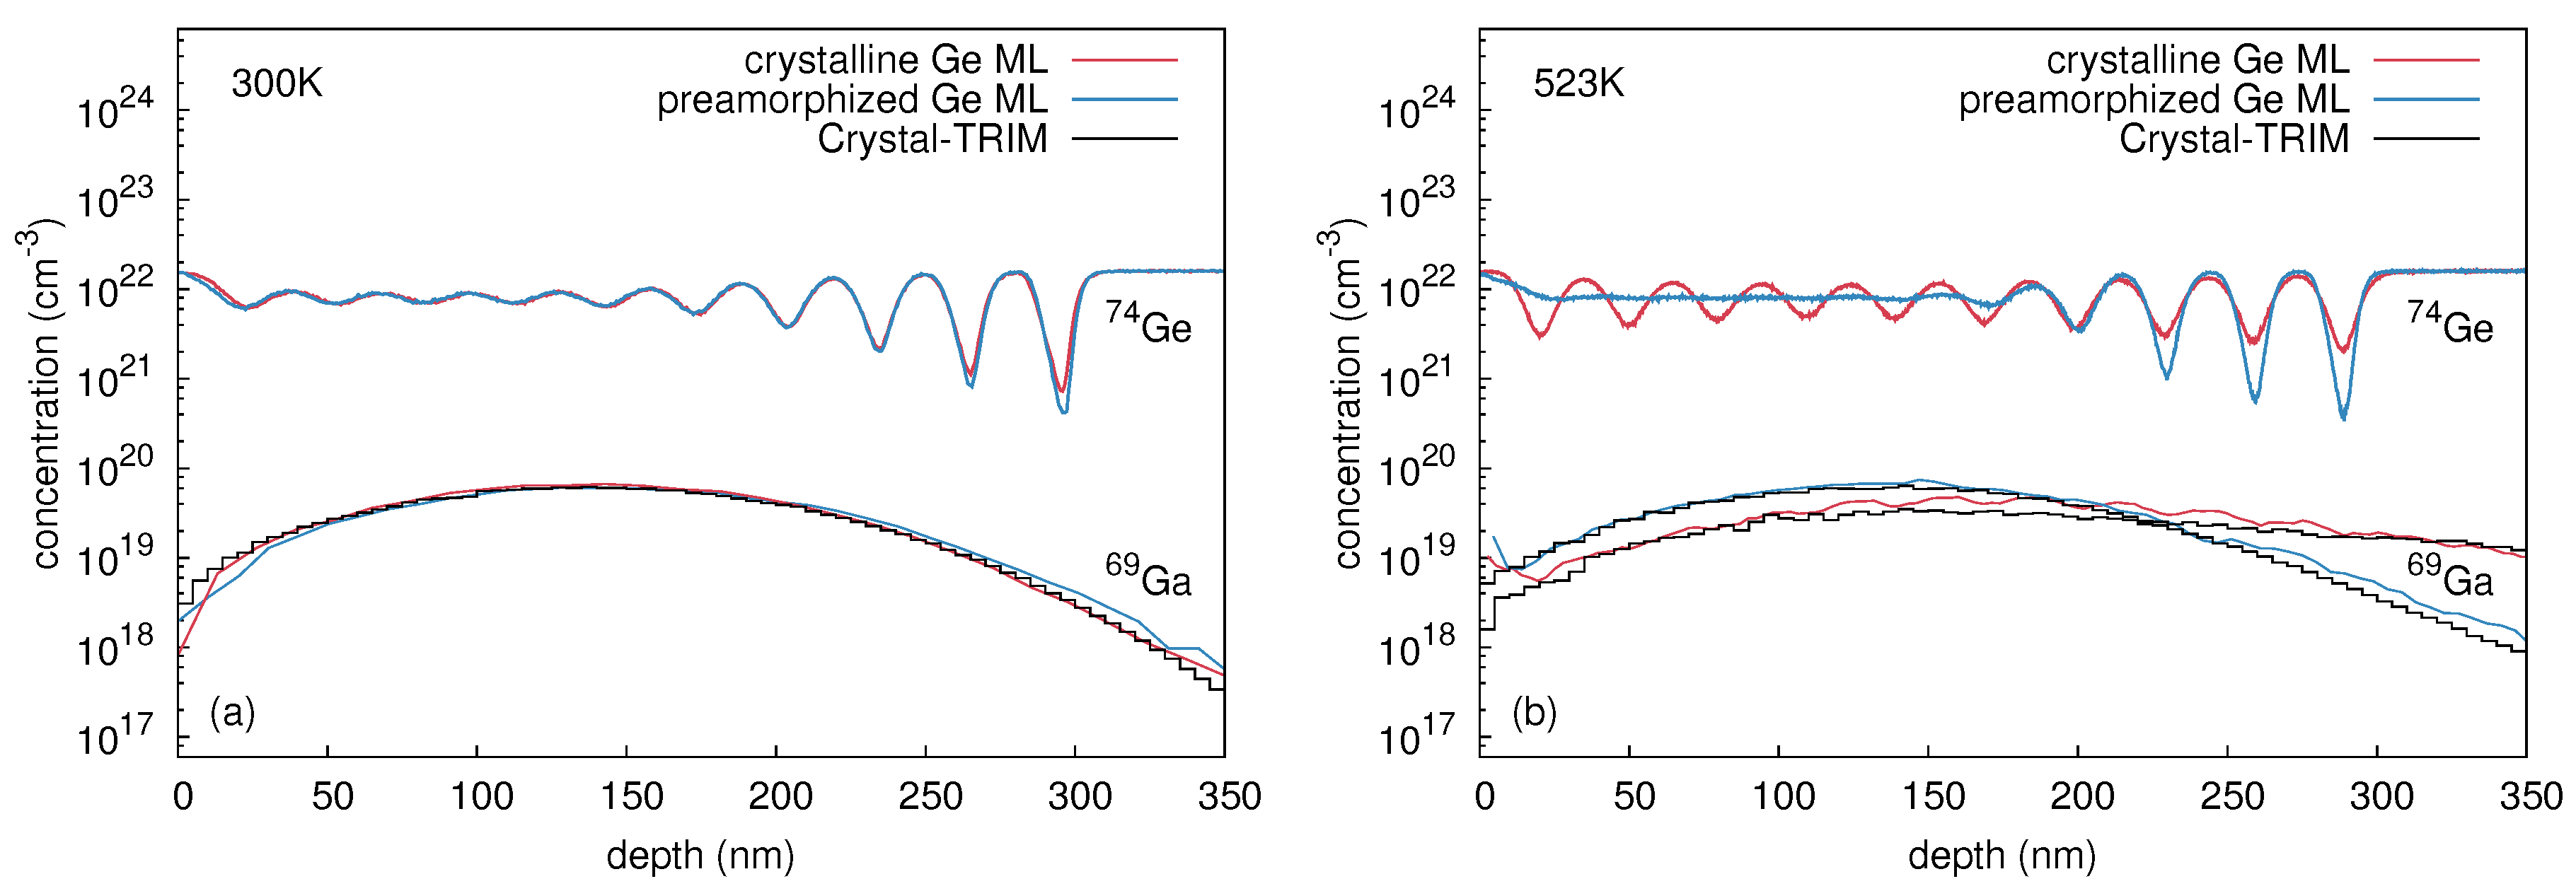
Figure 2.
Concentration profiles of Ge and Ga in initially crystalline (red) and preamorphized (blue) (Ge/Ge) multilayer structures measured by SIMS after implantation with 310 keV Ga at a fluence of 1 × 10 cm and at temperatures of (a) 300 K and (b) 523 K. Additionally, Ga implantation profiles as predicted by Crystal-TRIM are shown (black histogramms). Reproduced from [Radek, M.; Bracht, H.; Posselt, M.; Liedke, B.; Schmidt, B.; Bougeard, D. Temperature dependence of ion-beam mixing in crystalline and amorphous germanium isotope multilayer structures. J. Appl. Phys. 2014, 115, 023506.], with the permission of AIP Publishing.
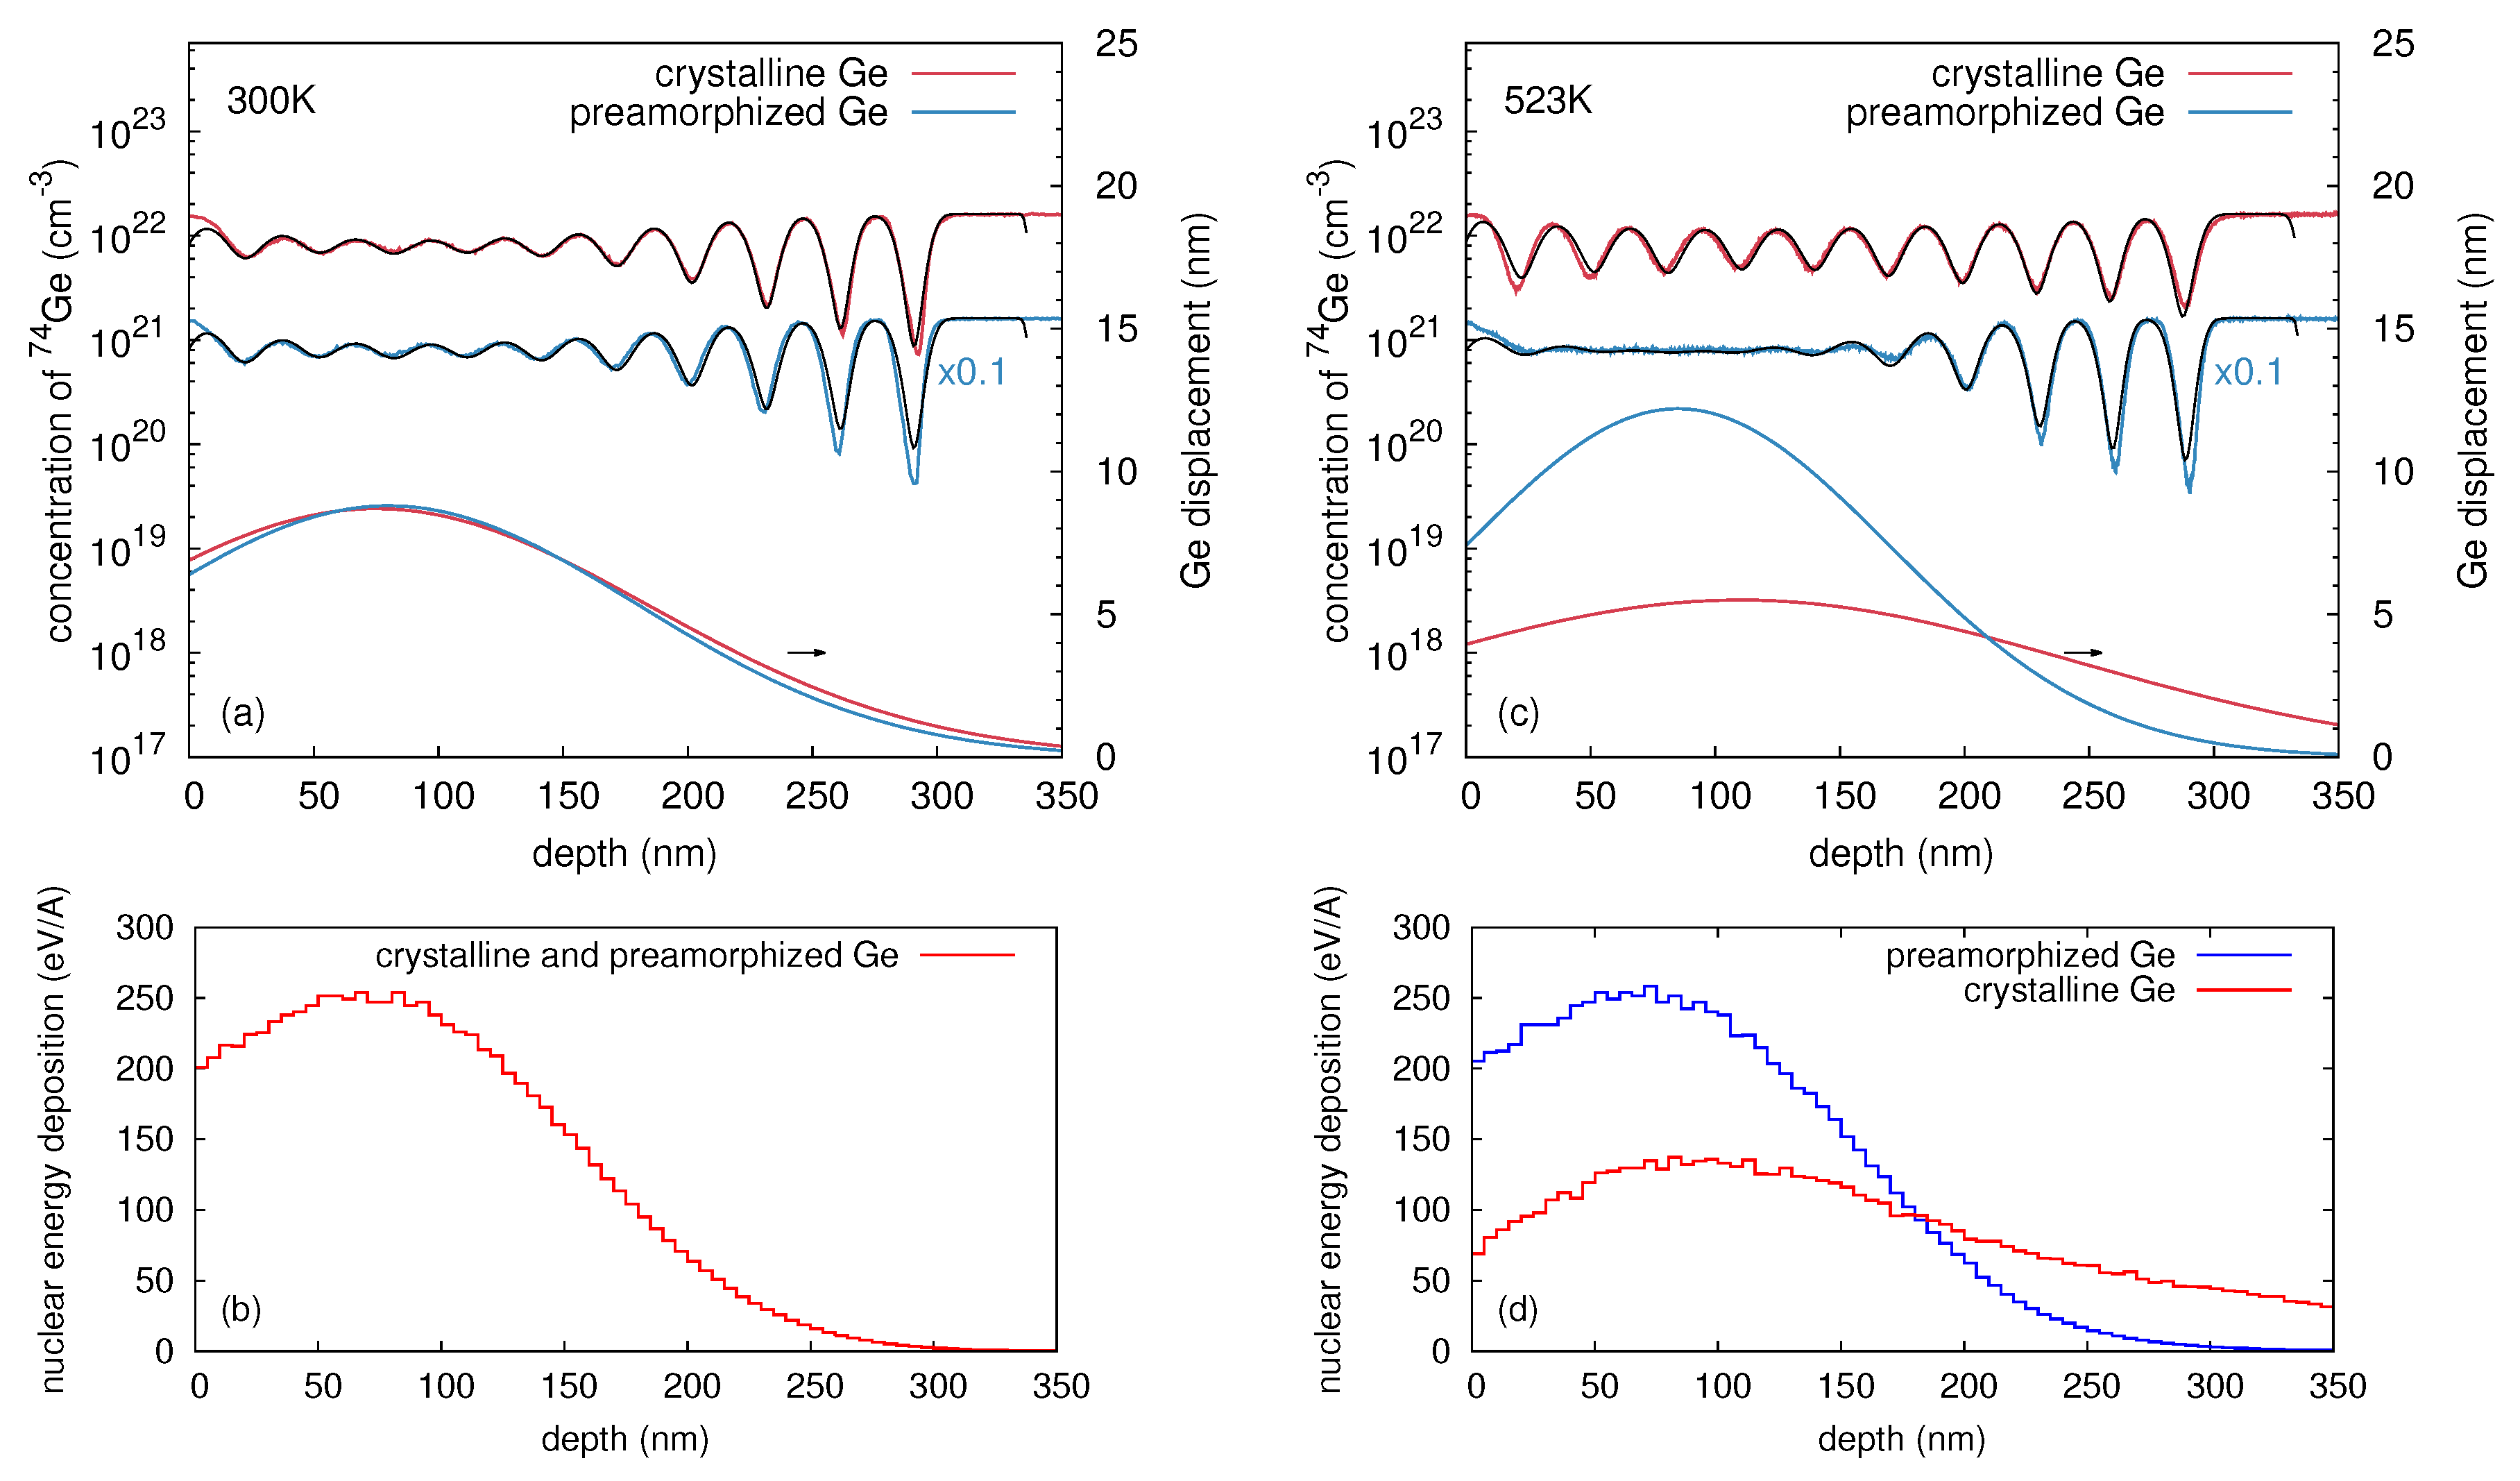
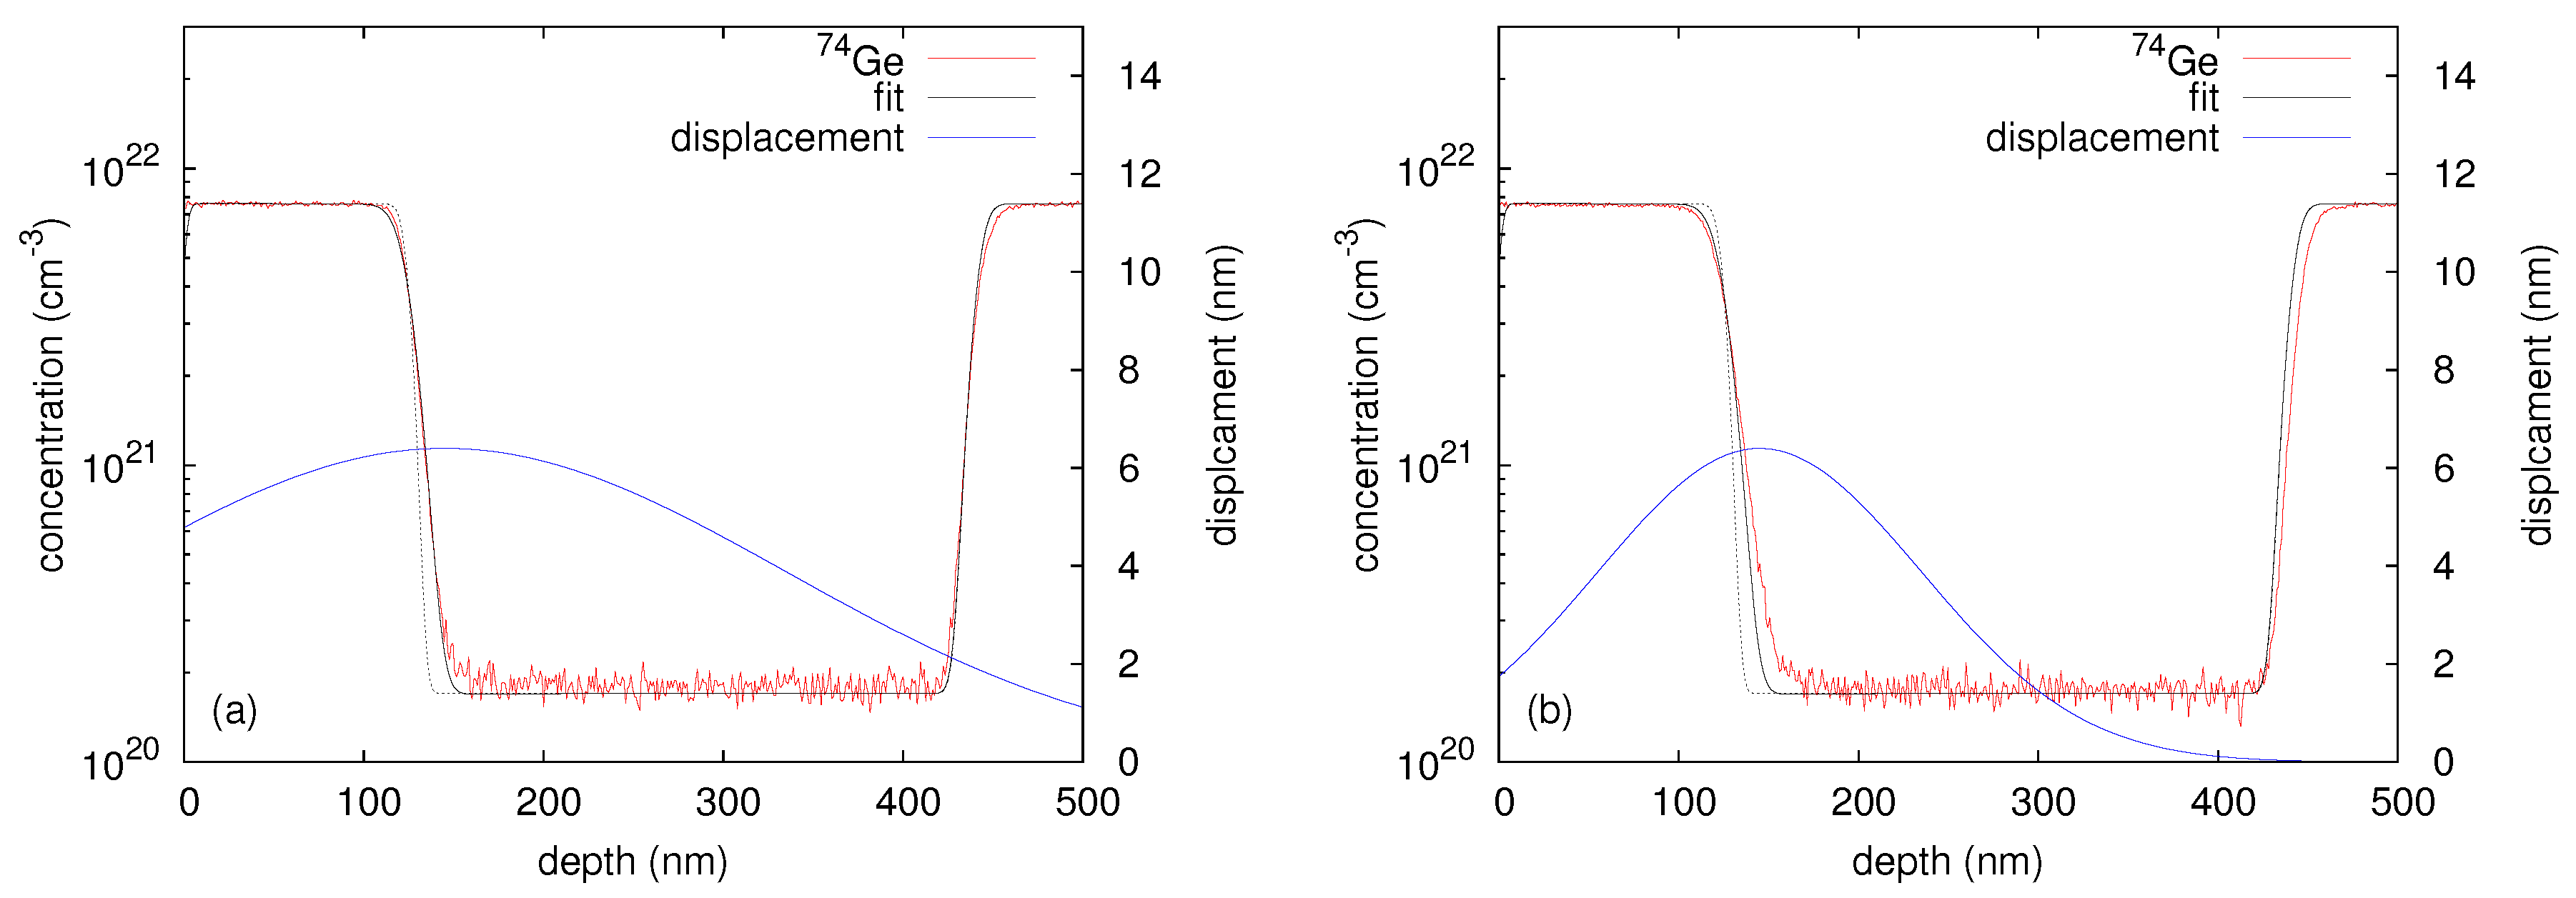
Figure 3.
Best fits (black lines) based on Equations (
2)–(
4) to the implantation induced atomic mixing profiles of initially crystalline (red) and preamorphized (blue) Ge at (
a) 300 K and (
c) 523 K. The
Ge concentration profiles of crystalline and preamorphized Ge are differently scaled for clarity. The lower solid lines show the corresponding Ge displacement function
and are referred to the right axis. The parameters of
for all samples investigated in this work are summarized in
Table 1. The depth profiles of the nuclear energy deposition per target atom calculated by Crystal-TRIM are also depicted (see the corresponding (
b,
d) at the bottom). (
a,
c) were reproduced from [Radek, M.; Bracht, H.; Posselt, M.; Liedke, B.; Schmidt, B.; Bougeard, D. Temperature dependence of ion-beam mixing in crystalline and amorphous germanium isotope multilayer structures.
J. Appl. Phys. 2014,
115, 023506.], with the permission of AIP Publishing.
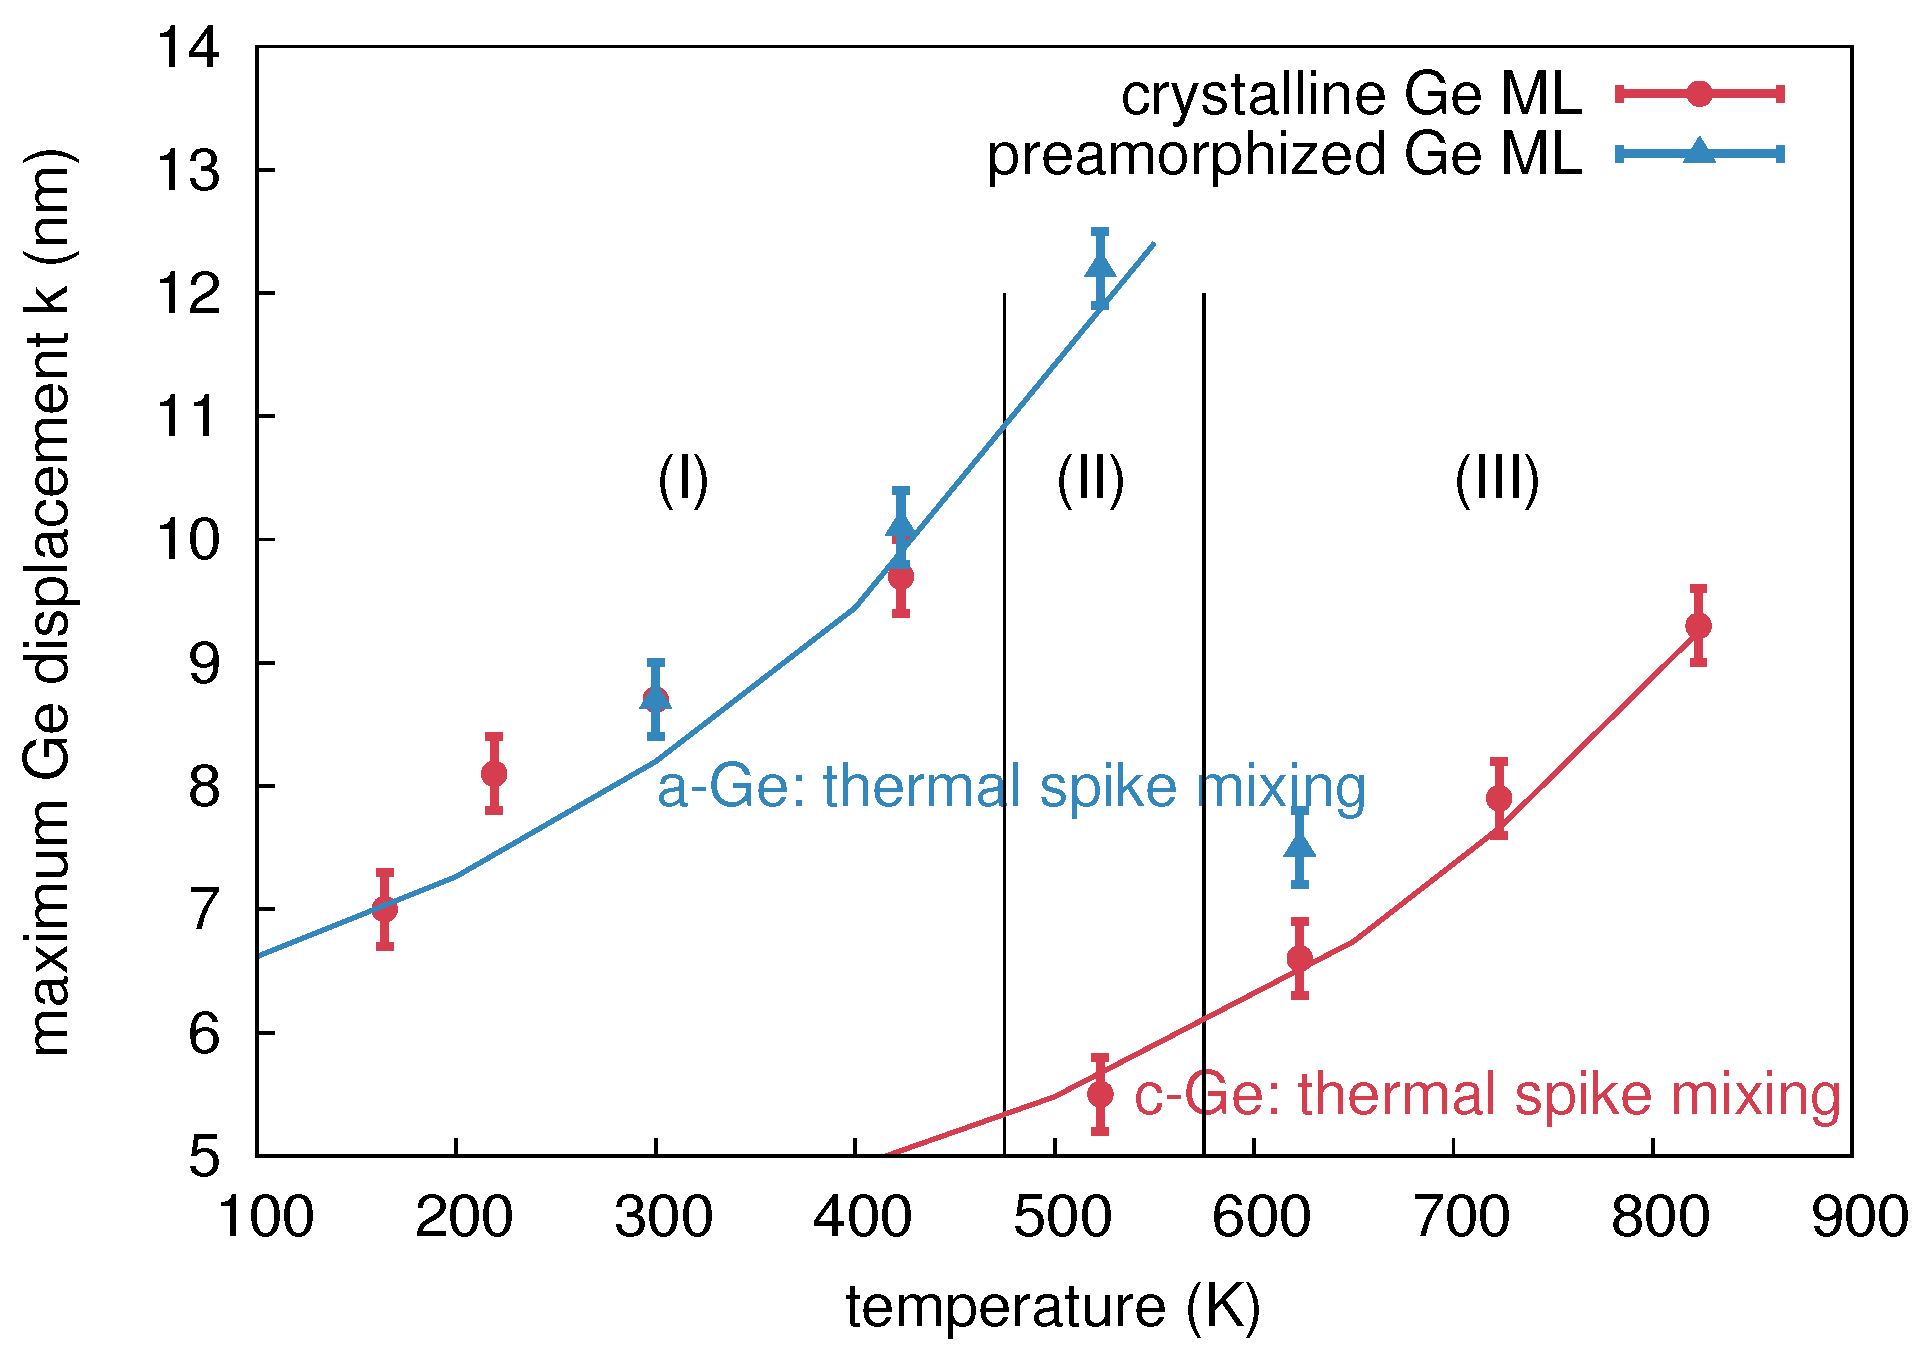
Figure 4.
Temperature dependence of the maximum Ge displacement
k, cf.
Table 1. The data obtained for the initially crystalline (preamorphized) samples are marked in red (blue). Three temperature regimes (I, II, III) with different mixing characteristics are identified. The lines show the results of molecular dynamics simulations (cf.
Section 5) of thermal spike mixing in crystalline (red) and amorphous (blue) Ge.
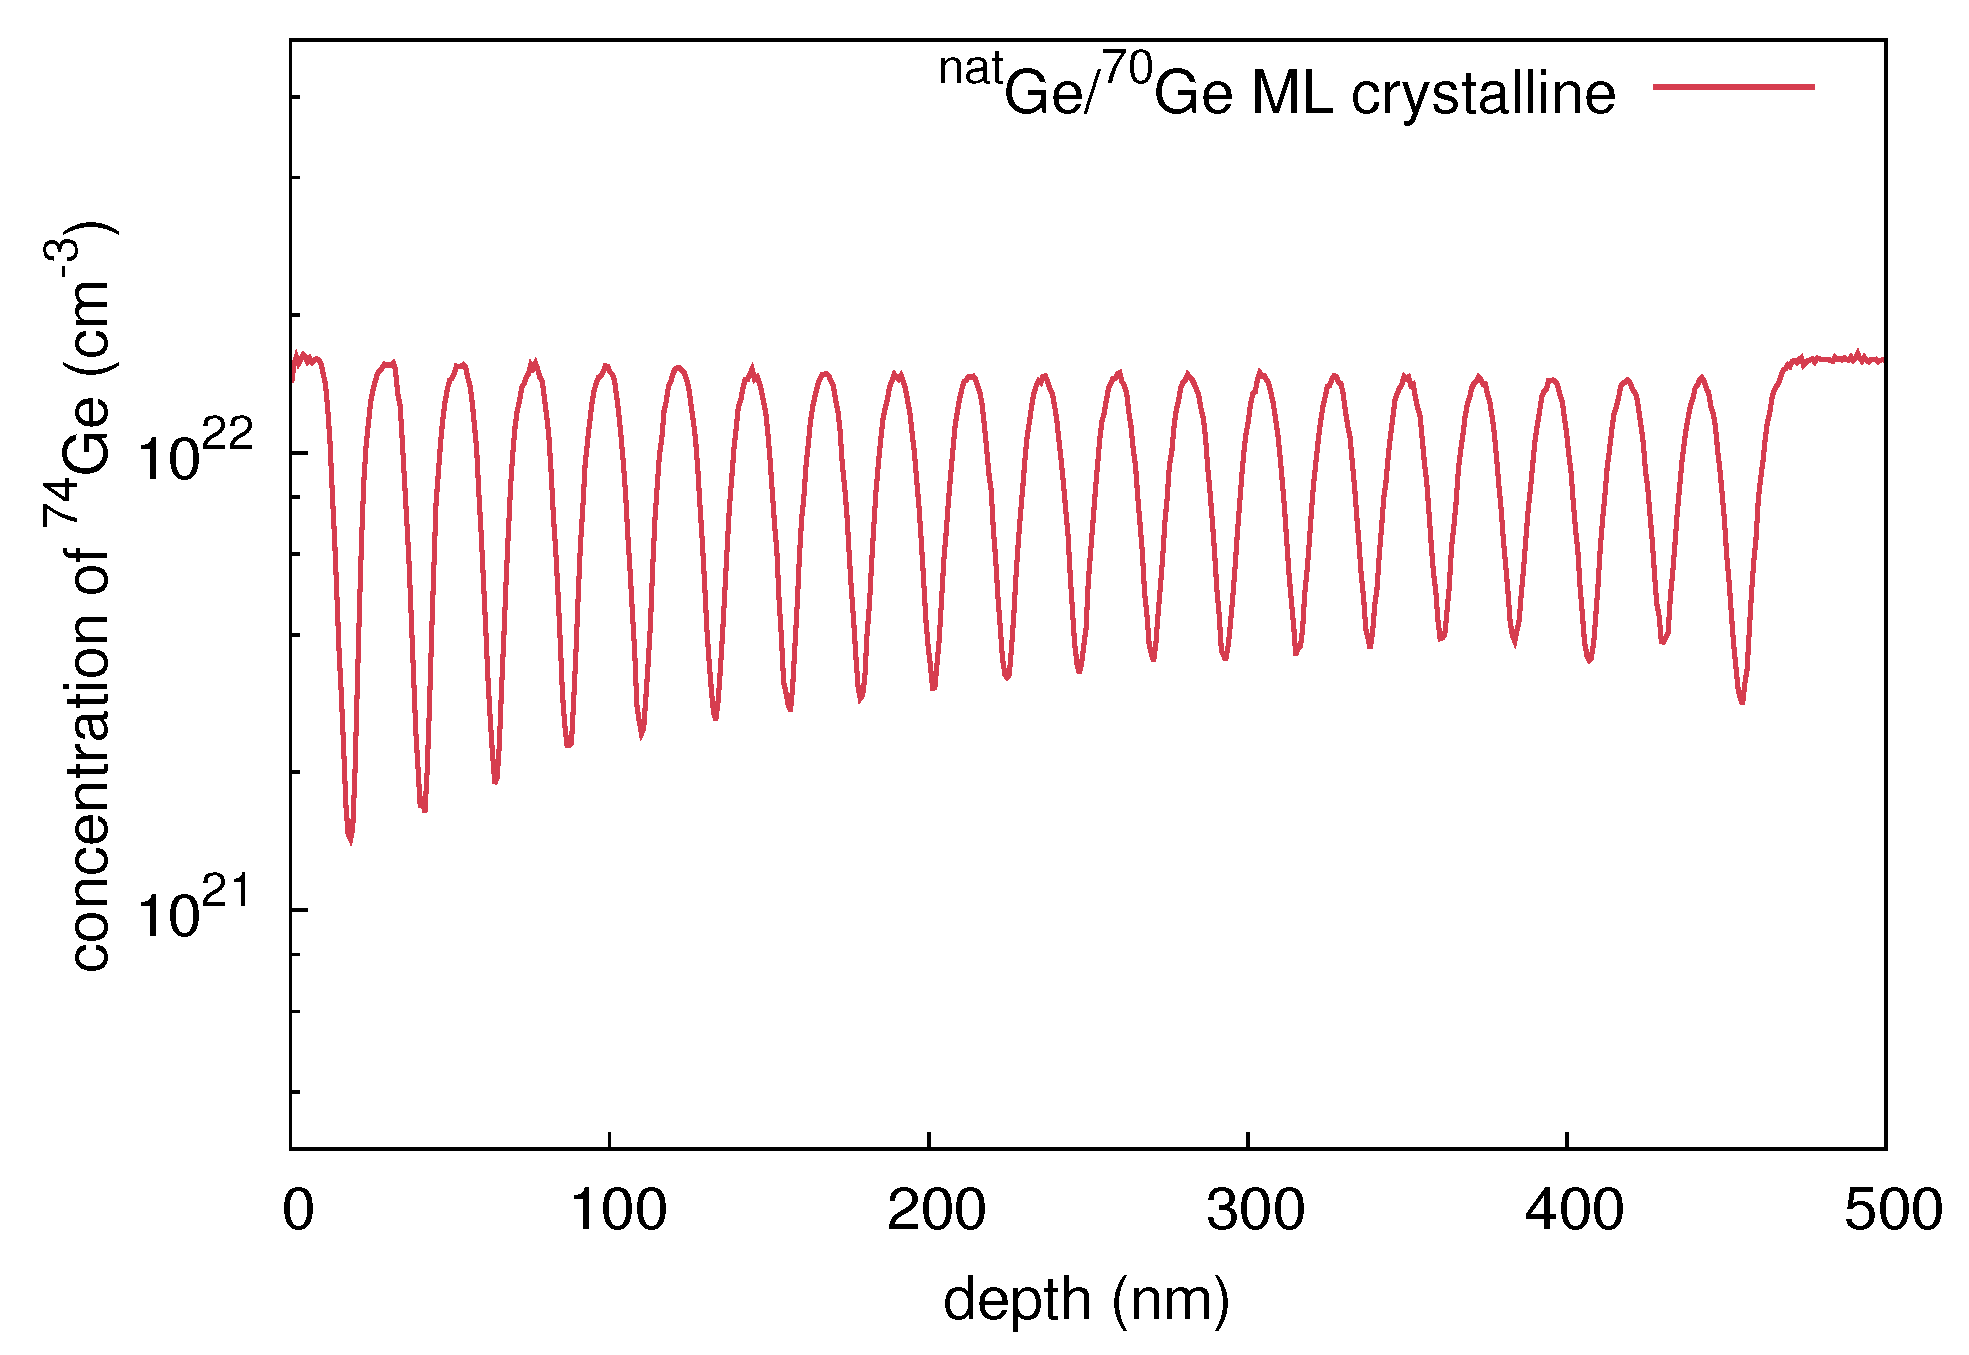
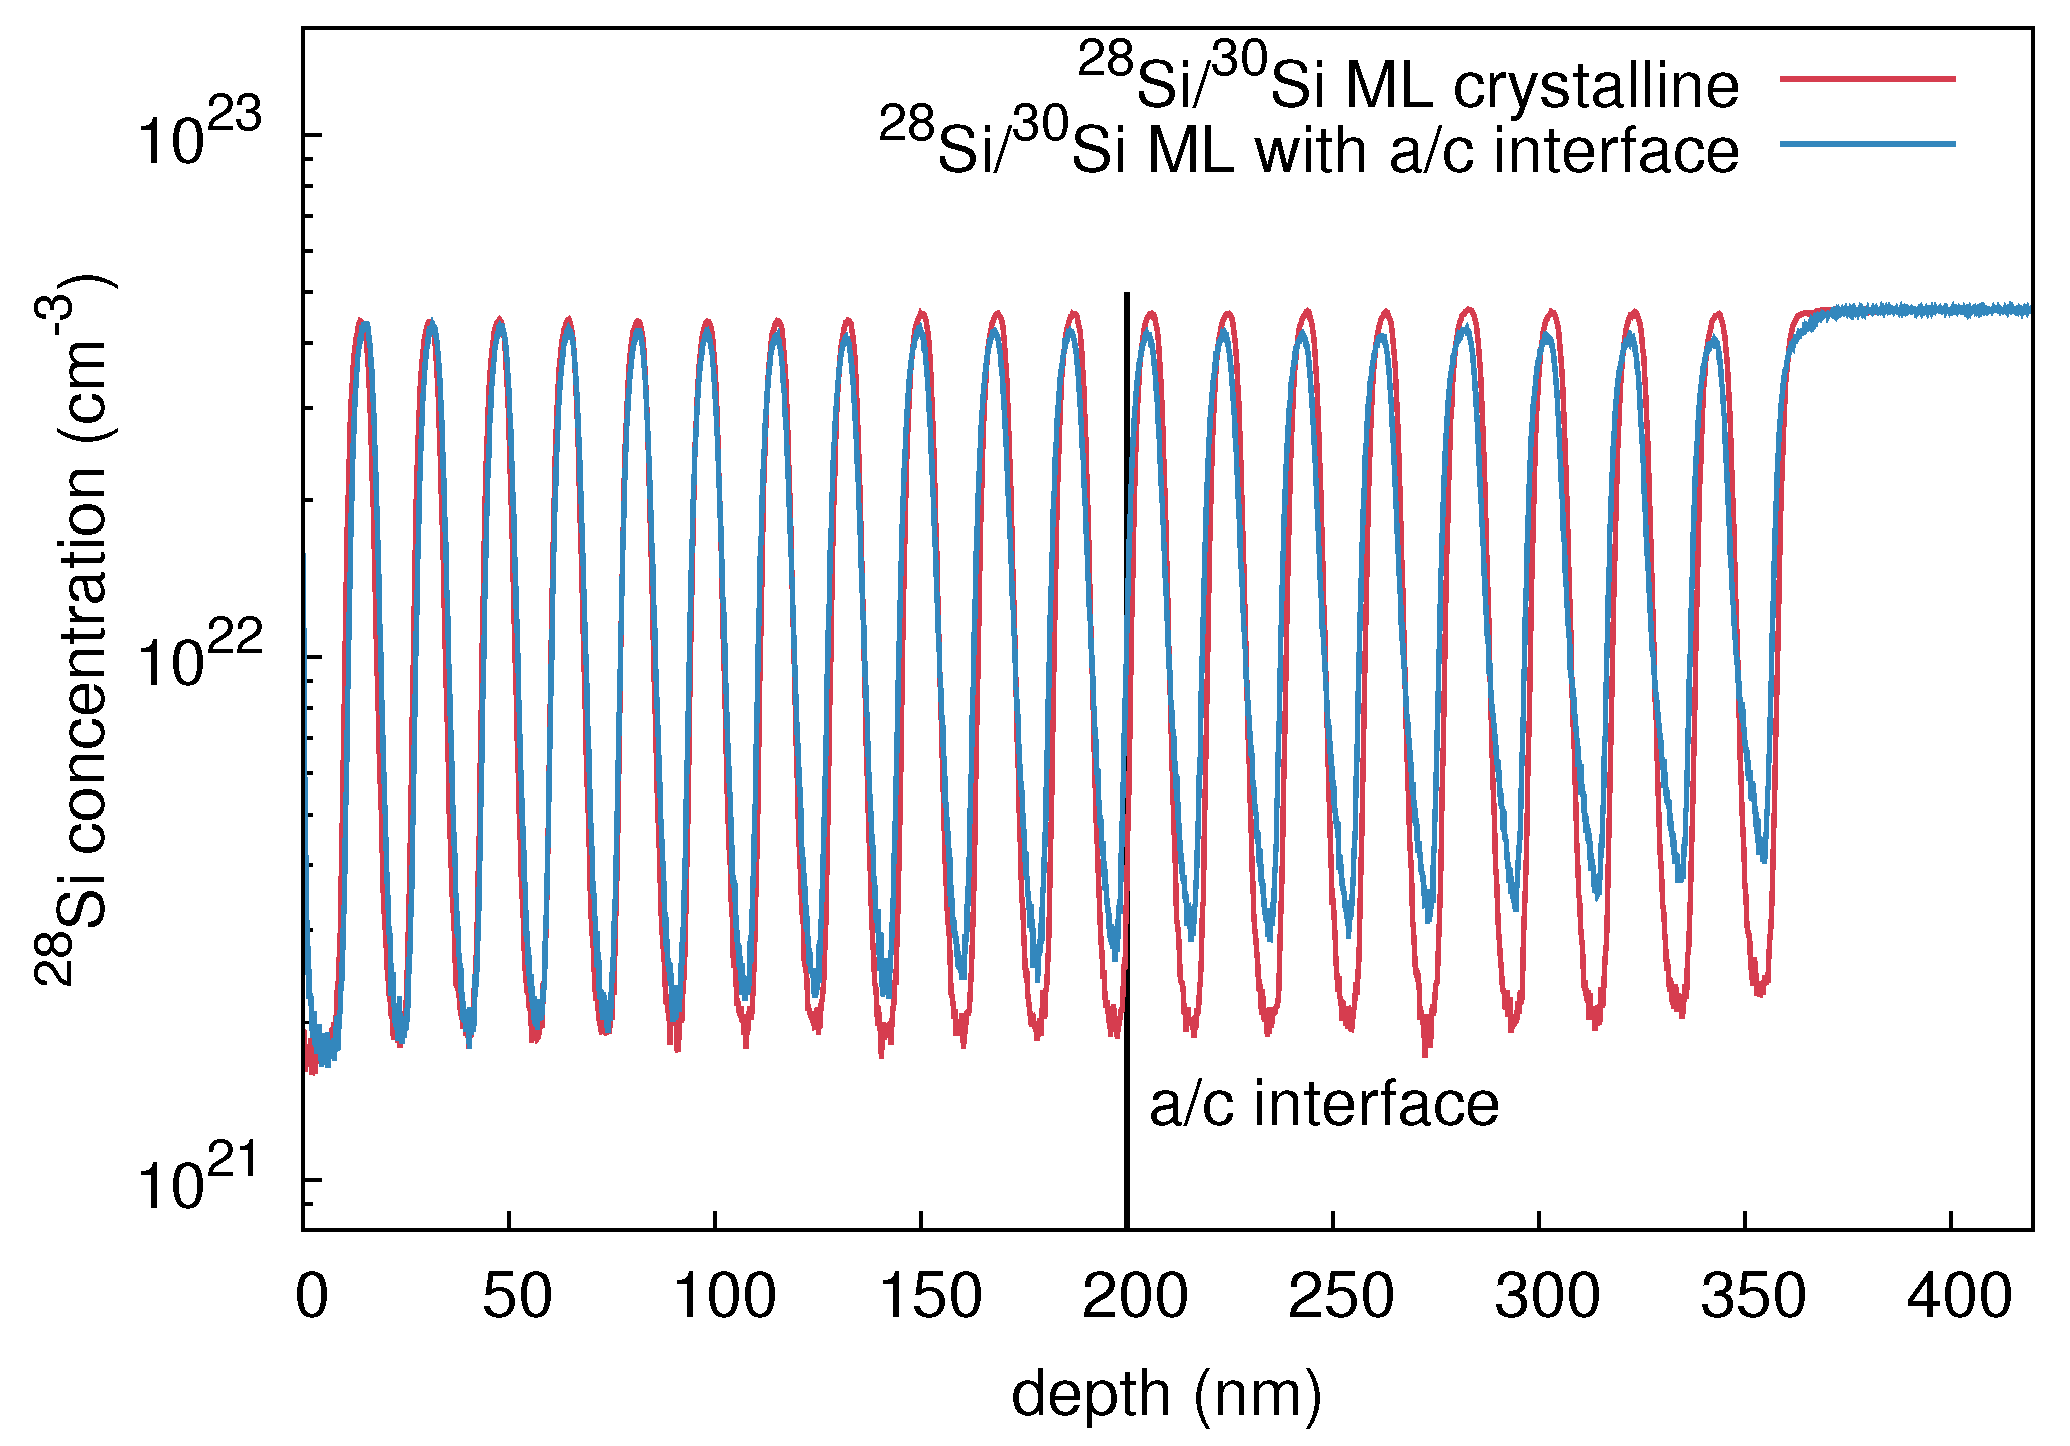
Figure 5.
Ge concentration depth profiles measured by SIMS. The crystalline multilayer structure grown by MBE contains 20 bilayers of Ge and Ge with a layer thickness of about 10 nm.
Figure 5.
Ge concentration depth profiles measured by SIMS. The crystalline multilayer structure grown by MBE contains 20 bilayers of Ge and Ge with a layer thickness of about 10 nm.
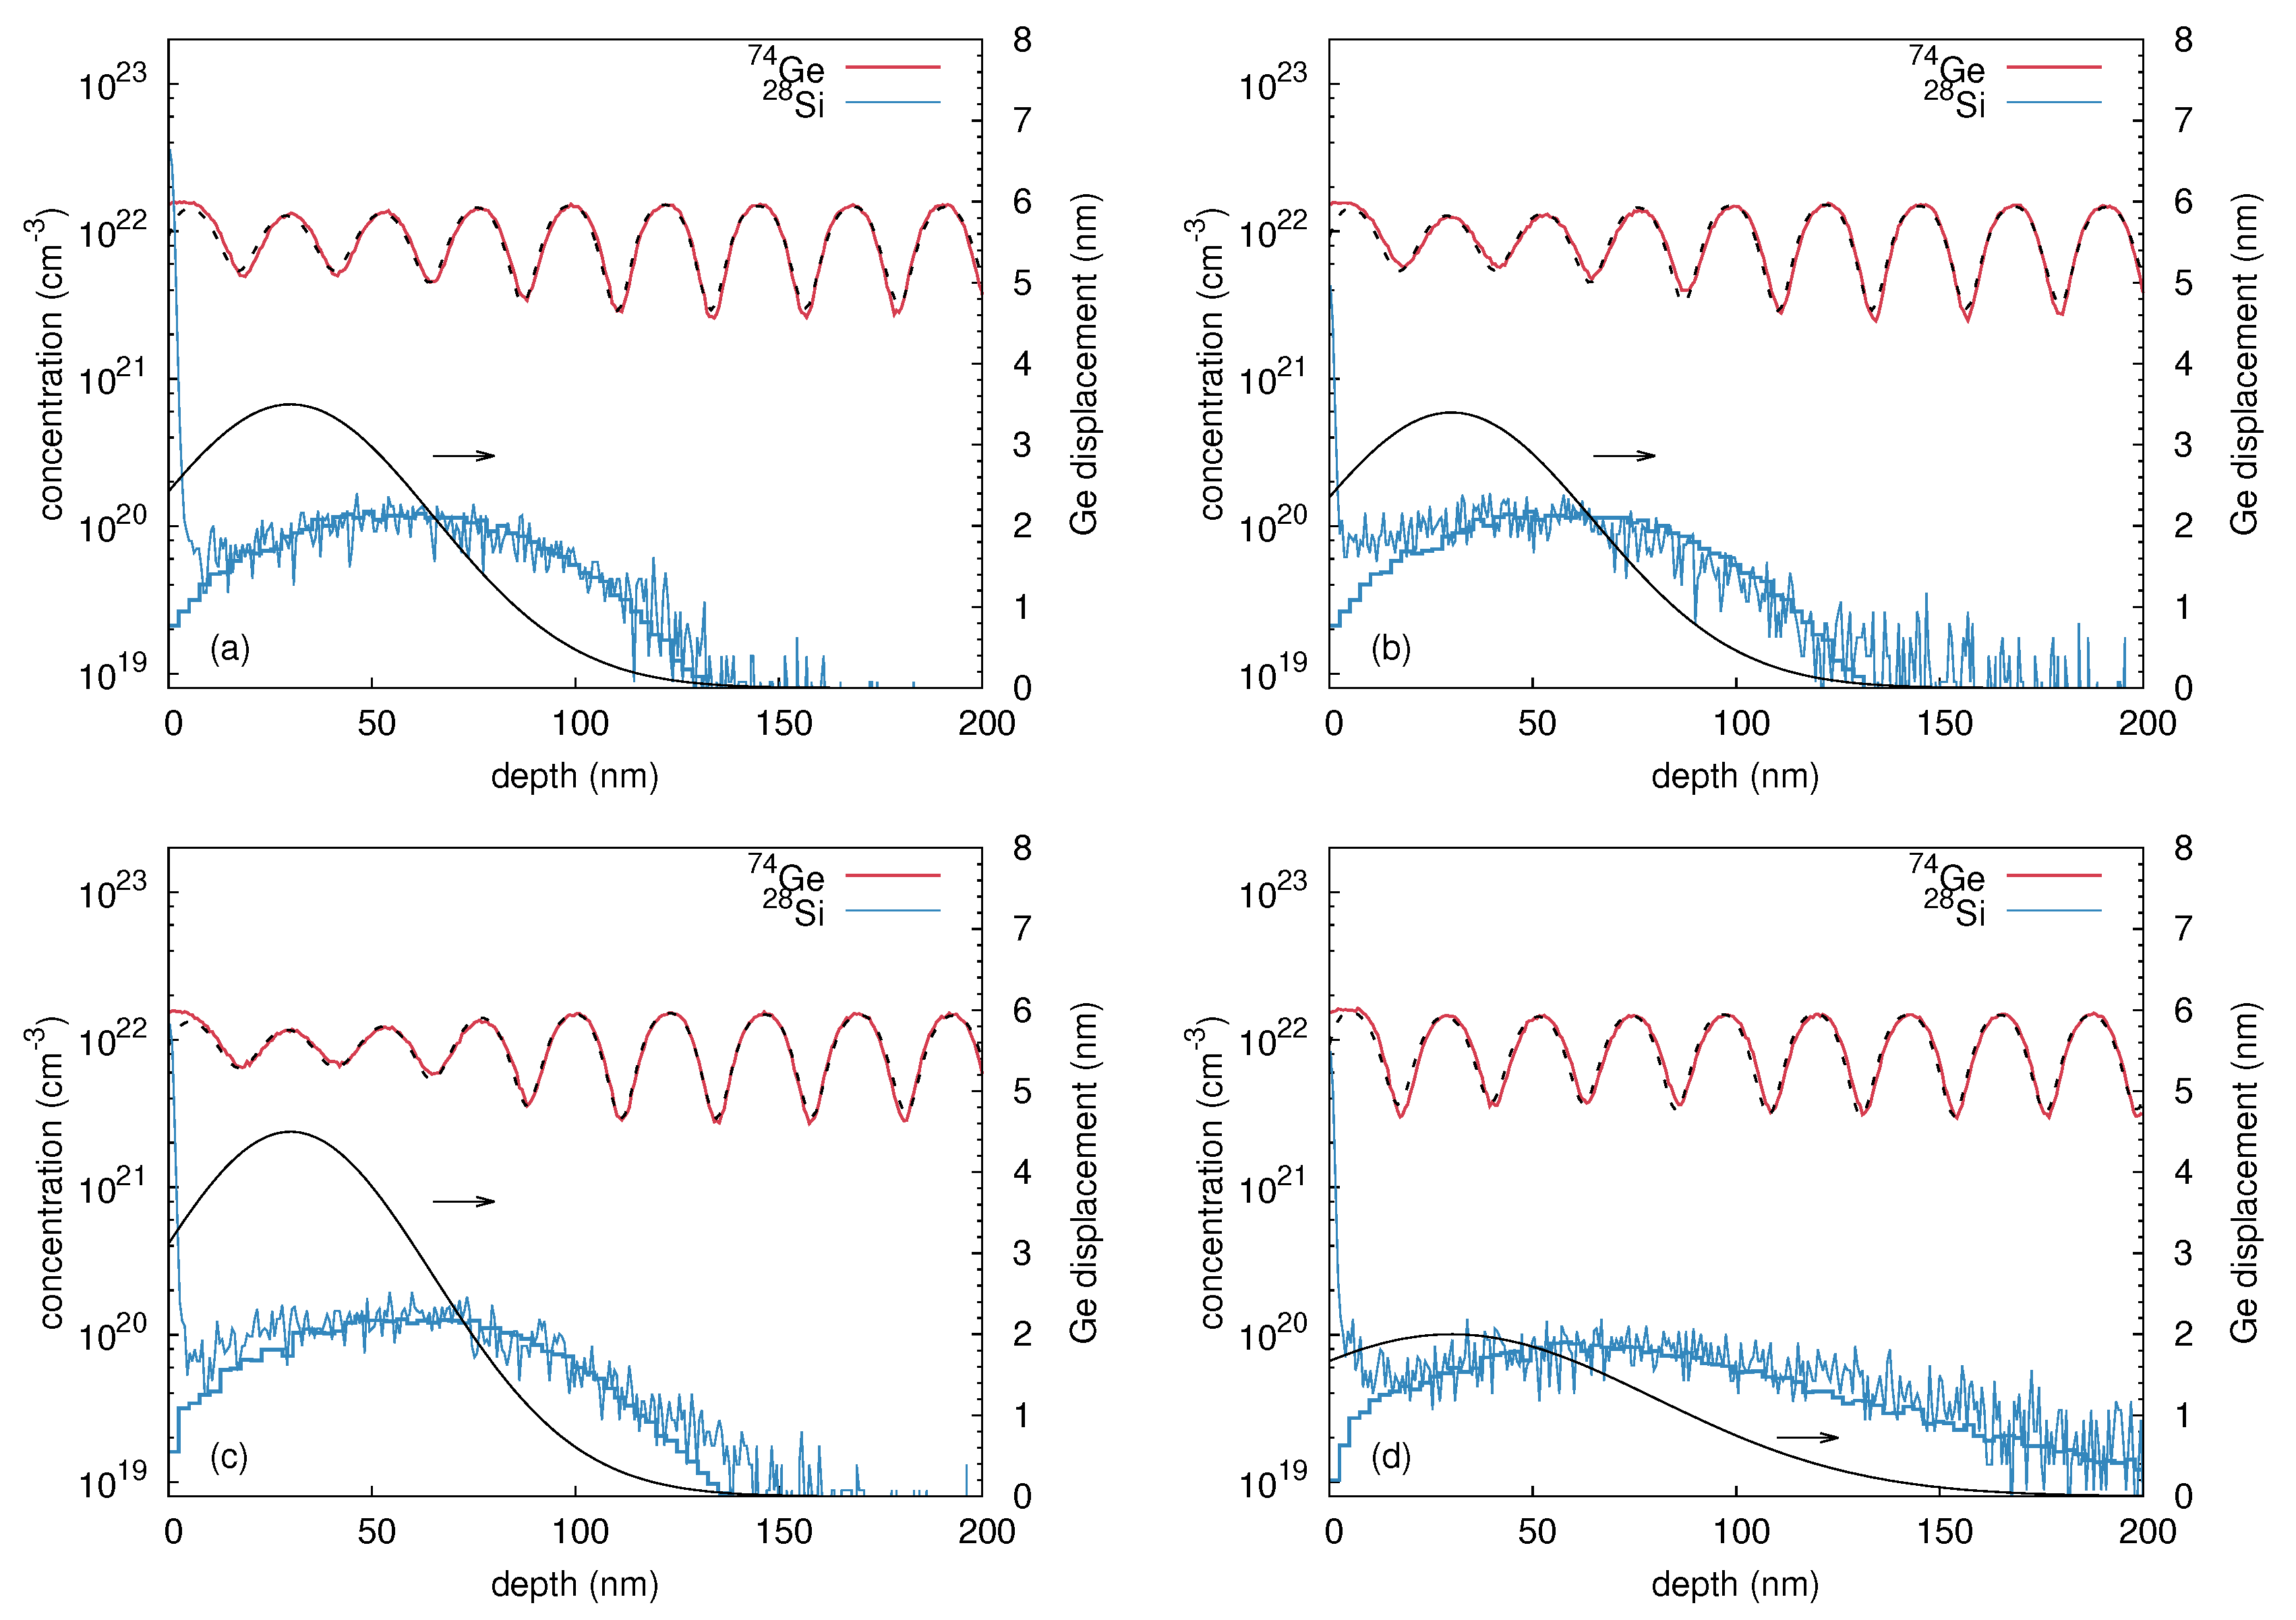
Figure 6.
Ge concentration profiles (red) measured by SIMS, after Si implantation with 60 keV, at temperatures of (a,b) 300 K and (c,d) 523 K with (a,c) a high ion flux of 10 cm s and (b,d) a low ion flux of 5 × 10 cm s. The best fits obtained by the convolution integral analysis are shown by black dashed lines. The lower black lines show the corresponding Ge displacement function and are referred to the right axis. The Si implantation profiles are shown in blue, together with the results of Crystal-TRIM simulations.
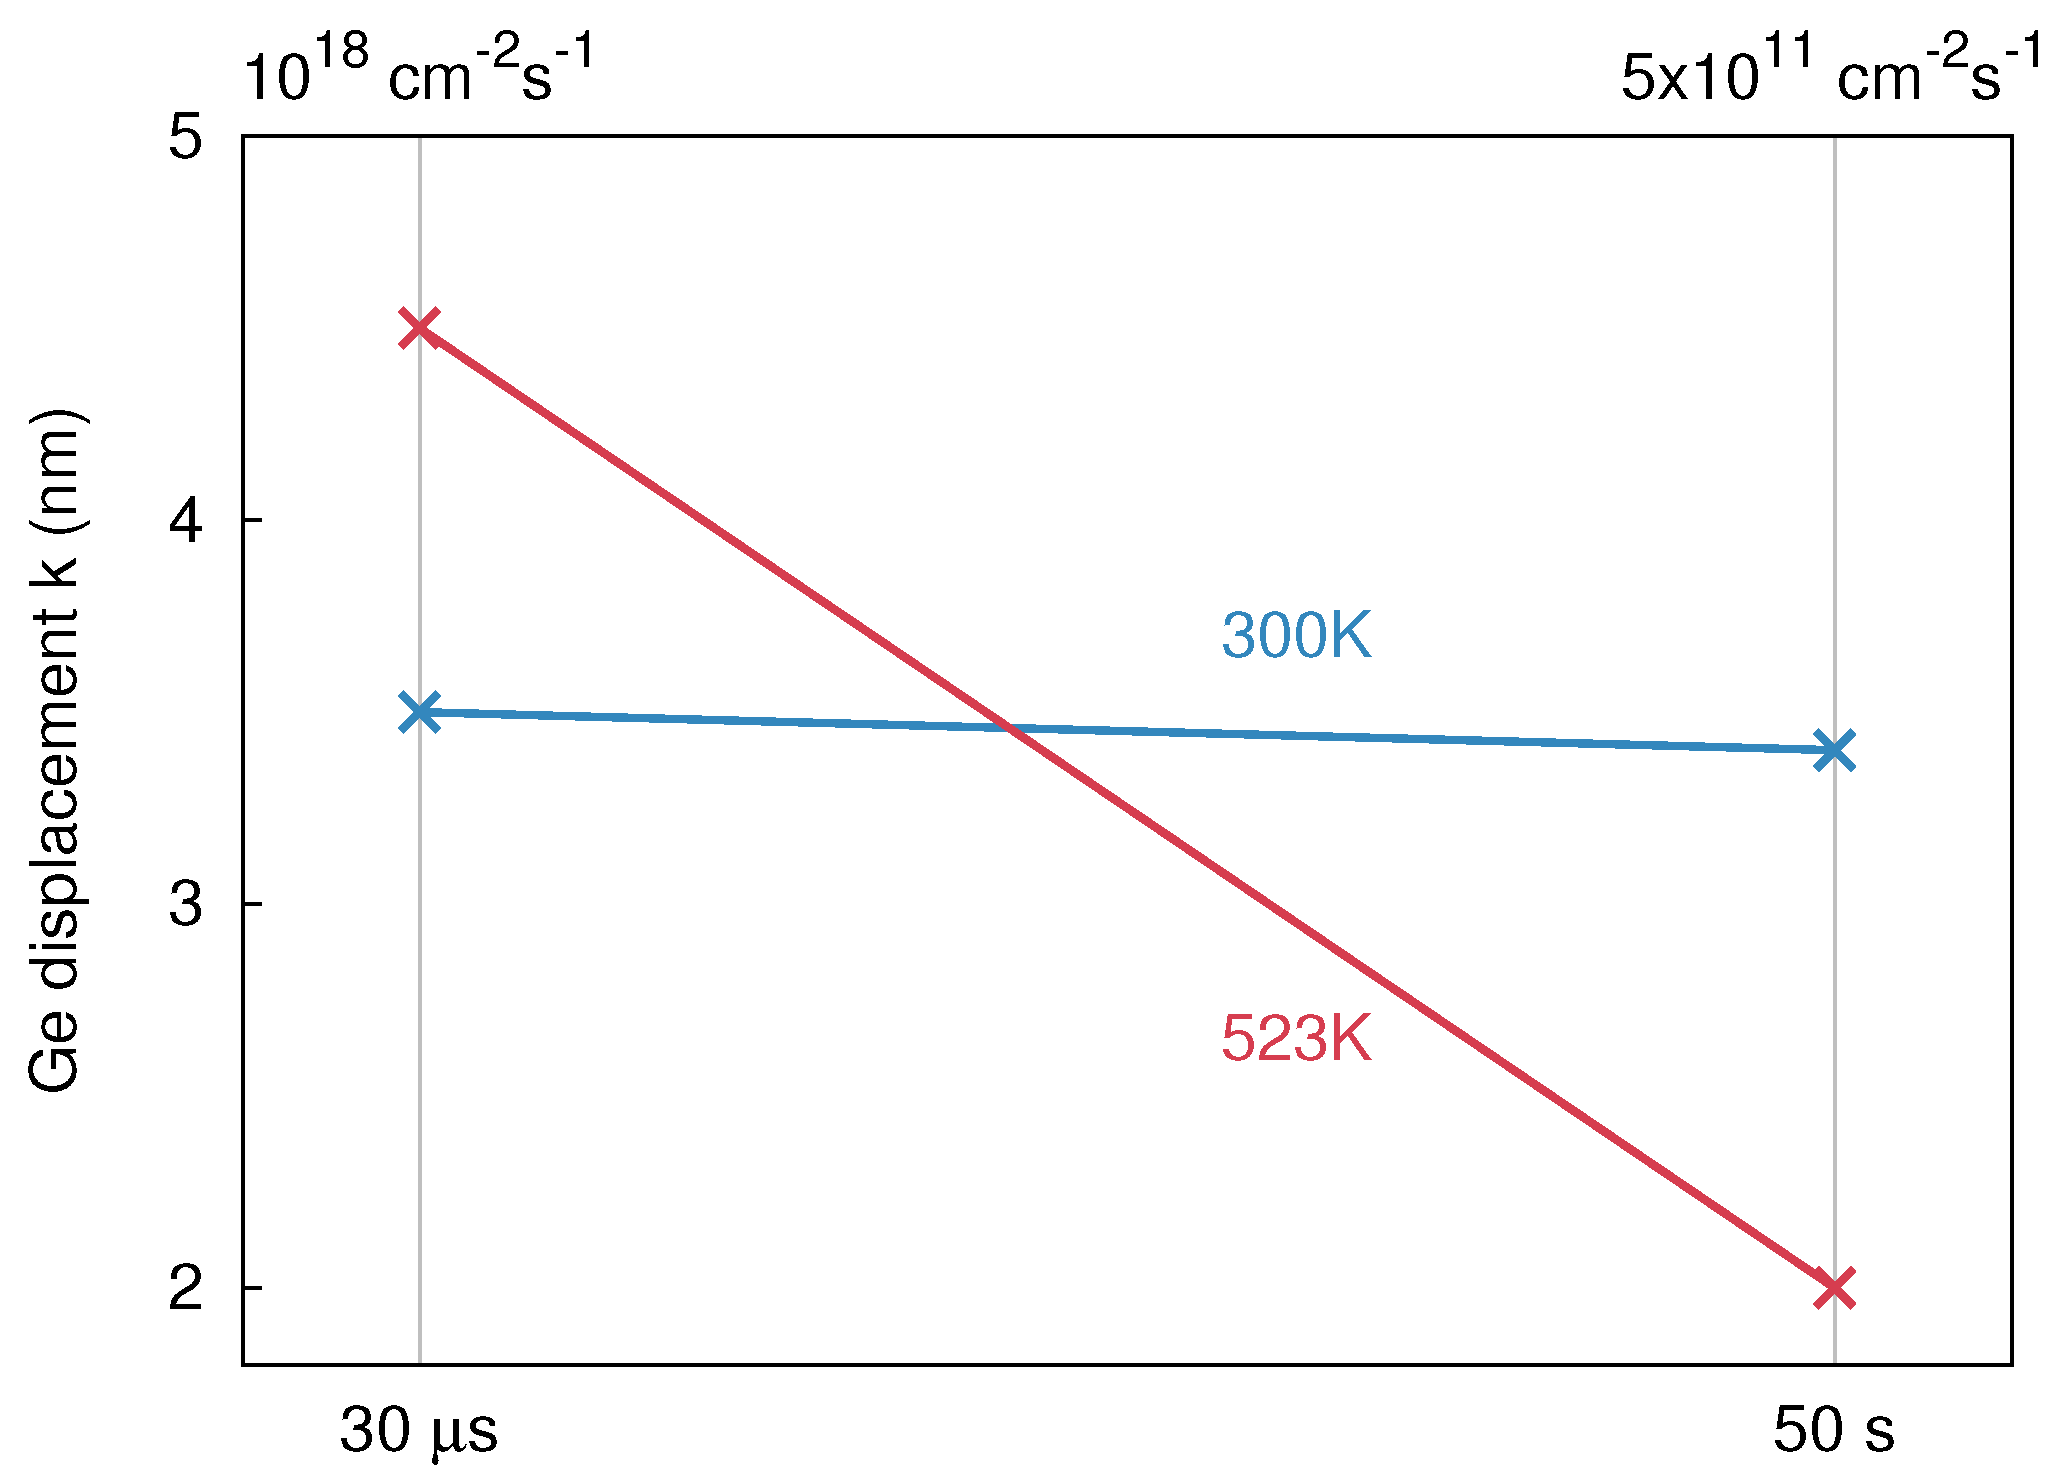
Figure 7.
Maximum Ge displacement after 60 keV
Si implantation with ion fluxes of 10
cm
s
(30
s) and
cm
s
(50 s), at two different temperatures (300 and 523 K), cf.
Table 2. The ion fluxes are translated into a time delay between consecutive ion impacts into the same region.
Figure 7.
Maximum Ge displacement after 60 keV
Si implantation with ion fluxes of 10
cm
s
(30
s) and
cm
s
(50 s), at two different temperatures (300 and 523 K), cf.
Table 2. The ion fluxes are translated into a time delay between consecutive ion impacts into the same region.
Figure 8.
Si concentration depth profiles measured with SIMS before (red) and after preamorphization (blue). The preamorphization was performed by 150 keV Si ion implantation at a fluence of 3 × 10 cm. Reproduced from [Radek, M.; Bracht, H.; Liedke, B.; Böttger, R.; Posselt, M. Ion-beam induced atomic mixing in isotopically controlled silicon multilayers. J. Appl. Phys. 2016, 120, 185701.], with the permission of AIP Publishing.
Figure 9.
Concentration profiles of Si and Ge in initially crystalline (red) and preamorphized (blue) (Si/Si) multilayer structures measured by SIMS after implantation with 180 keV Ge, a fluence of 3 × 10 cm, and at temperatures of (a) 393 K and (b) 673 K. The numerical prediction of the Ge implantation profiles by Crystal-TRIM calculations is shown by black histogramms.
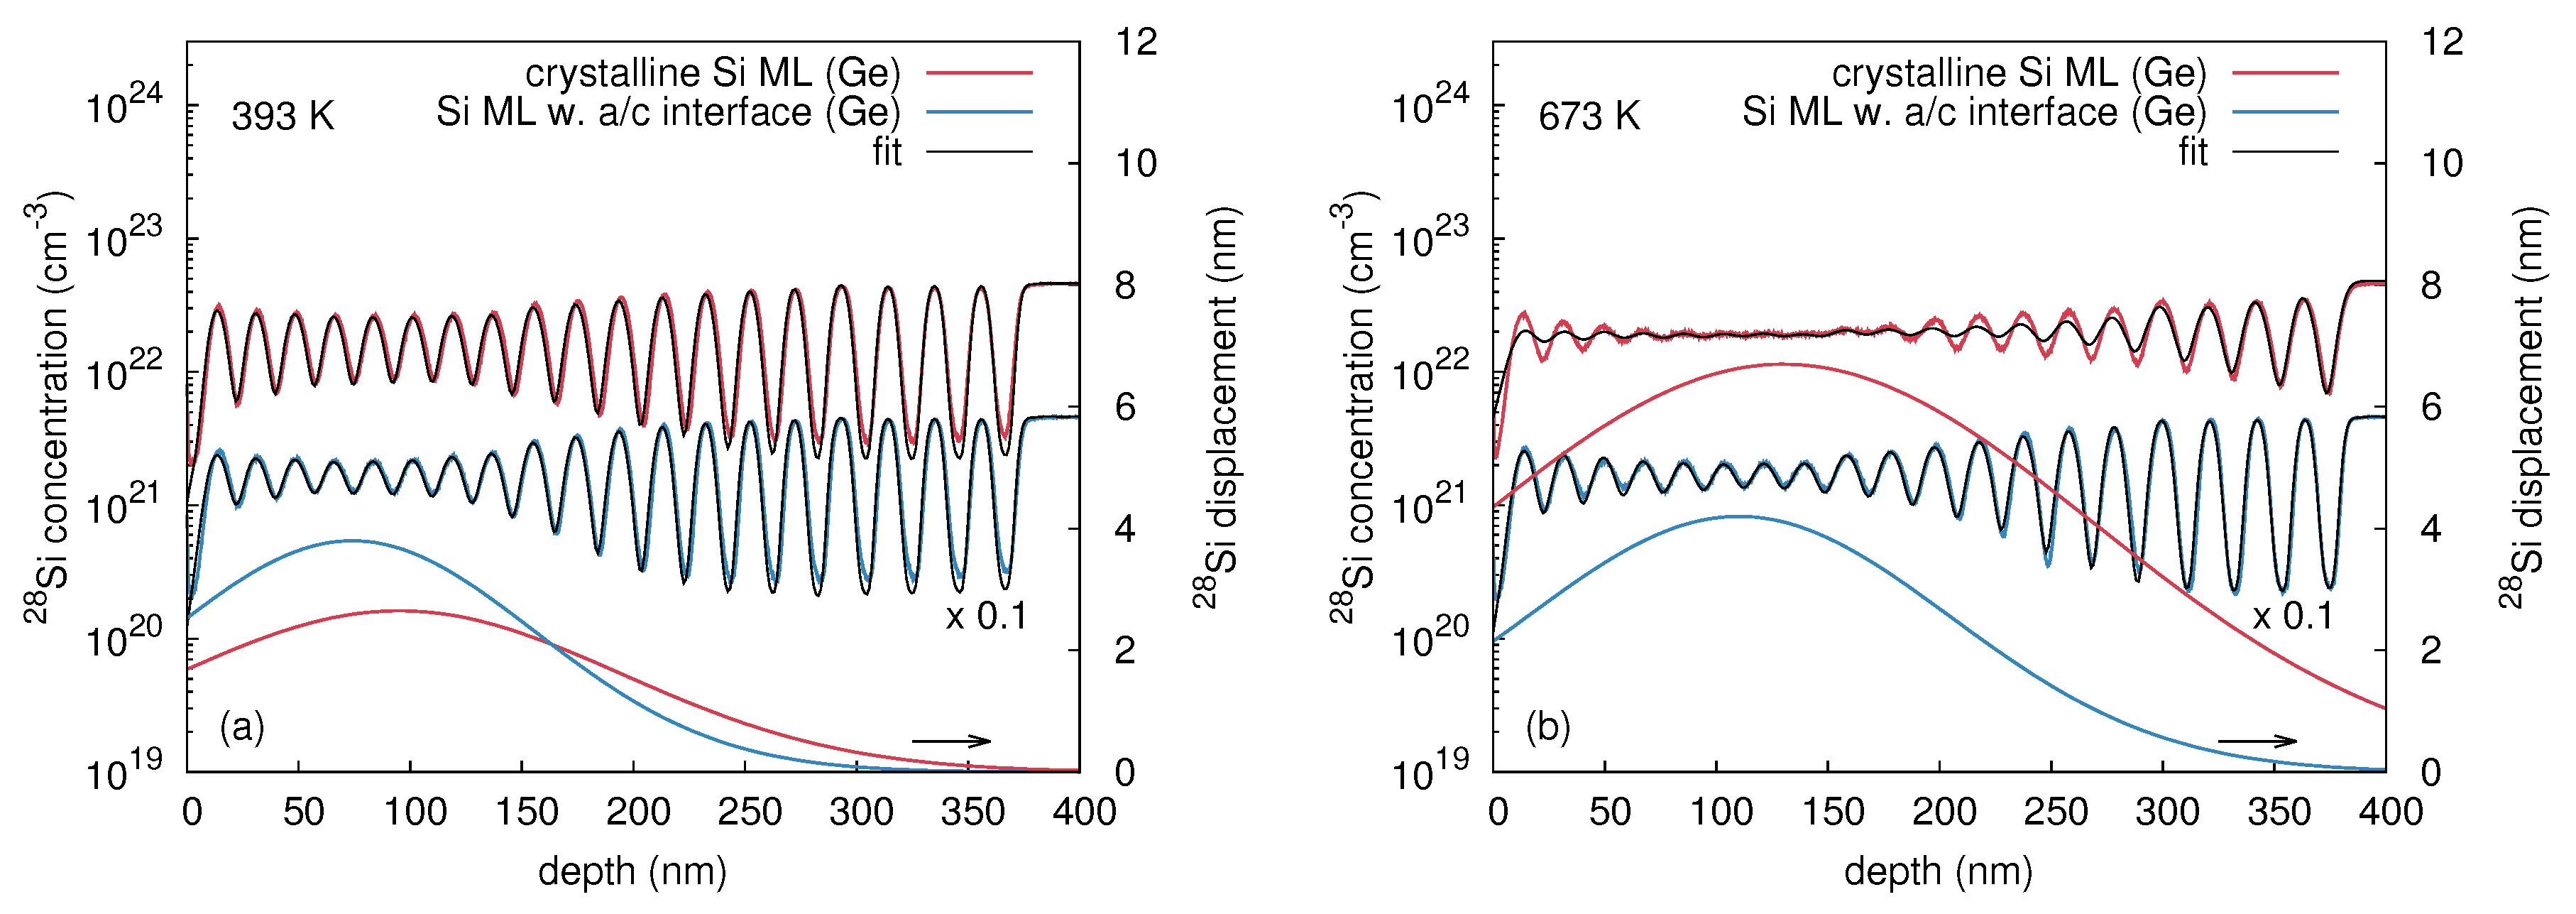
Figure 10.
Best fits (black solid lines) based on Equations (
2)–(
4) to the implantation induced atomic mixing profiles of initially crystalline (red) and preamorphized (blue) Si at (
a) 393 K and (
b) 673 K. The
Si concentration profiles in crystalline and preamorphized Si are differently scaled for clarity. The lower solid lines show the corresponding Si displacement function
and are referred to the right axis. The parameters of
for all Si samples investigated in this work are summarized in
Table 3. Reproduced from [Radek, M.; Bracht, H.; Liedke, B.; Böttger, R.; Posselt, M. Ion-beam induced atomic mixing in isotopically controlled silicon multilayers.
J. Appl. Phys. 2016,
120, 185701.], with the permission of AIP Publishing.
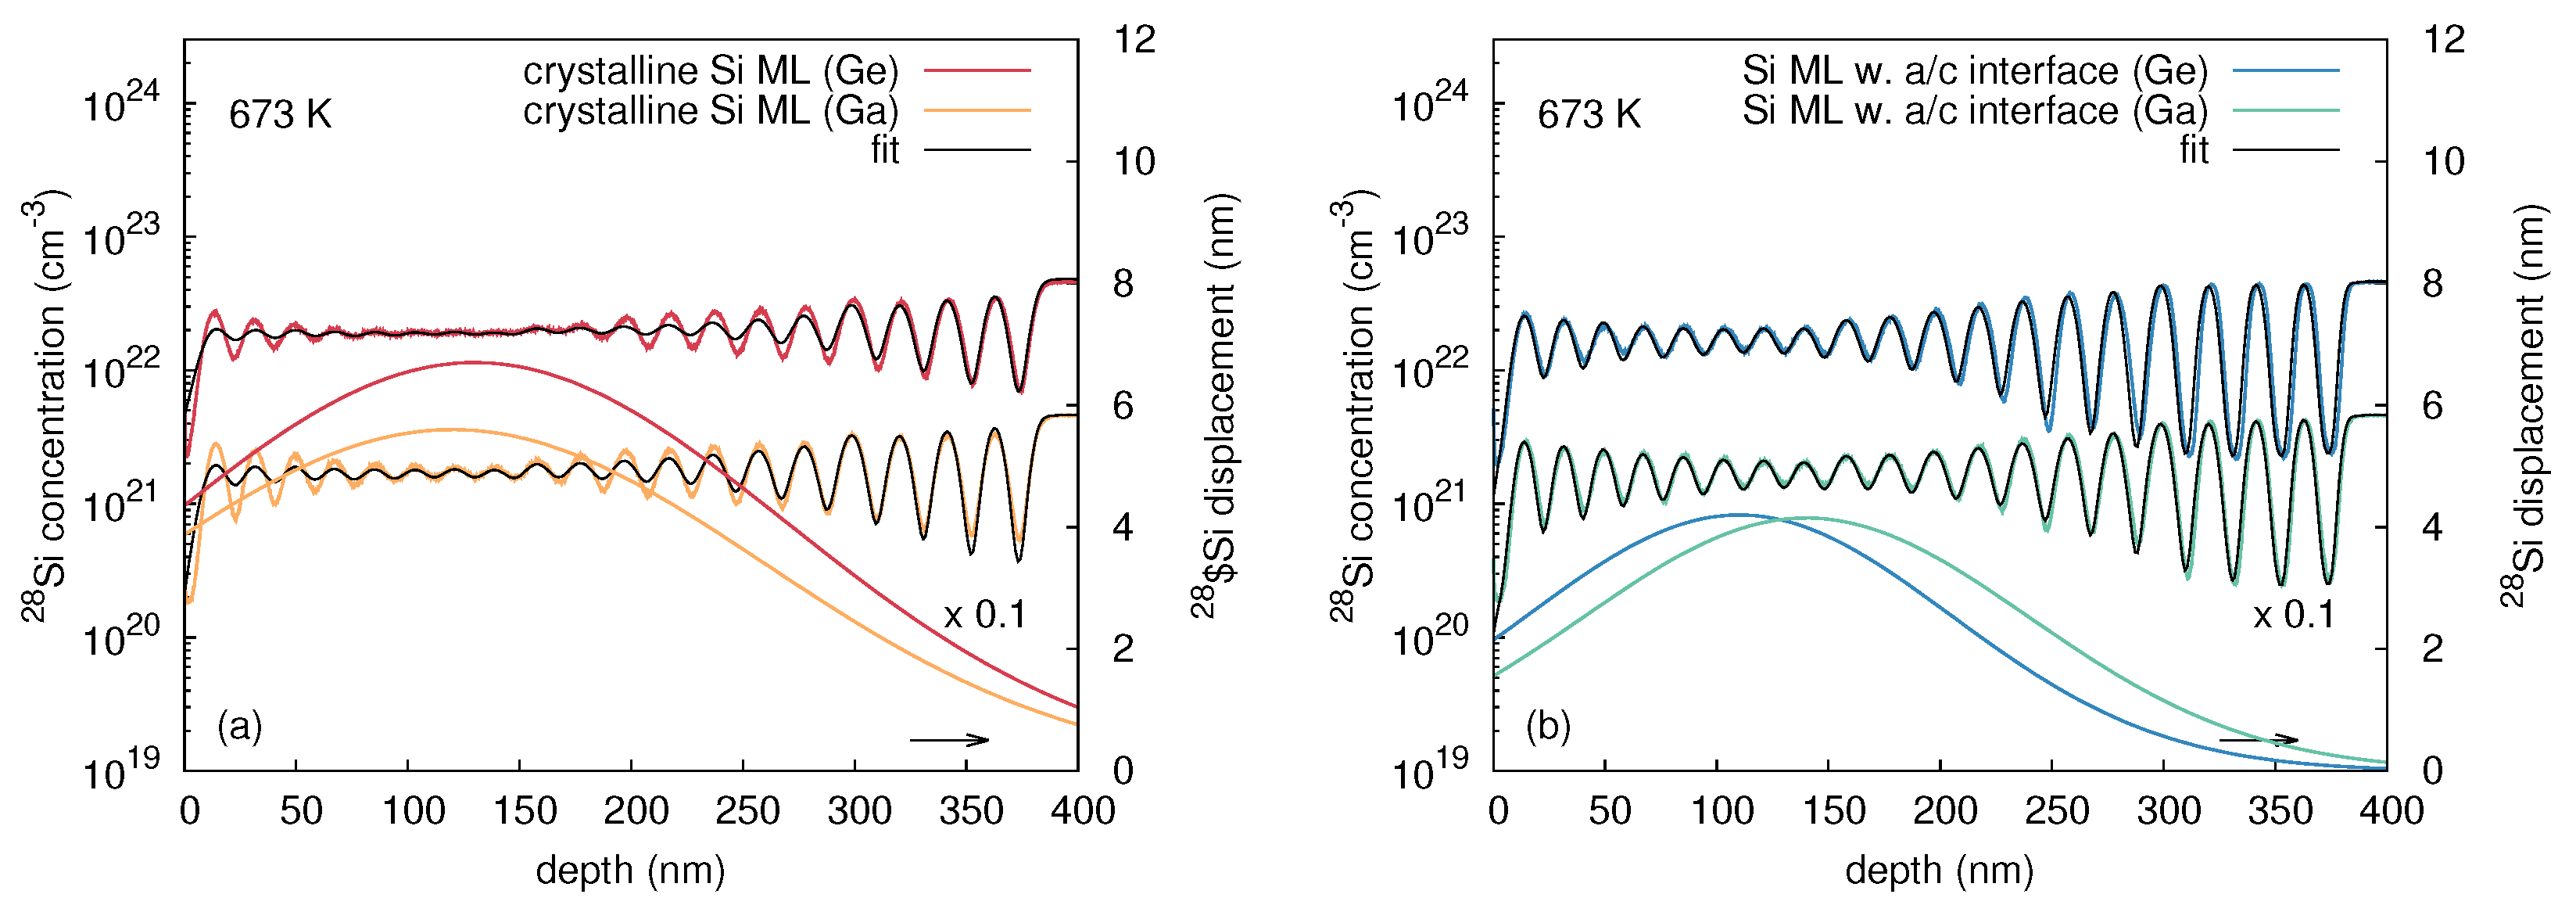
Figure 11.
Best fits (black solid lines) to the concentration profiles of initially (
a) crystalline and (
b) preamorphized Si after implantation with
Ge and
Ga ions at a temperature of 673 K. The presentation of the data is similar to
Figure 10. Reproduced from [Radek, M.; Bracht, H.; Liedke, B.; Böttger, R.; Posselt, M. Ion-beam induced atomic mixing in isotopically controlled silicon multilayers.
J. Appl. Phys. 2016,
120, 185701.], with the permission of AIP Publishing.
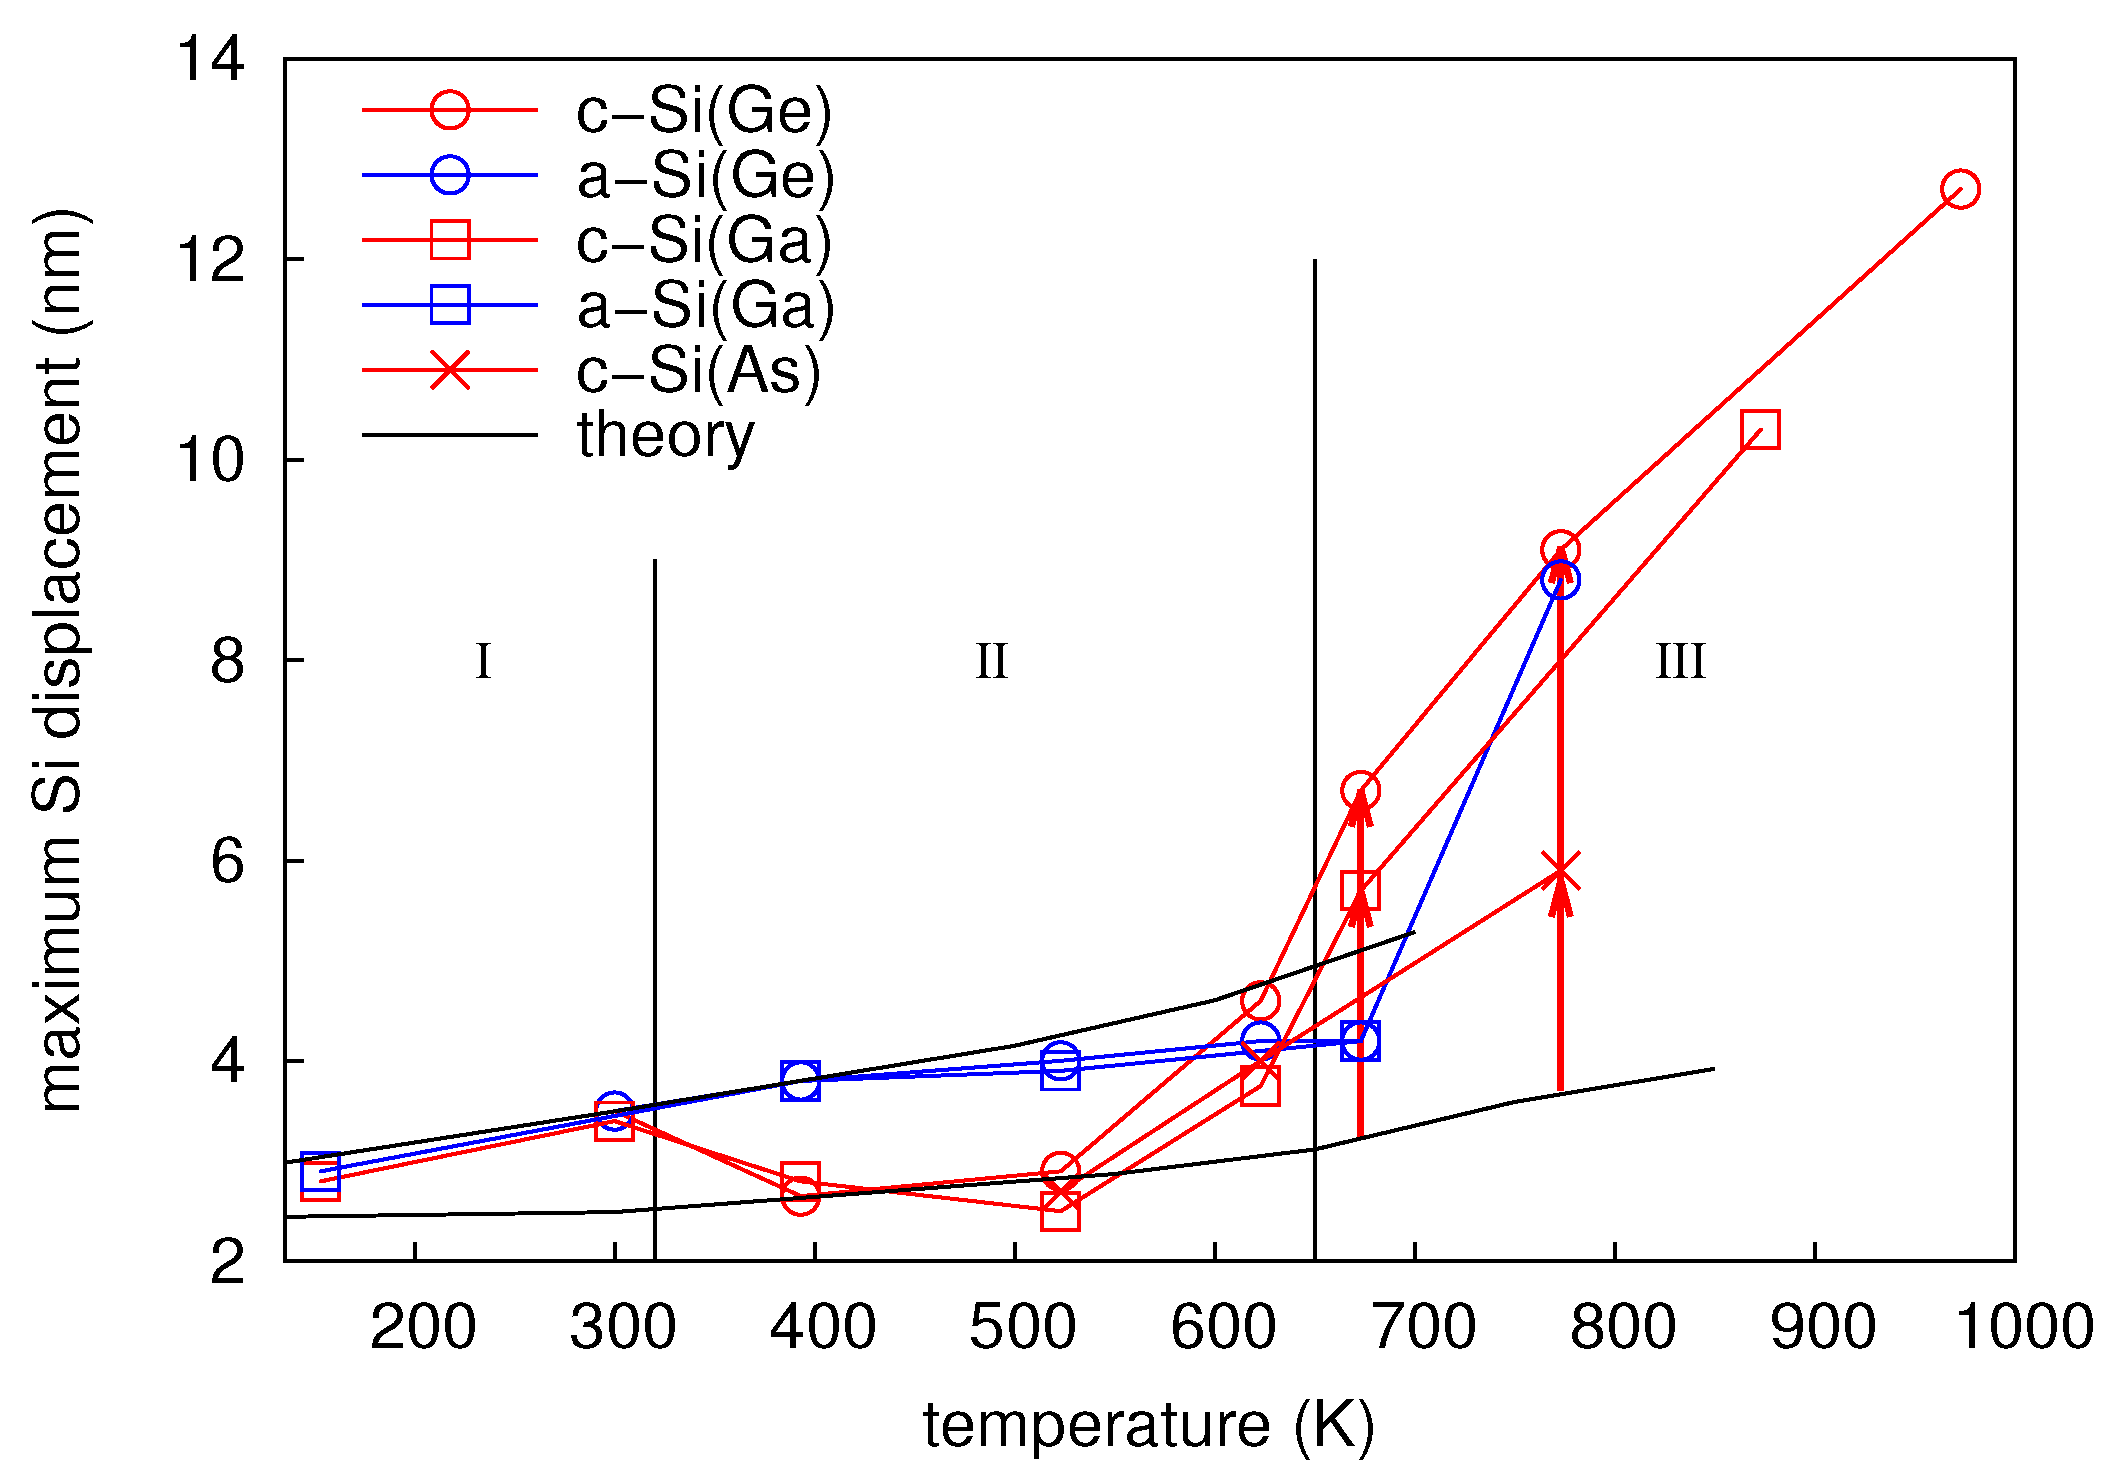
Figure 12.
Temperature dependence of the maximum Si displacement: The mixing of the initially crystalline samples is shown by the red symbols. The results for the preamorphized samples are marked in blue. Three different ion species were used for implantation:
Ge (circles),
Ga (squares), and
As (crosses). Three temperature regimes (I, II and III) with different mixing characteristics are identified. The black solid lines show the temperature dependence of atomic mixing in Si via thermal spikes predicted by molecular dynamics (MD) calculations. The red arrows emphasize significant differences between the black lines and experimental atomic mixing of crystalline Si for temperatures in regime III. In contrast to Ge (cf.
Figure 4), ion-beam mixing in Si is described by thermal-spike mixing up to 523 K. Above this temperature, atomic mixing in the respective Si structures deviates from the thermal-spike model.
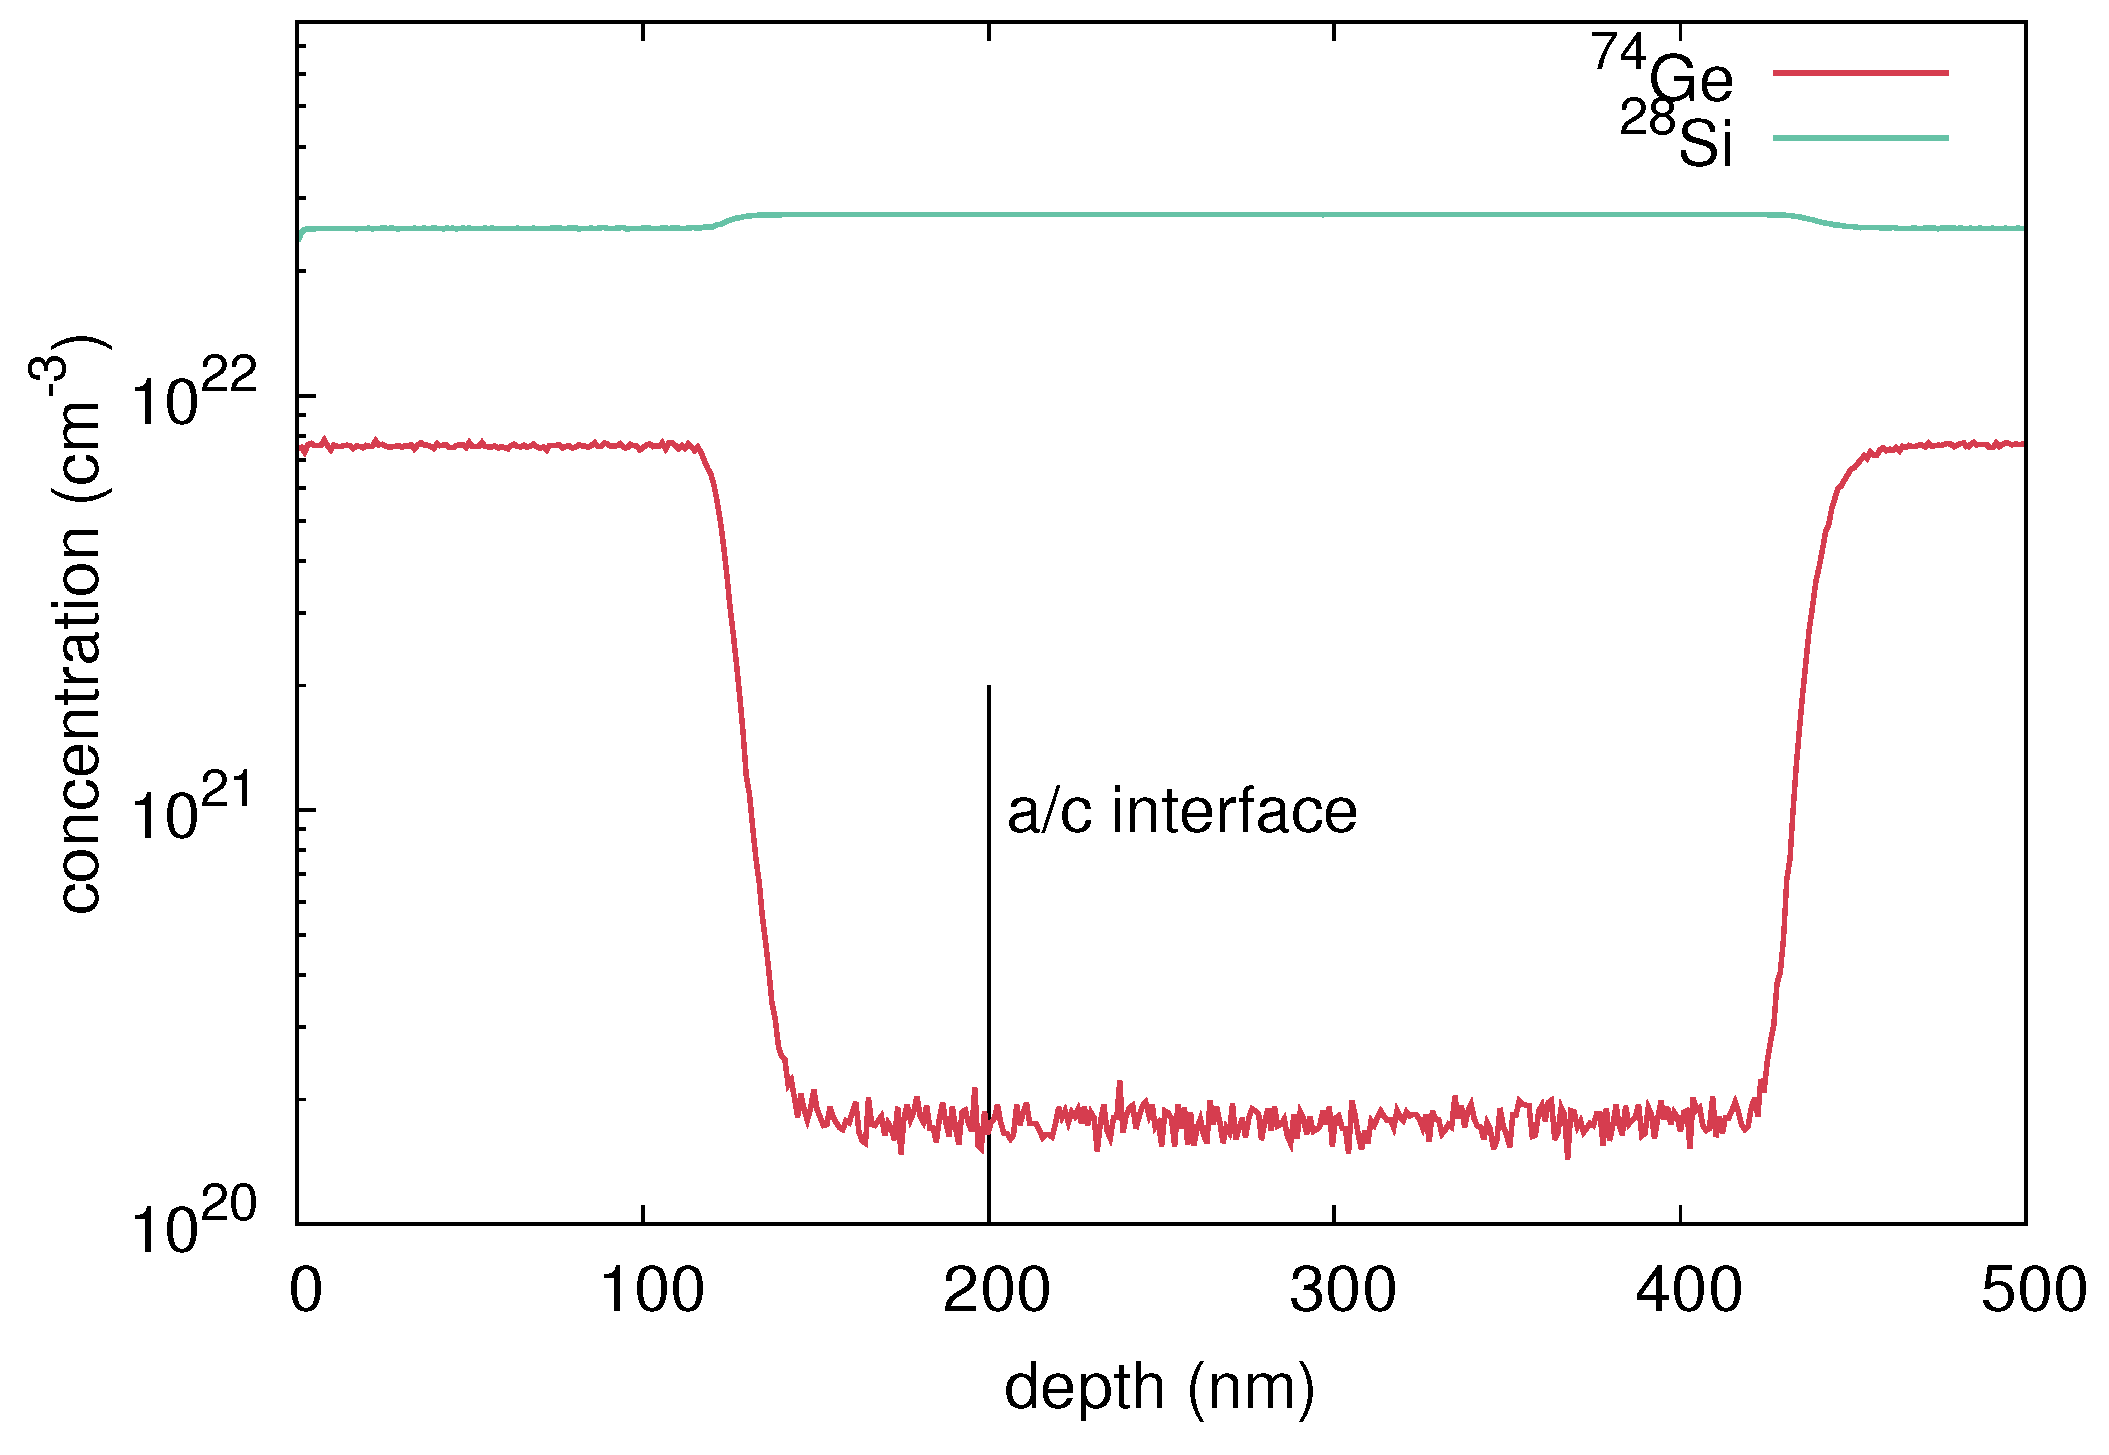
Figure 13.
Ge and Si concentration profiles measured by SIMS in a crystalline SiGe isotopically enriched sandwich structure grown by MBE. The distributions of Ge and Si atoms in the preamorphized sample are nearly identical. The vertical line marks the depth of the amorphous-crystalline interface in the preamorphized sample.
Figure 14.
Ge profiles in initially (
a) crystalline and (
b) preamorphized Si
Ge
sandwich structures measured by SIMS after implantation of 350 keV
Ge, at a fluence of 3 × 10
cm
and at 523 K. The
Ge distribution before ion beam mixing is depicted by the dotted lines. Best fits (black solid lines) based on Equations (
2)–(
4) to the implantation-induced atomic mixing profiles and the corresponding Ge displacement function
are also shown.
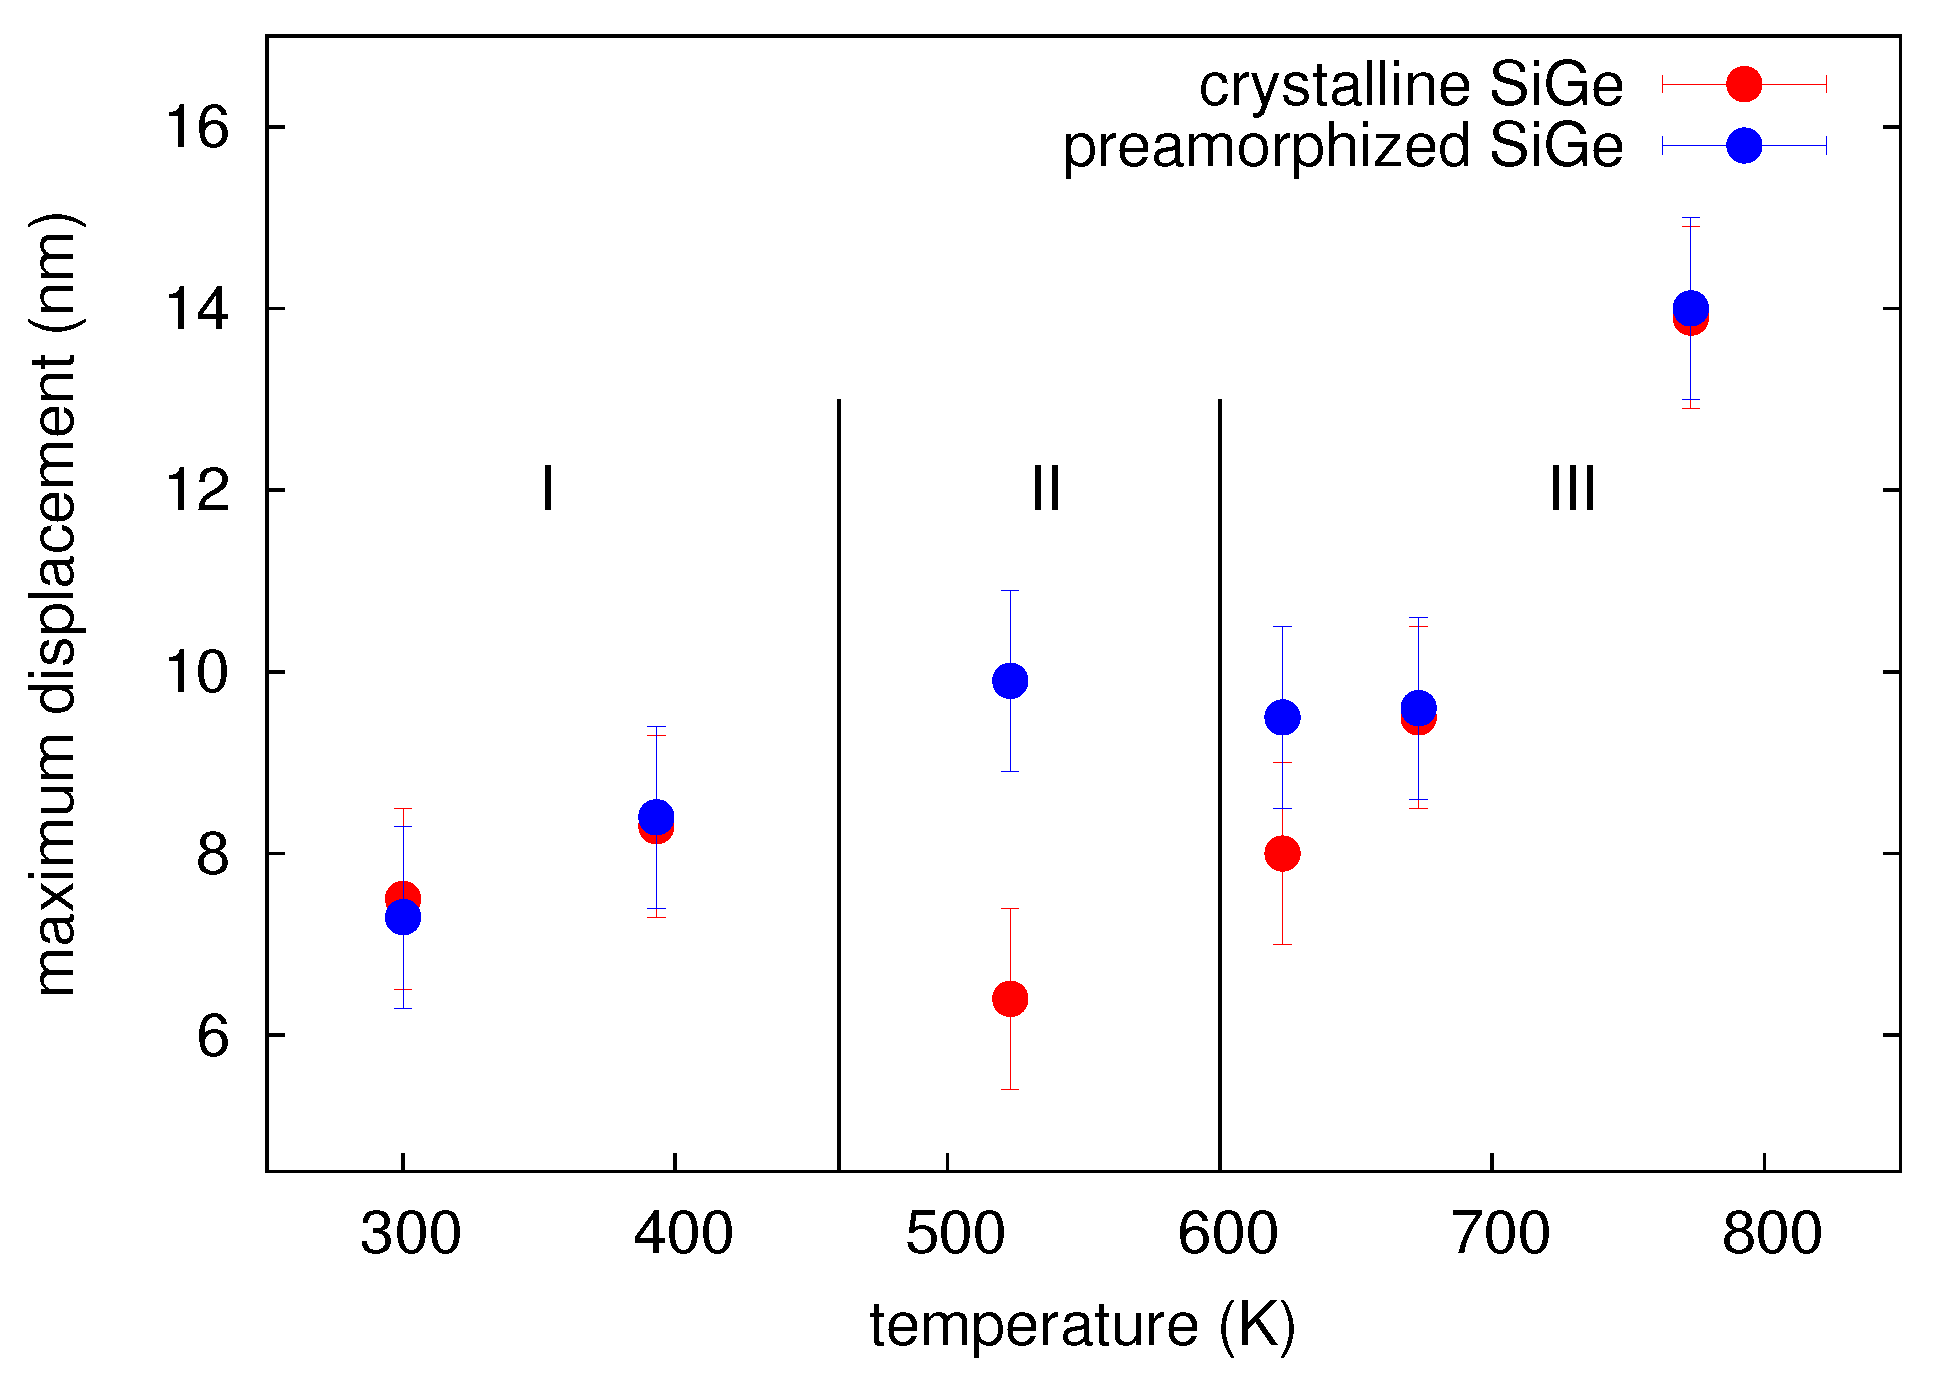
Figure 15.
Temperature dependence of the maximum Ge displacement in initially crystalline (red) and preamorphized (blue) SiGe isotope sandwich structures. Three temperature regimes are identified based on the crystal structure (crystalline or amorphous) observed after implantation (see text for details).
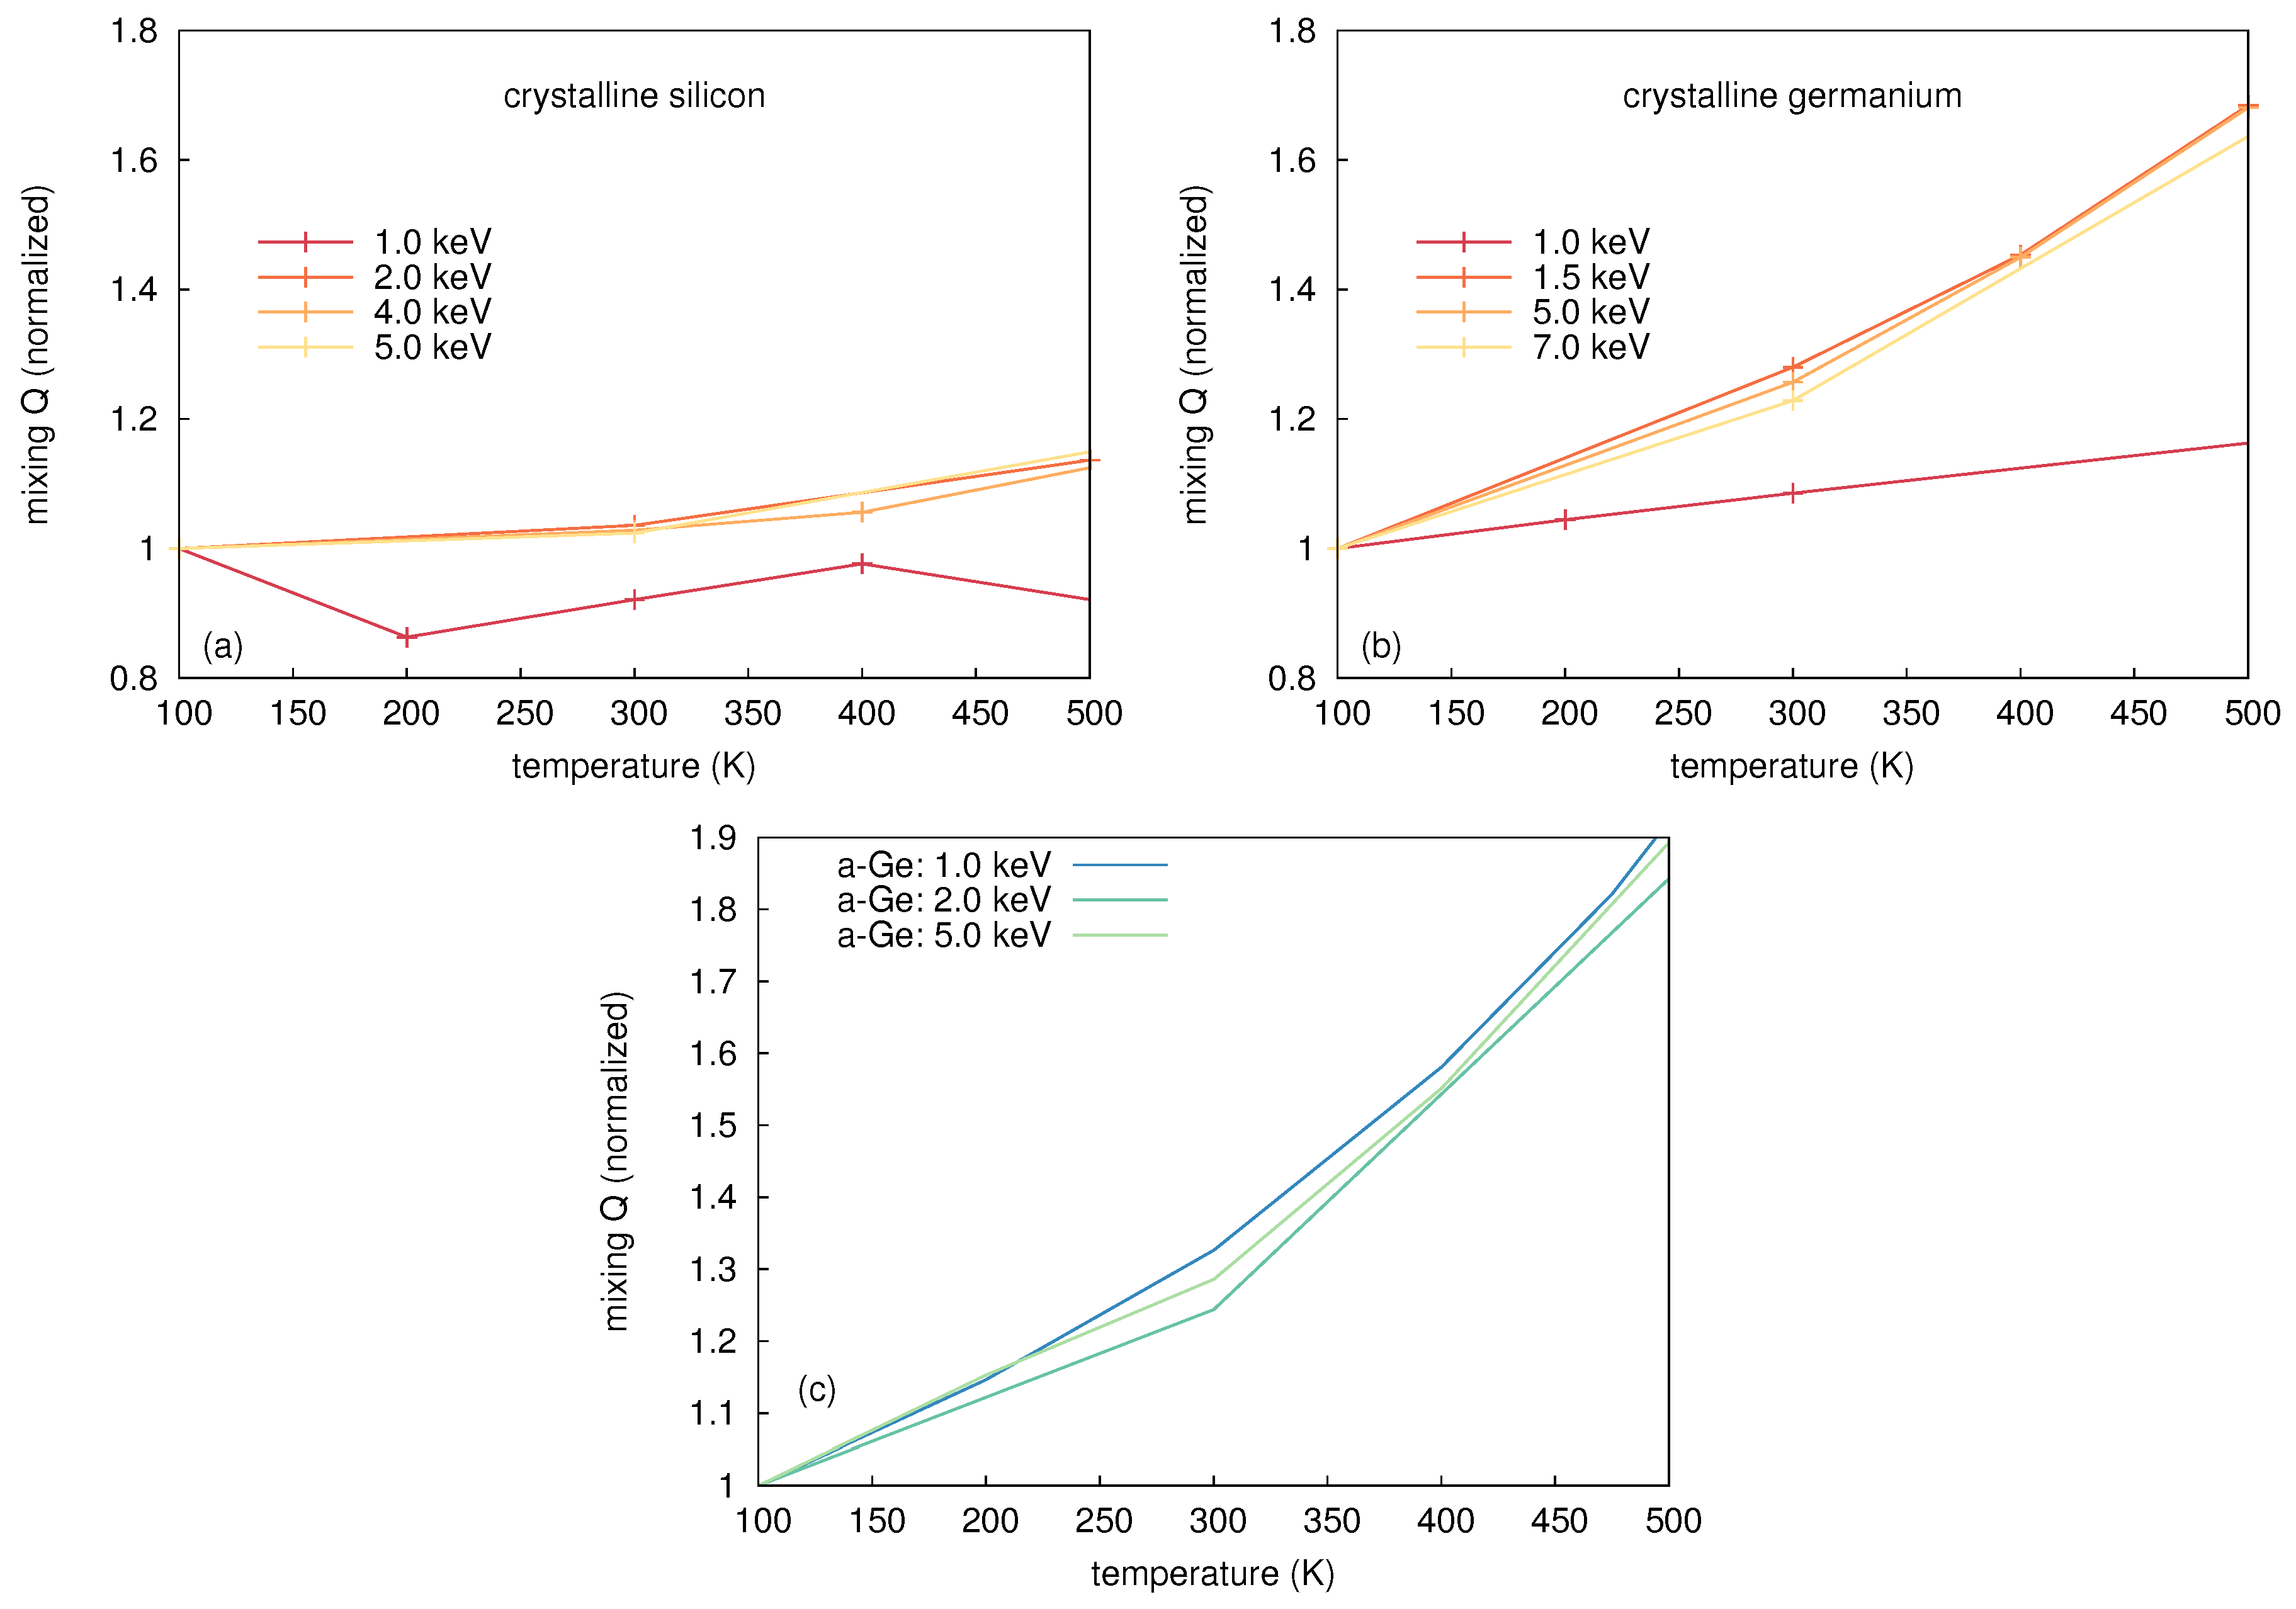
Figure 16.
Temperature dependence of thermal-spike mixing in (a) crystalline Si; (b) crystalline Ge; and (c) amorphous Ge, for different energies of primary-knock-on-atoms (PKAs) deduced from molecular dynamics calculations. The atomic-mixing parameter Q is normalized to the mixing observed at 100 K. For PKA energies above 2 keV, the temperature dependence of Q is very similar in the three cases. Thermal spike mixing in amorphous Si shows a behavior very similar to that of amorphous Ge. (a,b) were reproduced from [Radek, M.; Bracht, H.; Liedke, B.; Böttger, R.; Posselt, M. Ion-beam induced atomic mixing in isotopically controlled silicon multilayers. J. Appl. Phys. 2016, 120, 185701.], with the permission of AIP Publishing.
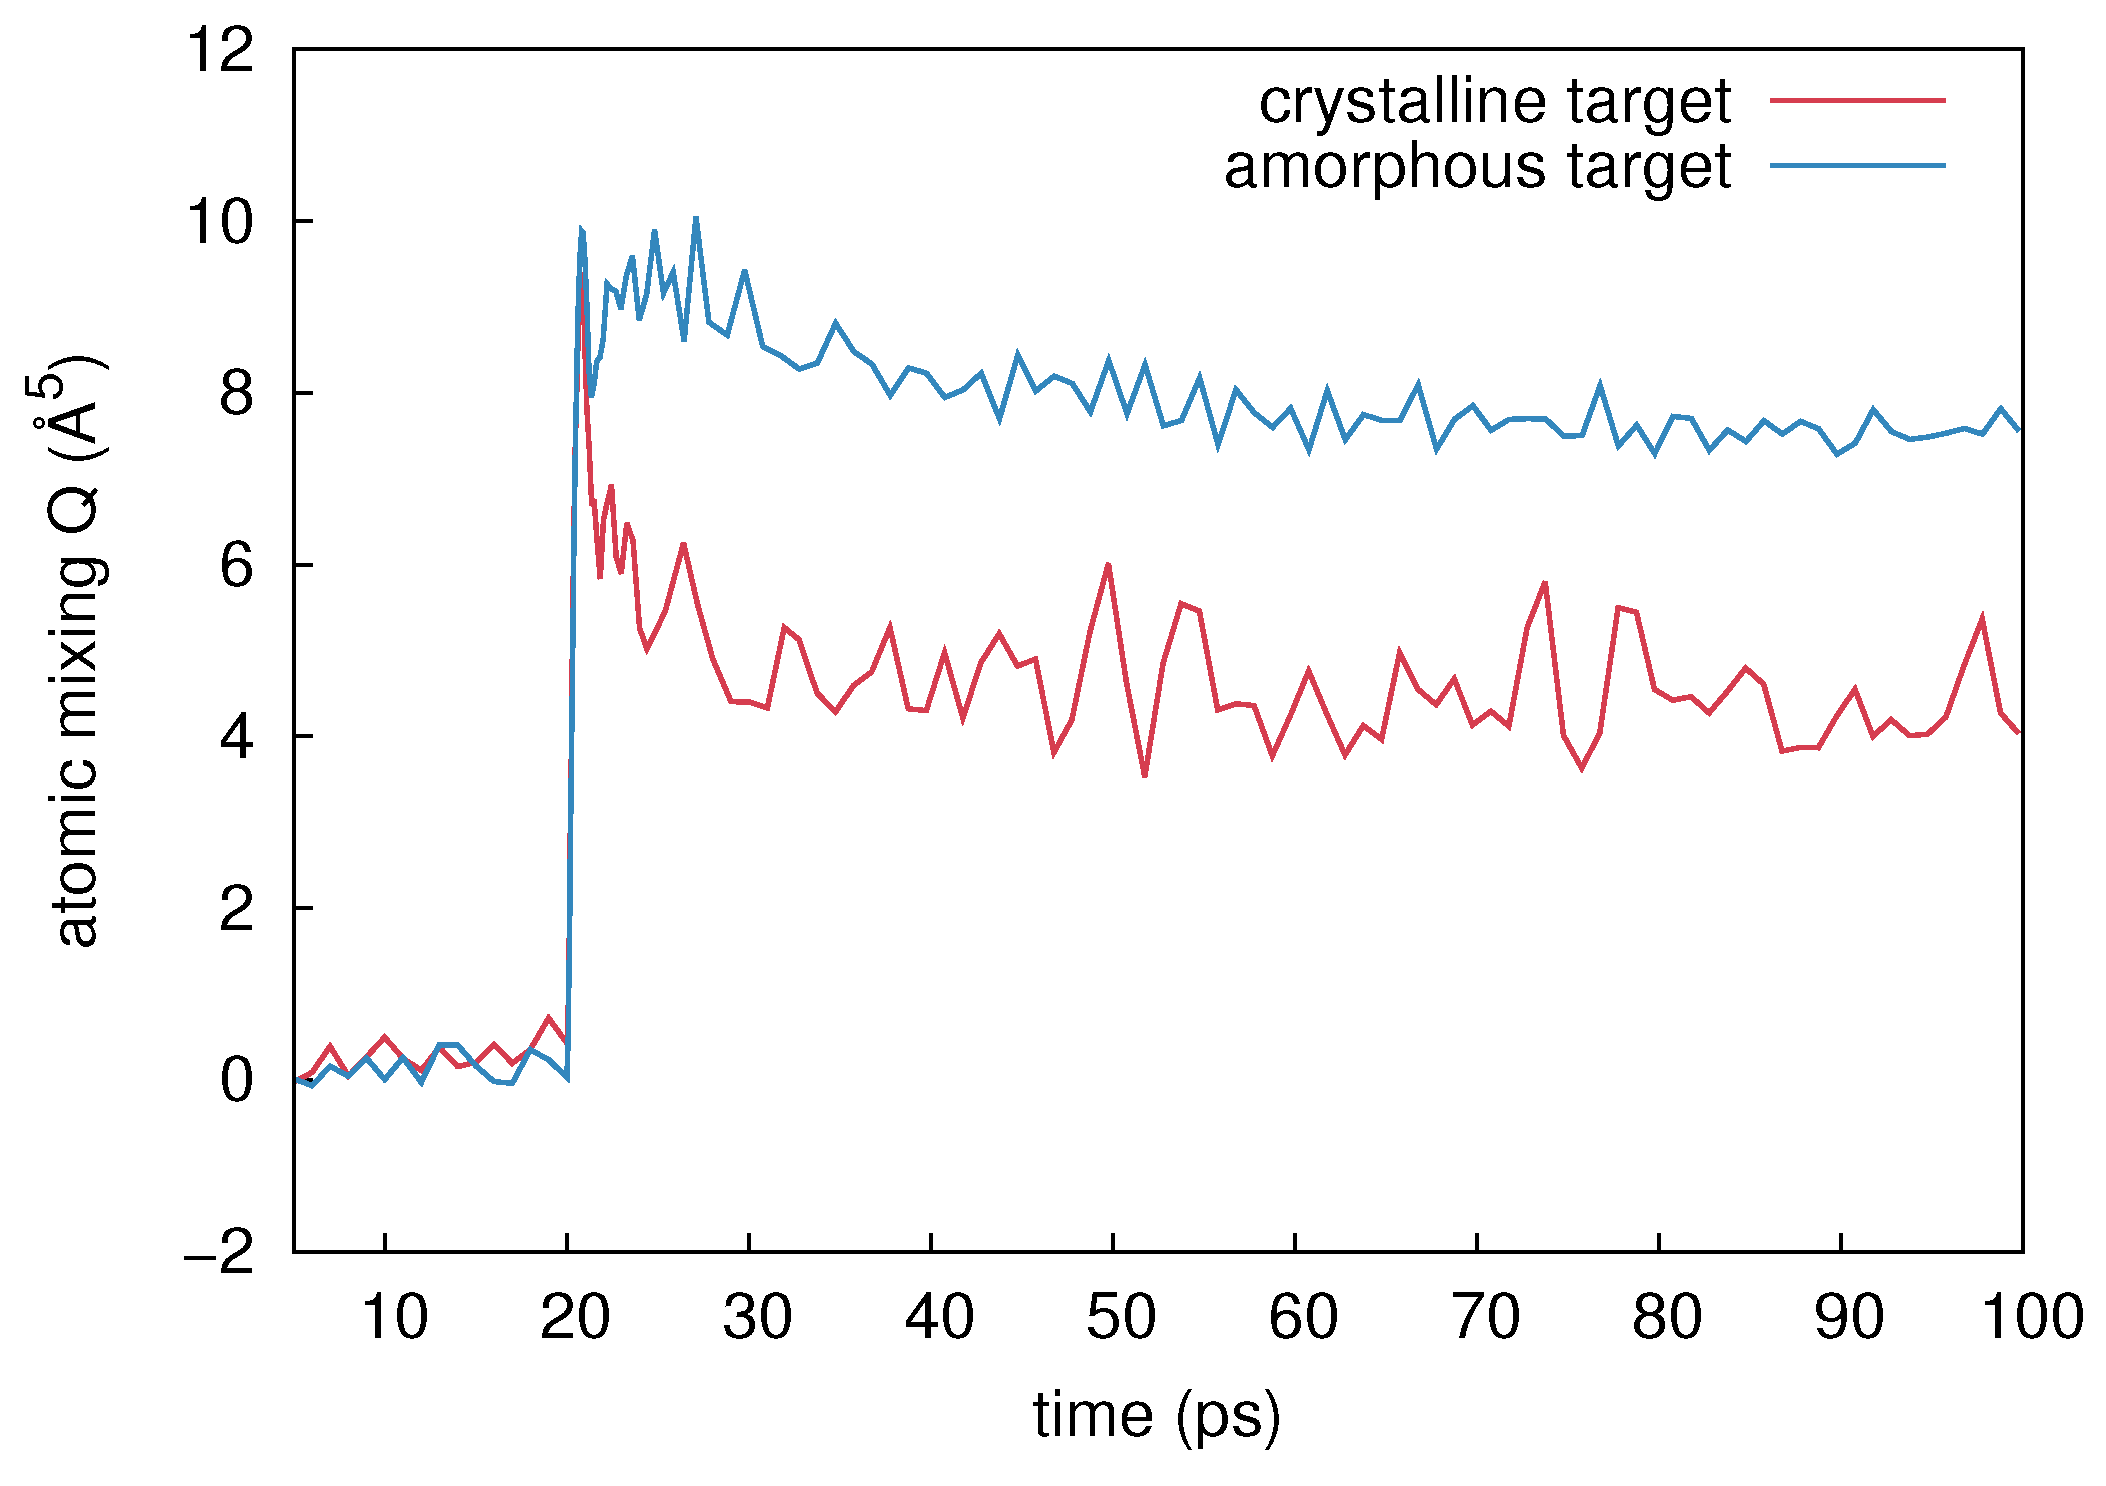
Figure 17.
Temporal evolution of mixing after initiating a 2 keV self-atom cascade in Ge at t = 20 ps. The mixing in crystalline Ge is marked by red color, whereas the mixing in the amorphous structure is shown in blue.
Figure 17.
Temporal evolution of mixing after initiating a 2 keV self-atom cascade in Ge at t = 20 ps. The mixing in crystalline Ge is marked by red color, whereas the mixing in the amorphous structure is shown in blue.
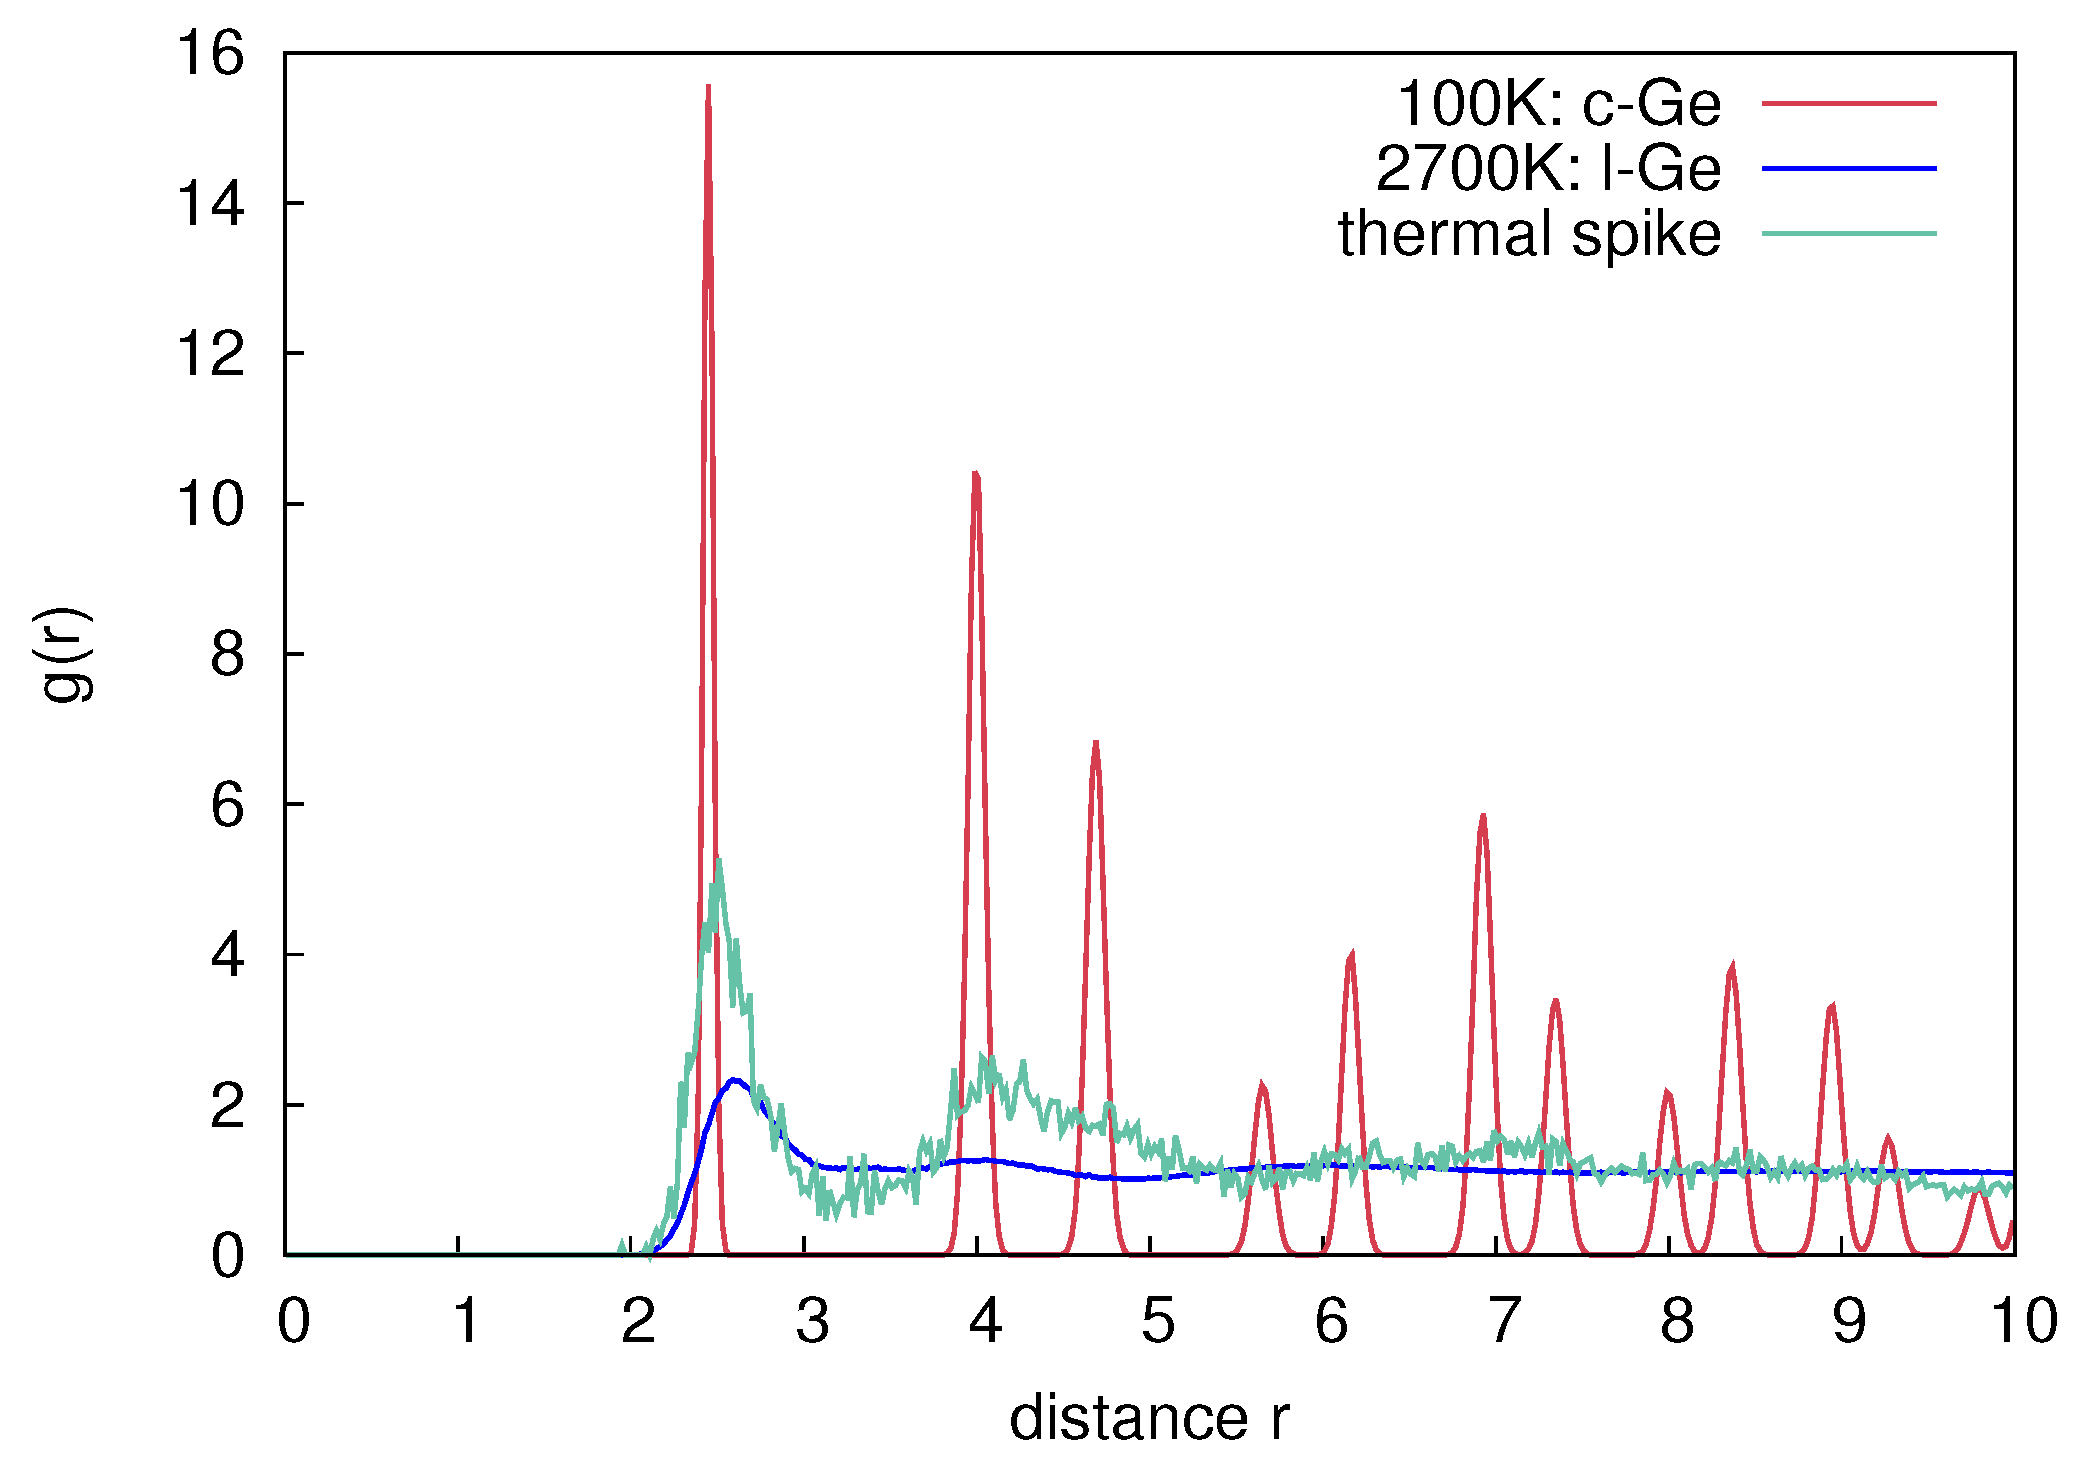
Figure 18.
Radial distribution function of crystalline Ge at 100 K (red), liquid Ge at 2700 K (blue), and atoms within a thermal spike volume (green). The thermal spike region was determined by the amount of atoms that have a kinetic energy above the melting point according to the equipartition theorem.
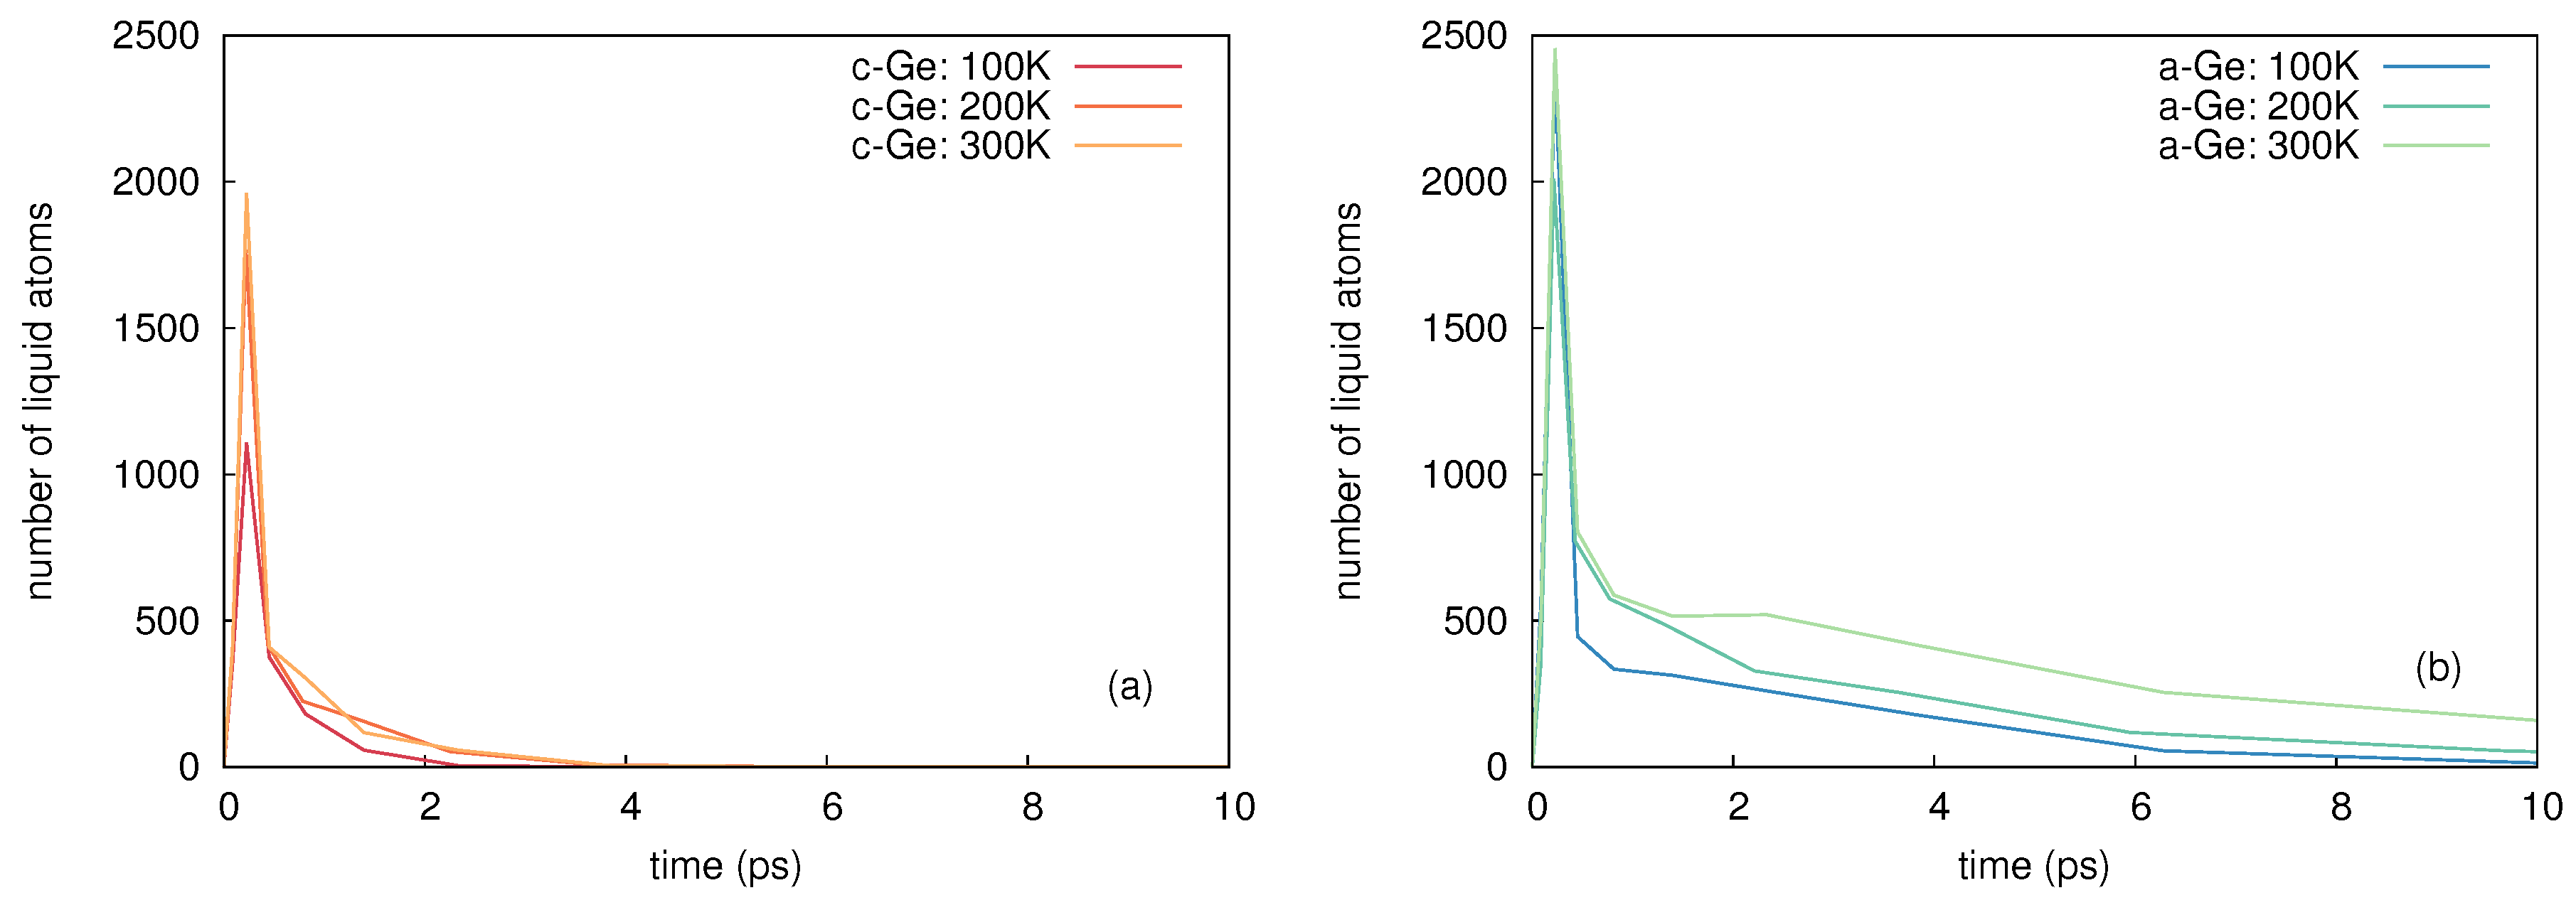
Figure 19.
Representative temporal evolution of liquid atoms () at temperatures of 100, 200 and 300 K in (a) crystalline and (b) amorphous Ge induced by 5 keV self-atom cascades.
Figure 19.
Representative temporal evolution of liquid atoms () at temperatures of 100, 200 and 300 K in (a) crystalline and (b) amorphous Ge induced by 5 keV self-atom cascades.
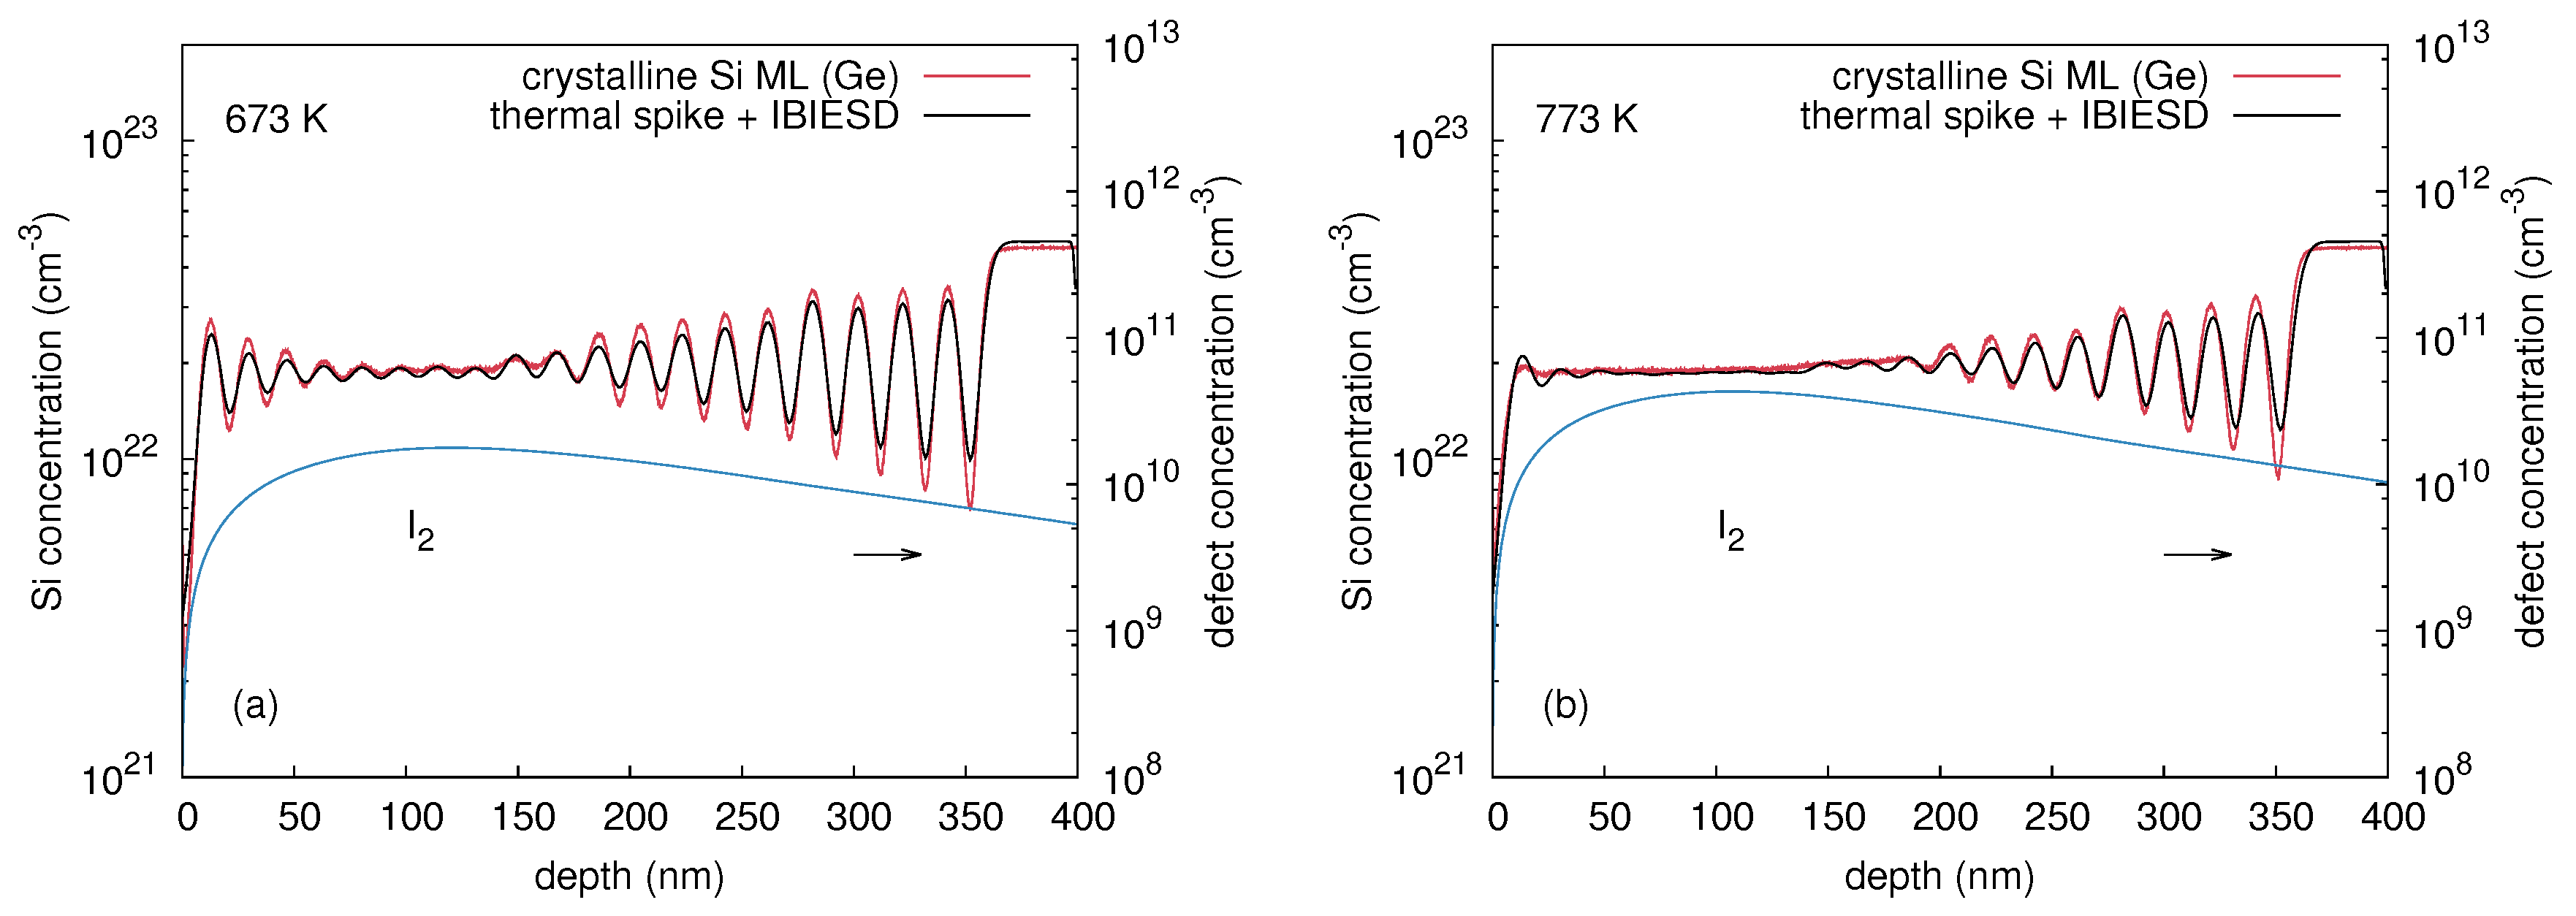
Figure 20.
Si concentration depth profile after implantation of Ge ion with an energy of 180 keV and a fluence of 3 × 10 cm (red) at (a) 673 K and (b) 773 K, in comparison to the numerical model consisting of a combination of thermal spike mixing and ion beam induced enhanced self-diffusion (IBIESD) mediated by Si di-interstitials (black). The concentration of the silicon di-interstitials is shown as blue solid line and is referred to the right axes. (a) was reproduced from [Radek, M.; Bracht, H.; Liedke, B.; Böttger, R.; Posselt, M. Ion-beam induced atomic mixing in isotopically controlled silicon multilayers. J. Appl. Phys. 2016, 120, 185701.], with the permission of AIP Publishing.
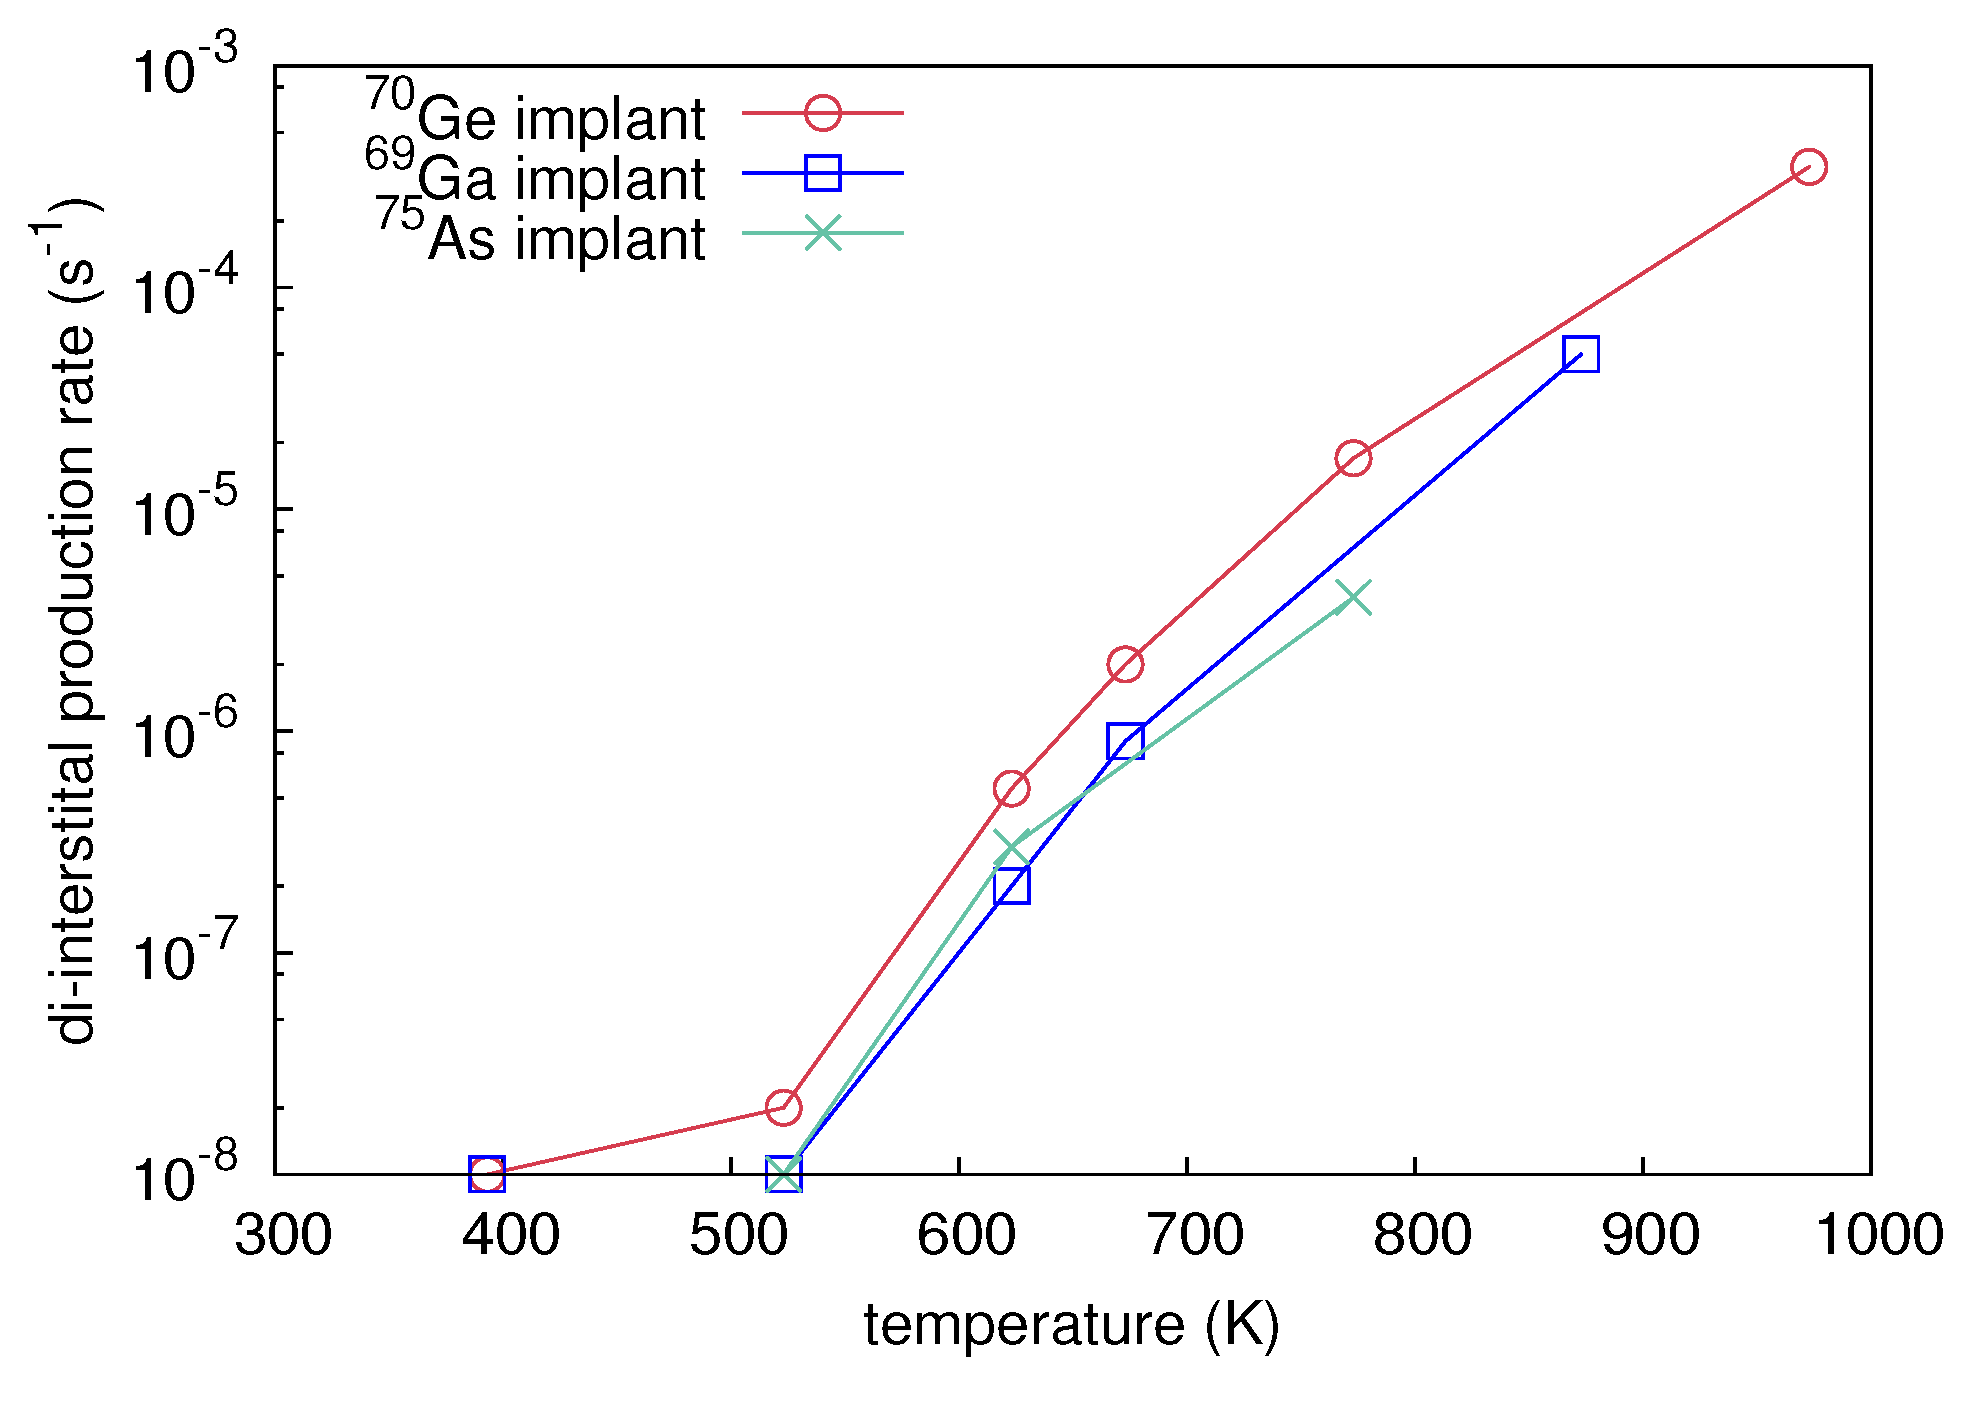
Figure 21.
Production rate of Si di-interstitials as obtained from best fits of the ion-beam induced enhanced self-diffusion (IBIESD) model to the experimental data versus implantation temperature. Three different ion species were considered: Ge (red circles), Ga (blue squares), and As (green crosses). Reproduced from [Radek, M.; Bracht, H.; Liedke, B.; Böttger, R.; Posselt, M. Ion-beam induced atomic mixing in isotopically controlled silicon multilayers. J. Appl. Phys. 2016, 120, 185701.], with the permission of AIP Publishing.
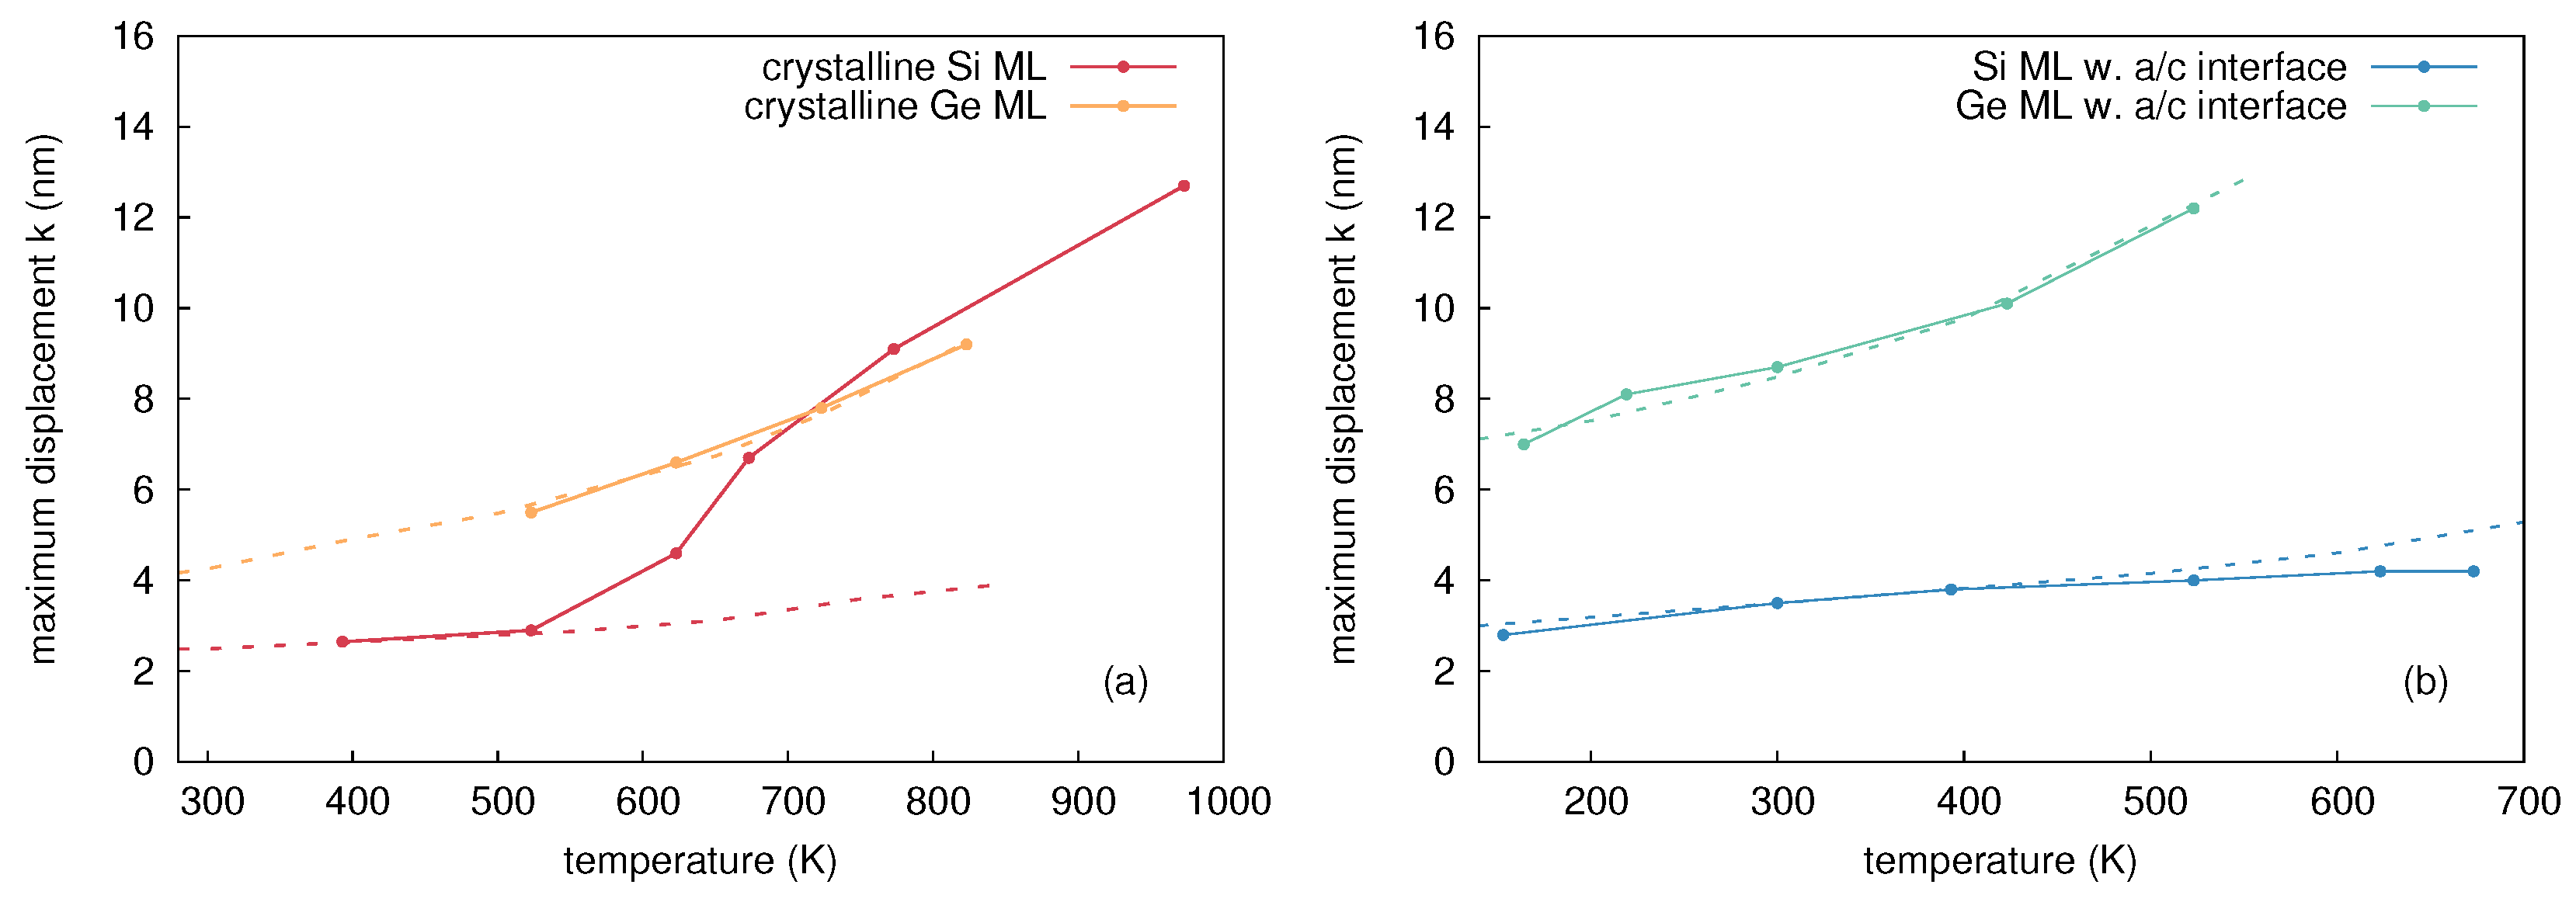
Figure 22.
Comparison between the experimentally determined maximum atomic displacements in initially (a) crystalline and (b) preamorphized isotope multilayer structures of Si (Ge) after Ge (Ga and Ge) implantation at 180 keV (310 keV) at an ion fluence of 3 × 10 cm (1 × 10 cm). The contributions of thermal spike mixing calculated by molecular dynamics to the overall mixing are shown as dashed lines in the same color code as the experimental data.
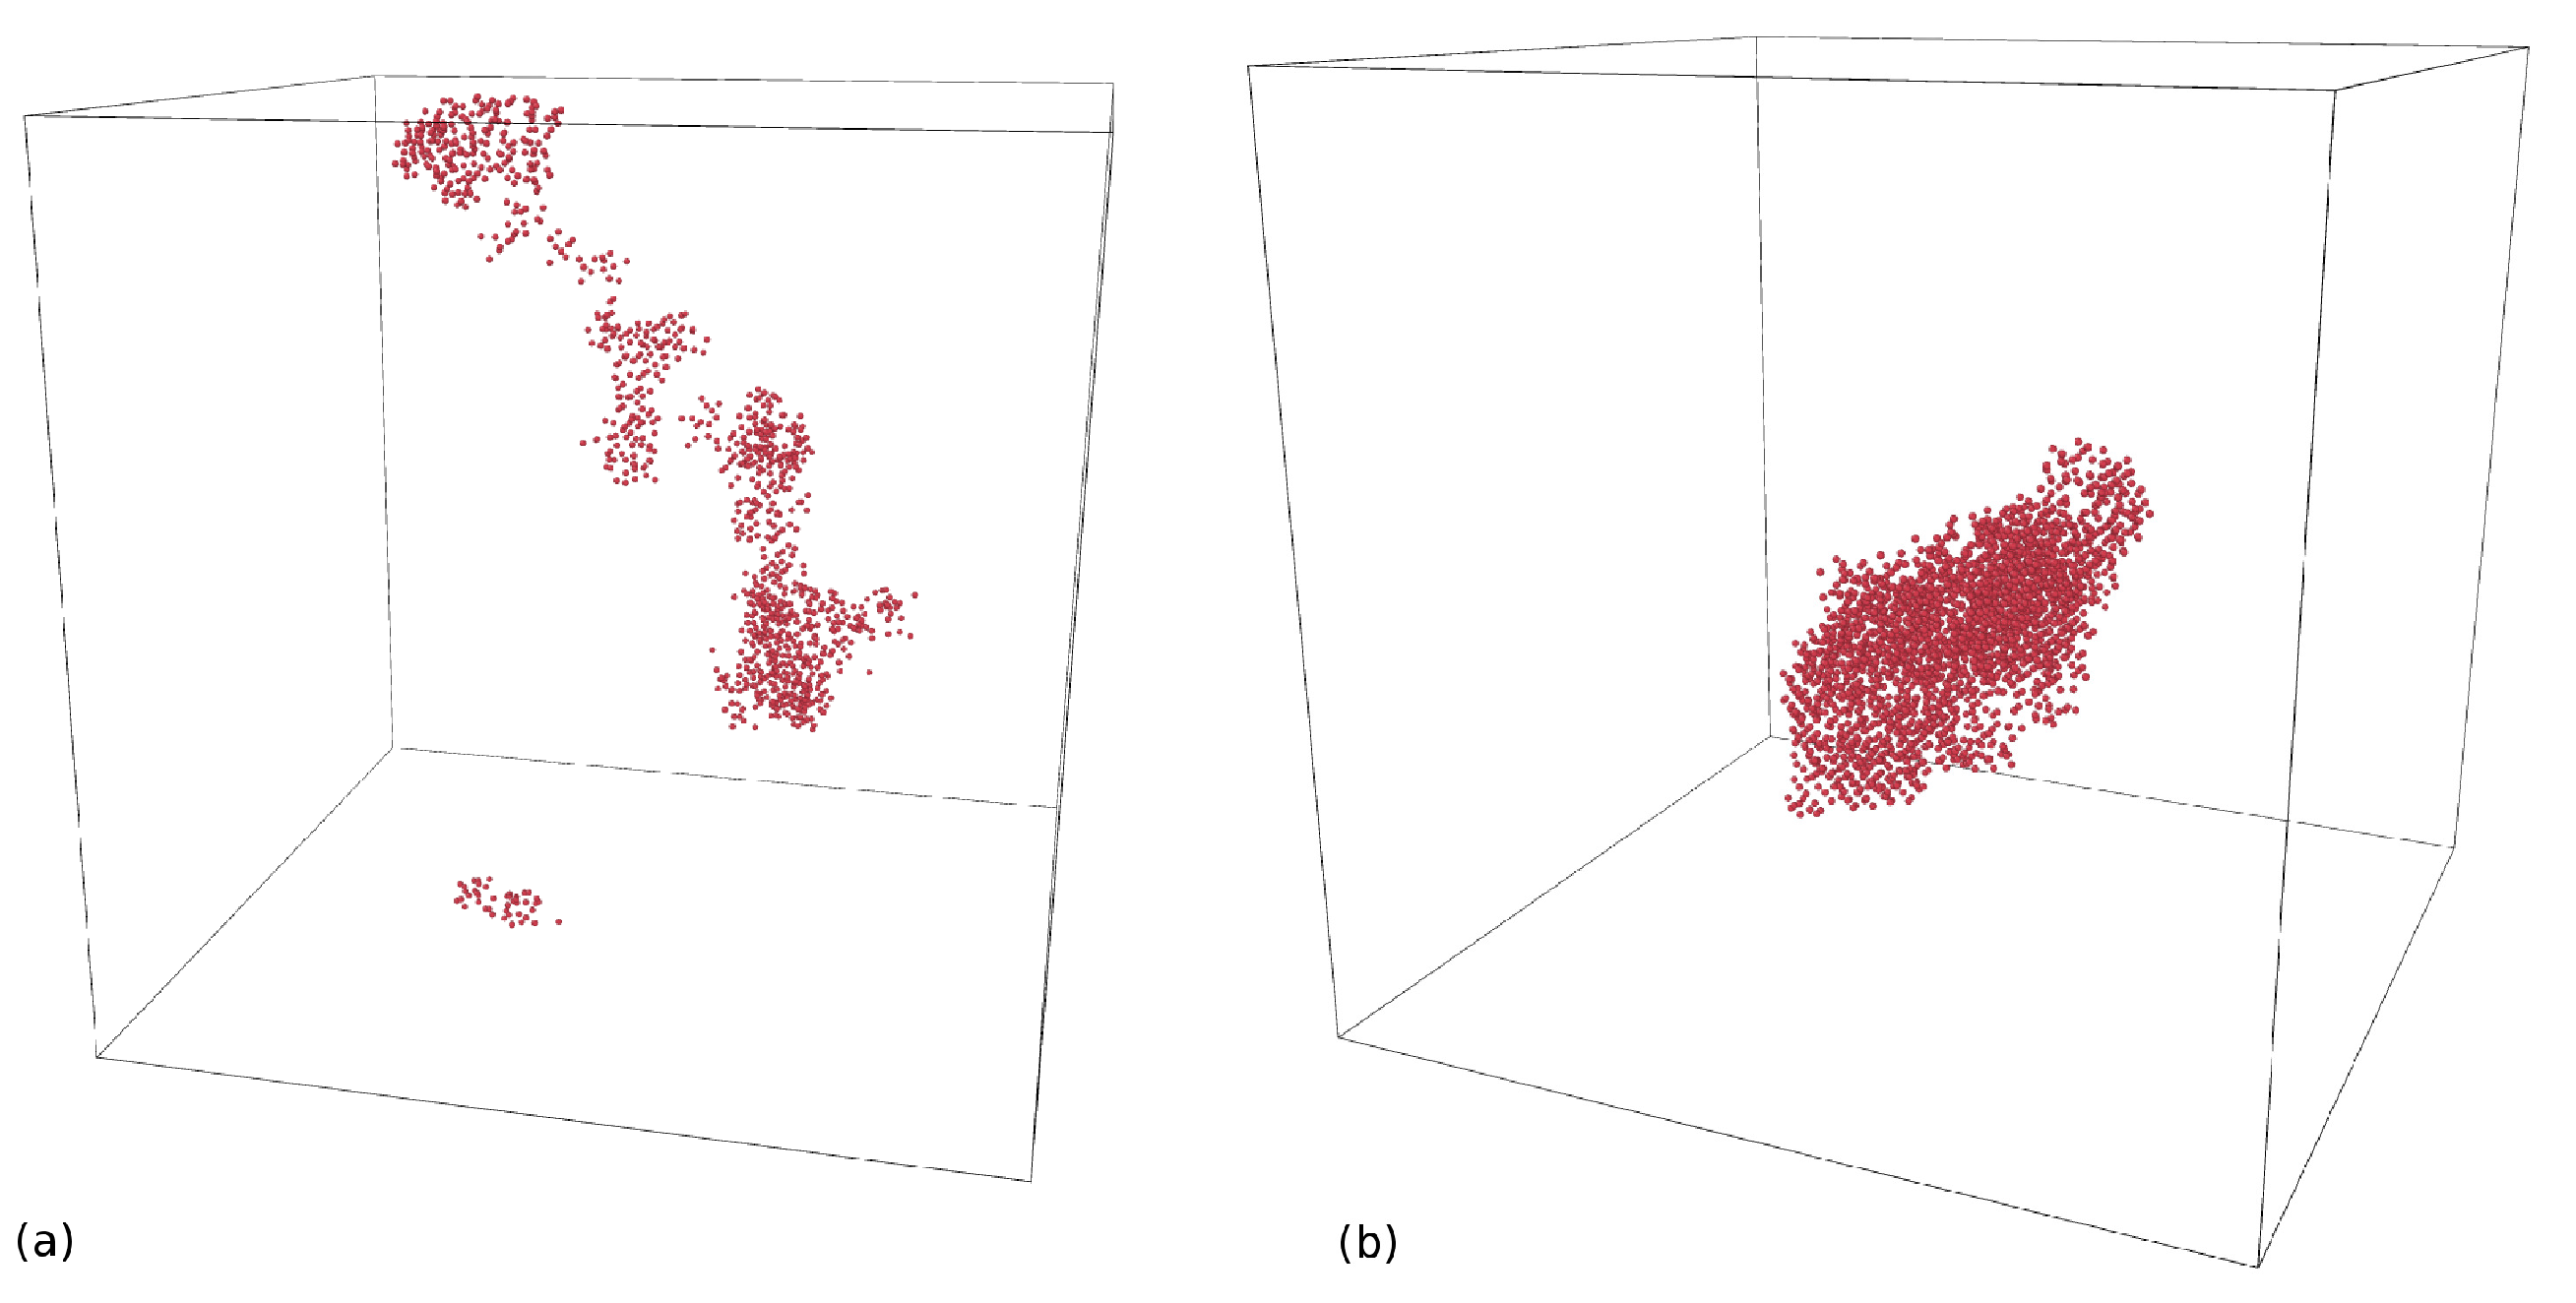
Figure 23.
Representative simulation snapshots of thermal spikes in (a) Si and (b) Ge induced by a 5 keV self-atom cascade. The temperature during the simulation was kept at 100 K.
Figure 23.
Representative simulation snapshots of thermal spikes in (a) Si and (b) Ge induced by a 5 keV self-atom cascade. The temperature during the simulation was kept at 100 K.
Table 1.
Fit parameters k (amplitude), l (position), and m (width) of the depth dependent function deduced from the analysis of self-atom mixing in crystalline and preamorphized Ge isotope multilayers. The mixing of the isotope structure was induced by 310 keV Ga or Ge implantation at a fluence of cm and temperatures ranging from 164 to 823 K.
| | Sample | Ion | T (K) | k (nm) | l (nm) | m (nm) |
|---|
| regime I | | | | | | | |
| | c-Ge | Ga | | 164 | 7.0 ± 0.3 | 80 ± 5 | 95 ± 5 |
| | c-Ge | Ga | | 219 | 8.1 ± 0.3 | 110 ± 5 | 120 ± 5 |
| | c-Ge | Ga | | 300 | 8.7 ± 0.3 | 75 ± 5 | 110 ± 5 |
| | a-Ge | Ga | | 300 | 8.7 ± 0.3 | 85 ± 5 | 85 ± 5 |
| | c-Ge | Ga | | 423 | 9.7 ± 0.3 | 80 ± 5 | 115 ± 5 |
| | a-Ge | Ga | | 423 | 10.1 ± 0.3 | 85 ± 5 | 105 ± 5 |
| regime II | | | | | | | |
| | c-Ge | Ga | | 523 | 5.5 ± 0.3 | 110 ± 5 | 135 ± 5 |
| | a-Ge | Ga | | 523 | 12.2 ± 0.3 | 85 ± 5 | 85 ± 5 |
| regime III | | | | | | | |
| | c-Ge | Ga | | 623 | 6.6 ± 0.3 | 120 ± 5 | 110 ± 5 |
| | a-Ge | Ga | | 623 | 7.5 ± 0.3 | 90 ± 5 | 118 ± 5 |
| | c-Ge | | Ge | 723 | 7.9 ± 0.3 | 110 ± 5 | 150 ± 5 |
| | c-Ge | | Ge | 823 | 9.2 ± 0.3 | 110 ± 5 | 150 ± 5 |
Table 2.
Fit parameters k (amplitude), l (position), and m (width) of the depth dependent function deduced from the analysis of atomic mixing in crystalline Ge isotope multilayers. The mixing of the isotope structure was induced by 60 keV Si implantation at two strongly different ion fluxes ( cm s, cm s) at temperatures of 300 K and 523 K.
| Ion Flux (cms) | T (K) | k (nm) | l (nm) | m (nm) |
|---|
| 300 | 3.4 ± 0.3 | 30 ± 5 | 35 ± 5 |
| 300 | 3.5 ± 0.3 | 30 ± 5 | 35 ± 5 |
| 523 | 2.0 ± 0.3 | 30 ± 5 | 50 ± 5 |
| 523 | 4.5 ± 0.3 | 30 ± 5 | 35 ± 5 |
Table 3.
Fit parameters k (amplitude), l (position), and m (width) of the depth dependent displacement function deduced from the analysis of self-atom mixing in crystalline (c-Si) and preamorphized (a-Si) Si isotope multilayers after Ga, Ge, and As implantation at temperatures ranging from 153 K to 973 K.
| | Sample | Ion | T (K) | k (nm) | l (nm) | m (nm) |
|---|
| regime I | | | | | | | | |
| | c-Si | Ga | | | 153 | 2.8 ± 0.3 | 100 ± 5 | 100 ± 5 |
| | a-Si | Ga | | | 153 | 2.9 ± 0.3 | 85 ± 5 | 90 ± 5 |
| | c-Si | | Ge | | 300 | 3.5 ± 0.3 | 75 ± 5 | 85 ± 5 |
| | a-Si | | Ge | | 300 | 3.5 ± 0.3 | 70 ± 5 | 85 ± 5 |
| | c-Si | Ga | | | 300 | 3.4 ± 0.3 | 100 ± 5 | 100 ± 5 |
| | a-Si | Ga | | | 300 | 3.5 ± 0.3 | 70 ± 5 | 83 ± 5 |
| regime II | | | | | | | | |
| | c-Si | Ga | | | 393 | 2.8 ± 0.3 | 130 ± 5 | 130 ± 5 |
| | a-Si | Ga | | | 393 | 3.8 ± 0.3 | 85 ± 5 | 90 ± 5 |
| | c-Si | | Ge | | 393 | 2.7 ± 0.3 | 95 ± 5 | 100 ± 5 |
| | a-Si | | Ge | | 393 | 3.8 ± 0.3 | 75 ± 5 | 85 ± 5 |
| | a-Si | Ga | | | 523 | 3.9 ± 0.3 | 100 ± 5 | 85 ± 5 |
| | c-Si | Ga | | | 523 | 2.5 ± 0.3 | 130 ± 5 | 120 ± 5 |
| | c-Si | | Ge | | 523 | 2.9 ± 0.3 | 130 ± 5 | 130 ± 5 |
| | a-Si | | Ge | | 523 | 4.0 ± 0.3 | 110 ± 5 | 75 ± 5 |
| | c-Si | | | As | 523 | 2.7 ± 0.3 | 100 ± 5 | 100 ± 5 |
| | c-Si | Ga | | | 623 | 3.7 ± 0.3 | 130 ± 5 | 95 ± 5 |
| | c-Si | | Ge | | 623 | 4.6 ± 0.3 | 130 ± 5 | 130 ± 5 |
| | a-Si | | Ge | | 623 | 4.2 ± 0.3 | 110 ± 5 | 85 ± 5 |
| | c-Si | | | As | 623 | 4.0 ± 0.3 | 95 ± 5 | 100 ± 5 |
| regime III | | | | | | | | |
| | c-Si | Ga | | | 673 | 5.7 ± 0.3 | 85 ± 5 | 95 ± 5 |
| | a-Si | Ga | | | 673 | 4.2 ± 0.3 | 100 ± 5 | 95 ± 5 |
| | c-Si | | Ge | | 673 | 6.7 ± 0.3 | 130 ± 5 | 130 ± 5 |
| | a-Si | | Ge | | 673 | 4.2 ± 0.3 | 110 ± 5 | 95 ± 5 |
| | c-Si | | Ge | | 773 | 9.1 ± 0.3 | 130 ± 5 | 130 ± 5 |
| | a-Si | | Ge | | 773 | 8.8 ± 0.3 | 120 ± 5 | 120 ± 5 |
| | c-Si | | | As | 773 | 5.9 ± 0.3 | 95 ± 5 | 85 ± 5 |
| | c-Si | Ga | | | 873 | 10.3 ± 0.3 | 100 ± 5 | 100 ± 5 |
| | c-Si | | Ge | | 973 | 12.7 ± 0.3 | 130 ± 5 | 130 ± 5 |
Table 4.
Thermal spike mixing Q (Å) after initiating self-atom cascades in crystalline (c-Ge) and amorphous (a-Ge) germanium at temperatures ranging from 100 K to 823 K and PKA energies of 2 keV and 5 keV. The data are averaged over up to 30 individual simulations per energy, temperature, and structure.
| T (K) | 2 keV | 5 keV |
|---|
| 100: c-Ge | 17.97 ± 3.23 | 59.41 ± 14.03 |
| 100: a-Ge | 29.85 ± 3.23 | 91.24 ± 16.32 |
| 200: c-Ge | | 63.41 ± 22.93 |
| 200: a-Ge | | 105.18 ± 20.24 |
| 300: c-Ge | 19.70 ± 2.87 | 74.11 ± 18.15 |
| 300: a-Ge | 37.14 ± 2.87 | 117.33 ±15.17 |
| 400: c-Ge | | 85.49 ± 20.76 |
| 400: a-Ge | | 141.53 ± 14.26 |
| 500: c-Ge | 22.50 ± 3.94 | 95.37 ± 20.12 |
| 500: a-Ge | 50.02 ± 3.94 | 172.72 ± 11.35 |
| 550: c-Ge | | 102.13 ± 22.58 |
| 550: a-Ge | | 198.59 ± 31.08 |
| 650: c-Ge | | 117.32 ± 29.67 |
| 650: a-Ge | | |
| 723: c-Ge | | 142.44 ± 34.52 |
| 823: c-Ge | | 172.06 ± 38.29 |
Table 5.
Maximum number of liquid atoms , integrated number of liquid atoms , the mixing caused by liquid atoms , as well as the ballistic mixing are shown at temperatures of 100 K, 200 K, and 300 K averaged over up to 30 cascade simulations induced by 5 keV self-atoms.
Table 5.
Maximum number of liquid atoms , integrated number of liquid atoms , the mixing caused by liquid atoms , as well as the ballistic mixing are shown at temperatures of 100 K, 200 K, and 300 K averaged over up to 30 cascade simulations induced by 5 keV self-atoms.
| T (K) | | | (Å) | (Å) |
|---|
| 100: c-Ge | 1617 ± 237 | 2664 ± 263 | 44.2 ± 9.1 | 13.2 ± 8.3 |
| 100: a-Ge | 1972 ± 310 | 4055 ± 370 | 74.2 ± 15.3 | 15.2 ± 4.1 |
| 200: c-Ge | 1762 ± 485 | 2950 ± 796 | 49.0 ± 17.8 | 13.6 ± 9.1 |
| 200: a-Ge | 2194 ± 615 | 4953 ± 967 | 91.4 ± 19.4 | 12.5 ± 5.3 |
| 300: c-Ge | 1915 ± 530 | 3294 ± 893 | 63.2 ± 19.2 | 9.2 ± 5.9 |
| 300: a-Ge | 2106 ± 620 | 6073 ± 1724 | 96.0 ± 22.1 | 19.8 ± 8.9 |
Table 6.
Atomic mixing
Q for crystalline and amorphous silicon induced by 5 keV self-atom cascades at temperatures between 100 K and 700 K calculated with Equation (
6).
Table 6.
Atomic mixing
Q for crystalline and amorphous silicon induced by 5 keV self-atom cascades at temperatures between 100 K and 700 K calculated with Equation (
6).
| T (K) | Target | Q (Å) |
|---|
| 100 | crystalline | 53.55 ± 9.45 |
| 100 | amorphous | 80.56 ± 12.61 |
| 300 | crystalline | 54.82 ± 8.42 |
| 300 | amorphous | 97.95 ± 16.11 |
| 500 | amorphous | 116.28 ± 11.58 |
| 550 | crystalline | 63.22 ± 10.93 |
| 600 | amorphous | 127.95 ± 18.19 |
| 650 | crystalline | 68.60 ± 6.51 |
| 700 | amorphous | 152.18 ± 23.50 |
| 750 | crystalline | 79.03 ± 15.54 |
Table 7.
Maximum number of liquid atoms , integrated number of liquid atoms , the mixing caused by liquid atoms , as well as the ballistic mixing are shown at temperatures between 100 K and 300 K averaged over up to 30 cascade simulations induced by 5 keV self-atoms in silicon and germanium.
Table 7.
Maximum number of liquid atoms , integrated number of liquid atoms , the mixing caused by liquid atoms , as well as the ballistic mixing are shown at temperatures between 100 K and 300 K averaged over up to 30 cascade simulations induced by 5 keV self-atoms in silicon and germanium.
| T (K) | | | (Å) | (Å) |
|---|
| 100: c-Si | 974 ± 279 | 1873 ± 241 | 10.8 ± 5.1 | 42.2 ± 14.4 |
| 100: a-Si | 760 ± 135 | 3512 ± 380 | 32.2 ± 10.3 | 48.2 ± 15.7 |
| 300: c-Si | 1232 ± 488 | 2306 ± 546 | 17.4 ± 6.6 | 37.4 ± 16.2 |
| 300: a-Si | 869 ± 141 | 4617 ± 537 | 44.9 ± 14.7 | 52.4 ± 17.1 |
| 100: c-Ge | 1617 ± 237 | 2664 ± 263 | 44.2 ± 9.1 | 13.2 ± 8.3 |
| 100: a-Ge | 1972 ± 310 | 4055 ± 370 | 74.2 ± 15.3 | 15.2 ± 4.1 |
| 200: c-Ge | 1762 ± 485 | 2950 ± 796 | 49.0 ± 17.8 | 13.6 ± 9.1 |
| 200: a-Ge | 2194 ± 615 | 4953 ± 967 | 91.4 ± 19.4 | 12.5 ± 5.3 |
| 300: c-Ge | 1915 ± 530 | 3294 ± 893 | 63.2 ± 19.2 | 9.2 ± 5.9 |
| 300: a-Ge | 2106 ± 620 | 6073 ± 1724 | 96.0 ± 22.1 | 19.8 ± 8.9 |


