Utilization of Jujube Biomass to Prepare Biochar by Pyrolysis and Activation: Characterization, Adsorption Characteristics, and Mechanisms for Nitrogen


 ,
,  , and
, and
Abstract
:1. Introduction
2. Materials and Methods
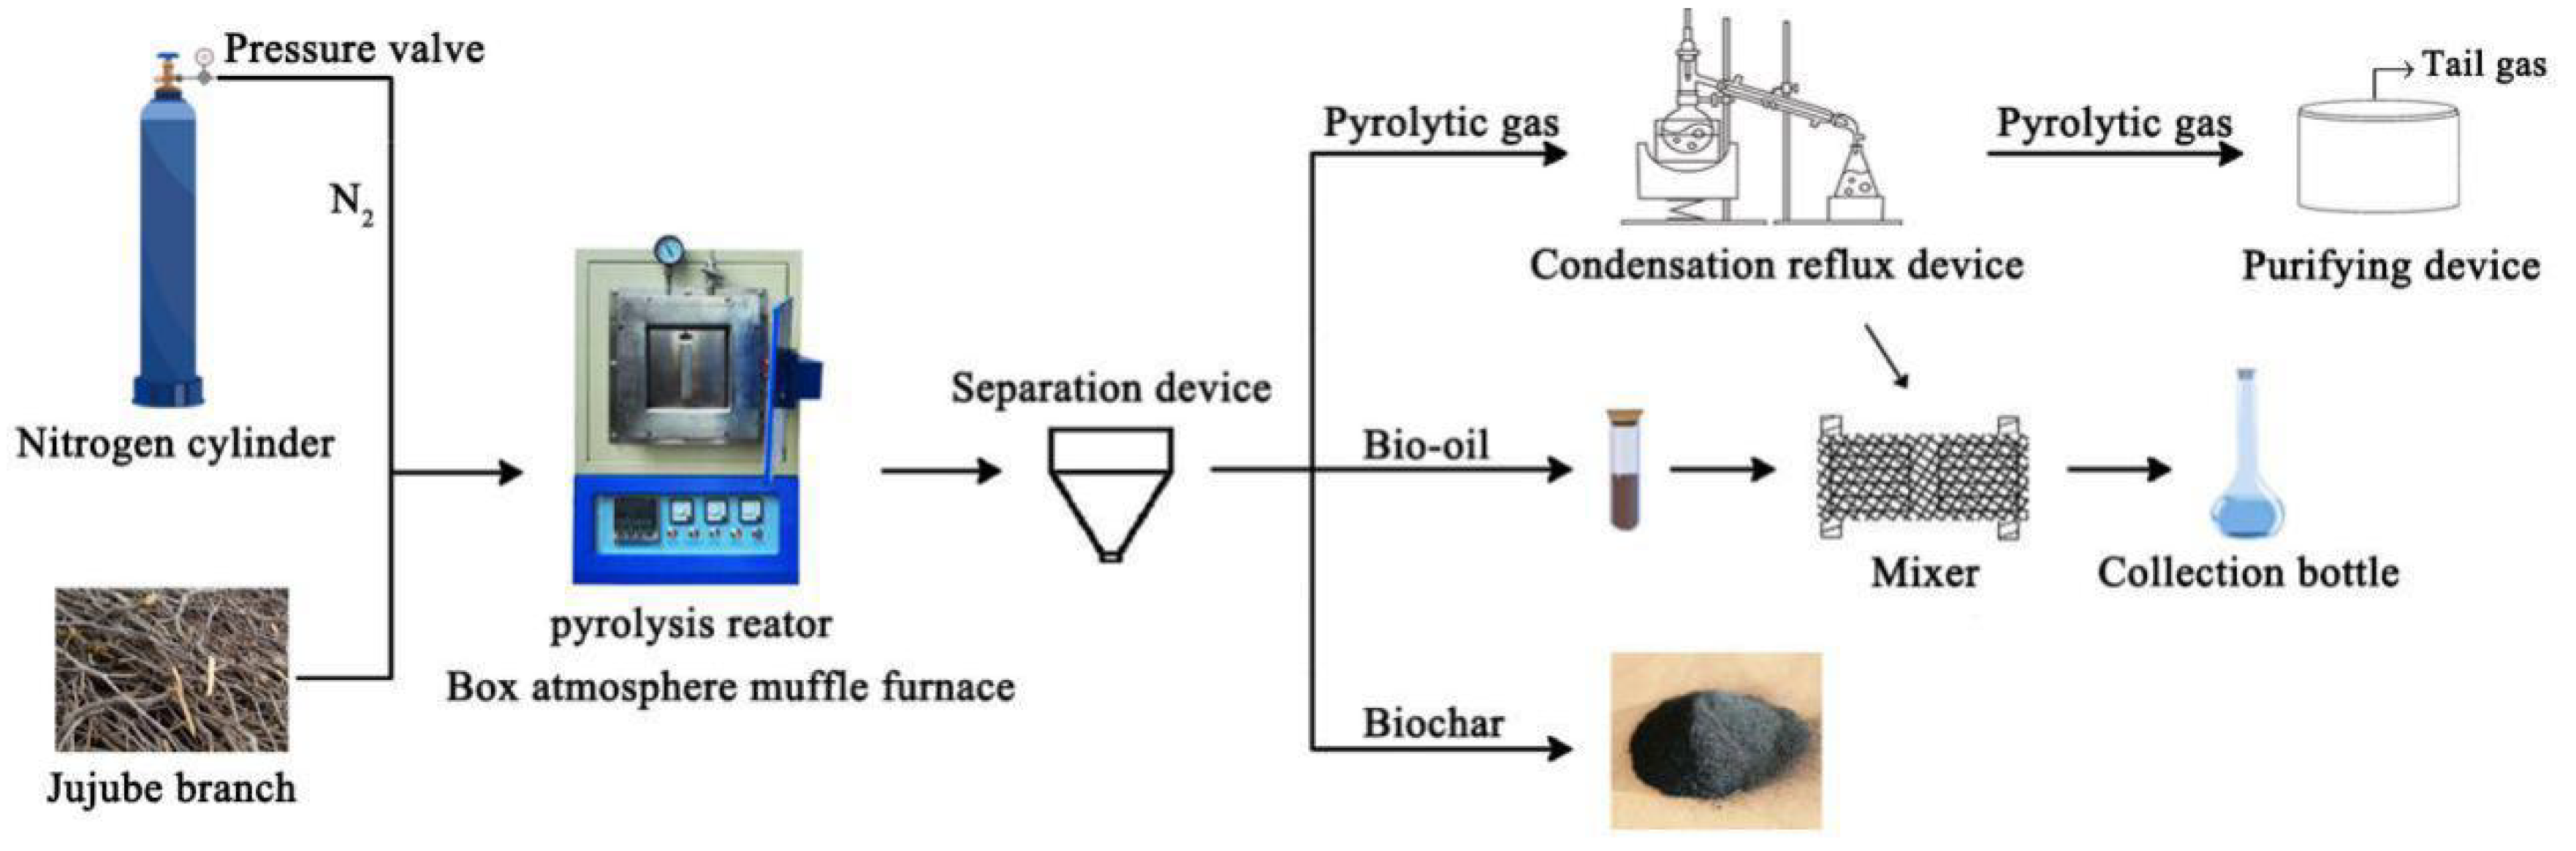
2.1. Preparation of Biochar
2.2. Characterization
2.3. Batch Experiments
2.4. Data Analysis
3. Results and Discussions
3.1. Biochar Characterization
3.1.1. Basic Properties
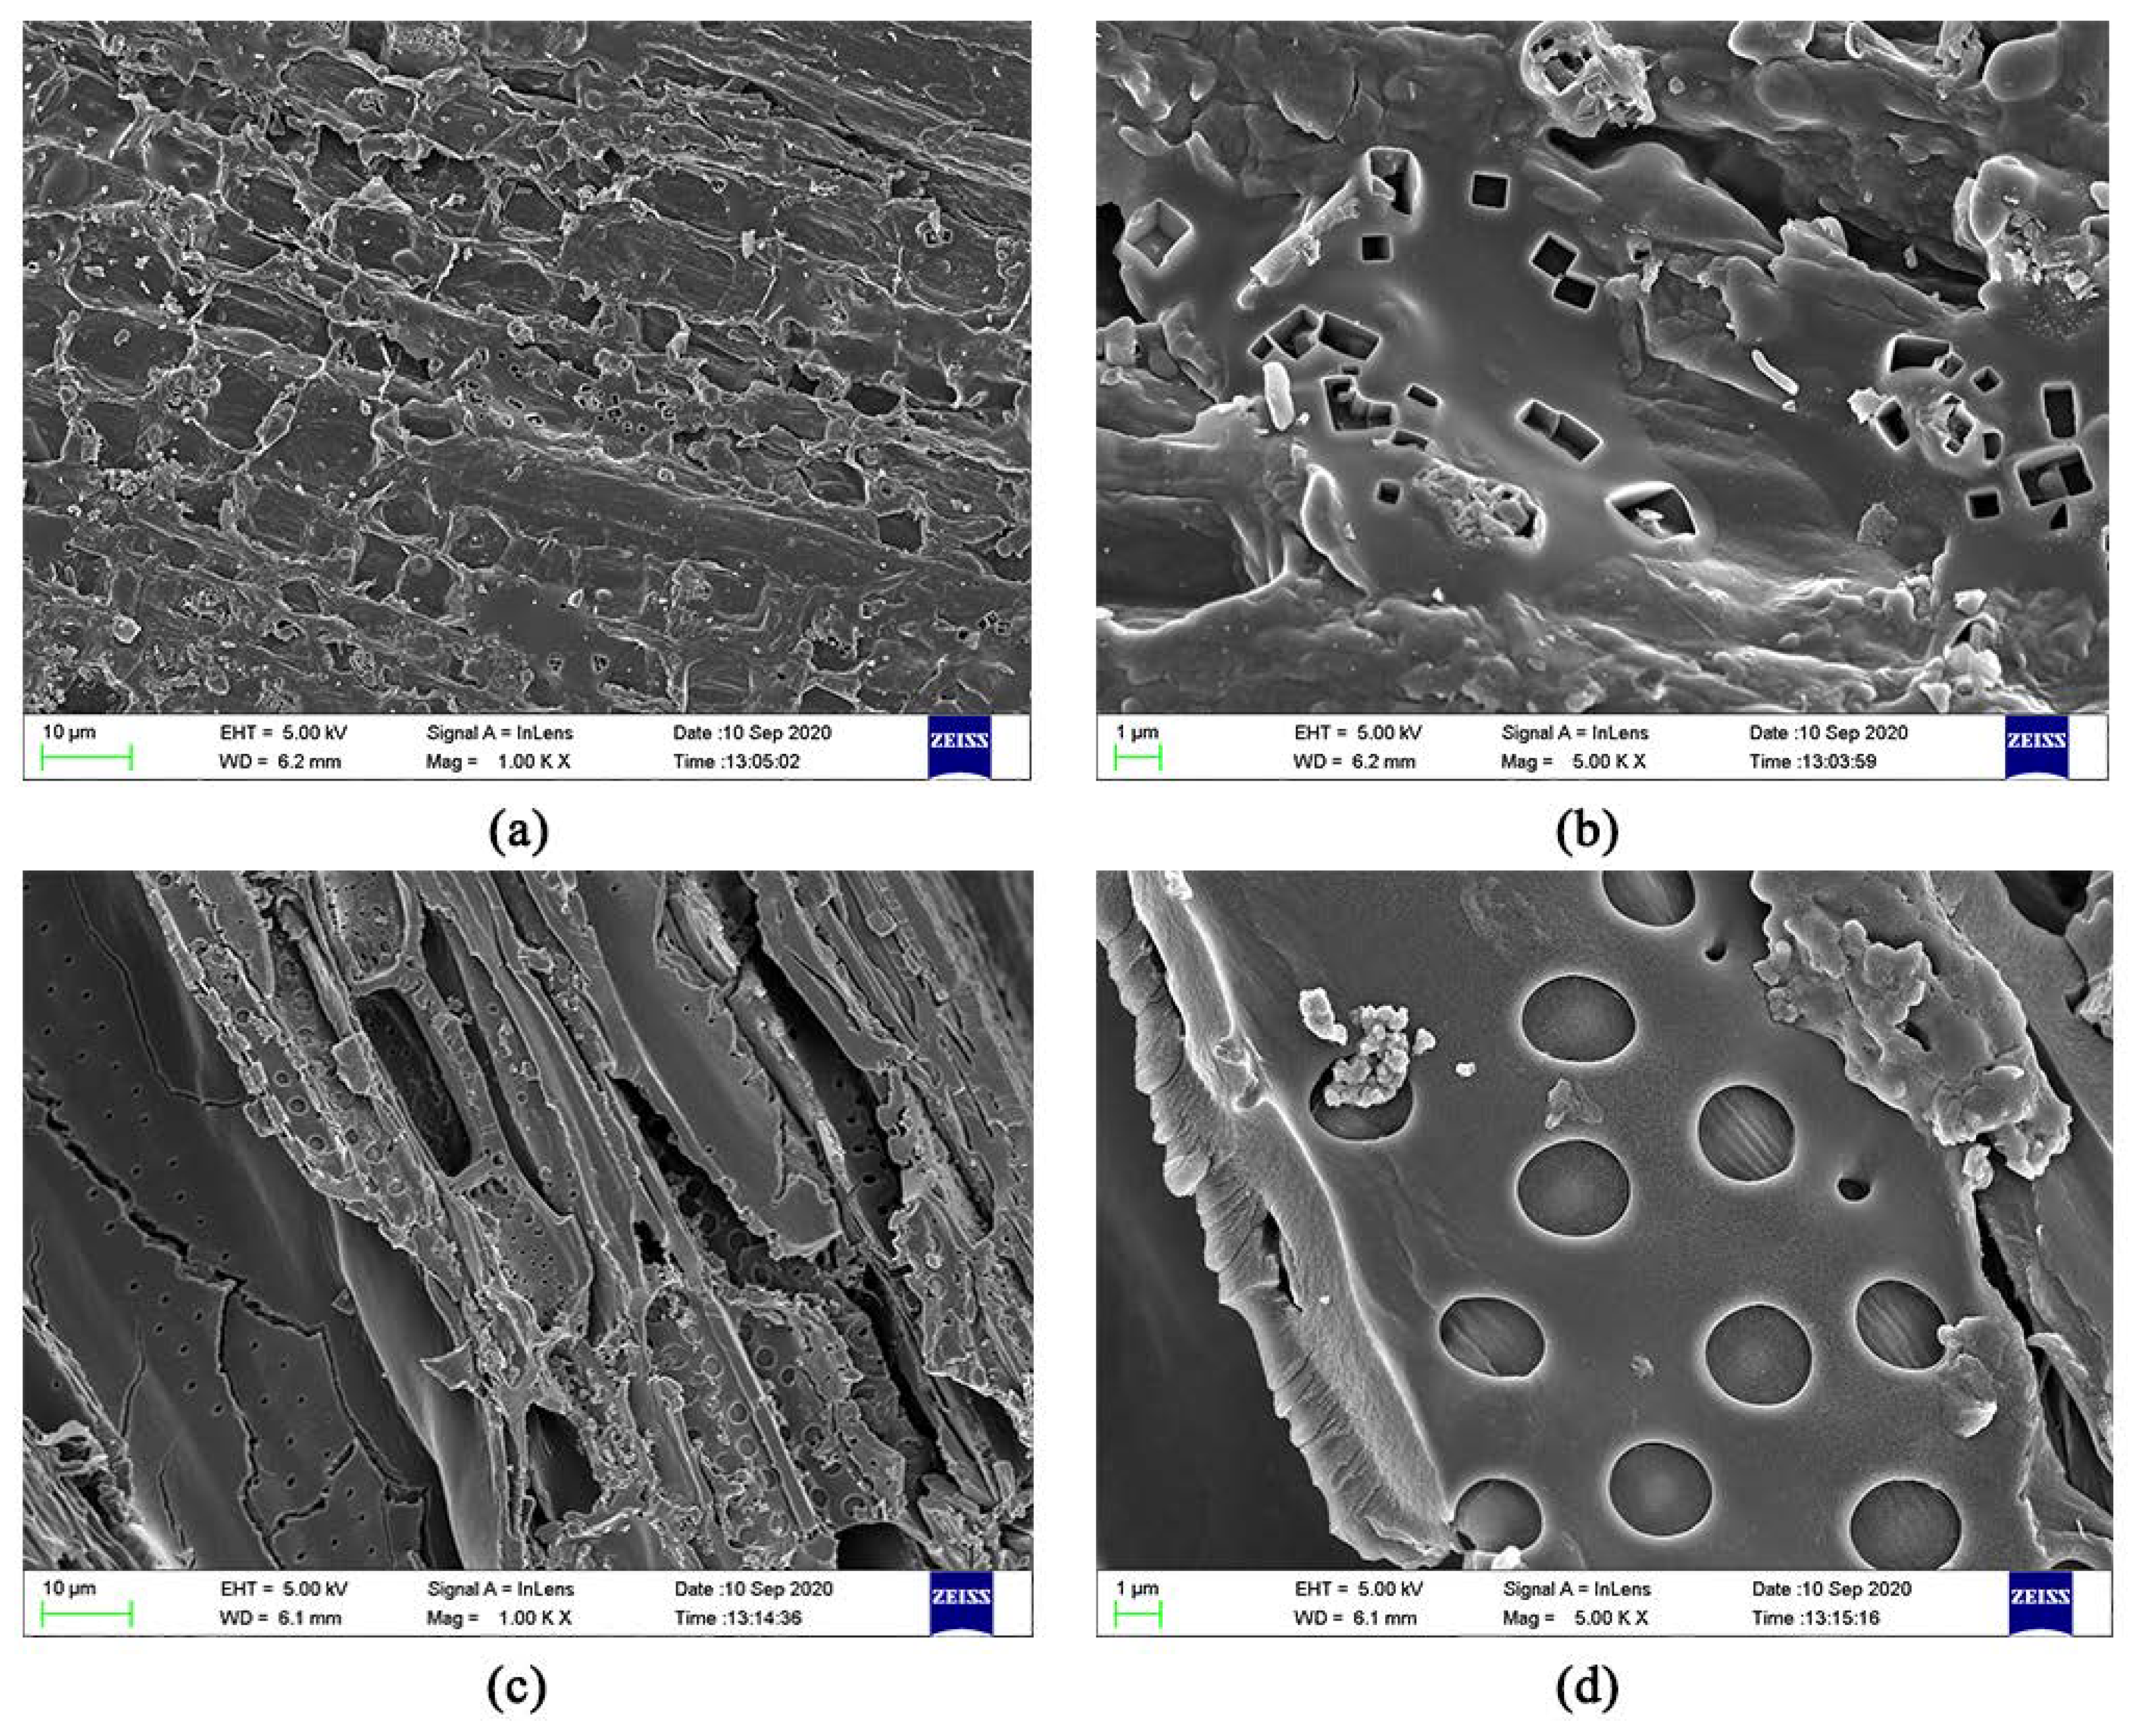
3.1.2. SEM
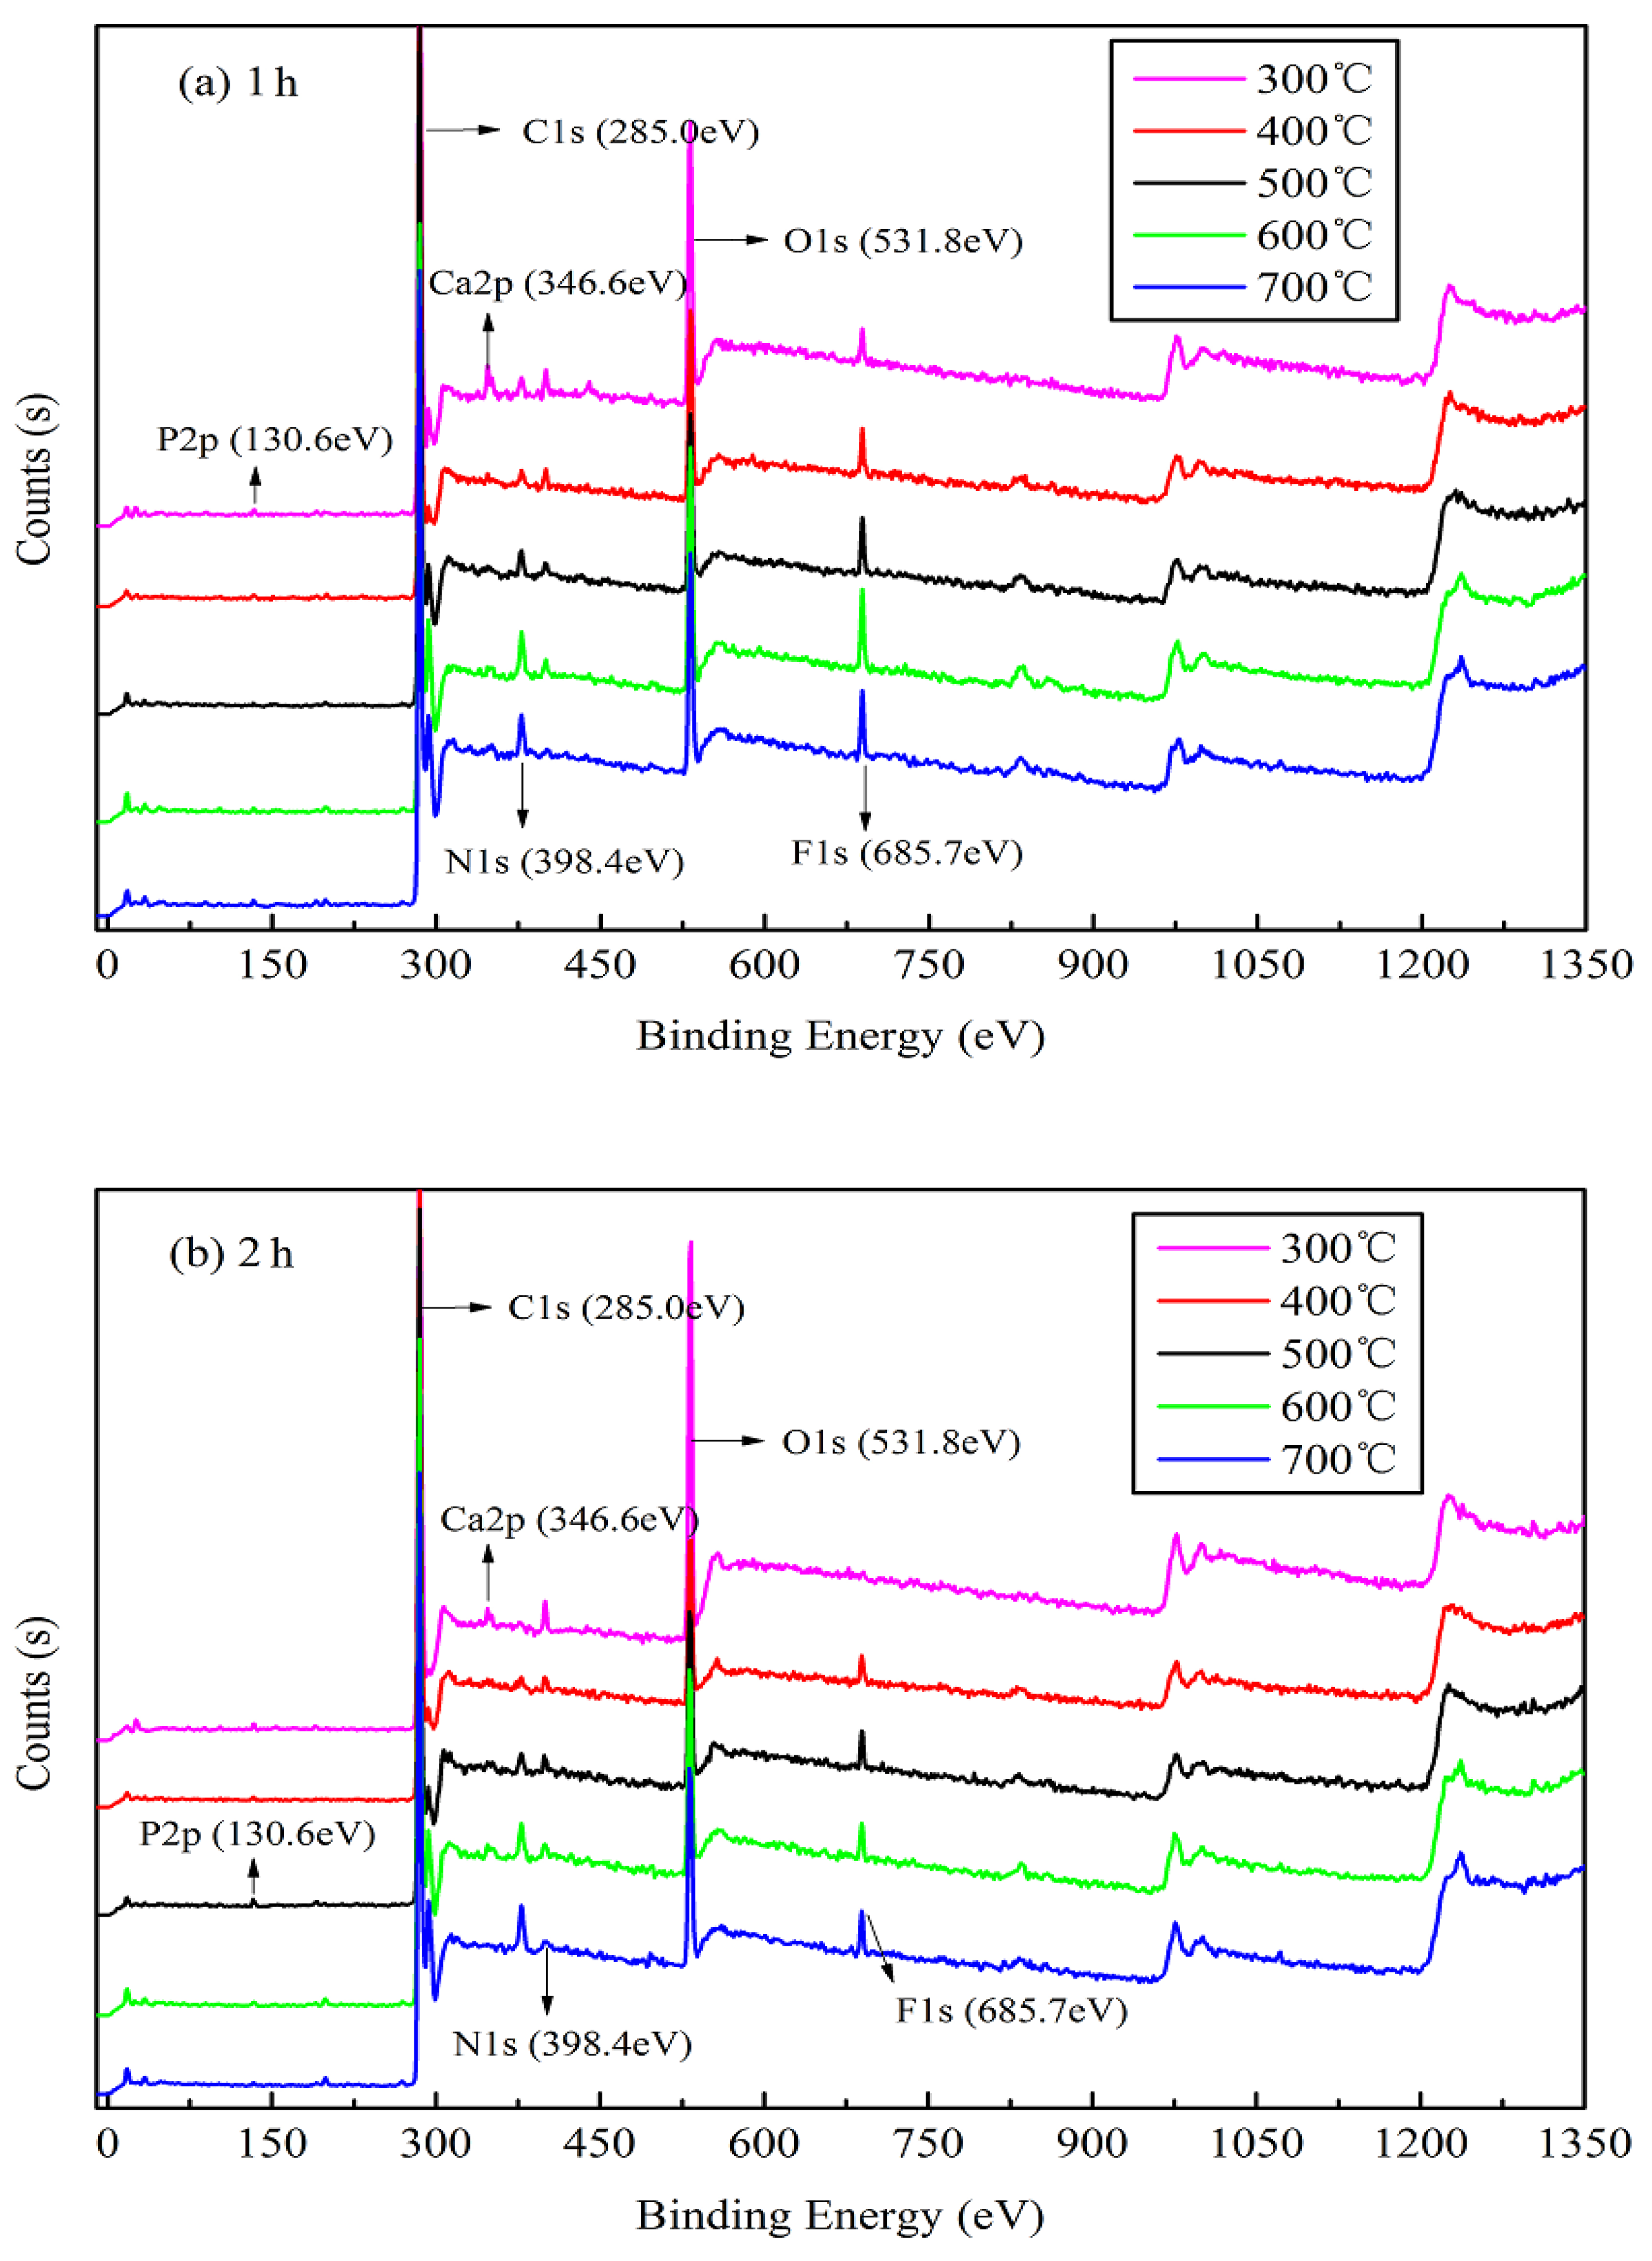
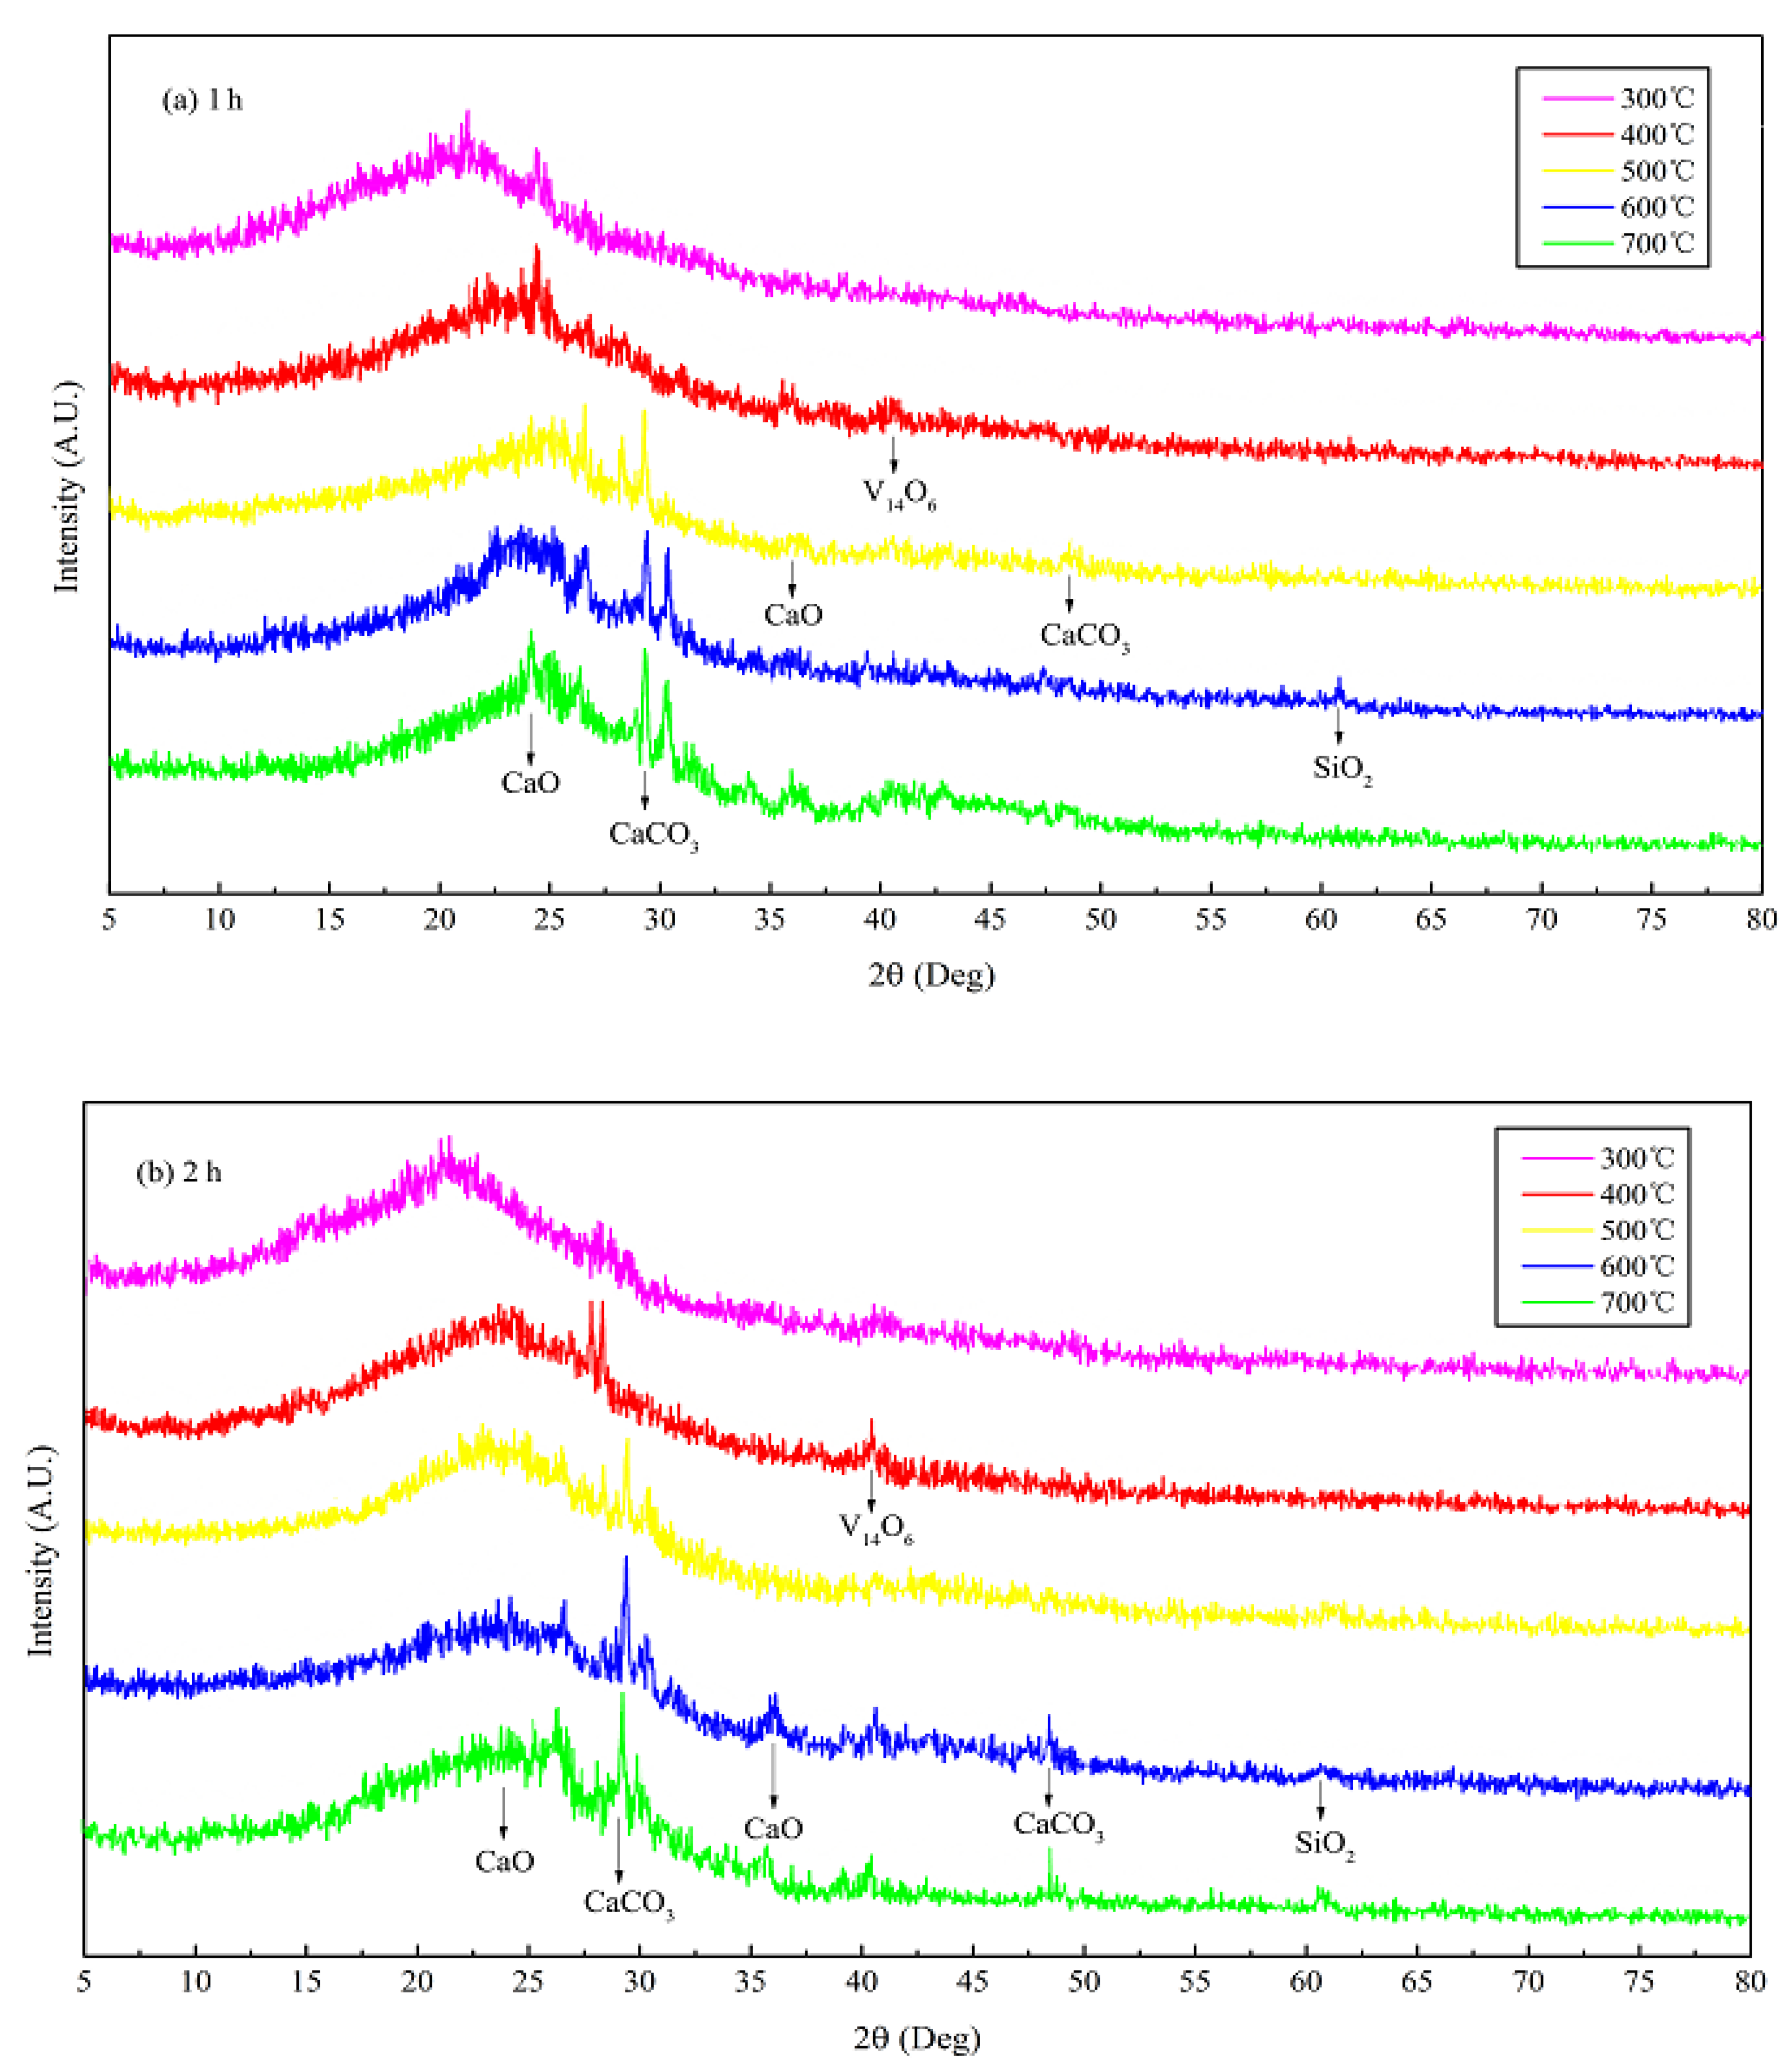
3.1.3. XPS and XRD
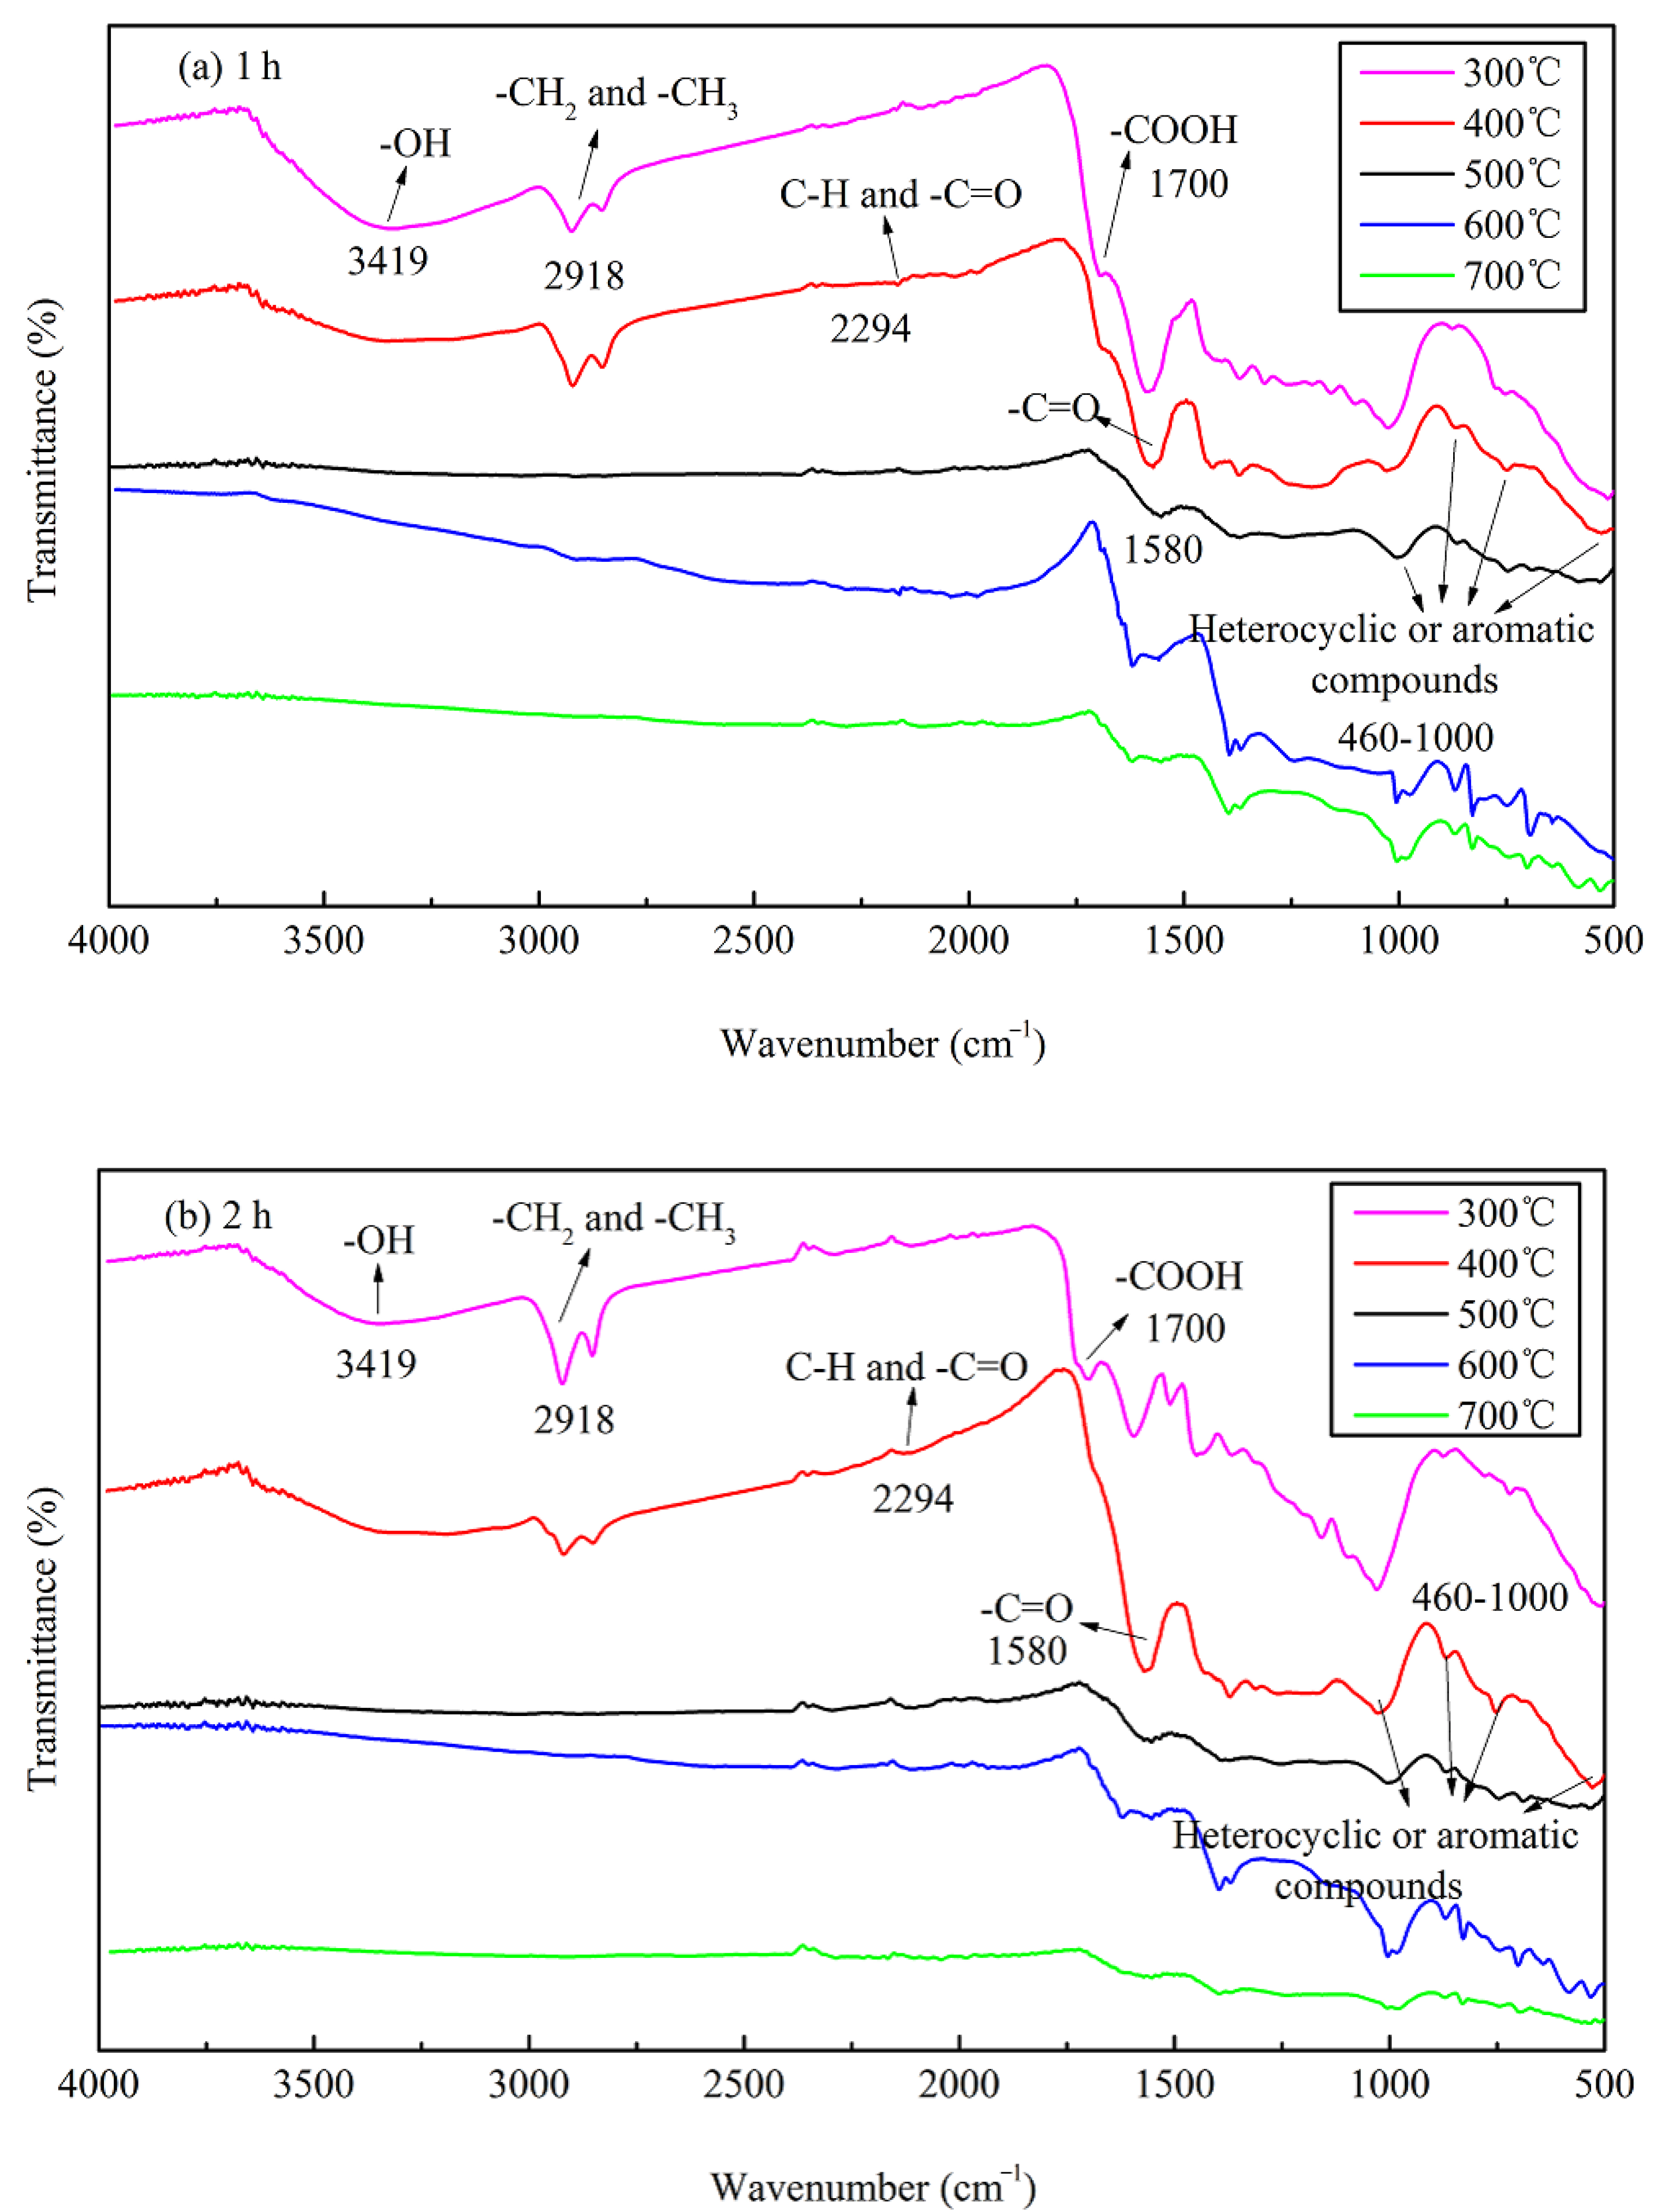
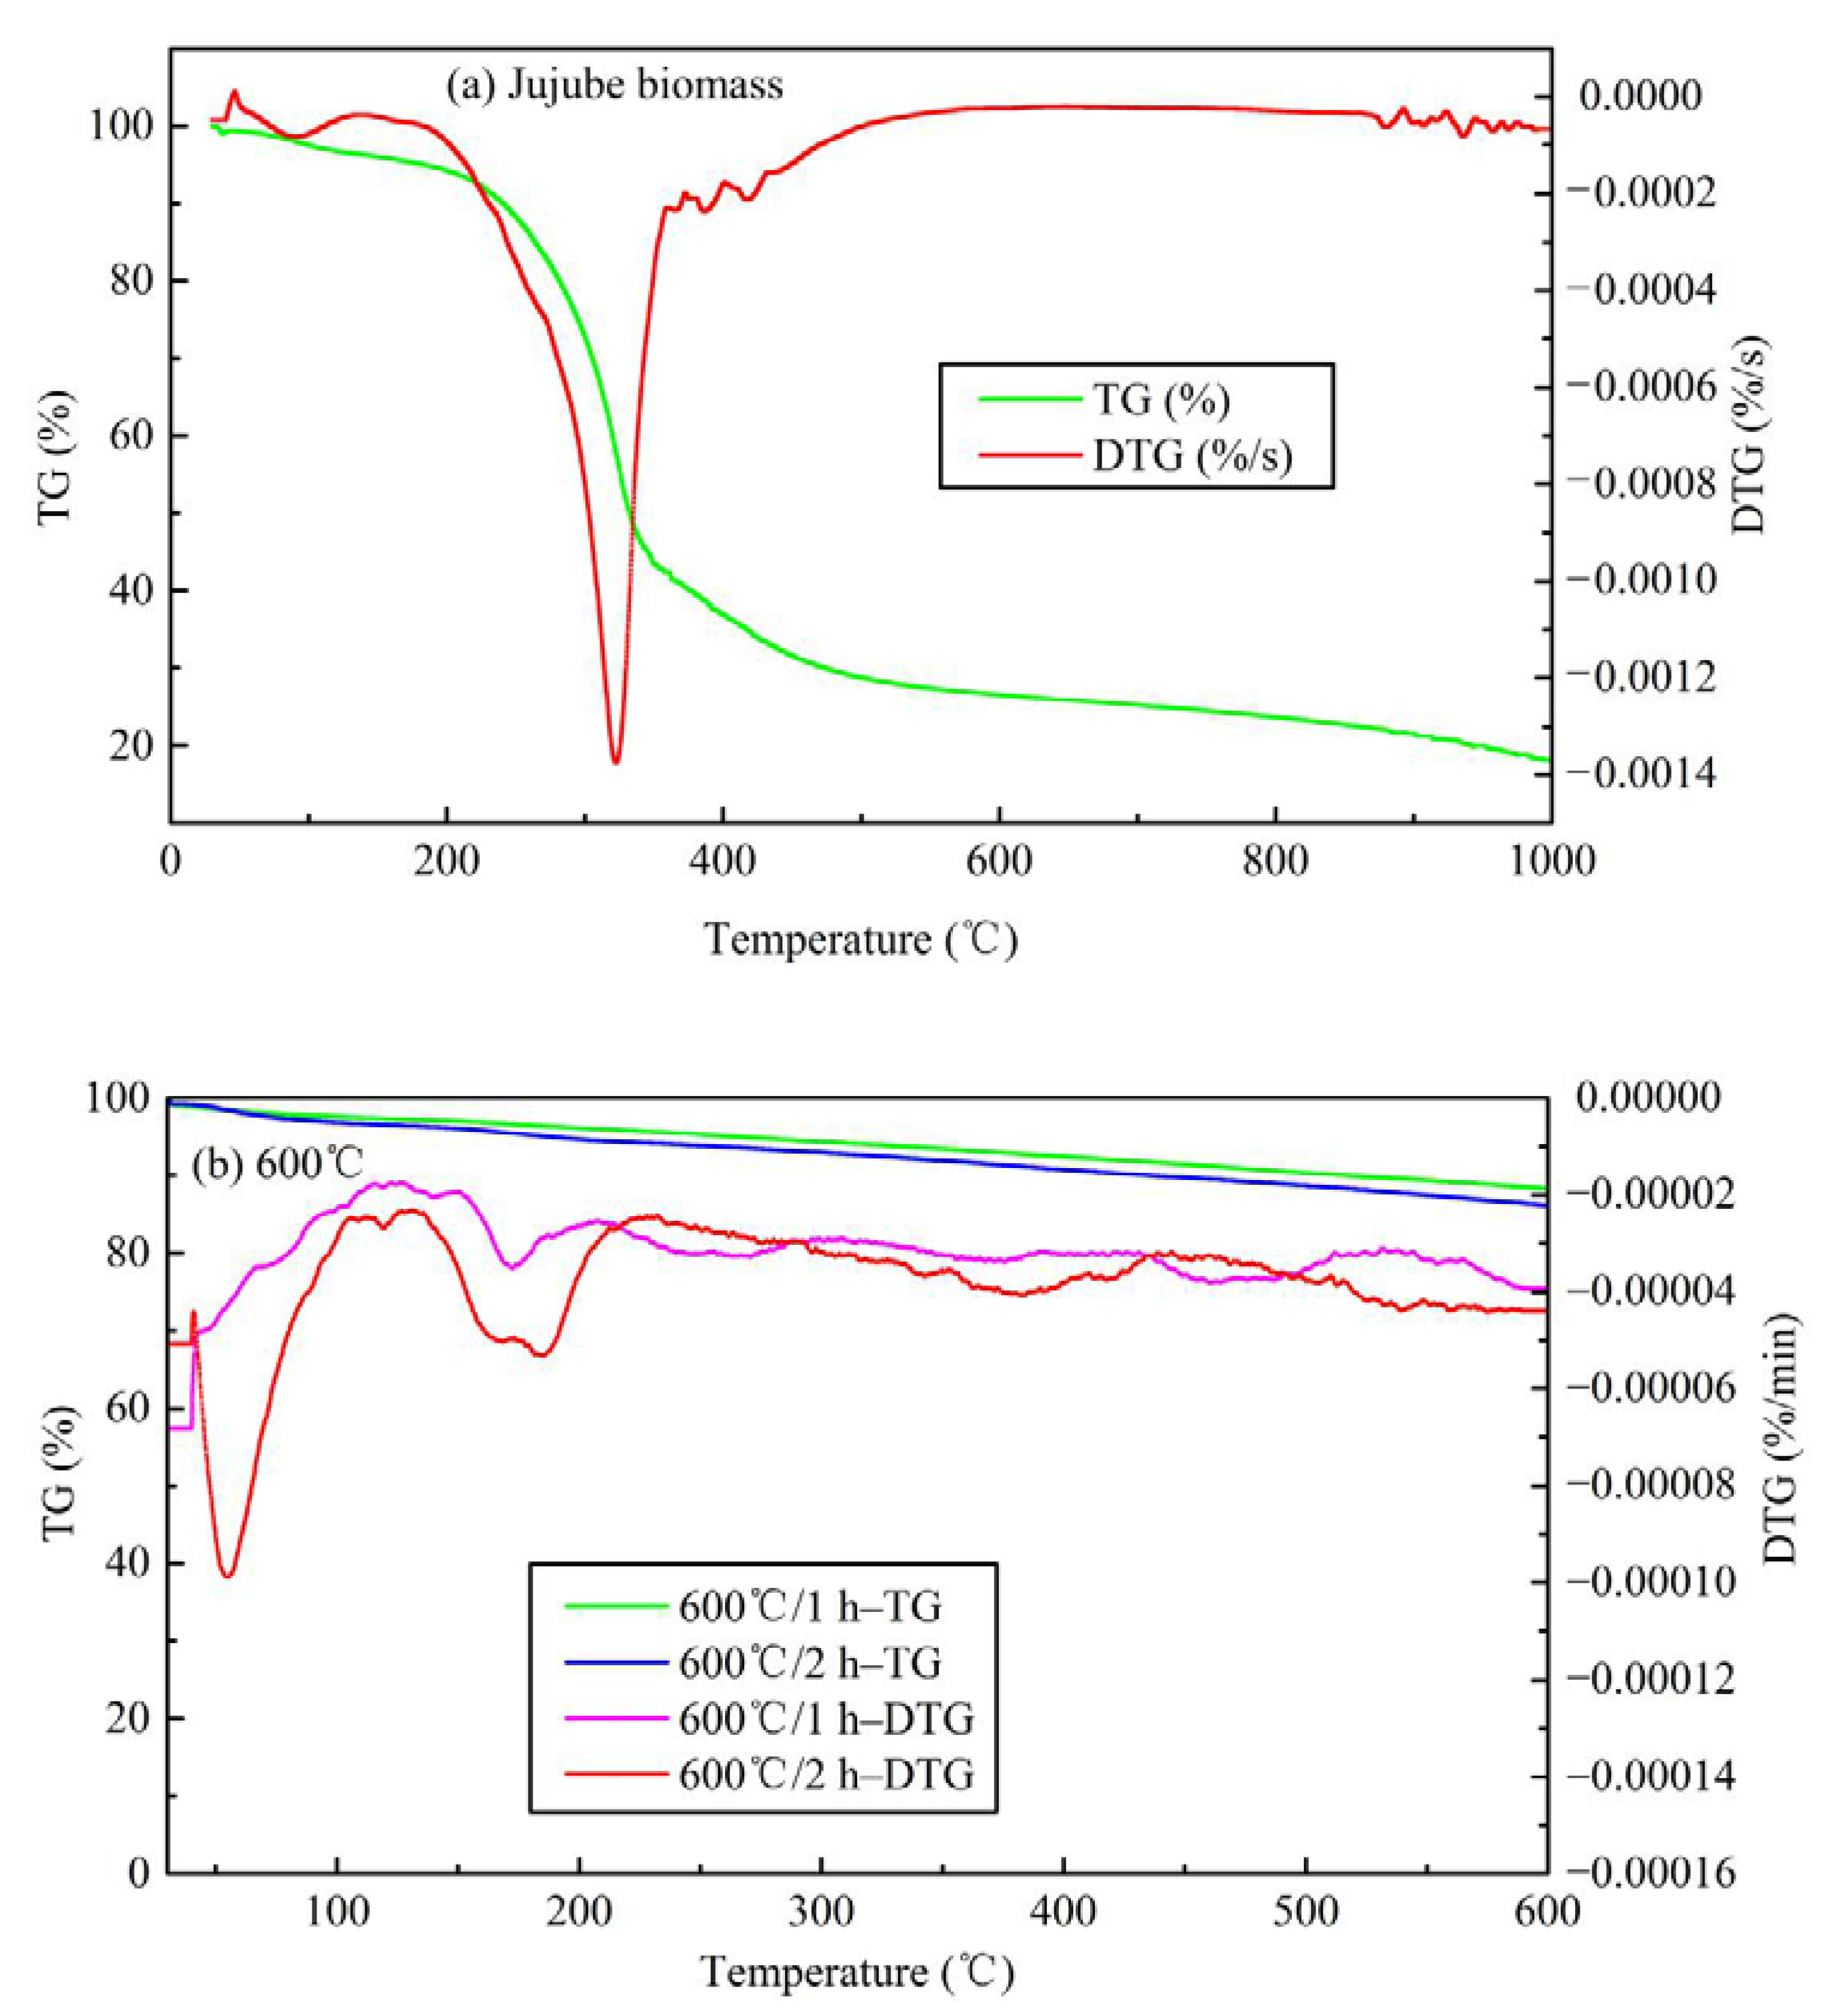
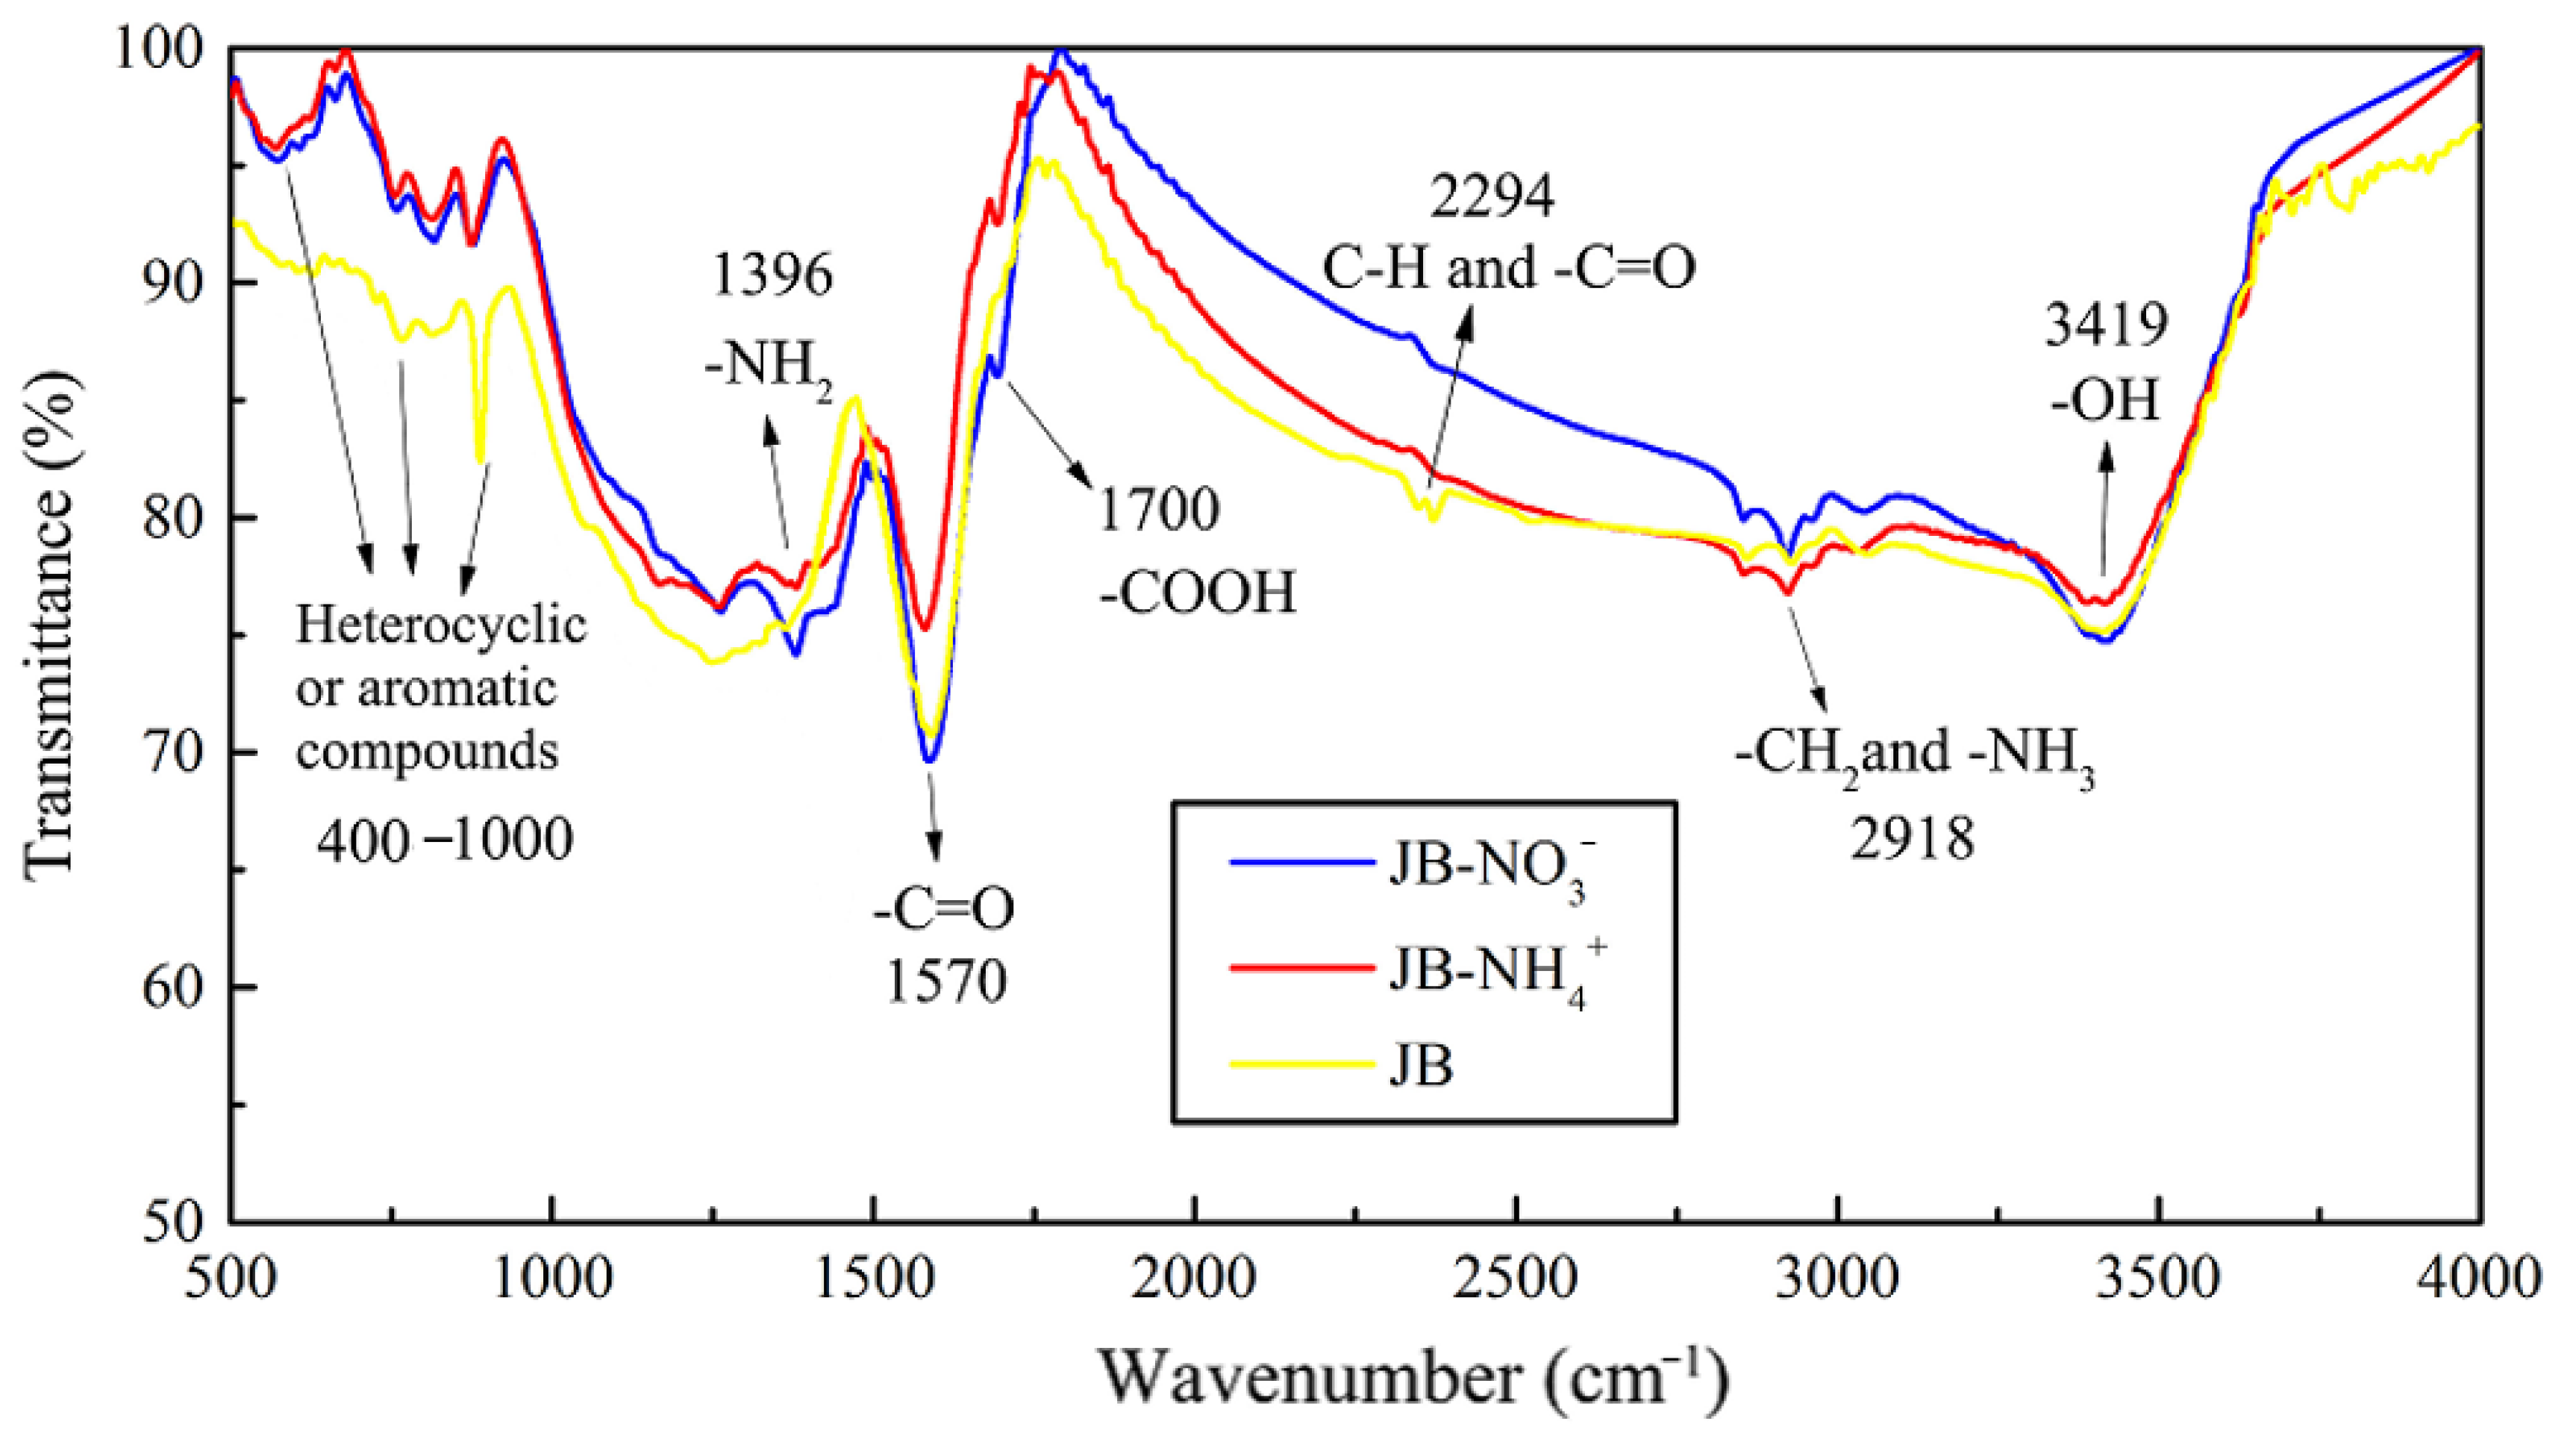
3.1.4. FTIR and Thermogravimetric Analysis
3.2. Adsorption Application
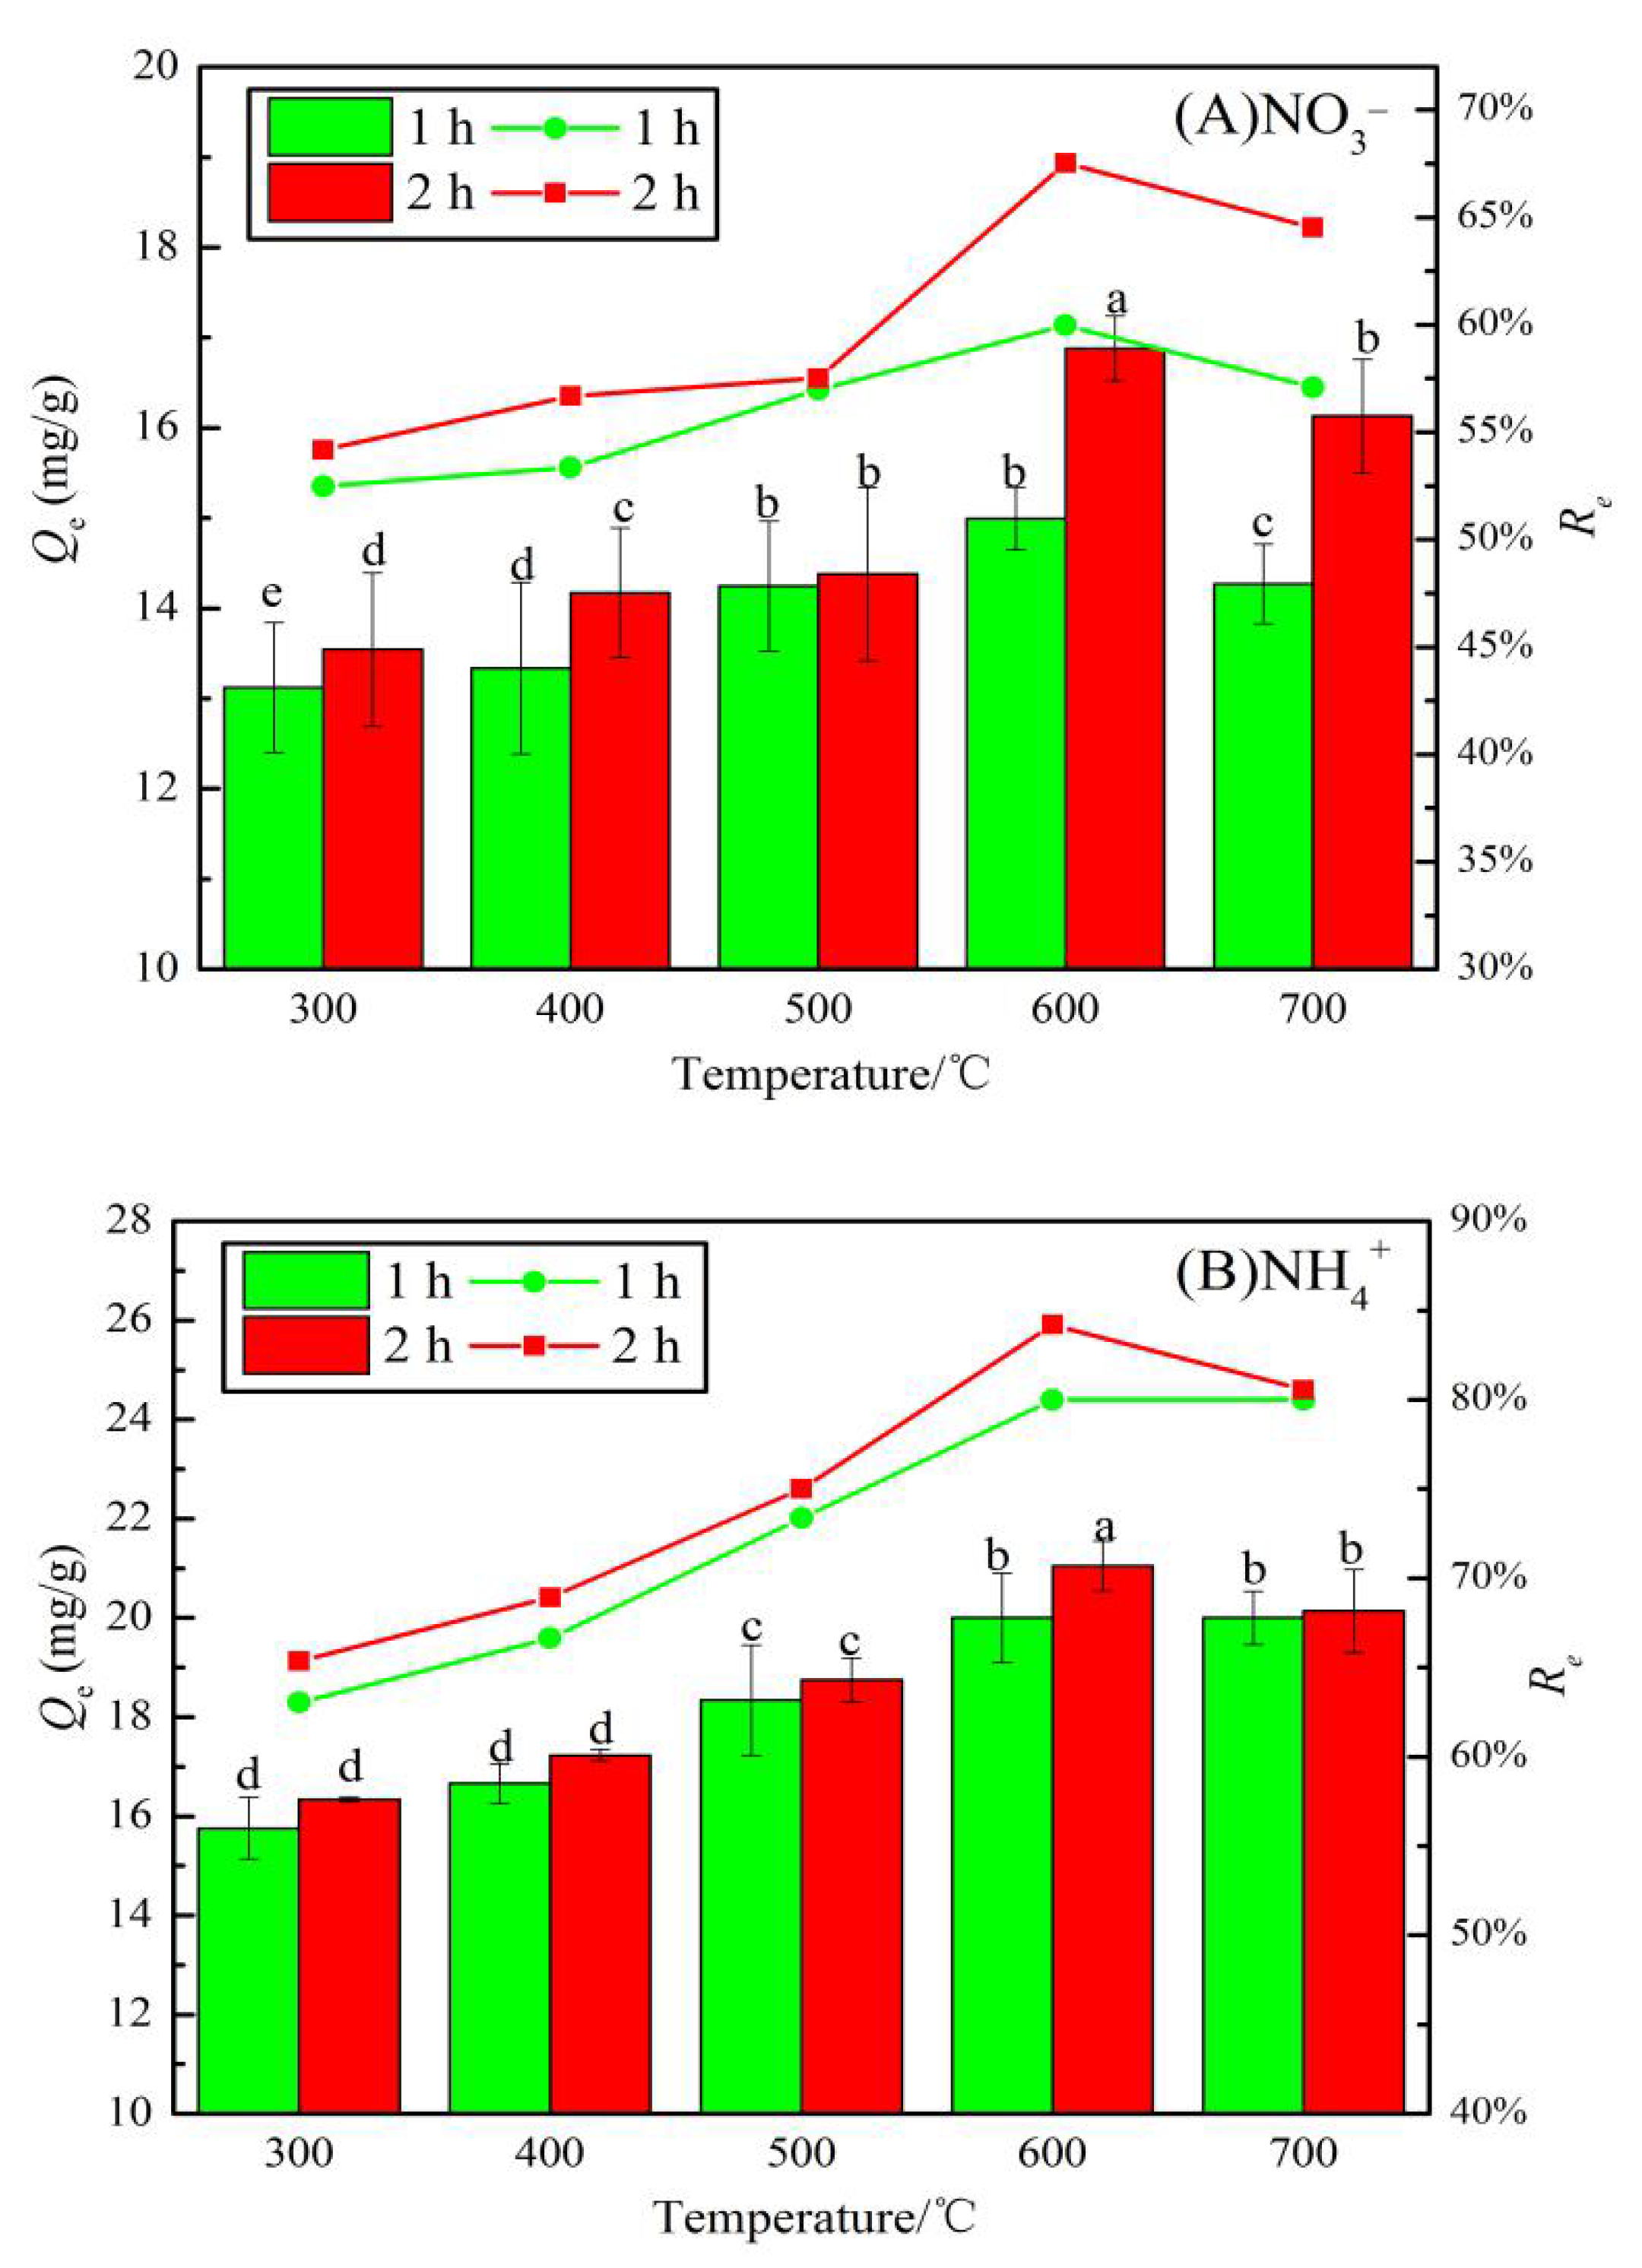
3.2.1. Optimal Carbonization Parameters
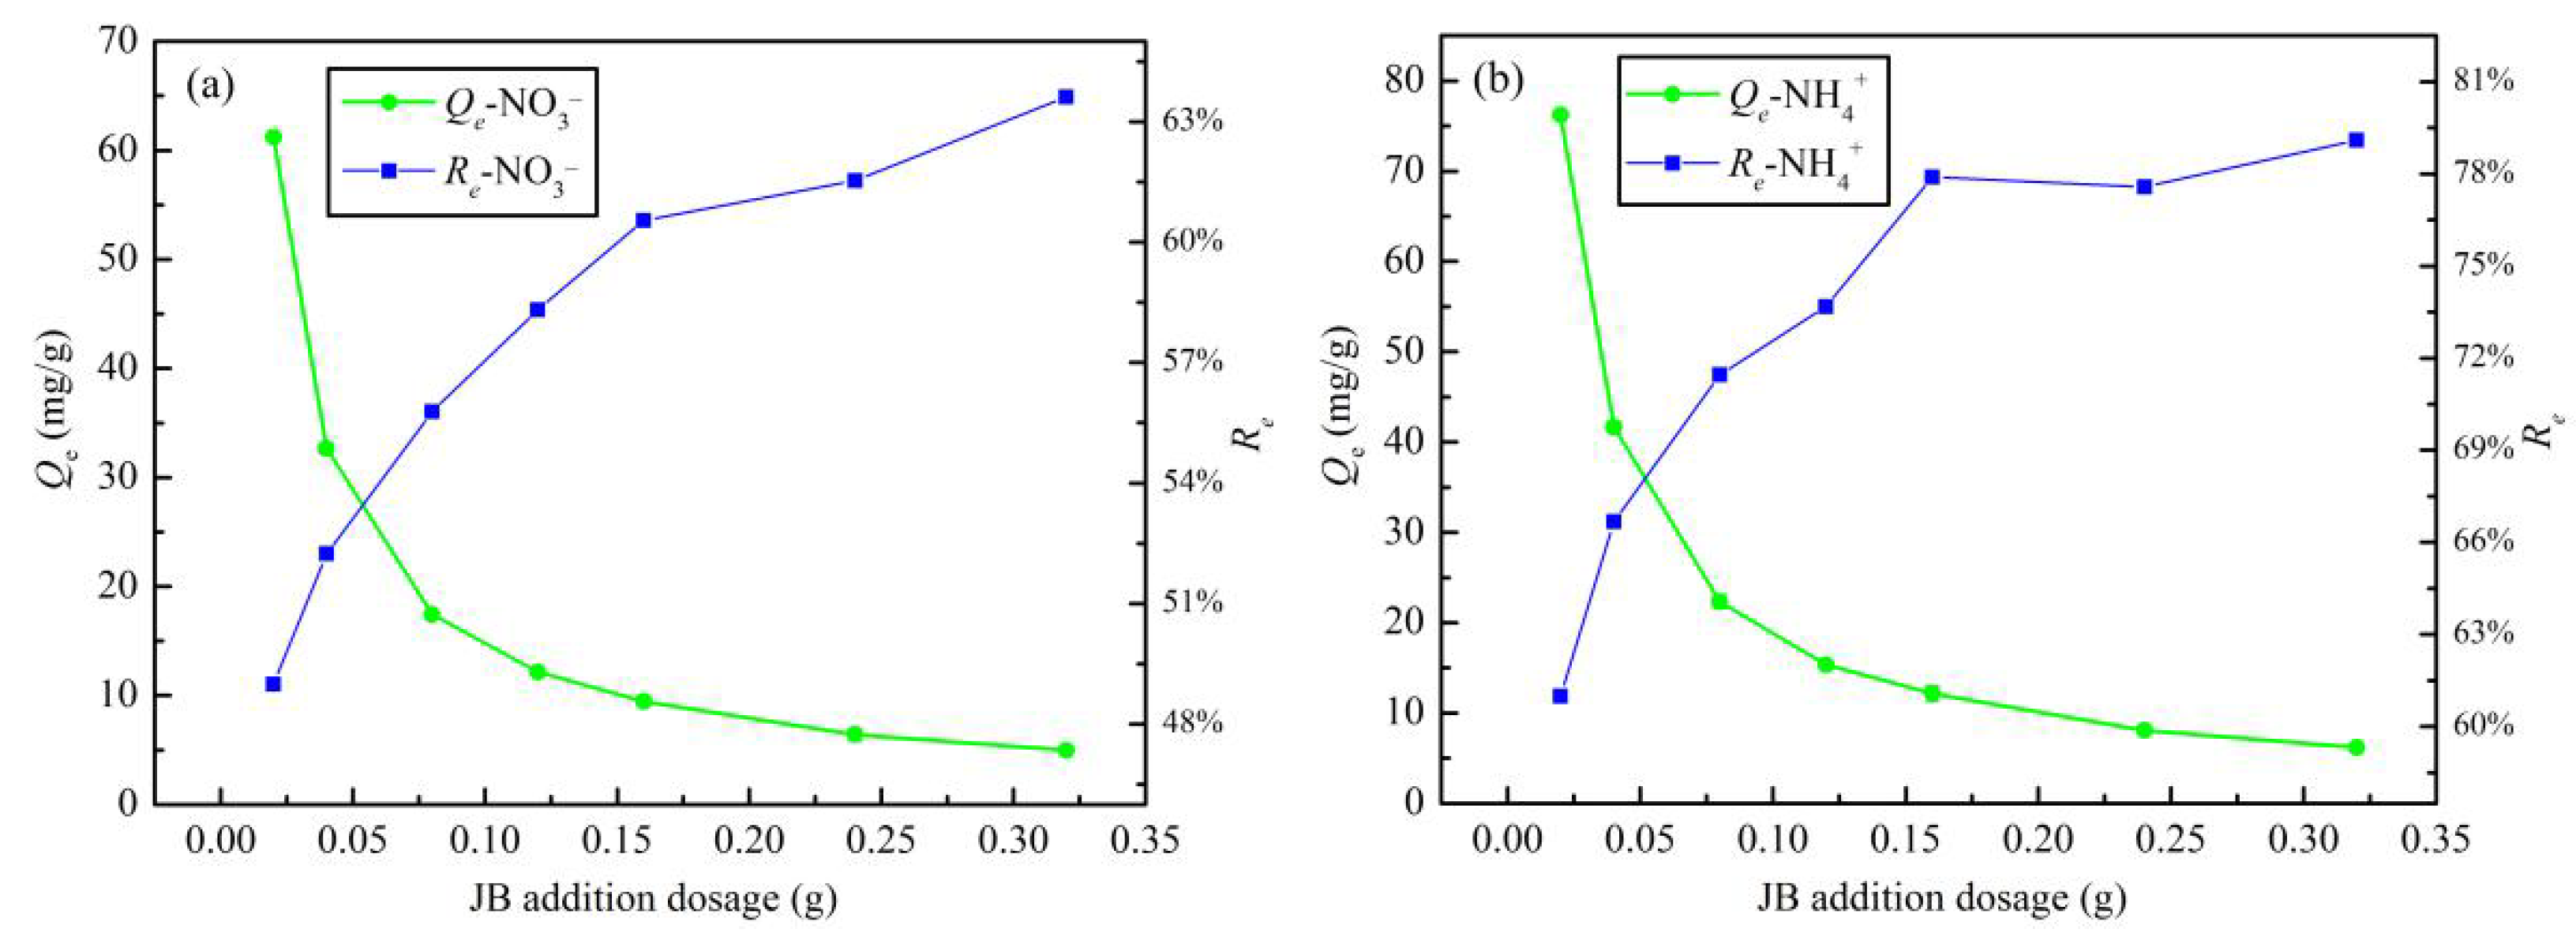
3.2.2. Addition Dosage
3.3. Isotherms Adsorption
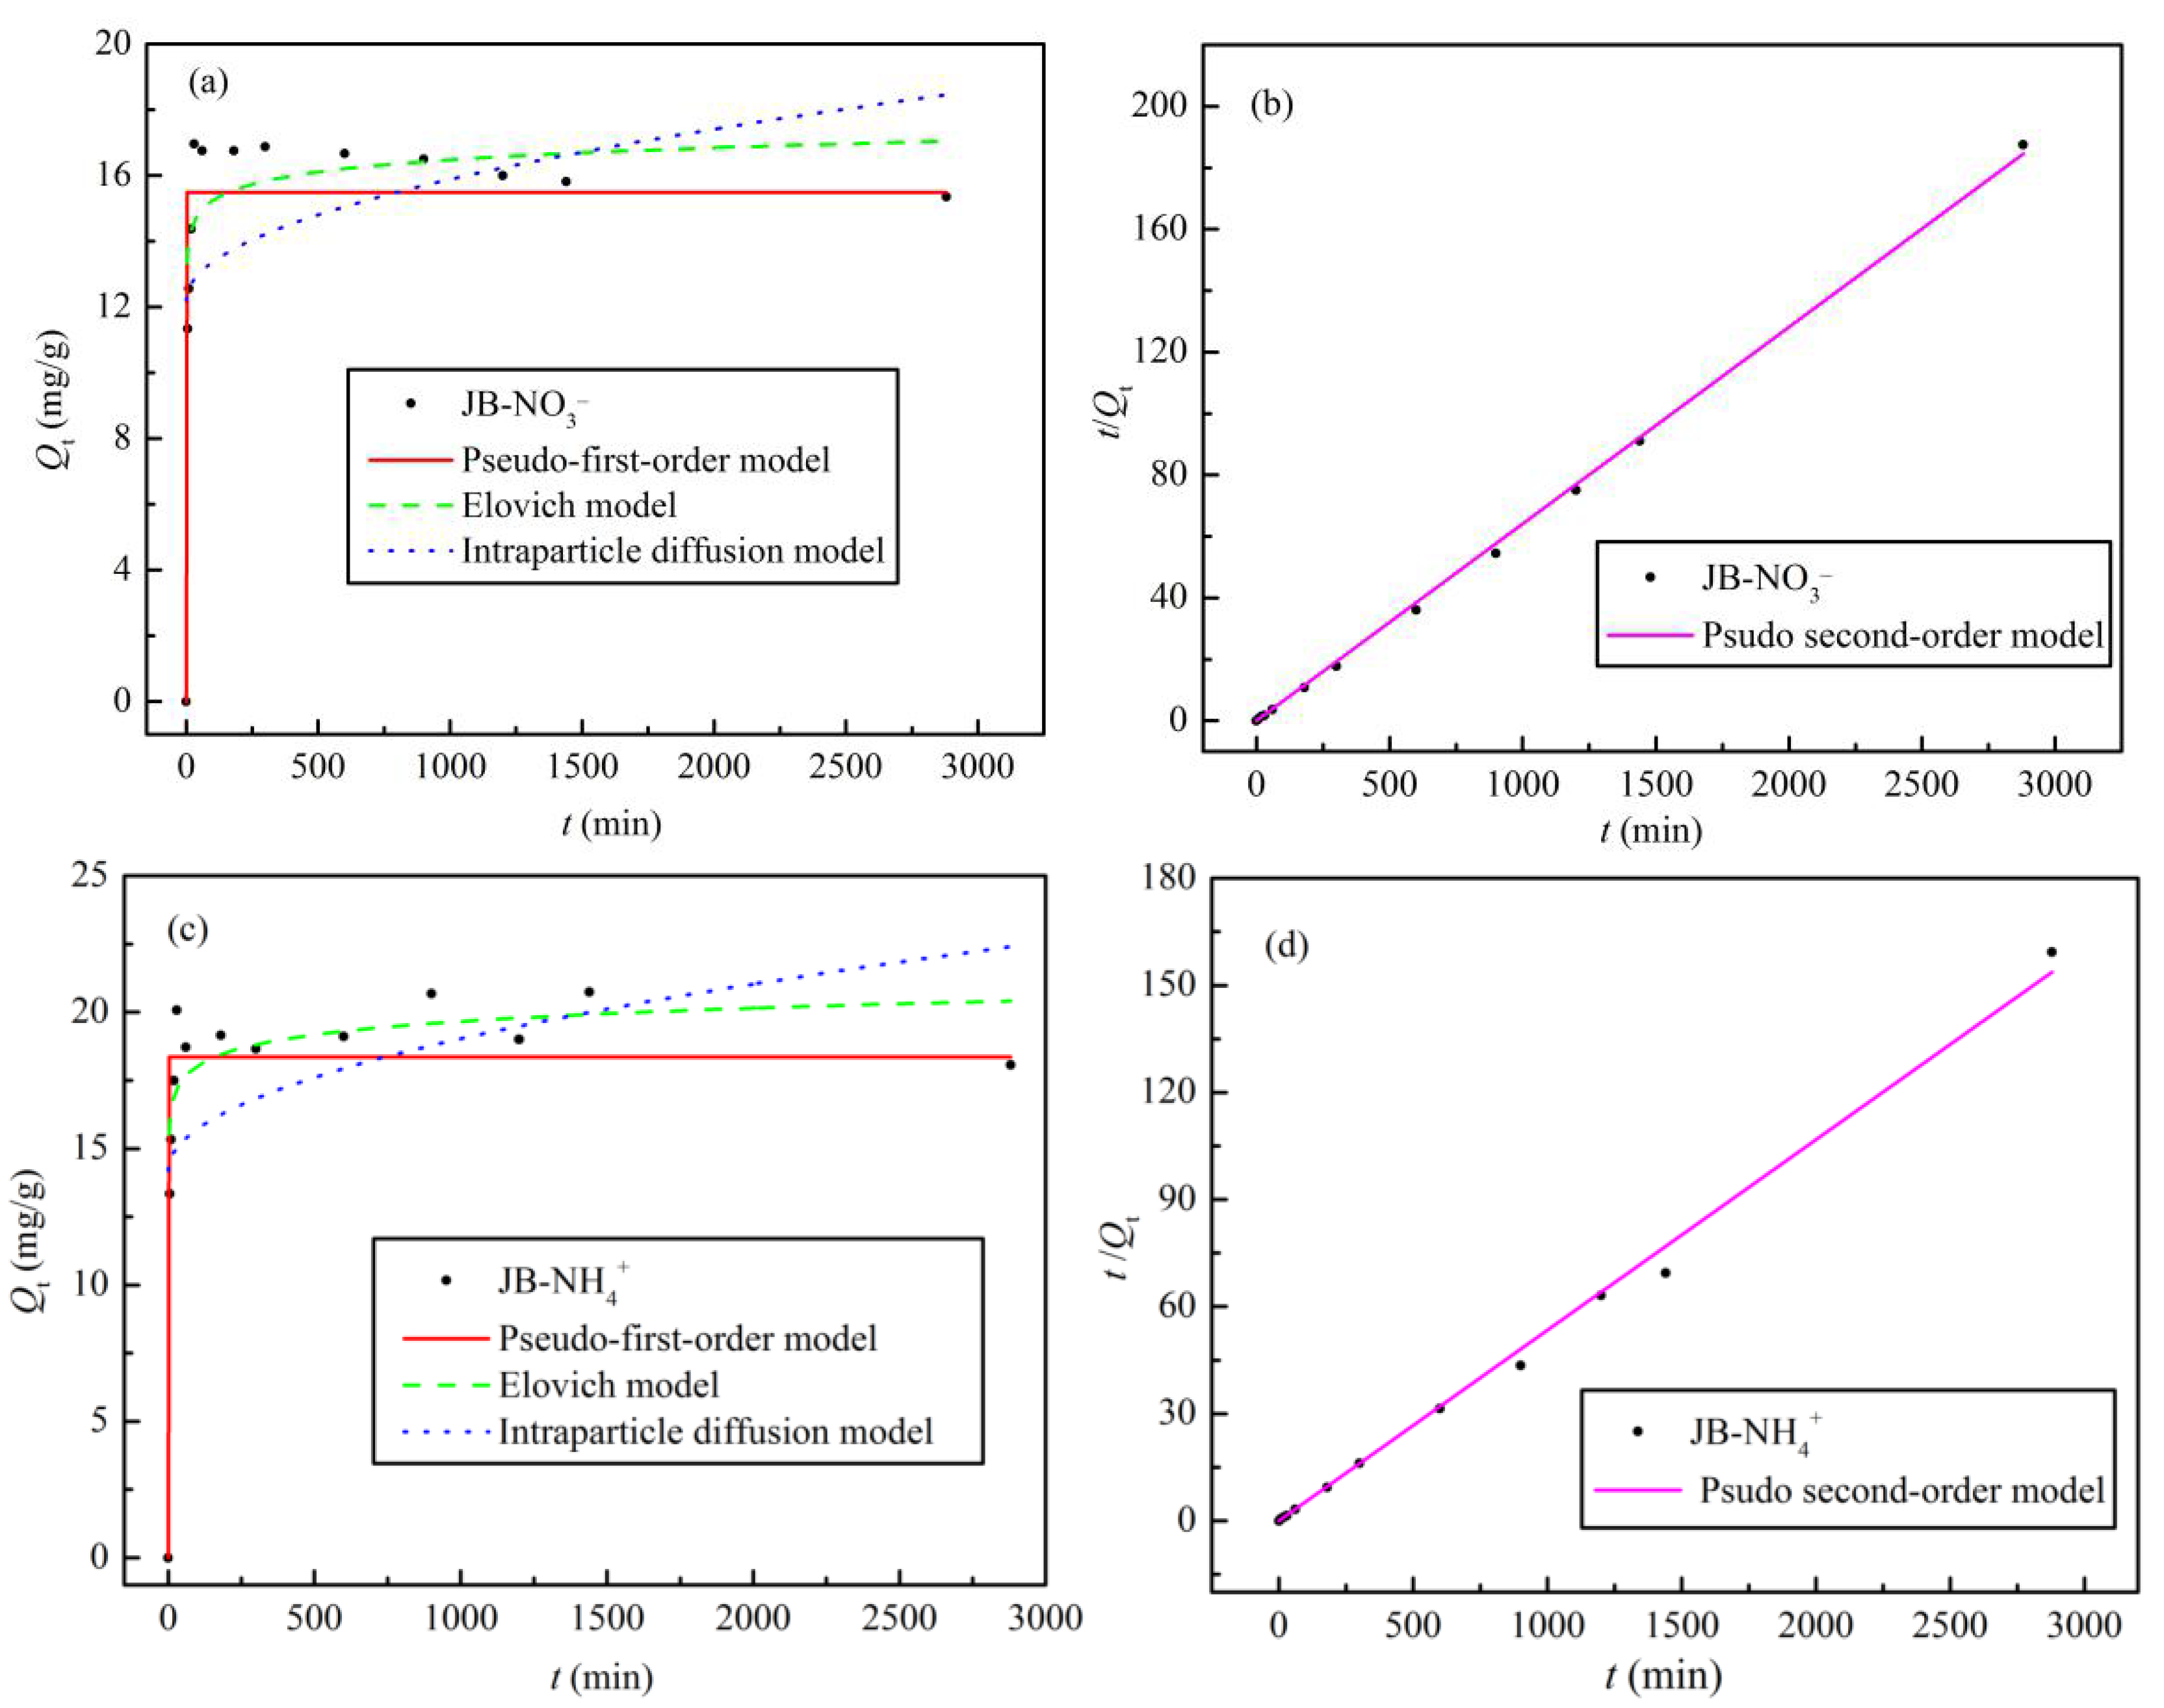
3.4. Adsorption Kinetics
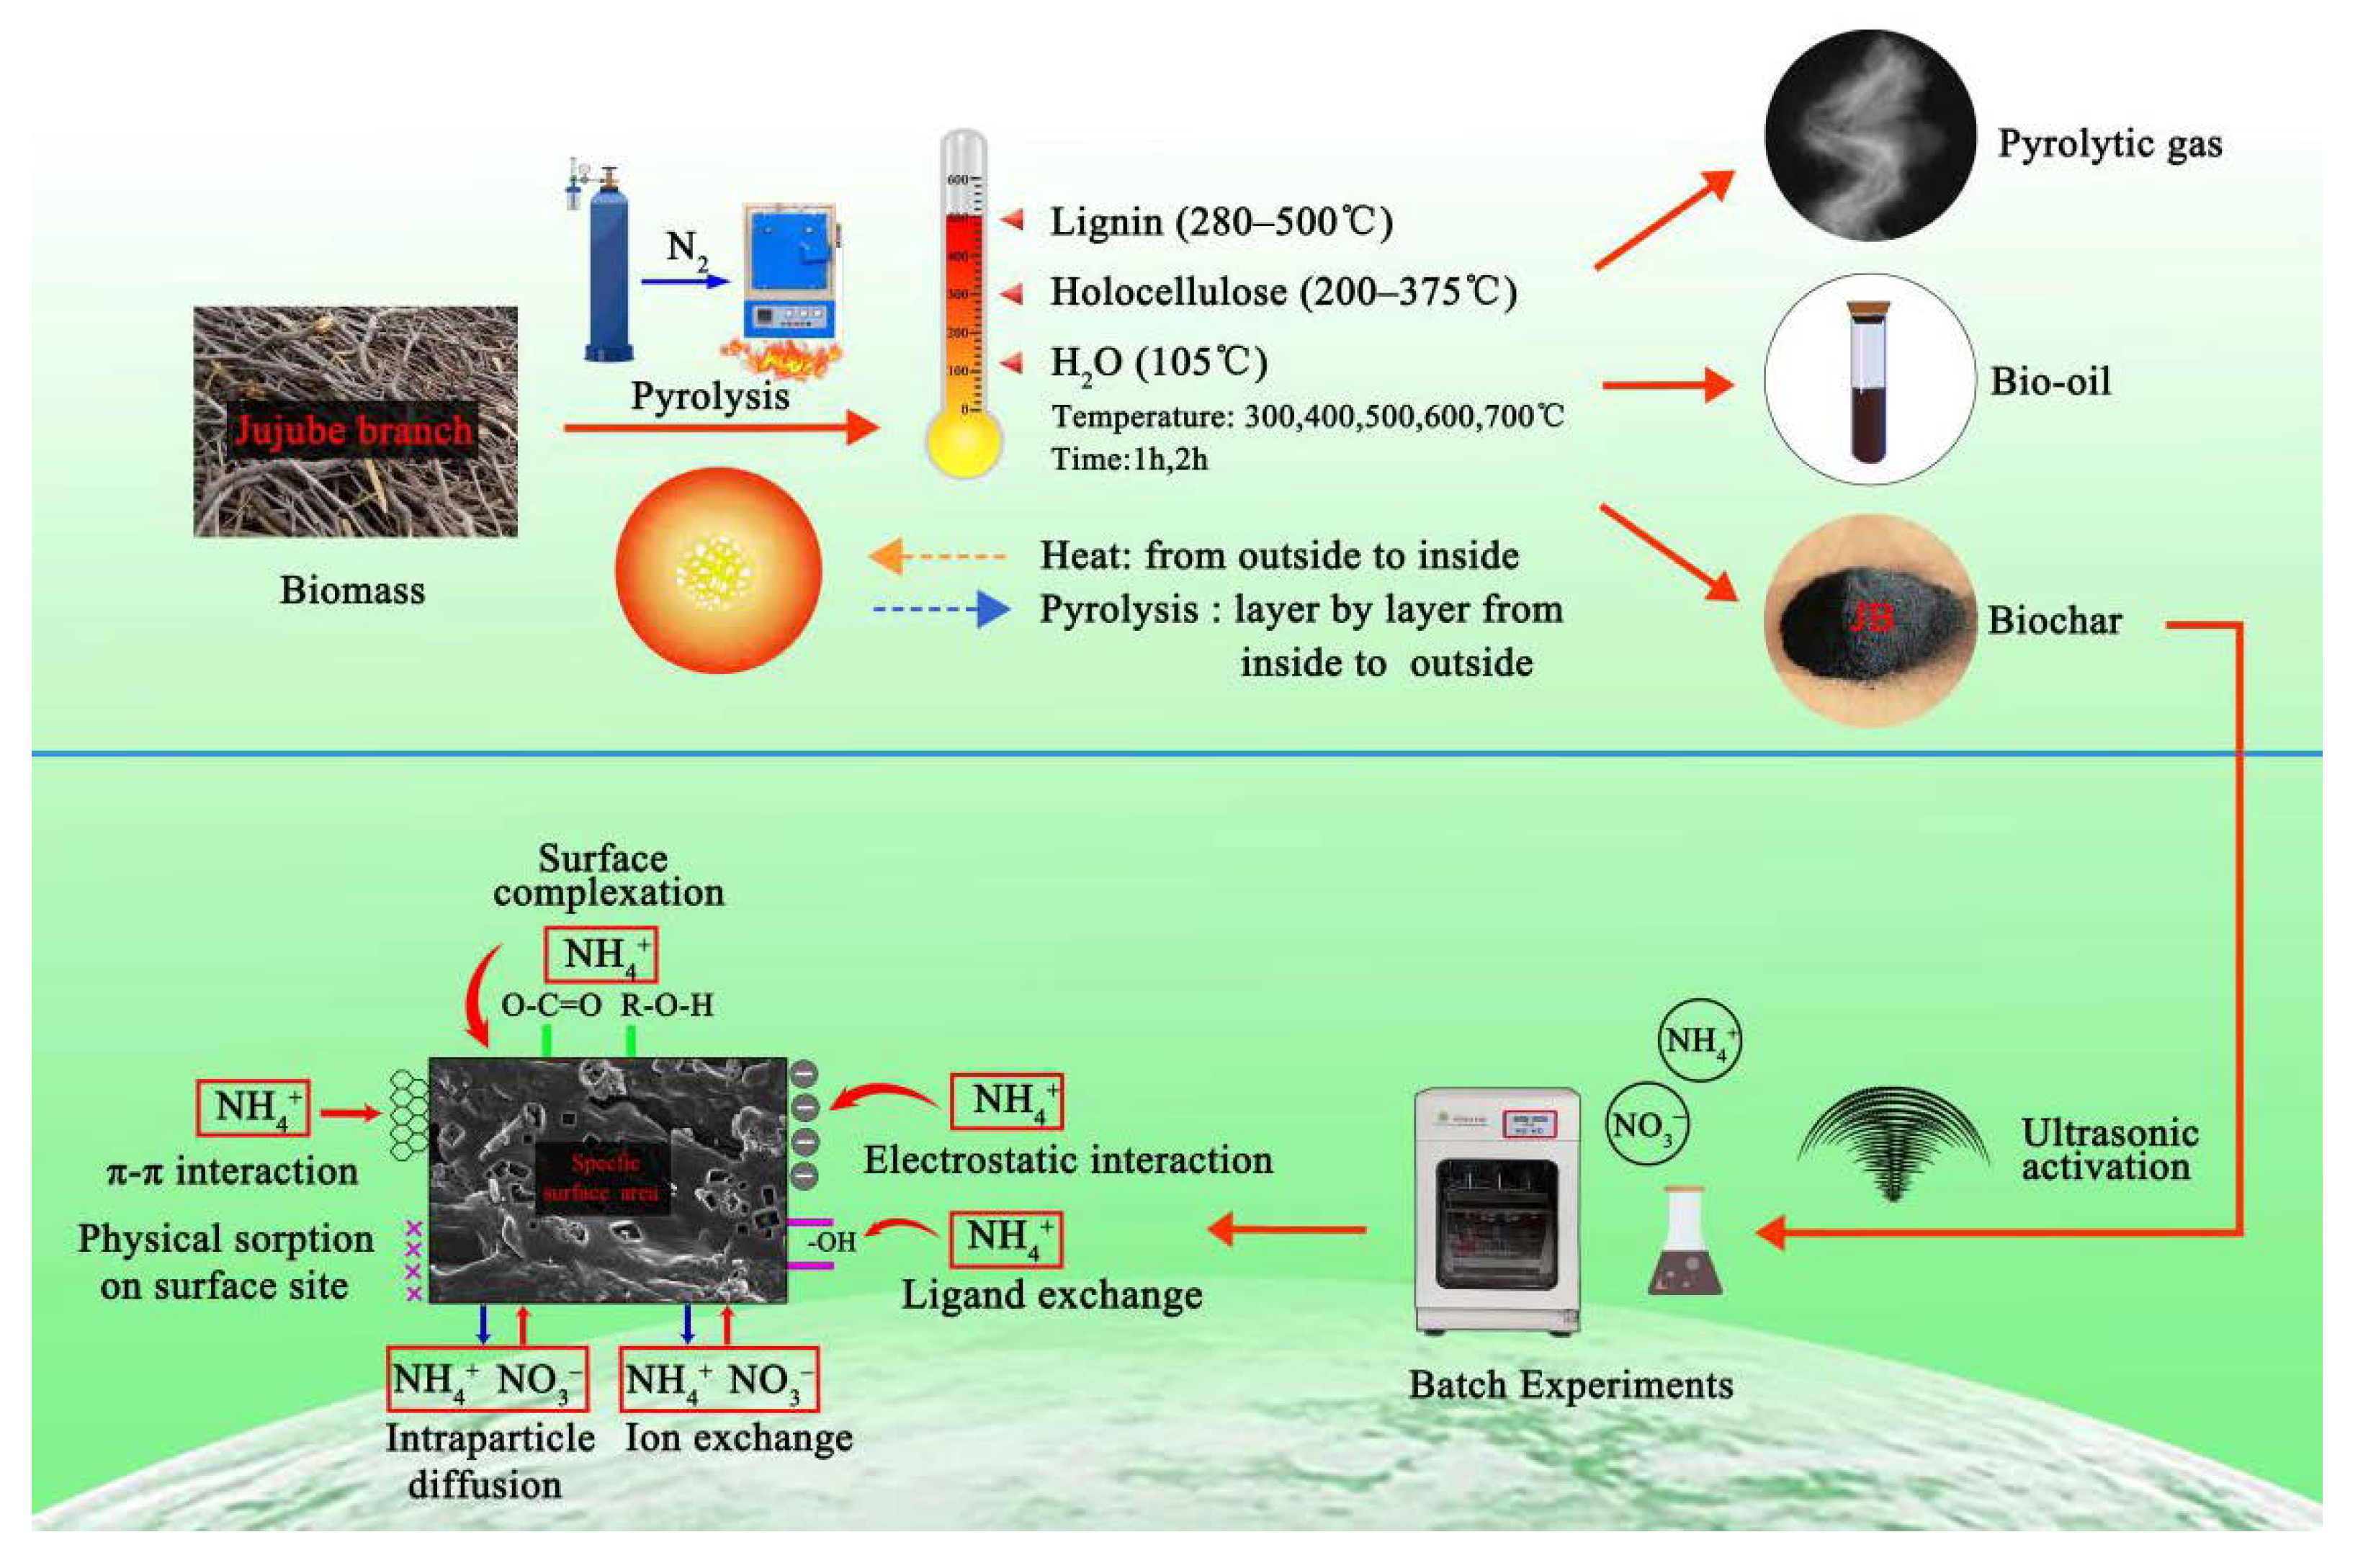
3.5. Pyrolysis Mechanisms and Adsorption Mechanisms
3.6. Comparison of Adsorption Capacity
4. Conclusions
Supplementary Materials
Author Contributions
Funding
Conflicts of Interest
References
- Aykac, G.N.; Tekin, K.; Akalin, M.K.; Karagoz, S.; Srinivasan, M.P. Production of crude bio-oil and biochar from hydrothermal conversion of jujube stones with metal carbonates. Biofuels 2018, 9, 613–623. [Google Scholar] [CrossRef]
- Li, Z.; Yi, W.; Li, Z.; Tian, C.; Fu, P.; Zhang, Y.; Zhou, L.; Teng, J. Preparation of Solid Fuel Hydrochar over Hydrothermal Carbonization of Red Jujube Branch. Energies 2020, 13, 480. [Google Scholar] [CrossRef] [Green Version]
- Liu, X.; Ma, C.; Li, J.; Zielinska, B.; Kalenczuk, R.J.; Chen, X.; Chu, P.K.; Tang, T.; Mijowska, E. Biomass-derived robust three-dimensional porous carbon for high volumetric performance supercapacitors. J. Power Sources 2019, 412, 1–9. [Google Scholar] [CrossRef]
- Li, Y.; Zheng, K.; Shah, S.A.A.; Huang, Y.; Tian, Y.; Cheng, J.; Zhang, J. Winter-jujube-derived carbon with self-doped heteroatoms and a hierarchically porous structure for high-performance supercapacitors. RSC Adv. 2017, 7, 43356–43365. [Google Scholar] [CrossRef] [Green Version]
- Zhang, W.; Xu, W.L.; Ahanbieke, P.; Wang, B.J.; Hao, X.D.; Zhu, Y.; Li, L.H. Competition for N-15-labeled nitrogen in a jujube tree (Zizyphus jujuba Mill.)/wheat (Triticum aestivum L.) agroforestry system in northwestern China. Agrofor. Syst. 2019, 93, 2097–2110. [Google Scholar] [CrossRef]
- Daoud, M.; Benturki, O.; Fontana, S.; Rogaume, Y.; Girods, P. Energy and matter balance of process of activated carbon production from Algerian agricultural wastes: Date palm rachis and jujube stones. Biomass Conv. Bioref. 2019, 1–18. [Google Scholar] [CrossRef]
- Sun, K.; Yu, S.; Hu, Z.; Li, Z.; Lei, G.; Xiao, Q.; Ding, Y. Oxygen-containing hierarchically porous carbon materials derived from wild jujube pit for high-performance supercapacitor. Electrochim. Acta 2017, 231, 417–428. [Google Scholar] [CrossRef]
- Wang, T.; Liu, H.; Duan, C.; Xu, R.; Zhang, Z.; She, D.; Zheng, J. The Eco-Friendly Biochar and Valuable Bio-Oil from Caragana korshinskii: Pyrolysis Preparation, Characterization, and Adsorption Applications. Materials 2020, 13, 3391. [Google Scholar] [CrossRef]
- Bouchelkia, N.; Mouni, L.; Belkhiri, L.; Bouzaza, A.; Bollinger, J.-C.; Madani, K.; Dahmoune, F. Removal of lead(II) from water using activated carbon developed from jujube stones, a low-cost sorbent. Sep. Sci. Technol. 2016, 51, 1645–1653. [Google Scholar] [CrossRef]
- Zhang, W.; Ahanbieke, P.; Wang, B.J.; Xu, W.L.; Li, L.H.; Christie, P.; Li, L. Root distribution and interactions in jujube tree/wheat agroforestry system. Agrofor. Syst. 2013, 87, 929–939. [Google Scholar] [CrossRef]
- Cui, Y.; Wang, W.; Chang, J. Study on the Product Characteristics of Pyrolysis Lignin with Calcium Salt Additives. Materials 2019, 12, 1609. [Google Scholar] [CrossRef] [Green Version]
- Yan, L.; Liu, Y.; Zhang, Y.; Liu, S.; Wang, C.; Chen, W.; Liu, C.; Chen, Z.; Zhang, Y. ZnCl2 modified biochar derived from aerobic granular sludge for developed microporosity and enhanced adsorption to tetracycline. Bioresour. Technol. 2020, 297, 122381. [Google Scholar] [CrossRef] [PubMed]
- IBI. Standardized product definition and product testing guidelines for biochar that is used in soil. Int. Biochar Initiat. 2012, 2, 6–23. [Google Scholar]
- Dai, Y.; Wang, W.; Lu, L.; Yan, L.; Yu, D. Utilization of biochar for the removal of nitrogen and phosphorus. J. Clean. Prod. 2020, 257, 120573. [Google Scholar] [CrossRef]
- Wang, T.; Stewart, C.E.; Ma, J.; Zheng, J.; Zhang, X. Applicability of five models to simulate water infiltration into soil with added biochar. J. Arid Land 2017, 9, 701–711. [Google Scholar] [CrossRef]
- Zhang, X.; Zhu, J.; Wu, C.; Wu, Q.; Liu, K.; Jiang, K. Preparation and Properties of Wood Tar-based Rejuvenated Asphalt. Materials 2020, 13, 1123. [Google Scholar] [CrossRef] [Green Version]
- Chen, H.; Zhang, Y.; Li, J.; Zhang, P.; Liu, N. Preparation of pickling-reheating activated alfalfa biochar with high adsorption efficiency for p-nitrophenol: Characterization, adsorption behavior, and mechanism. Environ. Sci. Pollut. Res. Int. 2019, 26, 15300–15313. [Google Scholar] [CrossRef]
- Fan, L.; Zhou, X.; Liu, Q.; Wan, Y.; Cai, J.; Chen, W.; Chen, F.; Ji, L.; Cheng, L.; Luo, H. Properties of Eupatorium adenophora Spreng (Crofton Weed) Biochar Produced at Different Pyrolysis Temperatures. Environ. Eng. Sci. 2019, 36, 937–946. [Google Scholar] [CrossRef]
- Li, S.; Barreto, V.; Li, R.; Chen, G.; Hsieh, Y.P. Nitrogen retention of biochar derived from different feedstocks at variable pyrolysis temperatures. J. Anal. Appl. Pyrolysis 2018, 133, 136–146. [Google Scholar] [CrossRef]
- Cai, F.Y.; Zhang, Y.Q.; Wang, J.T.; Zhou, J.R.; Cao, H.L.; Lu, J. Mixed phase nano-CdS supported on activated biomass carbon as efficient visible light-driven photocatalysts. Environ. Sci. Pollut. Res. Int. 2019, 26, 31055–31061. [Google Scholar] [CrossRef]
- Khuenkaeo, N.; Tippayawong, N. Production and characterization of bio-oil and biochar from ablative pyrolysis of lignocellulosic biomass residues. Chem. Eng. Commun. 2020, 207, 153–160. [Google Scholar] [CrossRef]
- Irfan, M.; Lin, Q.; Yue, Y.; Ruan, X.; Chen, Q.; Zhao, X.; Dong, X. Co-production of Biochar, Bio-oil, and Syngas from Tamarix chinensis Biomass under Three Different Pyrolysis Temperatures. Bioresources 2016, 11, 8929–8940. [Google Scholar] [CrossRef] [Green Version]
- Wang, T.; Zheng, J.; Liu, H.; Peng, Q.; Zhou, H.H.; Zhang, X. Adsorption characteristics and mechanisms of Pb2+ and Cd2+ by a new agricultural waste-Caragana korshinskii biomass derived biochar. Environ. Sci. Pollut. Int. 2020, 27, 1–9. [Google Scholar] [CrossRef] [PubMed]
- Nikolaev, E.V.; Burgard, A.P.; Maranas, C.D. Elucidation and structural analysis of conserved pools for genome-scale metabolic reconstructions. Biophys. J. 2005, 88, 37–49. [Google Scholar] [CrossRef] [Green Version]
- Vu, T.M.; Trinh, V.T.; Doan, D.P.; Van, H.T.; Nguyen, T.V.; Vigneswaran, S.; Ngo, H.H. Removing ammonium from water using modified corncob-biochar. Sci. Total Environ. 2017, 579, 612–619. [Google Scholar] [CrossRef]
- Gong, Y.P.; Ni, Z.Y.; Xiong, Z.Z.; Cheng, L.H.; Xu, X.H. Phosphate and ammonium adsorption of the modified biochar based on Phragmites australis after phytoremediation. Environ. Sci. Pollut. Res. Int. 2017, 24, 8326–8335. [Google Scholar] [CrossRef]
- Jiang, Y.H.; Li, A.Y.; Deng, H.; Ye, C.H.; Wu, Y.Q.; Linmu, Y.D.; Hang, H.L. Characteristics of nitrogen and phosphorus adsorption by Mg-loaded biochar from different feedstocks. Bioresour. Technol. 2019, 276, 183–189. [Google Scholar] [CrossRef]
- Luo, L.; Wang, G.; Shi, G.; Zhang, M.; Zhang, J.; He, J.; Xiao, Y.; Tian, D.; Zhang, Y.; Deng, S.; et al. The characterization of biochars derived from rice straw and swine manure, and their potential and risk in N and P removal from water. J. Environ. Manag. 2019, 245, 1–7. [Google Scholar] [CrossRef]
- Alsewaileh, A.S.; Usman, A.R.; Al-Wabel, M.I. Effects of pyrolysis temperature on nitrate-nitrogen (NO3−-N) and bromate (BrO3−) adsorption onto date palm biochar. J. Environ. Manag. 2019, 237, 289–296. [Google Scholar] [CrossRef]
- Cui, X.; Hao, H.; Zhang, C.; He, Z.; Yang, X. Capacity and mechanisms of ammonium and cadmium sorption on different wetland-plant derived biochars. Sci. Total Environ. 2016, 539, 566–575. [Google Scholar] [CrossRef]
- Li, H.; Dong, X.; da Silva, E.B.; de Oliveira, L.M.; Chen, Y.; Ma, L.Q. Mechanisms of metal sorption by biochars: Biochar characteristics and modifications. Chemosphere 2017, 178, 466–478. [Google Scholar] [CrossRef] [PubMed]
- Kalinke, C.; Mangrich, A.S.; Marcolino-Junior, L.H.; Bergamini, M.F. Biochar prepared from castor oil cake at different temperatures: A voltammetric study applied for Pb2+, Cd2+ and Cu2+ ions preconcentration. J. Hazard. Mater. 2016, 318, 526–532. [Google Scholar] [CrossRef] [PubMed]
- Inyang, M.I.; Gao, B.; Yao, Y.; Xue, Y.; Zimmerman, A.; Mosa, A.; Pullammanappallil, P.; Ok, Y.S.; Cao, X. A review of biochar as a low-cost adsorbent for aqueous heavy metal removal. Crit. Rev. Environ. Sci. Technol. 2015, 46, 406–433. [Google Scholar] [CrossRef]
- Tong, Y.; McNamara, P.J.; Mayer, B.K. Adsorption of organic micropollutants onto biochar: A review of relevant kinetics, mechanisms and equilibrium. Environ. Sci.-Water Res. Technol. 2019, 5, 821–838. [Google Scholar] [CrossRef]
- Fakayode, O.A.; Aboagarib, E.A.A.; Zhou, C.; Ma, H. Co-pyrolysis of lignocellulosic and macroalgae biomasses for the production of biochar—A review. Bioresour. Technol. 2020, 297, 122408. [Google Scholar] [CrossRef]
- Hverett, D.H. IUPAC manual of symbols and terminology for physicochemical quantities and units. Pure Appl. Chem. 1972, 31, 579–638. [Google Scholar]
- Li, Y.; Xing, B.; Ding, Y.; Han, X.; Wang, S. A critical review of the production and advanced utilization of biochar via selective pyrolysis of lignocellulosic biomass. Bioresour. Technol. 2020, 312, 123614. [Google Scholar] [CrossRef]
- Cui, Q.; Xu, J.; Wang, W.; Tan, L.; Cui, Y.; Wang, T.; Li, G.; She, D.; Zheng, J. Phosphorus recovery by core-shell γ-Al2O3/Fe3O4 biochar composite from aqueous phosphate solutions. Sci. Total Environ. 2020, 729, 138892. [Google Scholar] [CrossRef]
- Sun, X.; Atiyeh, H.K.; Li, M.; Chen, Y. Biochar facilitated bioprocessing and biorefinery for productions of biofuel and chemicals: A review. Bioresour. Technol. 2020, 295, 122252. [Google Scholar] [CrossRef]
- Wang, Z.; Li, J.; Zhang, G.; Zhi, Y.; Yang, D.; Lai, X.; Ren, T. Characterization of Acid-Aged Biochar and its Ammonium Adsorption in an Aqueous Solution. Materials 2020, 13, 2270. [Google Scholar] [CrossRef]
- Zhou, Z.; Xu, Z.; Feng, Q.; Yao, D.; Yu, J.; Wang, D.; Lv, S.; Liu, Y.; Zhou, N.; Zhong, M.E. Effect of pyrolysis condition on the adsorption mechanism of lead, cadmium and copper on tobacco stem biochar. J. Clean. Prod. 2018, 187, 996–1005. [Google Scholar] [CrossRef]
- Zhao, N.; Yang, X.; Zhang, J.; Zhu, L.; Lv, Y. Adsorption Mechanisms of Dodecylbenzene Sulfonic Acid by Corn Straw and Poplar Leaf Biochars. Materials 2017, 10, 1119. [Google Scholar] [CrossRef]
- Pratiwi, E.P.A.; Hillary, A.K.; Fukuda, T.; Shinogi, Y. The effects of rice husk char on ammonium, nitrate and phosphate retention and leaching in loamy soil. Geoderma 2016, 277, 61–68. [Google Scholar] [CrossRef]
- Chintala, R.; Mollinedo, J.; Schumacher, T.E.; Papiernik, S.K.; Malo, D.D.; Clay, D.E.; Kumar, S.; Gulbrandson, D.W. Nitrate sorption and desorption in biochars from fast pyrolysis. Microporous Mesoporous Mater. 2013, 179, 250–257. [Google Scholar] [CrossRef]


| Models | Expression | Parameters |
|---|---|---|
| Langmuir | , | Qm, a |
| Freundlich | KF, 1/n | |
| Temkin | A, B | |
| Dubinin–Radushkevich (D-R) model | , | Q0, β, ε,E |
| Pseudo-first-order | Qe, k1 | |
| Pseudo-second-order | , | Qe, k2, h |
| Elovich model | a’, b | |
| Intraparticle diffusion | C, ki |
| Sample | Moisture (%) | Volatile Organic Matter (%) | Fixed Carbon (%) | Ash (%) |
|---|---|---|---|---|
| Jujube biomass | 8.25 | 74.83 | 16.12 | 0.81 |
| JB | C(%) | O(%) | N(%) | O/C | (O + N)/C | Yield (%) | pH | Zeta | SBET | Pore Volume (cm3·g−1) 2 | Average Pore Size (nm) 3 | ||
|---|---|---|---|---|---|---|---|---|---|---|---|---|---|
| Value | Uncertainty 1 | Value | Uncertainty | (mV) | (m2·g−1) | ||||||||
| 300 °C/1 h | 67.86 | 20.84 | 2.73 | 0.31 | 0.43 | 0.35 | 0.49 | 50.18 | 7.01 | −41.5 | 50.92 | 0.10 | 49.42 |
| 400 °C/1 h | 70.20 | 18.03 | 1.75 | 0.26 | 0.36 | 0.28 | 0.40 | 40.75 | 8.22 | −48.1 | 72.77 | 0.13 | 46.43 |
| 500 °C/1 h | 72.02 | 14.81 | 1.81 | 0.21 | 0.29 | 0.23 | 0.33 | 34.48 | 9.79 | −47.3 | 83.05 | 0.15 | 32.67 |
| 600 °C/1 h | 75.64 | 15.67 | 1.41 | 0.21 | 0.29 | 0.23 | 0.32 | 32.53 | 9.78 | −52.4 | 88.23 | 0.15 | 14.43 |
| 700 °C/1 h | 78.64 | 14.77 | 1.37 | 0.19 | 0.27 | 0.21 | 0.29 | 31.64 | 9.83 | −50.5 | 99.62 | 0.19 | 8.57 |
| 300 °C/2 h | 69.60 | 20.96 | 3.1 | 0.3 | 0.43 | 0.35 | 0.49 | 53.79 | 7.52 | −42.2 | 51.61 | 0.09 | 31.43 |
| 400 °C/2 h | 73.09 | 19.96 | 1.79 | 0.27 | 0.39 | 0.3 | 0.42 | 38.91 | 8.53 | −51.4 | 76.4 | 0.12 | 17.91 |
| 500 °C/2 h | 76.41 | 14.77 | 2.41 | 0.19 | 0.27 | 0.22 | 0.32 | 33.67 | 9.1 | −45.0 | 82.2 | 0.17 | 11.26 |
| 600 °C/2 h | 77.88 | 14.07 | 1.97 | 0.18 | 0.26 | 0.21 | 0.29 | 32.67 | 9.61 | −49.6 | 103.82 | 0.21 | 8.78 |
| 700 °C/2 h | 77.92 | 15.01 | 1.83 | 0.19 | 0.27 | 0.22 | 0.31 | 32.69 | 9.73 | −44.1 | 114.36 | 0.24 | 7.02 |
| Adsorption Type | Langmuir | Freundlich | Temkin | D-R Model | |||||||||
|---|---|---|---|---|---|---|---|---|---|---|---|---|---|
| KL | Qm/mg·g−1 | RL | R2 | KF | n | R2 | A | B | R2 | Q0/mmol·g−1 | E/kJ·mol−1 | R2 | |
| NO3− | 0.14 | 21.17 | 0.07~0.88 | 0.96 | 4.68 | 2.83 | 0.85 | 3.18 | 3.41 | 0.88 | 16.40 | 0.43 | 0.72 |
| NH4+ | 0.16 | 30.57 | 0.06~0.86 | 0.95 | 6.32 | 2.58 | 0.83 | 2.83 | 5.15 | 0.86 | 23.11 | 0.55 | 0.78 |
| Adsorption Type | Pseudo-First-Order | Pseudo-Second-Order | Elovich | Intraparticle Diffusion | |||||||||
|---|---|---|---|---|---|---|---|---|---|---|---|---|---|
| Qe/mg·g−1 | k1 | R2 | Qe/mg·g−1 | k2 | h/mg·g−1·min−1 | R2 | a/g·mg−1·min−1 | b/g·mg−1 | R2 | ki | C | R2 | |
| NO3− | 15.49 | 2.13 | 0.84 | 15.60 | 0.01 | 2.43 | 0.99 | 1.37 | 1.87 | 0.90 | 0.11 | 12.20 | 0.10 |
| NH4+ | 18.36 | 1.82 | 0.85 | 18.75 | 0.01 | 3.52 | 0.99 | 9.17 | 1.42 | 0.91 | 0.15 | 14.19 | 0.15 |
| Raw Materials | Adsorption Type | Maximum Theoretical Adsorption Capacity/mg·g−1 | Literature |
|---|---|---|---|
| Date palm | NO3− | 8.37 | [29] |
| Rice husk | NO3− | 2.1 | [43] |
| Corn stover | NO3− | 6.25 | [44] |
| Switchgrass | NO3− | 1.84 | [44] |
| Ponderosa pine wood | NO3− | 6.20 | [44] |
| Jujube | NO3− | 21.10 | This work |
| P. australis | NH4+ | 2.82 | [30] |
| C. indica | NH4+ | 13.35 | [30] |
| Z. caduciflora | NH4+ | 2.41 | [30] |
| T. dealbata | NH4+ | 4.93 | [30] |
| P. purpureum Schum | NH4+ | 7.36 | [30] |
| Jujube | NH4+ | 30.57 | This work |
Publisher’s Note: MDPI stays neutral with regard to jurisdictional claims in published maps and institutional affiliations. |
© 2020 by the authors. Licensee MDPI, Basel, Switzerland. This article is an open access article distributed under the terms and conditions of the Creative Commons Attribution (CC BY) license (http://creativecommons.org/licenses/by/4.0/).
Share and Cite
Zhang, D.; Wang, T.; Zhi, J.; Zheng, Q.; Chen, Q.; Zhang, C.; Li, Y. Utilization of Jujube Biomass to Prepare Biochar by Pyrolysis and Activation: Characterization, Adsorption Characteristics, and Mechanisms for Nitrogen. Materials 2020, 13, 5594. https://doi.org/10.3390/ma13245594
Zhang D, Wang T, Zhi J, Zheng Q, Chen Q, Zhang C, Li Y. Utilization of Jujube Biomass to Prepare Biochar by Pyrolysis and Activation: Characterization, Adsorption Characteristics, and Mechanisms for Nitrogen. Materials. 2020; 13(24):5594. https://doi.org/10.3390/ma13245594
Chicago/Turabian StyleZhang, Di, Tongtong Wang, Jinhu Zhi, Qiangqing Zheng, Qiling Chen, Cong Zhang, and Yalong Li. 2020. "Utilization of Jujube Biomass to Prepare Biochar by Pyrolysis and Activation: Characterization, Adsorption Characteristics, and Mechanisms for Nitrogen" Materials 13, no. 24: 5594. https://doi.org/10.3390/ma13245594