
Effect of Fine Size-Fractionated Sunflower Husk Biochar on Water Retention Properties of Arable Sandy Soil

 , , , , , and
Abstract
:1. Introduction
2. Materials and Methods
2.1. Soil
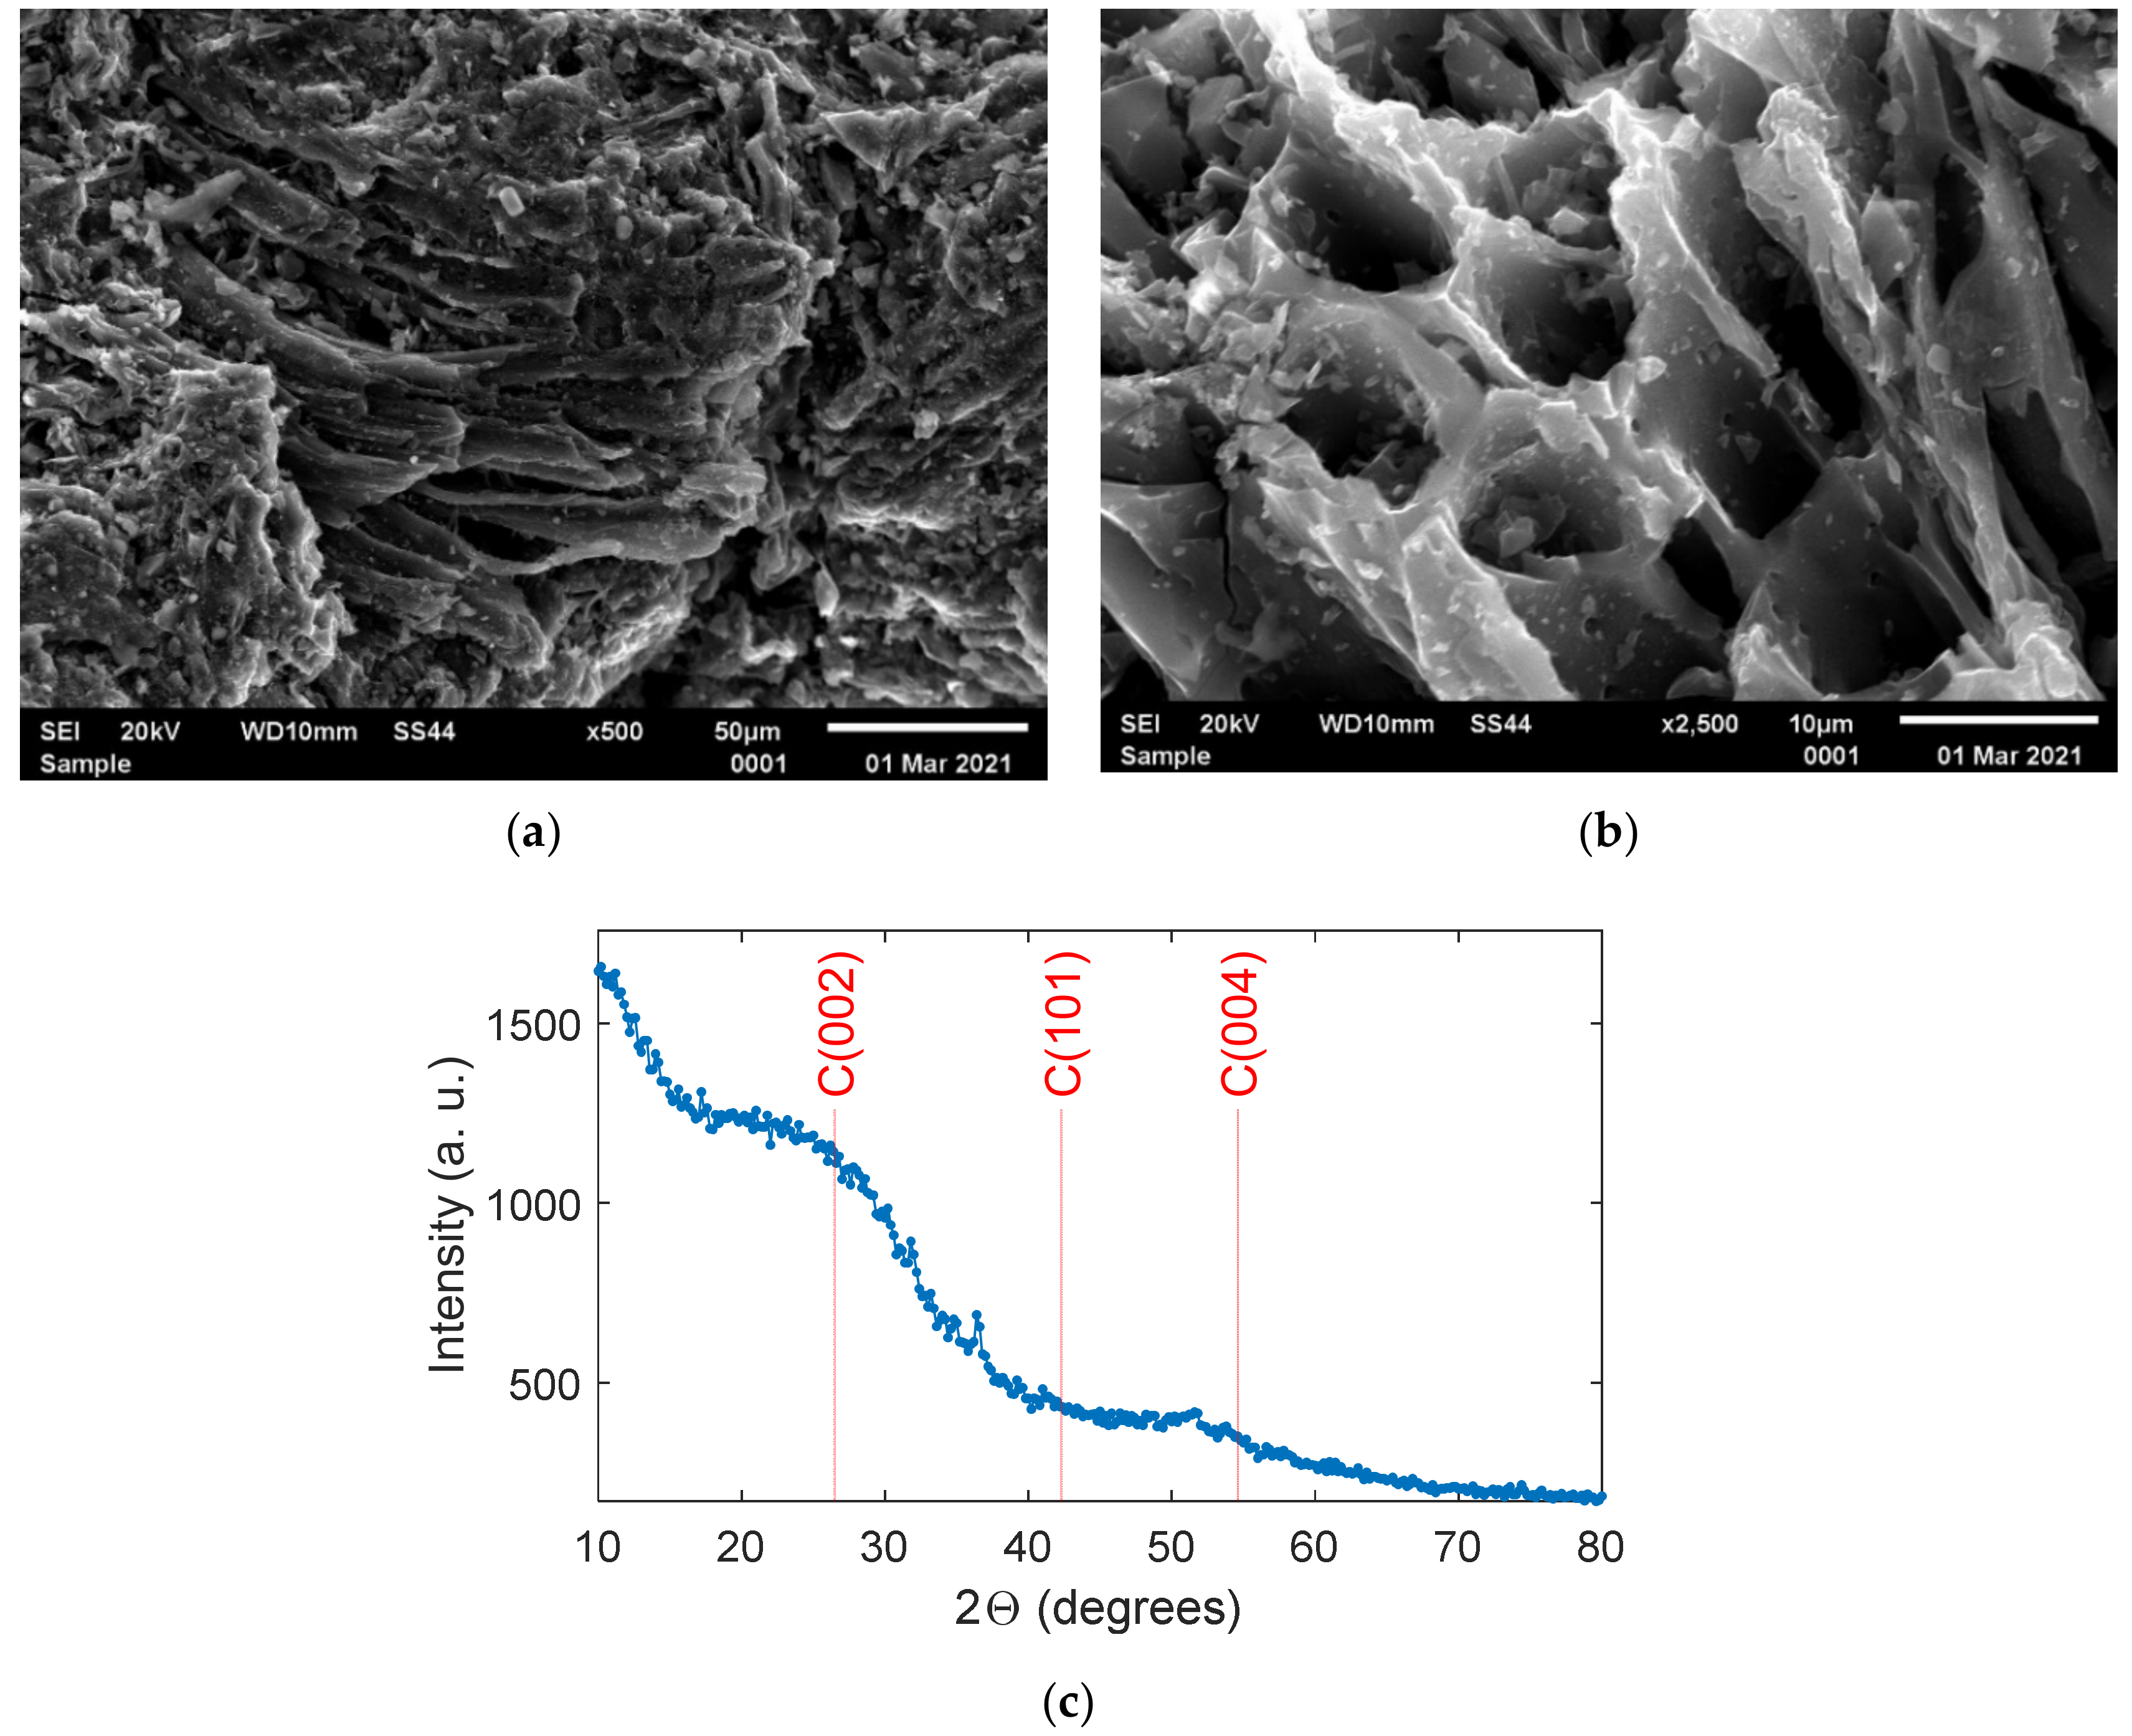
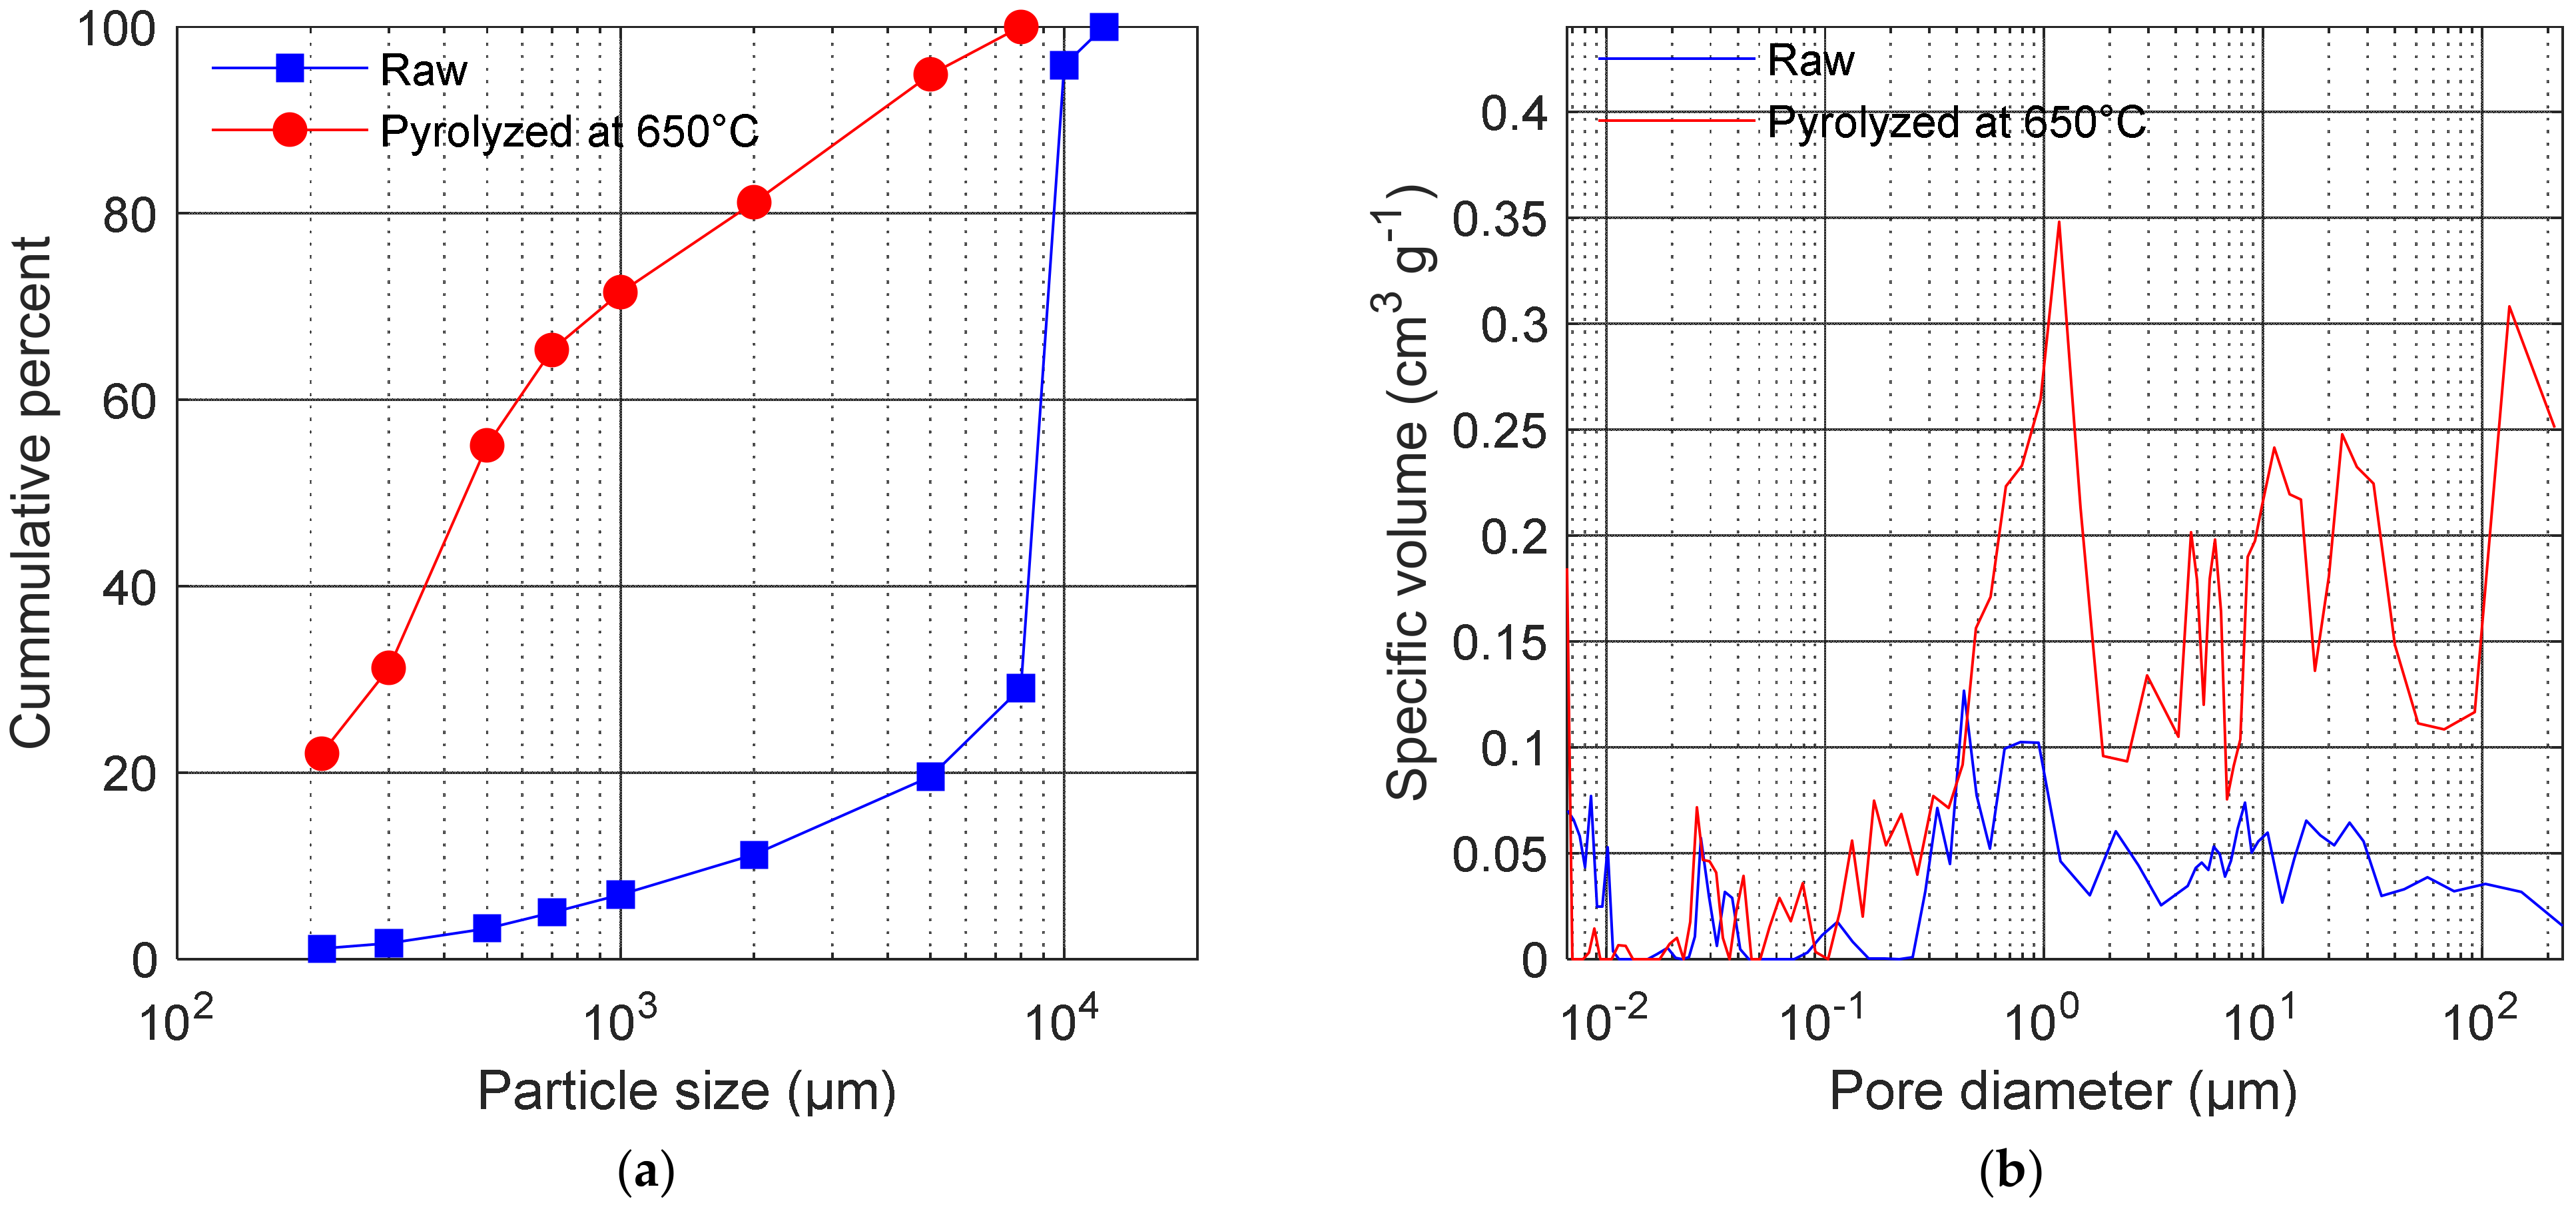
2.2. Biochar
2.3. Soil-Biochar Samples
2.4. Water Retention Curves and Analysis
3. Results
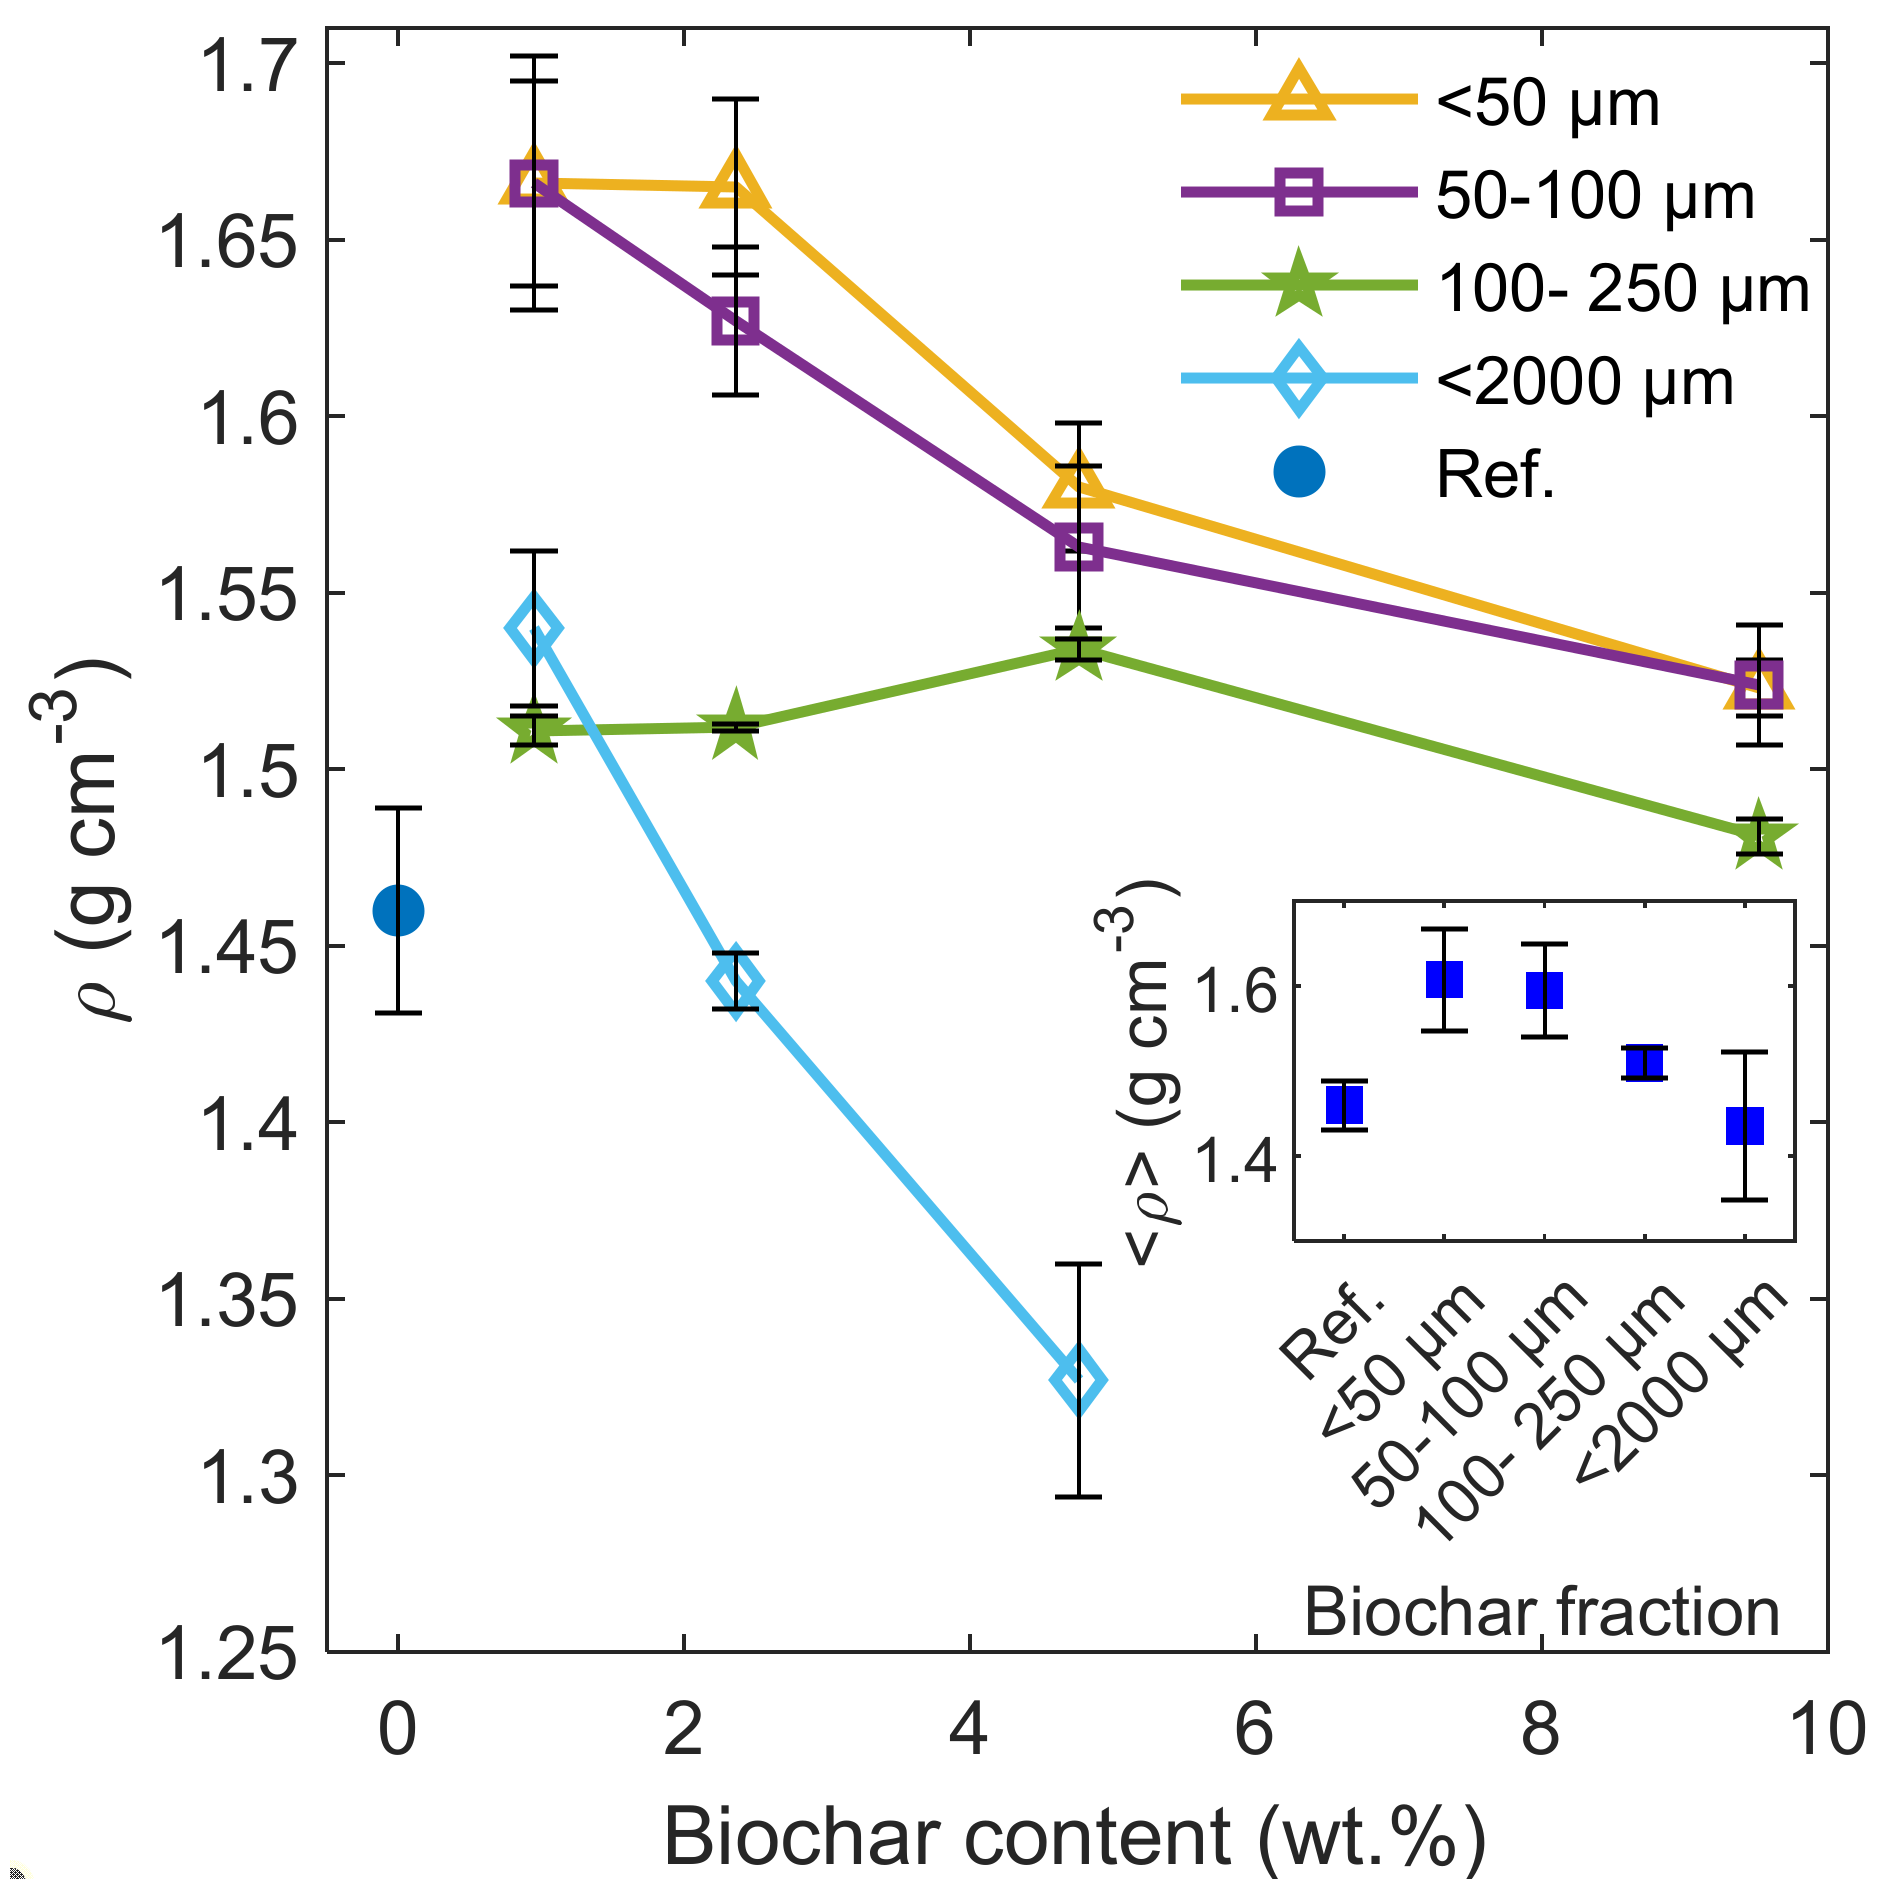
3.1. Soil and Biochar Parameters
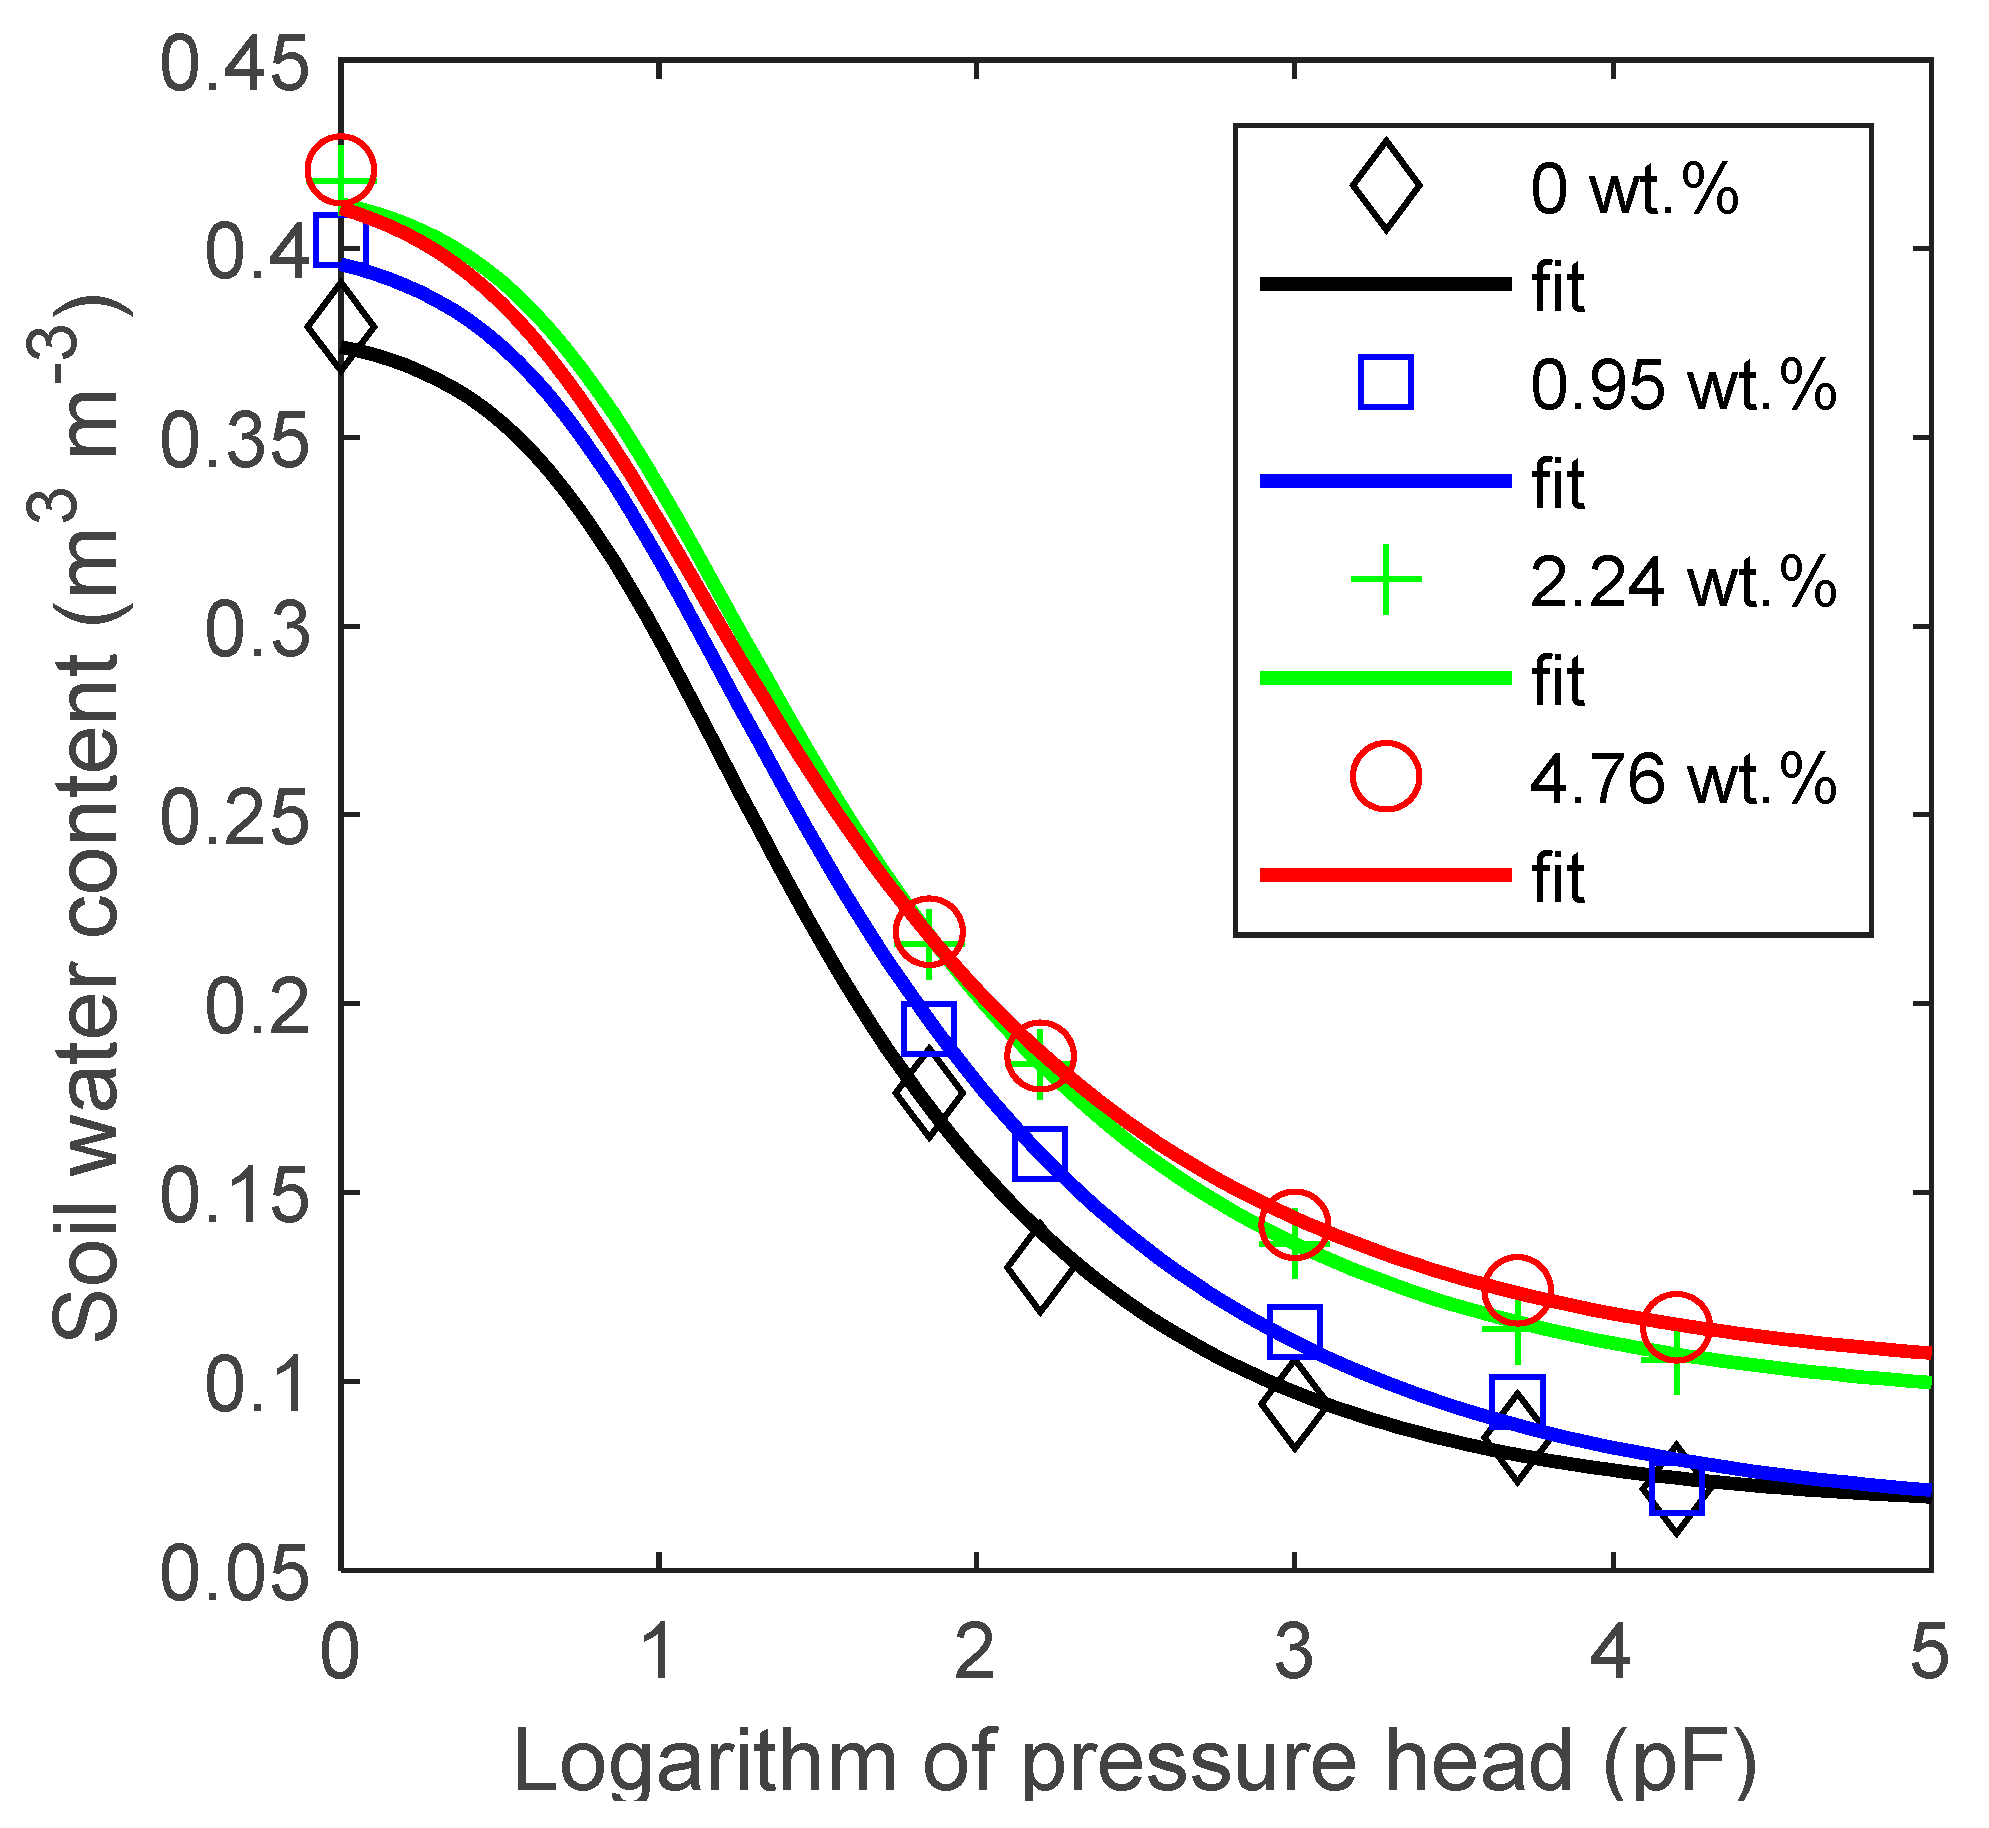
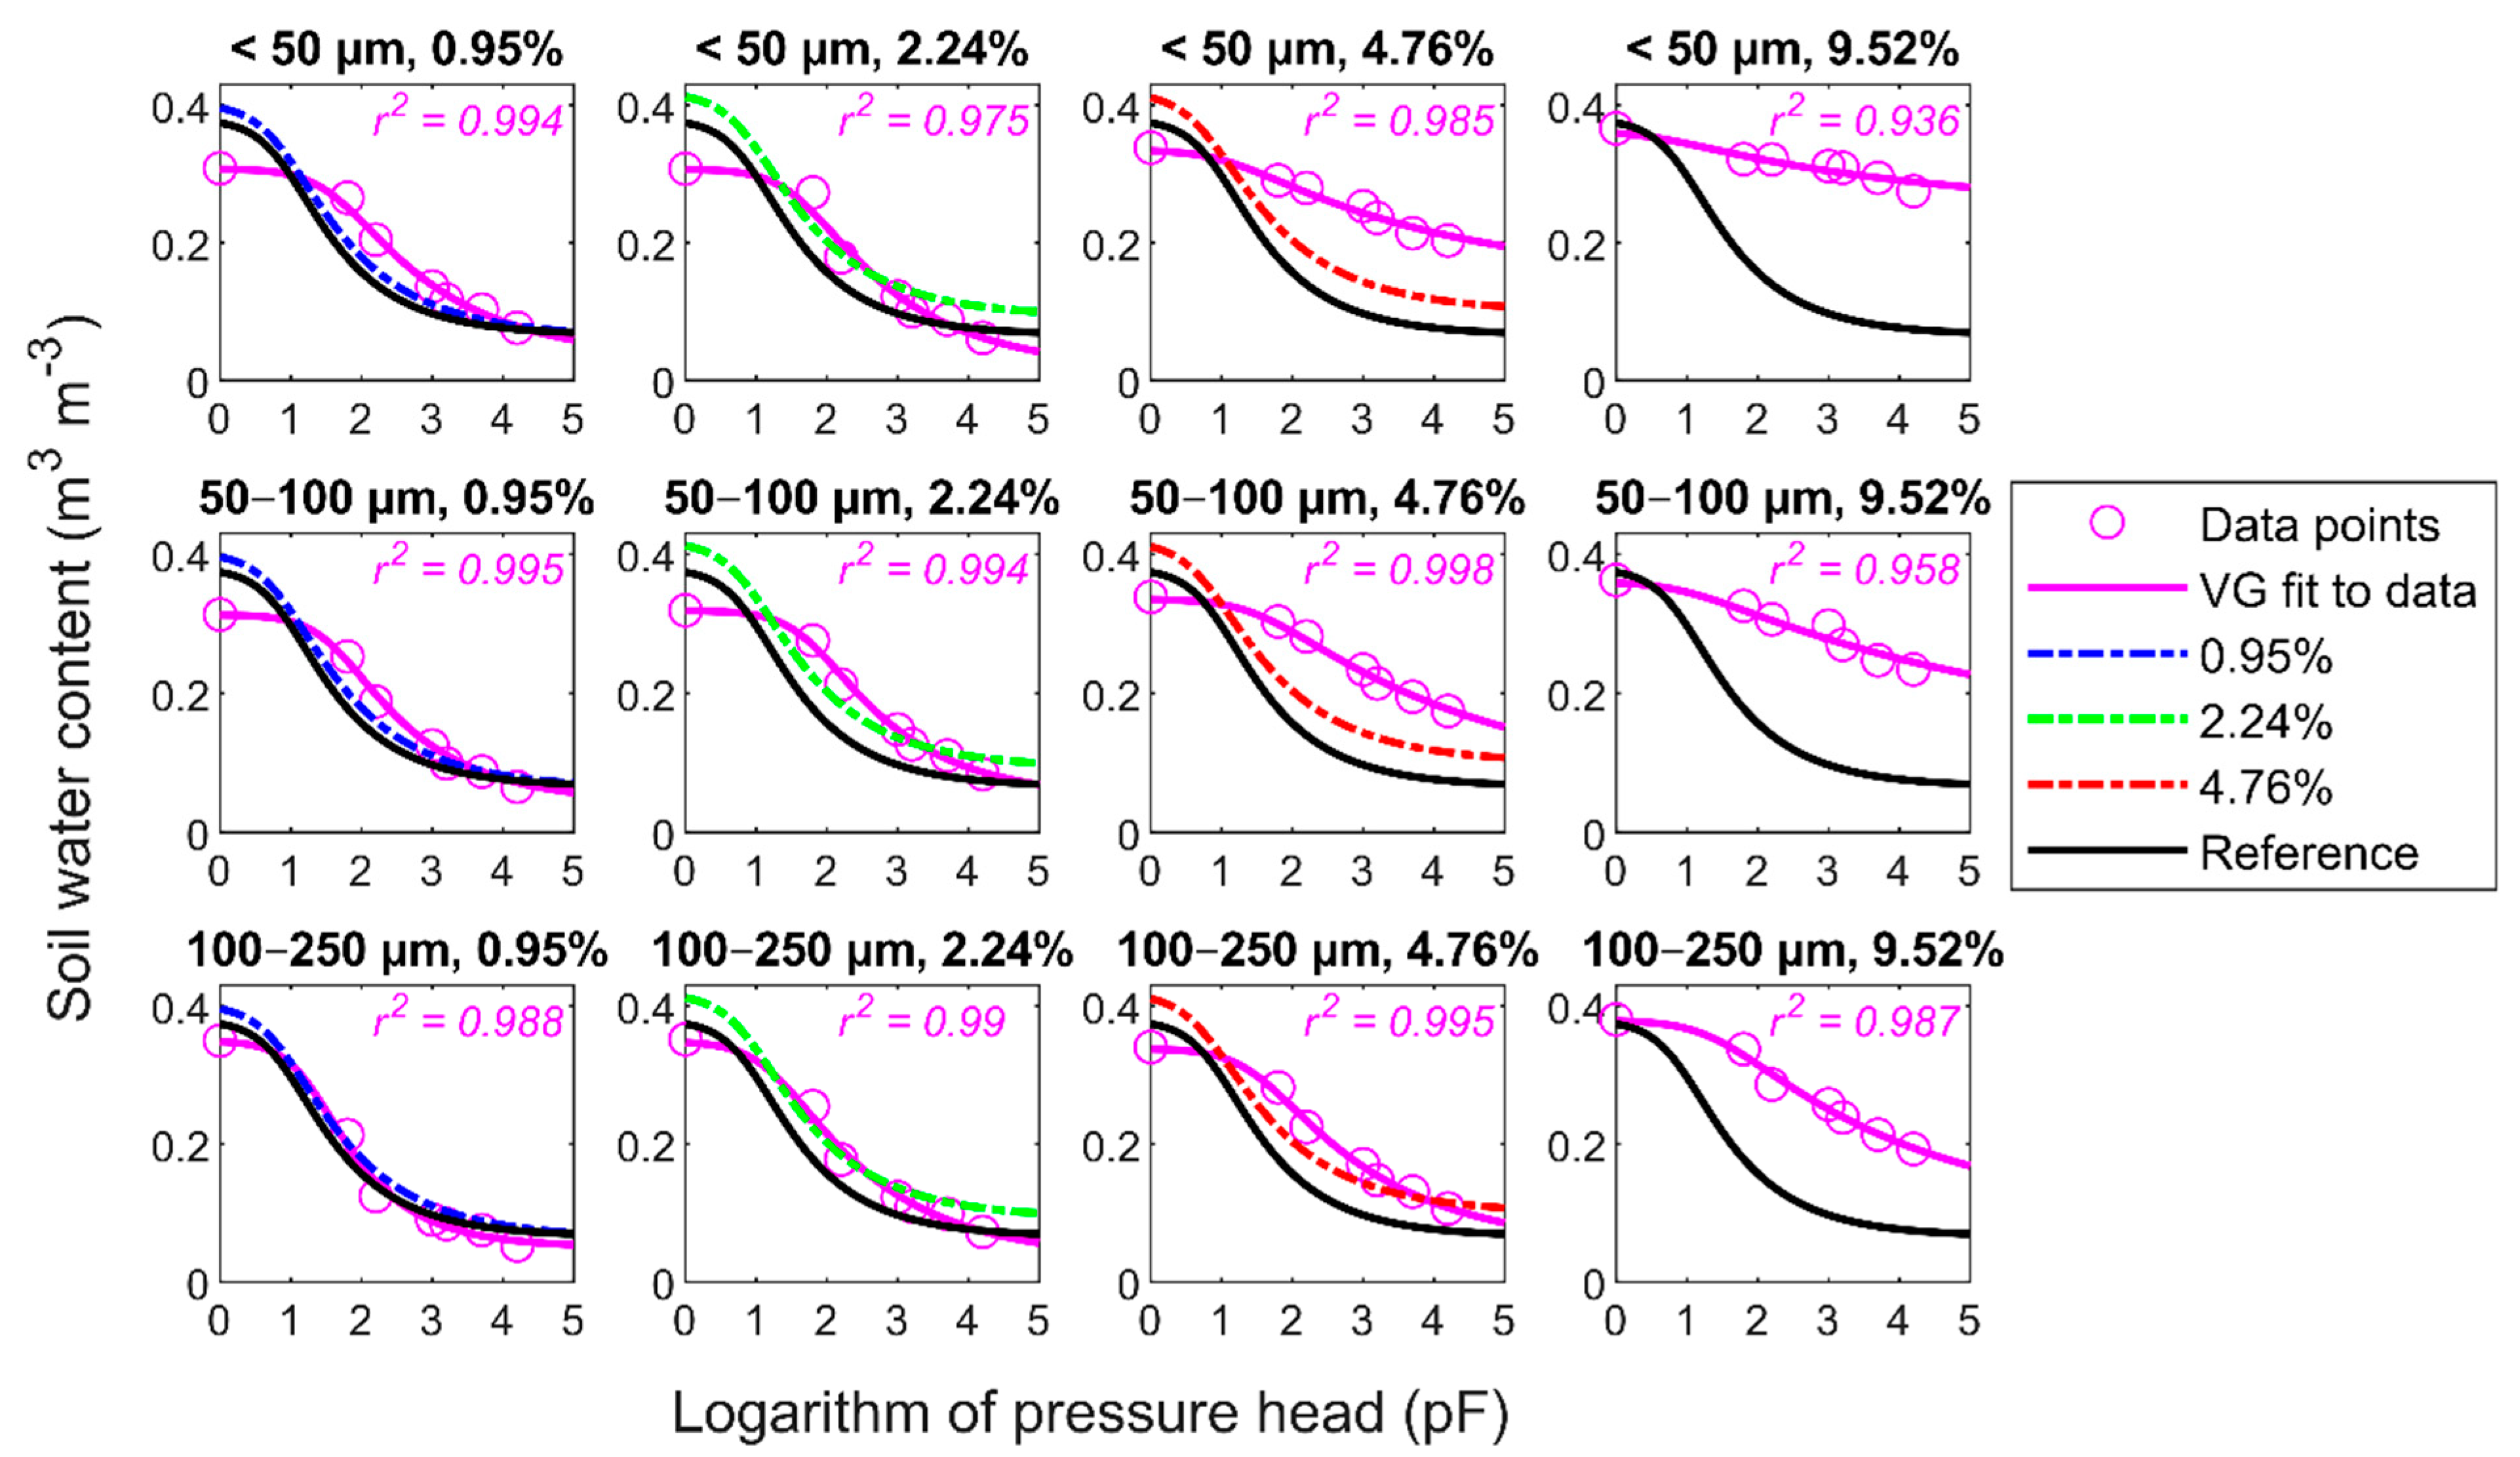
3.2. Water Retention Properties
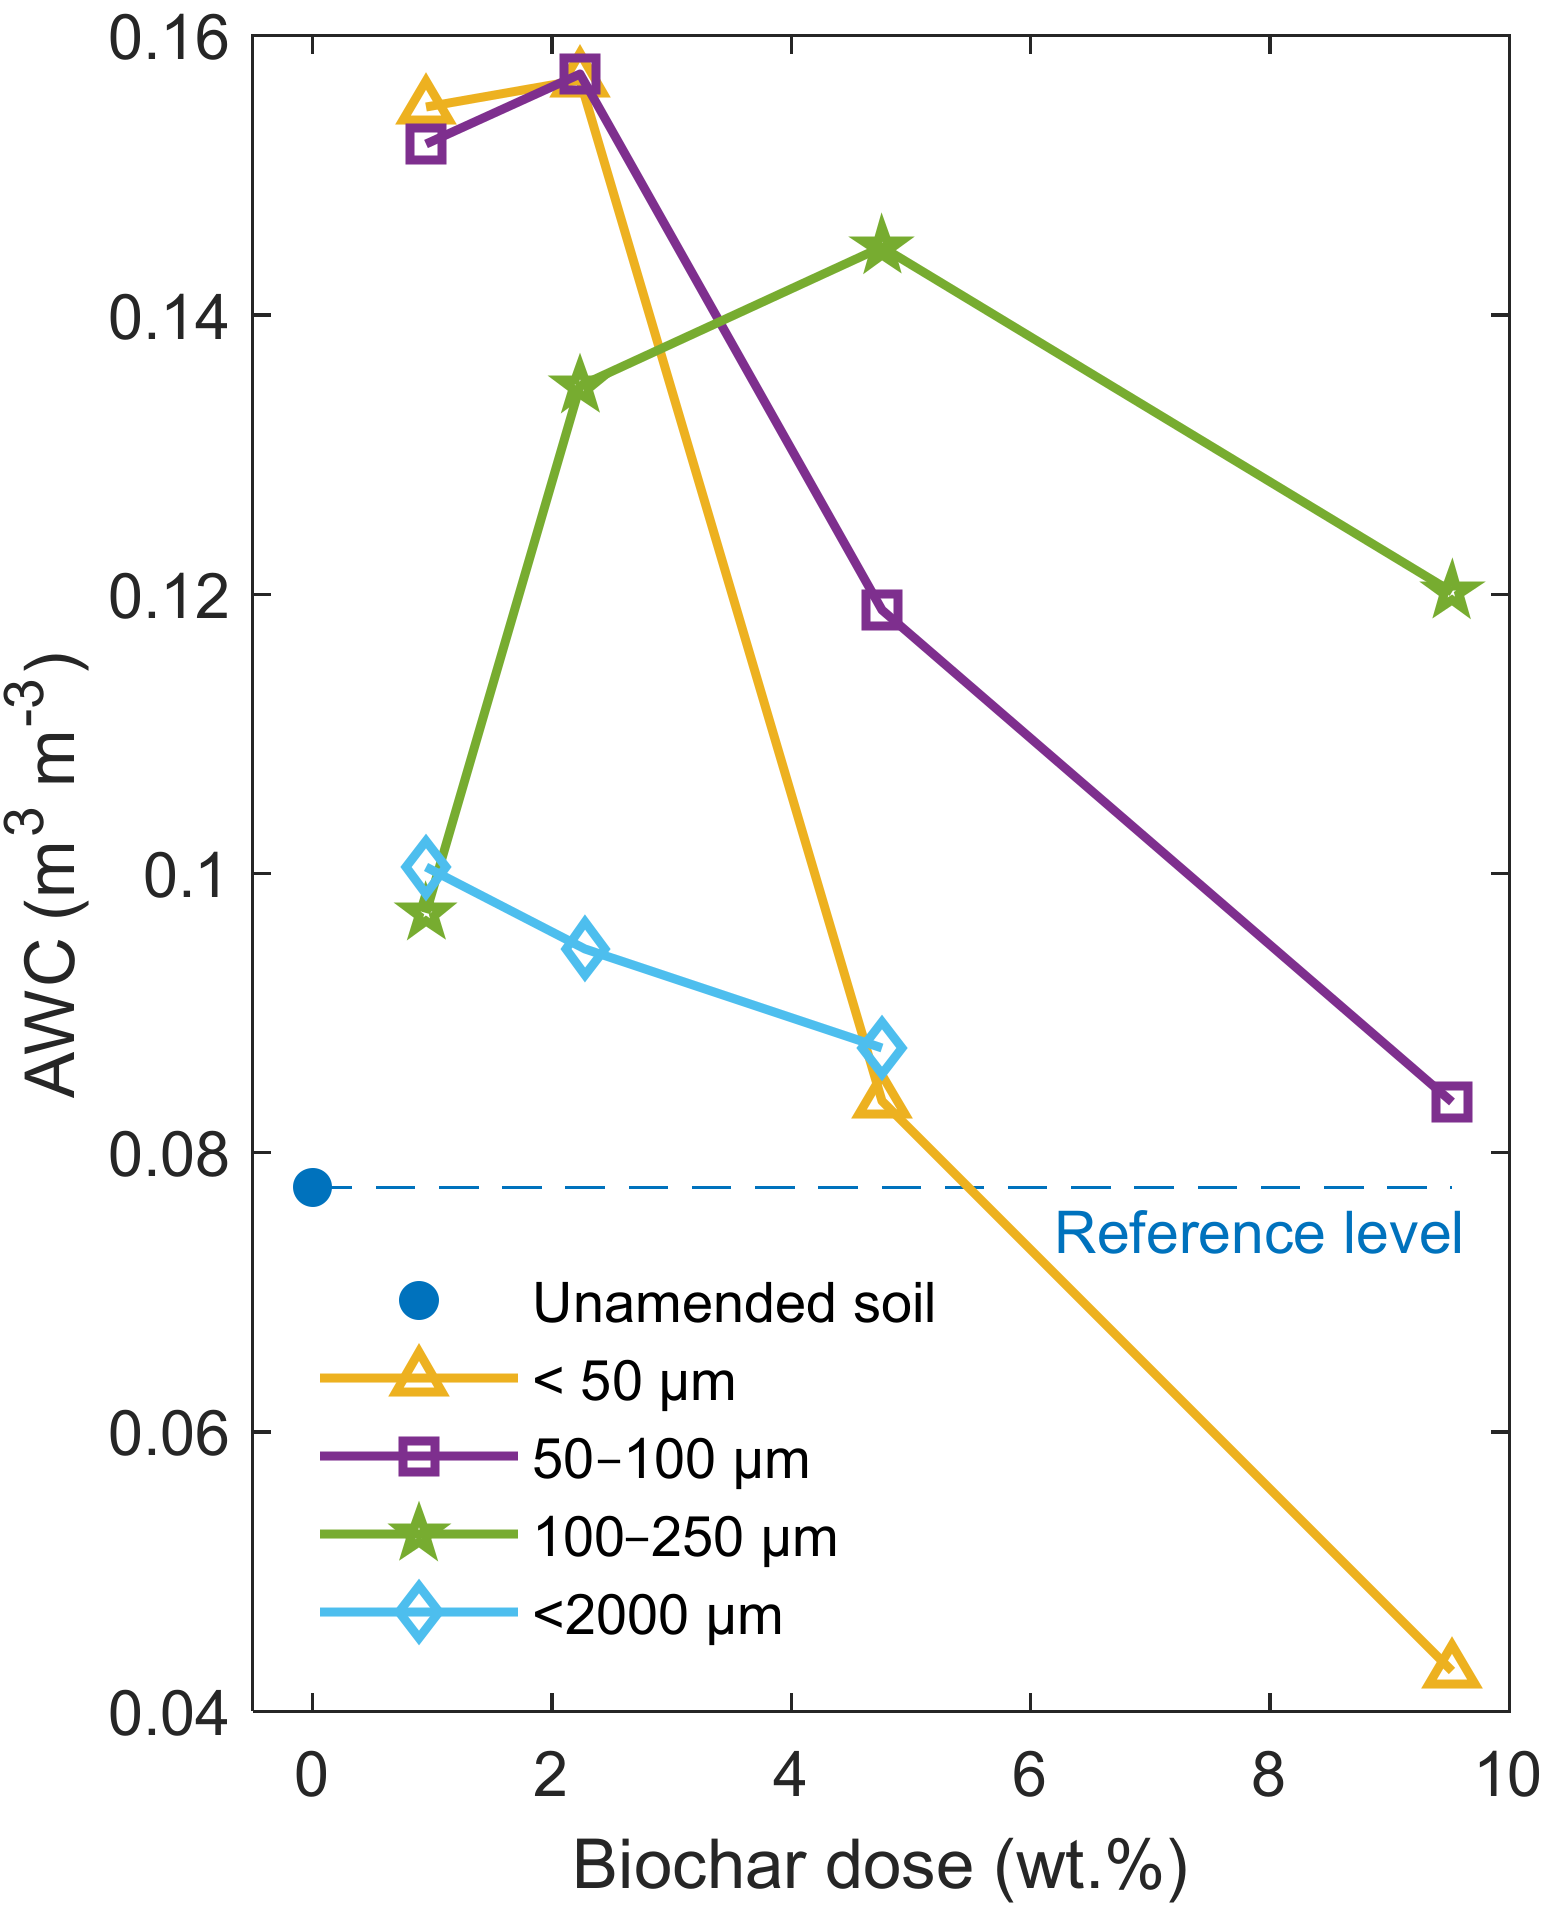
3.3. Available Water Content
4. Discussion
5. Conclusions
Author Contributions
Funding
Institutional Review Board Statement
Informed Consent Statement
Data Availability Statement
Acknowledgments
Conflicts of Interest
References
- Glaser, B.; Lehmann, J.; Zech, W. Ameliorating Physical and Chemical Properties of Highly Weathered Soils in the Tropics with Charcoal—A Review. Biol. Fertil. Soils 2002, 35, 219–230. [Google Scholar] [CrossRef]
- Glaser, B.; Balashov, E.; Haumaier, L.; Guggenberger, G.; Zech, W. Black Carbon in Density Fractions of Anthropogenic Soils of the Brazilian Amazon Region. Org. Geochem. 2000, 31, 669–678. [Google Scholar] [CrossRef]
- Githinji, L. Effect of Biochar Application Rate on Soil Physical and Hydraulic Properties of a Sandy Loam. Arch. Agron. Soil Sci. 2013, 60, 457–470. [Google Scholar] [CrossRef]
- Obia, A.; Mulder, J.; Martinsen, V.; Cornelissen, G.; Børresen, T. In Situ Effects of Biochar on Aggregation, Water Retention and Porosity in Light-Textured Tropical Soils. Soil Tillage Res. 2016, 155, 35–44. [Google Scholar] [CrossRef]
- Laird, D.A.; Fleming, P.; Davis, D.D.; Horton, R.; Wang, B.; Karlen, D.L. Impact of Biochar Amendments on the Quality of a Typical Midwestern Agricultural Soil. Geoderma 2010, 158, 443–449. [Google Scholar] [CrossRef] [Green Version]
- Prendergast-Miller, M.T.; Duvall, M.; Sohi, S.P. Biochar-Root Interactions are Mediated by Biochar Nutrient Content and Impacts on Soil Nutrient Availability. Eur. J. Soil Sci. 2014, 65, 173–185. [Google Scholar] [CrossRef]
- Laghari, M.; Mirjat, M.S.; Hu, Z.; Fazal, S.; Xiao, B.; Hu, M.; Chen, Z.; Guo, D. Effects of Biochar Application Rate on Sandy Desert Soil Properties and Sorghum Growth. Catena 2015, 135, 313–320. [Google Scholar] [CrossRef]
- Ameloot, N.; Graber, E.R.; Verheijen, F.G.A.; De Neve, S. Interactions between Biochar Stability and Soil Organisms: Review and Research Needs. Eur. J. Soil Sci. 2013, 64, 379–390. [Google Scholar] [CrossRef]
- Devereux, R.C.; Sturrock, C.J.; Mooney, S.J. The Effects of Biochar on Soil Physical Properties and Winter Wheat Growth. Earth Environ. Sci. Trans. R. Soc. Edinb. 2012, 103, 13–18. [Google Scholar] [CrossRef]
- Trifunovic, B.; Gonzales, H.B.; Ravi, S.; Sharratt, B.S.; Mohanty, S.K. Dynamic Effects of Biochar Concentration and Particle Size on Hydraulic Properties of Sand. Land Degrad. Dev. 2018, 29, 884–893. [Google Scholar] [CrossRef]
- Cybulak, M.; Sokołowska, Z.; Boguta, P.; Tomczyk, A. Influence of pH and Grain Size on Physicochemical Properties of Biochar and Released Humic Substances. Fuel 2019, 240, 334–338. [Google Scholar] [CrossRef]
- Ilay, R.; Kavdır, Y.; Memici, M.; Ekinci, K. Grain Size-Induced Changes in Carbon and Nitrogen Concentrations and Characteristics of Tomato Harvest Residue Biochar. Int. J. Environ. Sci. Technol. 2020, 17, 3917–3926. [Google Scholar] [CrossRef]
- Duarte, S.D.J.; Glaser, B.; Cerri, C.E.P. Effect of Biochar Particle Size on Physical, Hydrological and Chemical Properties of Loamy and Sandy Tropical Soils. Agronomy 2019, 9, 165. [Google Scholar] [CrossRef] [Green Version]
- Liu, Z.; Dugan, B.; Masiello, C.A.; Gonnermann, H.M. Biochar Particle Size, Shape, and Porosity Act Together to Influence Soil Water Properties. PLoS ONE 2017, 12, e0179079. [Google Scholar] [CrossRef] [Green Version]
- Verheijen, F.G.; Zhuravel, A.; Silva, F.C.; Amaro, A.; Ben-Hur, M.; Keizer, J.J. The Influence of Biochar Particle Size and Concentration on Bulk Density and Maximum Water Holding Capacity of Sandy vs. Sandy Loam Soil in a Column Experiment. Geoderma 2019, 347, 194–202. [Google Scholar] [CrossRef]
- Sasidharan, S.; Torkzaban, S.; Bradford, S.A.; Kookana, R.; Page, D.; Cook, P.G. Transport and Retention of Bacteria and Viruses in Biochar-Amended Sand. Sci. Total Environ. 2016, 548–549, 100–109. [Google Scholar] [CrossRef] [PubMed]
- Chen, C.; Wang, R.; Shang, J.; Liu, K.; Irshad, M.K.; Hu, K.; Arthur, E. Effect of Biochar Application on Hydraulic Properties of Sandy Soil under Dry and Wet Conditions. Vadose Zone J. 2018, 17, 180101. [Google Scholar] [CrossRef] [Green Version]
- Liu, X.; Zhang, A.; Ji, C.; Joseph, S.; Bian, R.; Li, L.; Pan, G.; Paz-Ferreiro, J. Biochar’s Effect on Crop Productivity and the Dependence on Experimental Conditions—A Meta-Analysis of Literature Data. Plant Soil 2013, 373, 583–594. [Google Scholar] [CrossRef]
- Novak, J.M.; Busscher, W.J.; Laird, D.L.; Ahmedna, M.; Watts, D.W.; Niandou, M.A.S. Impact of Biochar Amendment on Fertility of a Southeastern Coastal Plain Soil. Soil Sci. 2009, 174, 105–112. [Google Scholar] [CrossRef] [Green Version]
- Uzoma, K.C.; Inoue, M.; Andry, H.; Fujimaki, H.; Zahoor, A.; Nishihara, E. Effect of Cow Manure Biochar on Maize Productivity under Sandy Soil Condition. Soil Use Manag. 2011, 27, 205–212. [Google Scholar] [CrossRef]
- Abel, S.; Peters, A.; Trinks, S.; Schonsky, H.; Facklam, M.; Wessolek, G. Impact of Biochar and Hydrochar Addition on Water Retention and Water Repellency of Sandy Soil. Geoderma 2013, 202-203, 183–191. [Google Scholar] [CrossRef]
- Martinsen, V.; Mulder, J.; Shitumbanuma, V.; Sparrevik, M.; Børresen, T.; Cornelissen, G. Farmer-led maize biochar trials: Effect on Crop Yield and Soil Nutrients under Conservation Farming. J. Plant Nutr. Soil Sci. 2014, 177, 681–695. [Google Scholar] [CrossRef]
- Głąb, T.; Palmowska, J.; Zaleski, T.; Gondek, K. Effect of Biochar Application on Soil Hydrological Properties and Physical Quality of Sandy Soil. Geoderma 2016, 281, 11–20. [Google Scholar] [CrossRef]
- Suliman, W.; Harsh, J.B.; Abu-Lail, N.I.; Fortuna, A.-M.; Dallmeyer, I.; Garcia-Pérez, M. The Role of Biochar Porosity and Surface Functionality in Augmenting Hydrologic Properties of a Sandy Soil. Sci. Total Environ. 2017, 574, 139–147. [Google Scholar] [CrossRef]
- Villagra-Mendoza, K.; Horn, R. Effect of Biochar Addition on Hydraulic Functions of Two Textural Soils. Geoderma 2018, 326, 88–95. [Google Scholar] [CrossRef]
- Quin, P.; Cowie, A.; Flavel, R.; Keen, B.; Macdonald, L.; Morris, S.; Singh, B.; Young, I.; Van Zwieten, L. Oil Mallee Biochar Improves Soil Structural Properties—A Study with X-ray Micro-CT. Agric. Ecosyst. Environ. 2014, 191, 142–149. [Google Scholar] [CrossRef]
- Edeh, I.G.; Mašek, O.; Buss, W. A Meta-Analysis on Biochar’s Effects on Soil Water Properties—New Insights and Future Research Challenges. Sci. Total Environ. 2020, 714, 136857. [Google Scholar] [CrossRef]
- Novak, J.M.; Cantrell, K.B.; Watts, D.W.; Busscher, W.J.; Johnson, M.G. Designing Relevant Biochars as Soil Amendments using Lignocellulosic-Based and Manure-Based Feedstocks. J. Soils Sediments 2014, 14, 330–343. [Google Scholar] [CrossRef]
- Gluba, Ł.; Łukowski, M.; Szlązak, R.; Sagan, J.; Szewczak, K.; Łoś, H.; Rafalska-Przysucha, A.; Usowicz, B. Spatio-Temporal Mapping of L-Band Microwave Emission on a Heterogeneous Area with ELBARA III Passive Radiometer. Sensors 2019, 19, 3447. [Google Scholar] [CrossRef] [Green Version]
- Soils and Mineral Formations—Sampling and Determination of Grain Size Distribution; PN-R-04032; The Polish Committee for Standardization: Warsaw, Poland, 1998.
- Angelova, V.R.; Akova, V.I.; Ivanov, K.I.; Licheva, P.A. Comparative Study of Titimetric Methods for Determination of Organic Carbon in Soils, Compost and Sludge. J. Int. Sci. Public Ecol. Safety 2014, 8, 430–440. [Google Scholar]
- Ścisłowska, M.; Włodarczyk, R.; Kobyłecki, R.; Bis, Z. Biochar to improve the quality and productivity of soils. J. Ecol. Eng. 2015, 16, 31–35. [Google Scholar] [CrossRef]
- Novák, V.; Hlaváčiková, H. Applied Soil Hydrology. In Theory and Applications of Transport in Porous Media; Springer International Publishing: Cham, Switzerland, 2019; Volume 32, ISBN 978-3-030-01805-4. [Google Scholar]
- Van Genuchten, M.T. A Closed-form Equation for Predicting the Hydraulic Conductivity of Unsaturated Soils. Soil Sci. Soc. Am. J. 1980, 44, 892–898. [Google Scholar] [CrossRef] [Green Version]
- Corrêa, A.P.D.L.; Bastos, R.R.C.; Filho, G.N.D.R.; Zamian, J.R.; Da Conceição, L.R.V. Preparation of Sulfonated Carbon-Based Catalysts from Murumuru Kernel Shell and their Performance in the Esterification Reaction. RSC Adv. 2020, 10, 20245–20256. [Google Scholar] [CrossRef]
- Kameyama, K.; Miyamoto, T.; Iwata, Y. The Preliminary Study of Water-Retention Related Properties of Biochar Produced from Various Feedstock at Different Pyrolysis Temperatures. Materials 2019, 12, 1732. [Google Scholar] [CrossRef] [Green Version]
- Tomczyk, A.; Sokołowska, Z.; Boguta, P. Biochar Physicochemical Properties: Pyrolysis Temperature and Feedstock Kind Effects. Rev. Environ. Sci. Bio/Technol. 2020, 19, 191–215. [Google Scholar] [CrossRef] [Green Version]
- Kinney, T.J.; Masiello, C.A.; Dugan, B.; Hockaday, W.C.; Dean, M.R.; Zygourakis, K.; Barnes, R.T. Hydrologic Properties of Biochars Produced at Different Temperatures. Biomass Bioenergy 2012, 41, 34–43. [Google Scholar] [CrossRef]
- Brewer, R. Fabric and Mineral Analysis of Soils. Soil Sci. 1965, 100, 73. [Google Scholar] [CrossRef]


| Parameter | Soil | |
|---|---|---|
| Sand (2–0.05 mm) | 90 | |
| Texture (%) | Silt (0.05–0.002 mm) | 9 |
| Clay (<0.002 mm) | 1 | |
| OMD* (%) | 1.8 | |
| OMT* (%) | 2.0 | |
| pHH20 | 7.0 | |
| pHKCl | 6.3 |
| Biochar Dose | Biochar Size Fraction | Bulk Density (mean ± SD) | AWC | |||||
|---|---|---|---|---|---|---|---|---|
| wt.% | µm | g cm−3 | m3 m−3 | m3 m−3 | cm−1 | m3 m−3 | m3 m−3 | |
| 0 | 1.460 ± 0.029 | 0.3794 | 0.0747 | 0.067 | 1.692 | 0.078 | ||
| 0.95 | <50 | 1.666 ± 0.029 | 0.3082 | 0.0594 | 0.017 | 1.432 | 0.155 | 0.077 |
| 2.24 | <50 | 1.665 ± 0.025 | 0.3075 | 0.0597 | 0.015 | 1.559 | 0.157 | 0.079 |
| 4.76 | <50 | 1.580 ± 0.018 | 0.3381 | 0 | 0.102 | 1.069 | 0.084 | 0.006 |
| 9.52 | <50 | 1.523 ± 0.008 | 0.3662 | 0.0002 | 0.645 | 1.028 | 0.043 | −0.035 |
| 0.95 | 50–100 | 1.666 ± 0.036 | 0.3131 | 0.0501 | 0.021 | 1.447 | 0.152 | 0.075 |
| 2.24 | 50–100 | 1.627 ± 0.021 | 0.3191 | 0.0637 | 0.017 | 1.411 | 0.157 | 0.080 |
| 4.76 | 50–100 | 1.563 ± 0.023 | 0.3386 | 0.0765 | 0.024 | 1.166 | 0.119 | 0.041 |
| 9.52 | 50–100 | 1.524 ± 0.017 | 0.3627 | 0 | 0.069 | 1.061 | 0.084 | 0.006 |
| 0.95 | 100–250 | 1.511 ± 0.004 | 0.3498 | 0.0684 | 0.029 | 1.946 | 0.097 | 0.020 |
| 2.24 | 100–250 | 1.512 ± 0.001 | 0.3516 | 0.0718 | 0.031 | 1.530 | 0.135 | 0.057 |
| 4.76 | 100–250 | 1.534 ± 0.003 | 0.3406 | 0.0719 | 0.028 | 1.321 | 0.145 | 0.067 |
| 9.52 | 100–250 | 1.481 ± 0.005 | 0.3804 | 0.1038 | 0.042 | 1.172 | 0.120 | 0.043 |
| 0.95 | <2000 | 1.540 ± 0.022 | 0.4024 | 0.0628 | 0.151 | 1.392 | 0.100 | 0.023 |
| 2.24 | <2000 | 1.440 ± 0.008 | 0.418 | 0.0949 | 0.126 | 1.435 | 0.095 | 0.017 |
| 4.76 | <2000 | 1.327 ± 0.033 | 0.4209 | 0.1078 | 0.117 | 1.477 | 0.088 | 0.010 |
Publisher’s Note: MDPI stays neutral with regard to jurisdictional claims in published maps and institutional affiliations. |
© 2021 by the authors. Licensee MDPI, Basel, Switzerland. This article is an open access article distributed under the terms and conditions of the Creative Commons Attribution (CC BY) license (http://creativecommons.org/licenses/by/4.0/).
Share and Cite
Gluba, Ł.; Rafalska-Przysucha, A.; Szewczak, K.; Łukowski, M.; Szlązak, R.; Vitková, J.; Kobyłecki, R.; Bis, Z.; Wichliński, M.; Zarzycki, R.; et al. Effect of Fine Size-Fractionated Sunflower Husk Biochar on Water Retention Properties of Arable Sandy Soil. Materials 2021, 14, 1335. https://doi.org/10.3390/ma14061335
Gluba Ł, Rafalska-Przysucha A, Szewczak K, Łukowski M, Szlązak R, Vitková J, Kobyłecki R, Bis Z, Wichliński M, Zarzycki R, et al. Effect of Fine Size-Fractionated Sunflower Husk Biochar on Water Retention Properties of Arable Sandy Soil. Materials. 2021; 14(6):1335. https://doi.org/10.3390/ma14061335
Chicago/Turabian StyleGluba, Łukasz, Anna Rafalska-Przysucha, Kamil Szewczak, Mateusz Łukowski, Radosław Szlązak, Justína Vitková, Rafał Kobyłecki, Zbigniew Bis, Michał Wichliński, Robert Zarzycki, and et al. 2021. "Effect of Fine Size-Fractionated Sunflower Husk Biochar on Water Retention Properties of Arable Sandy Soil" Materials 14, no. 6: 1335. https://doi.org/10.3390/ma14061335