
Phase Equilibria of the Ag-Al-Au Ternary System and Interfacial Reactions in the Au-xAg/Al Couples at 450 °C

 , , and
Abstract
: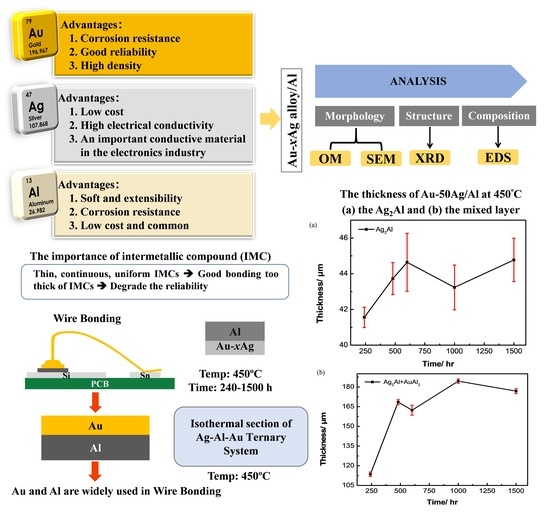
1. Introduction
2. Experimental Procedures
2.1. Phase Equilibria of the Au-Sn-Zn Ternary System
2.2. Interfacial Reactions in the Au-xAg/Al Reaction Couple
3. Results and Discussion
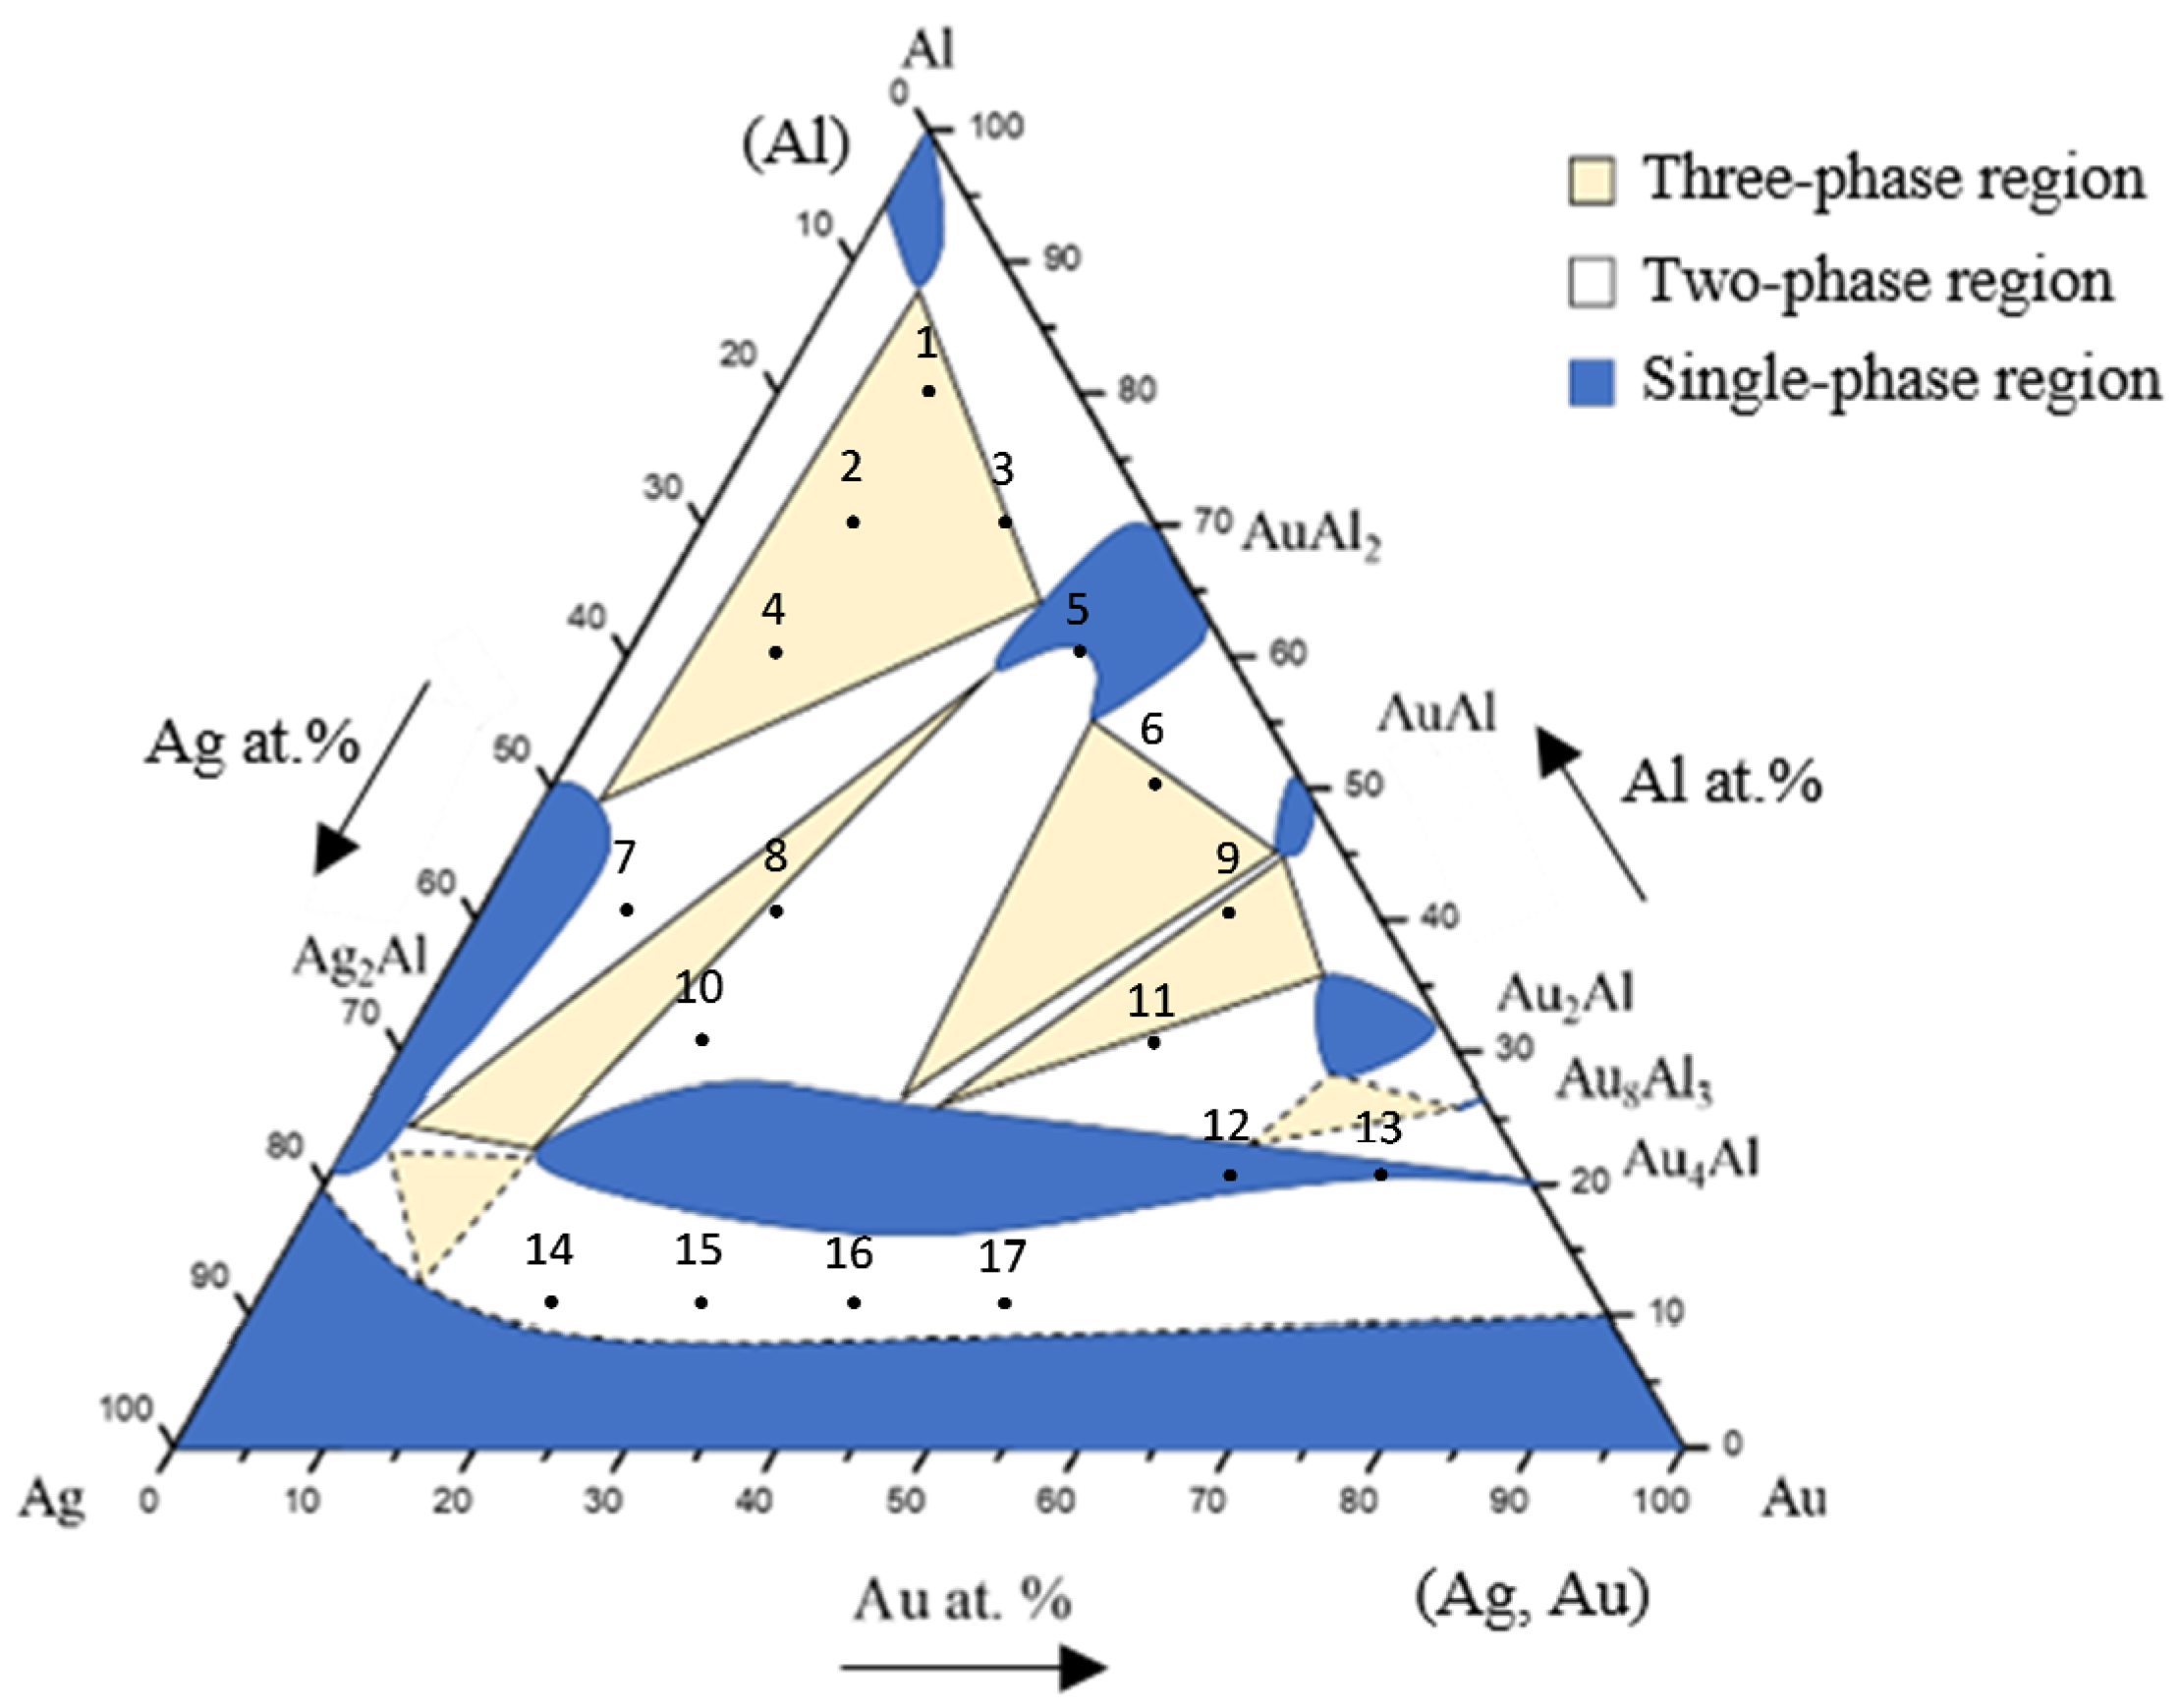
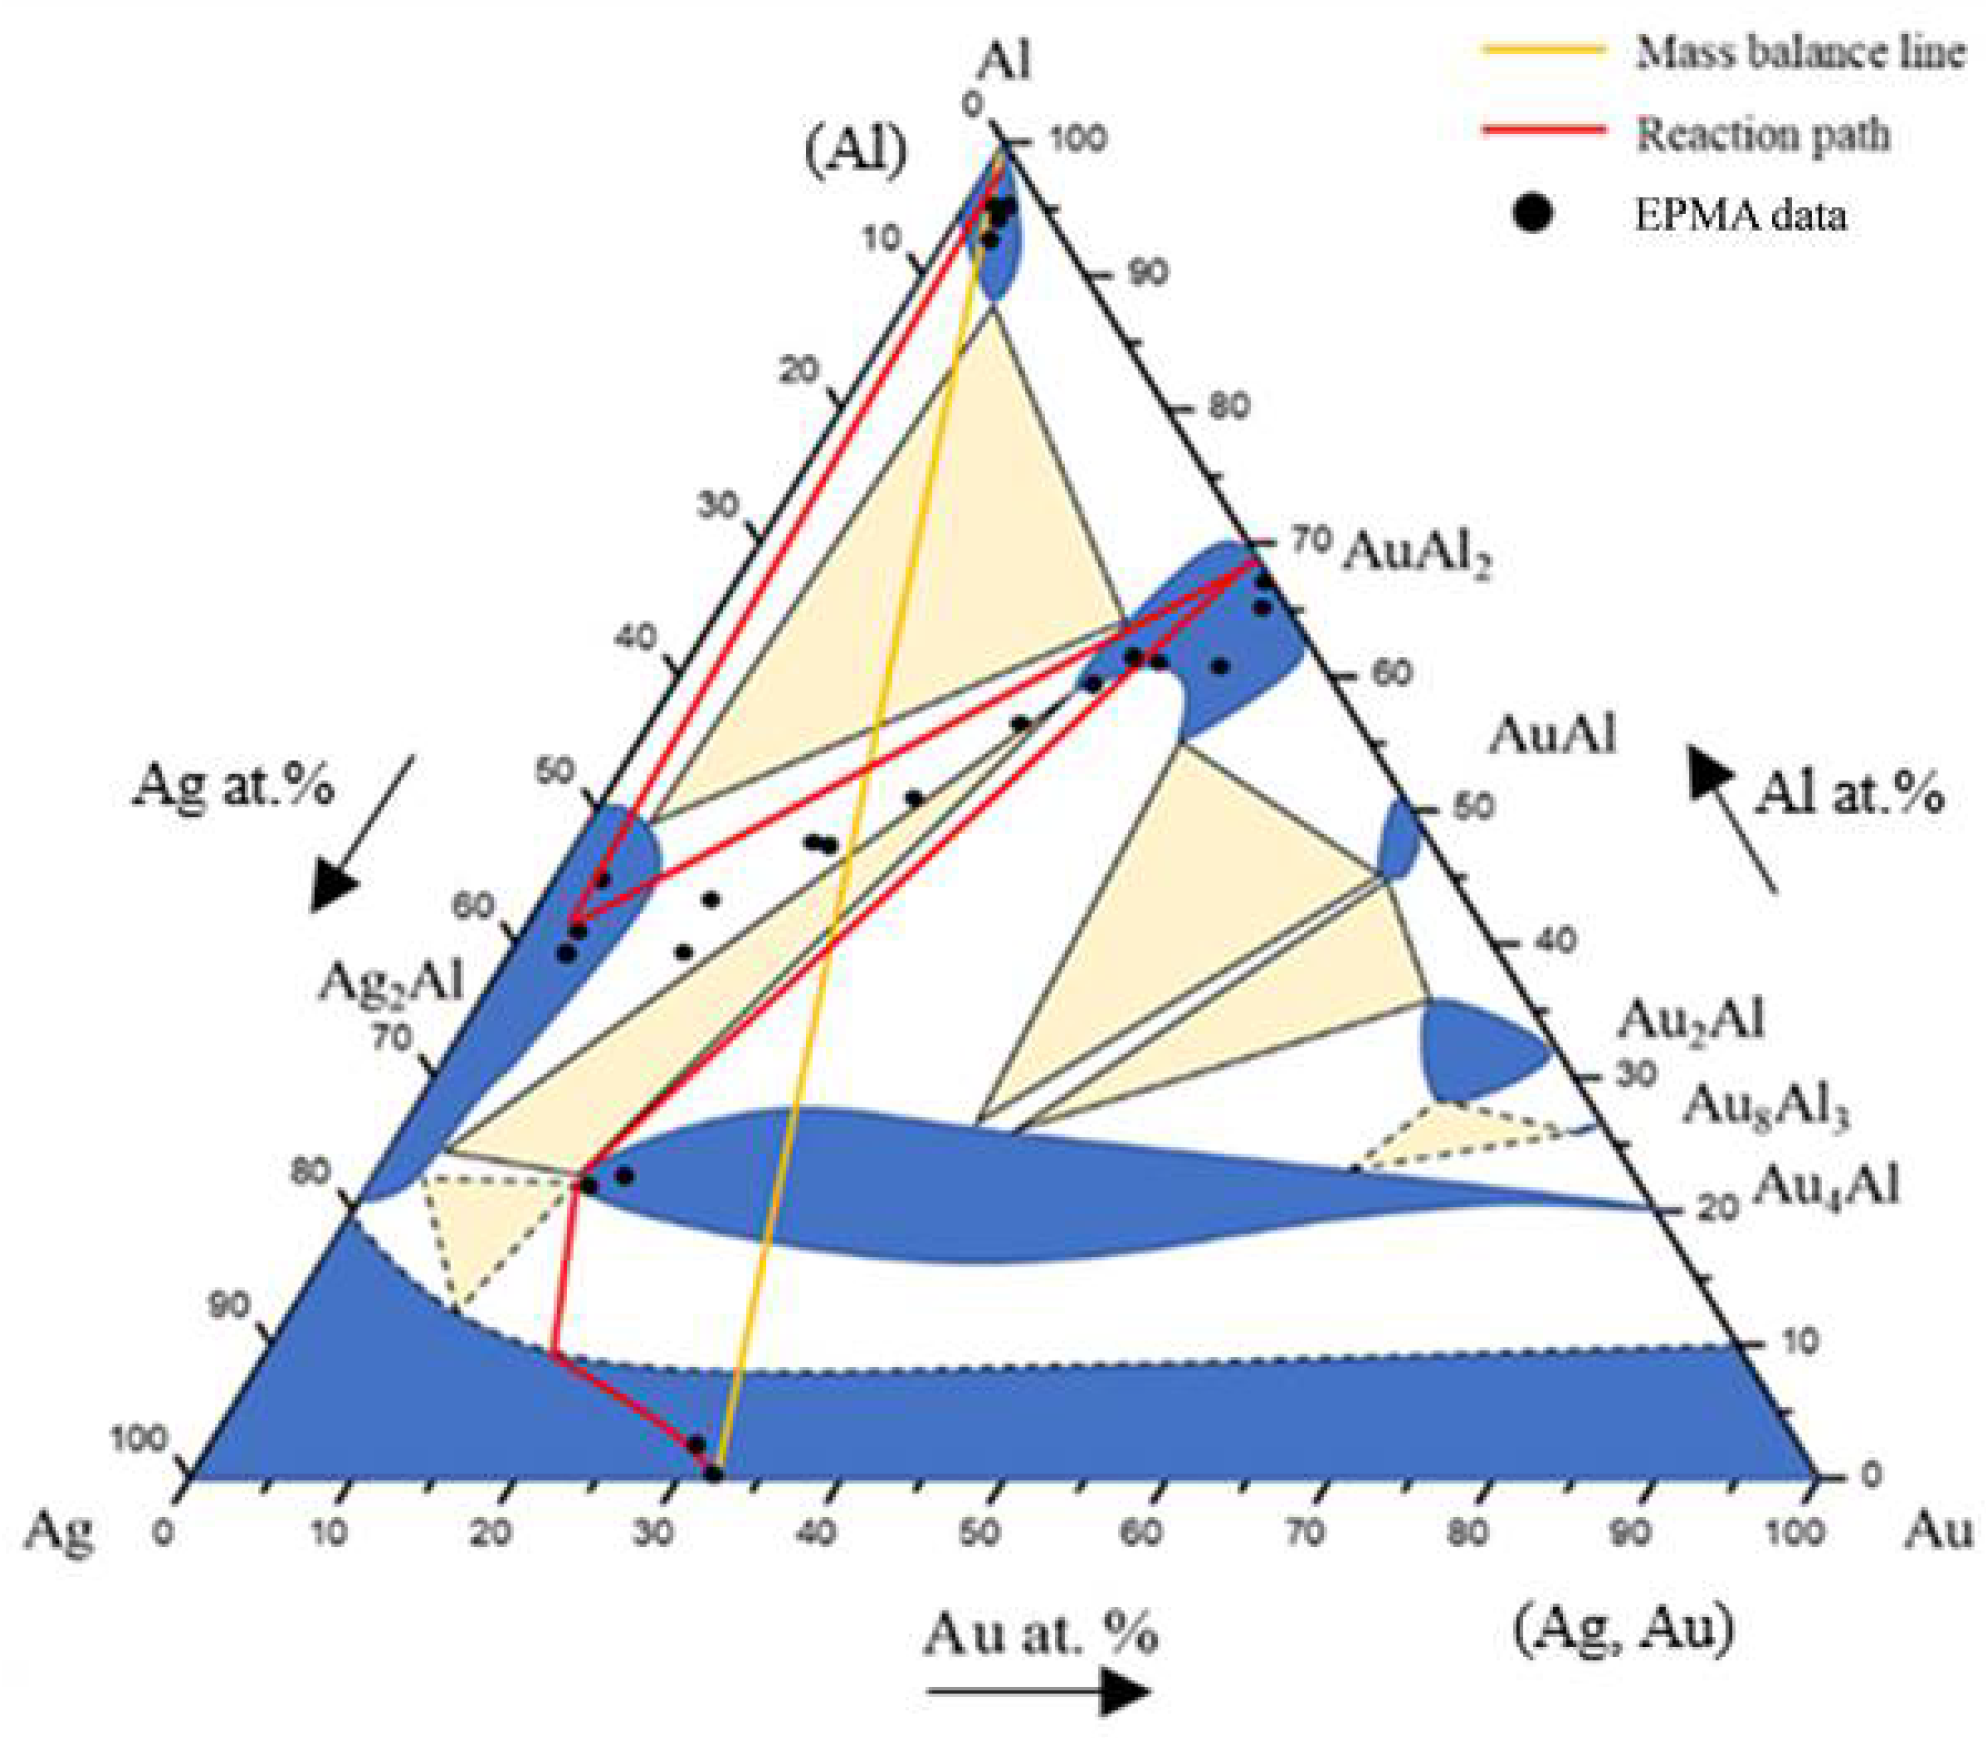
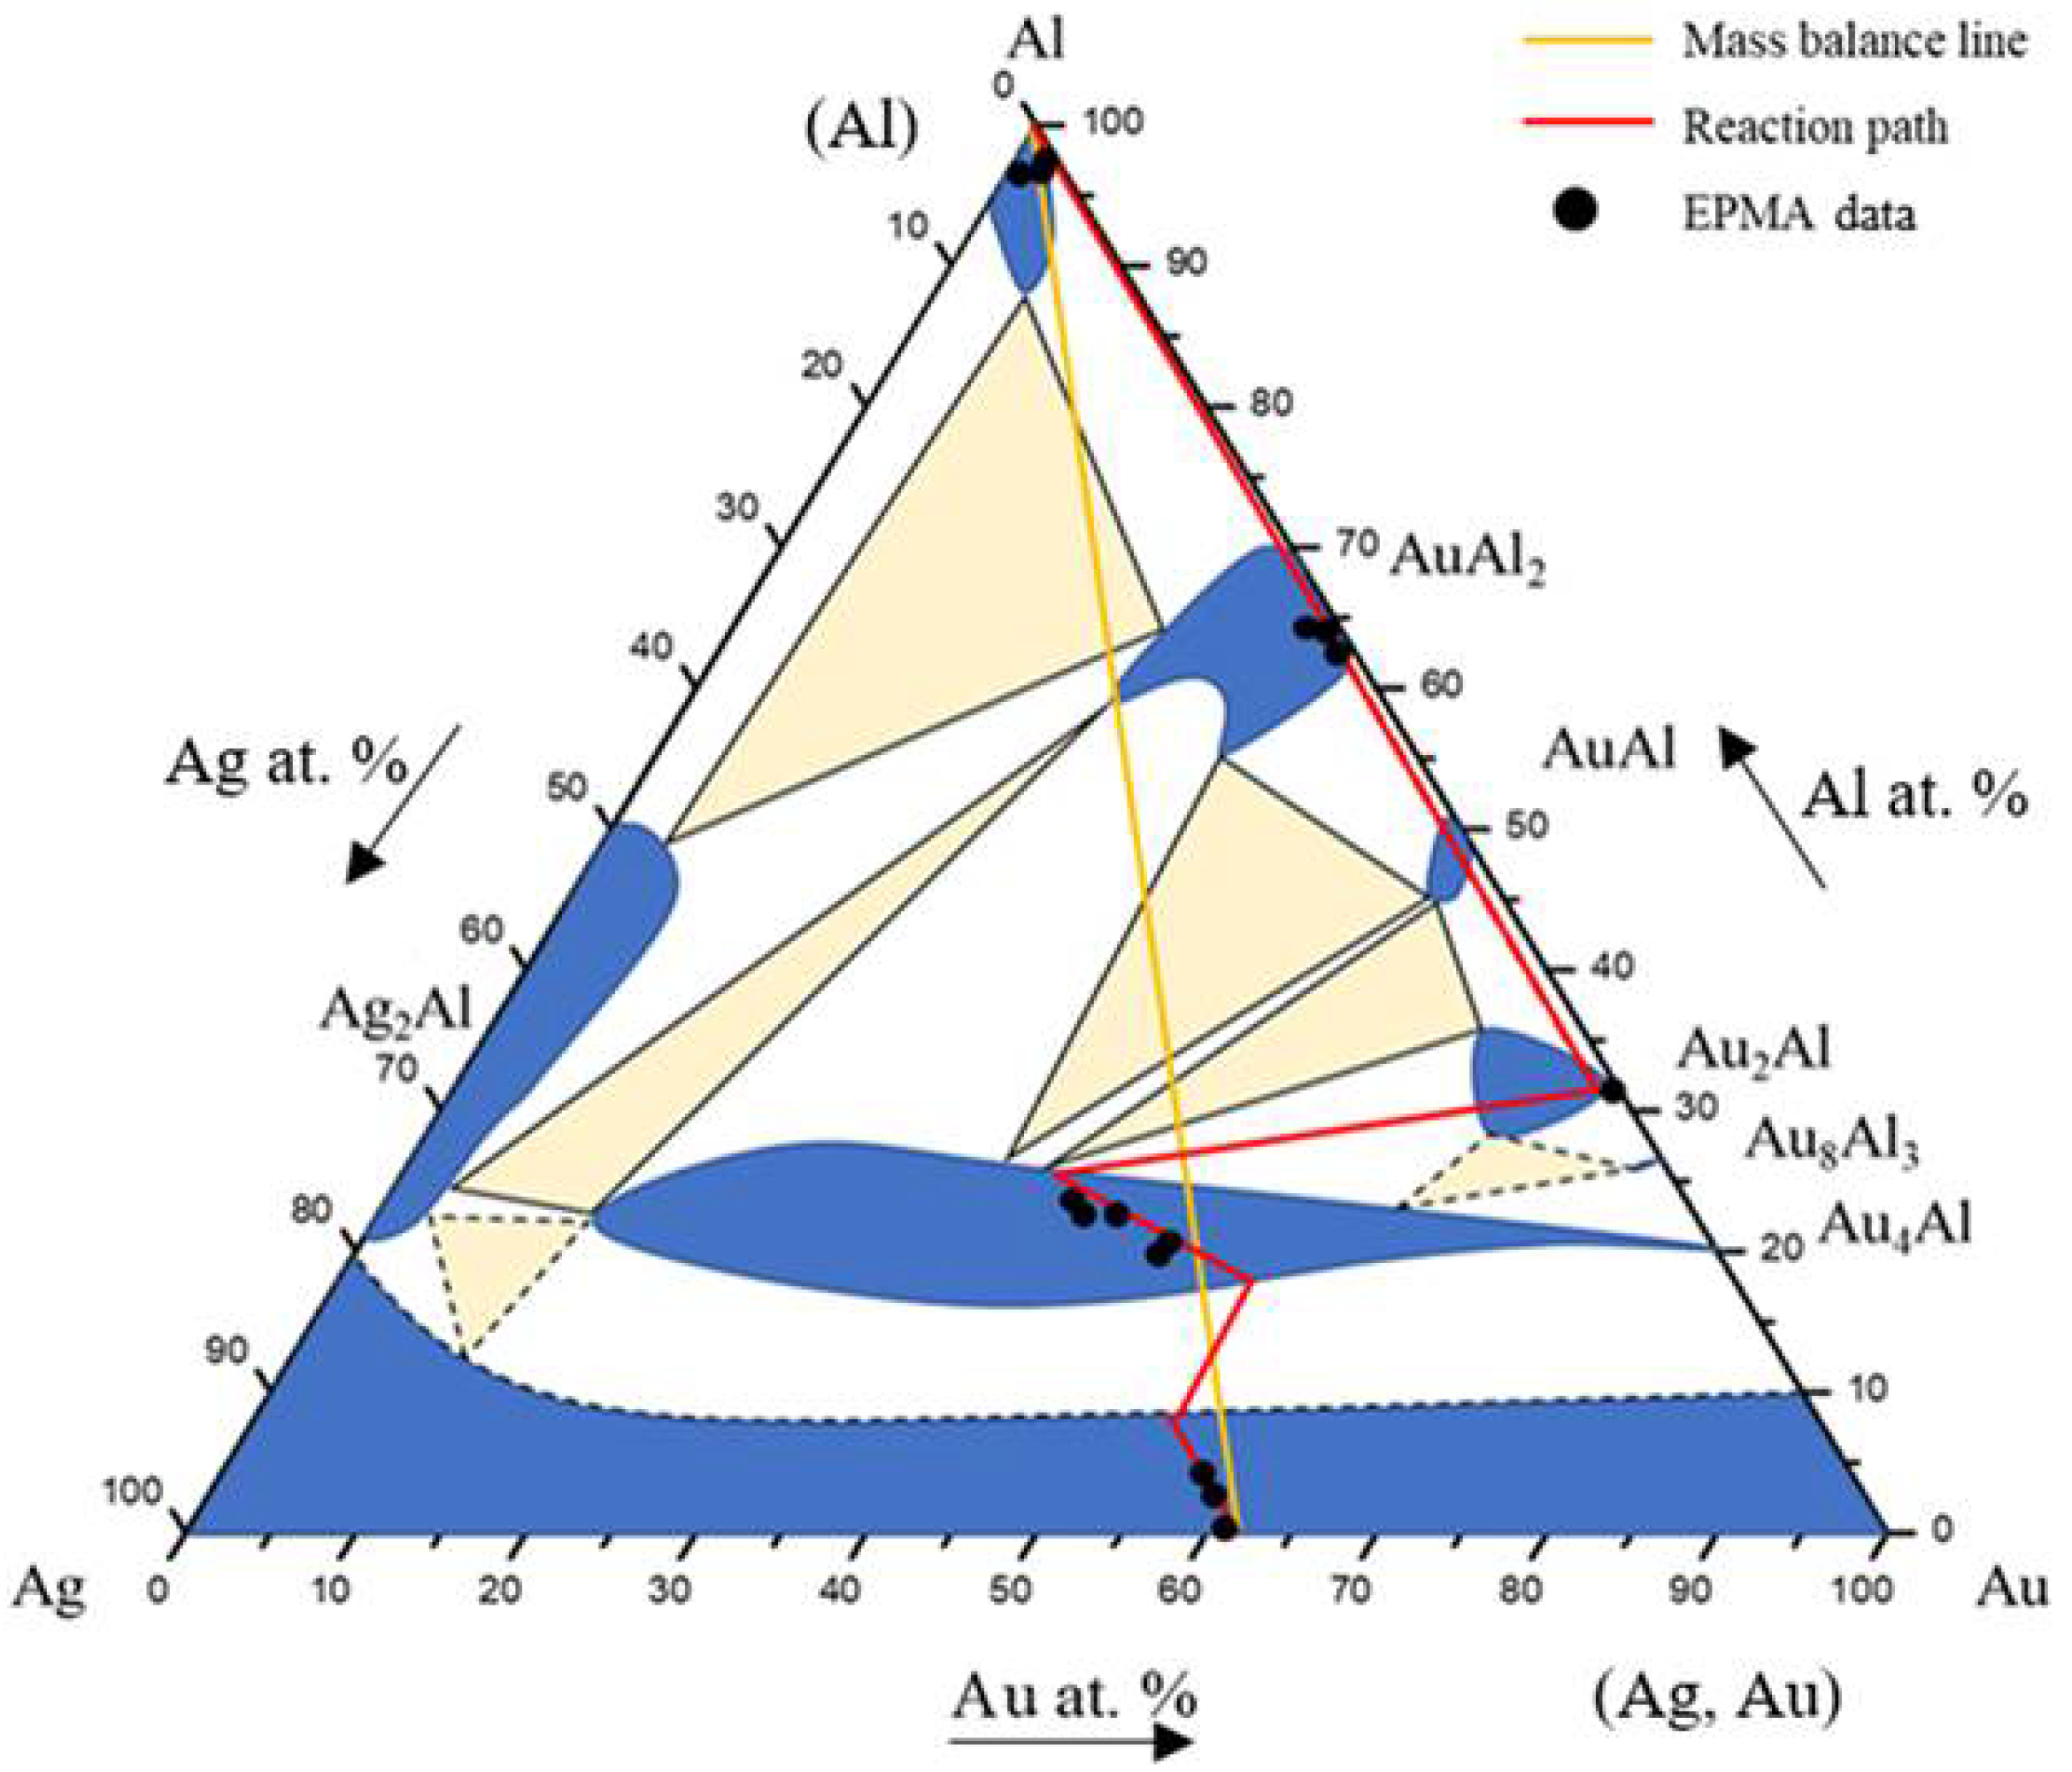
3.1. Phase Equilibria of the Ag-Al-Au Ternary System at 450 °C
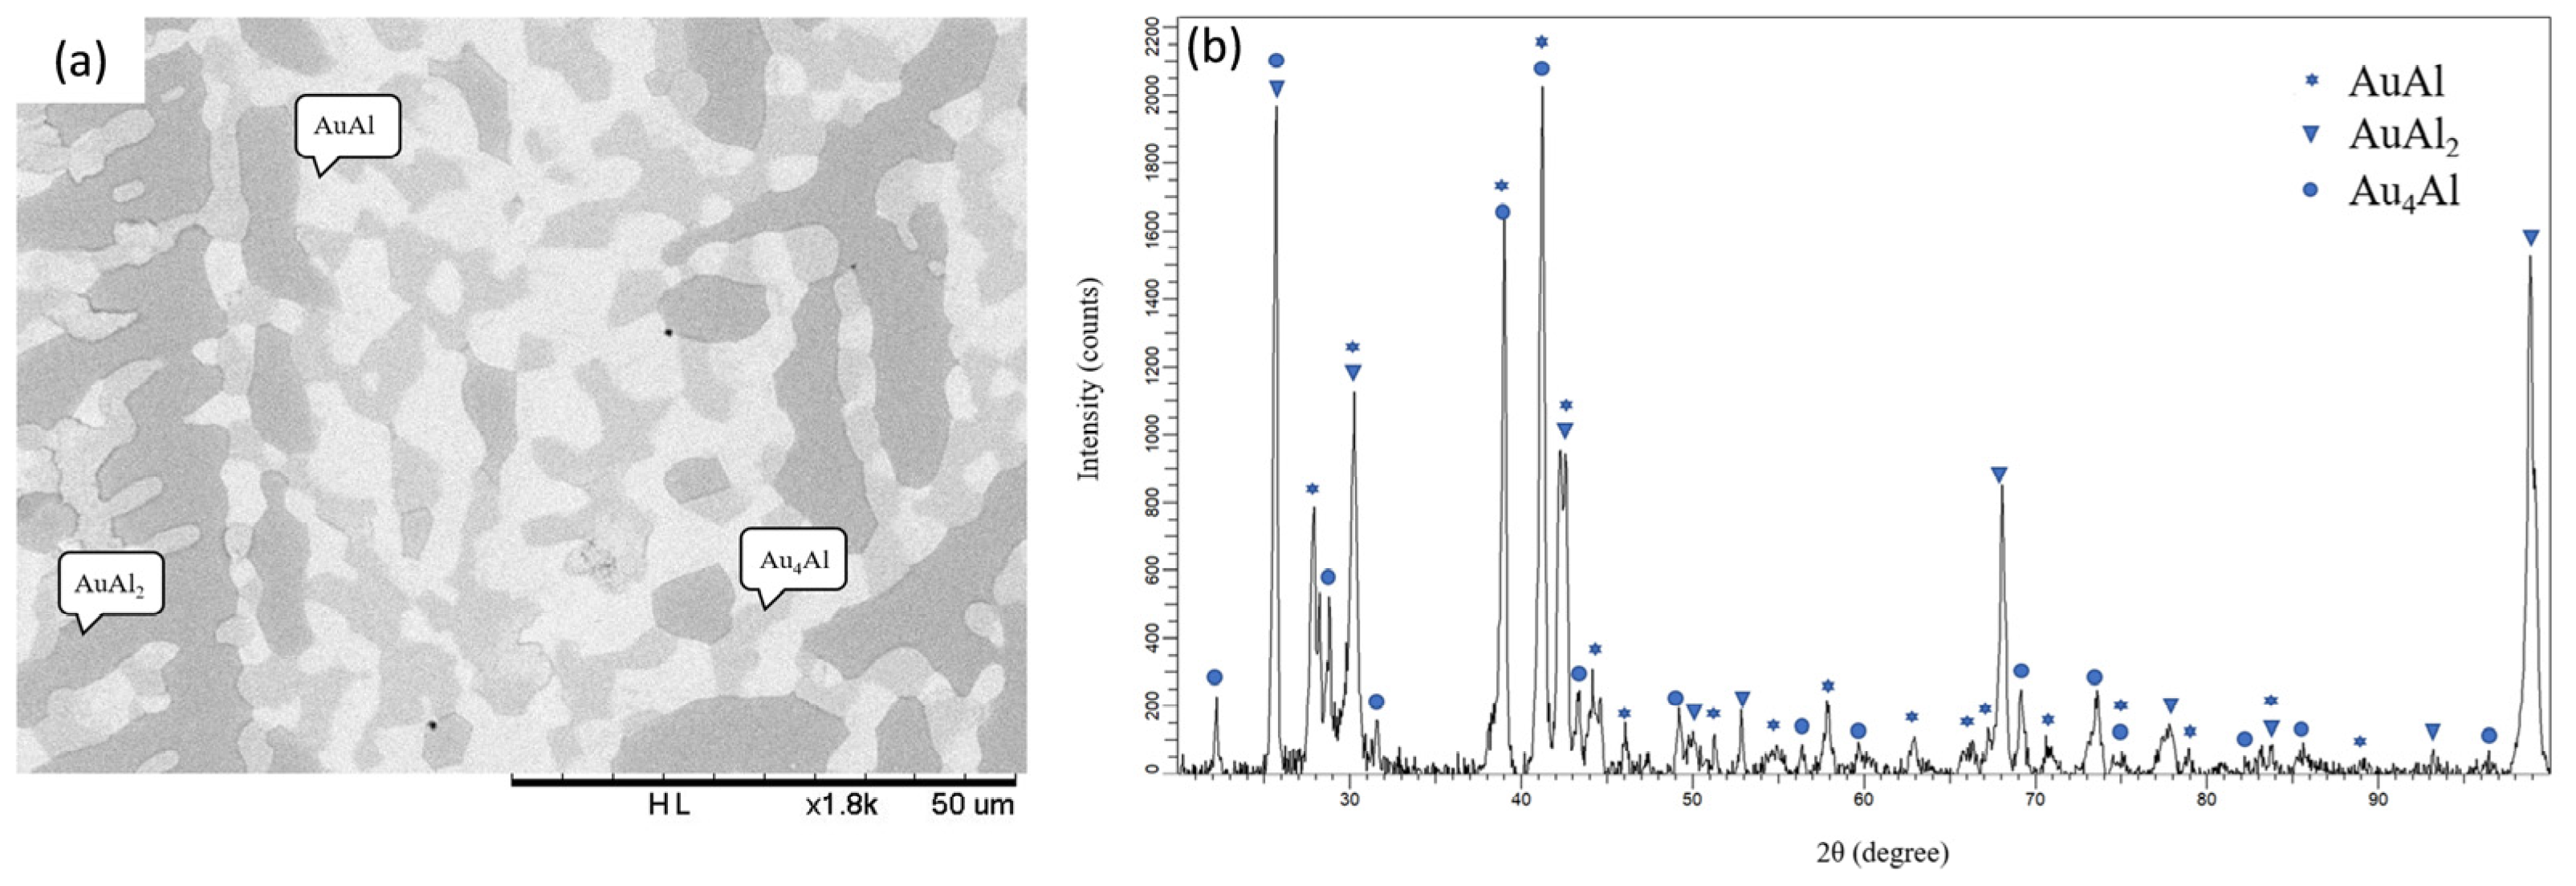
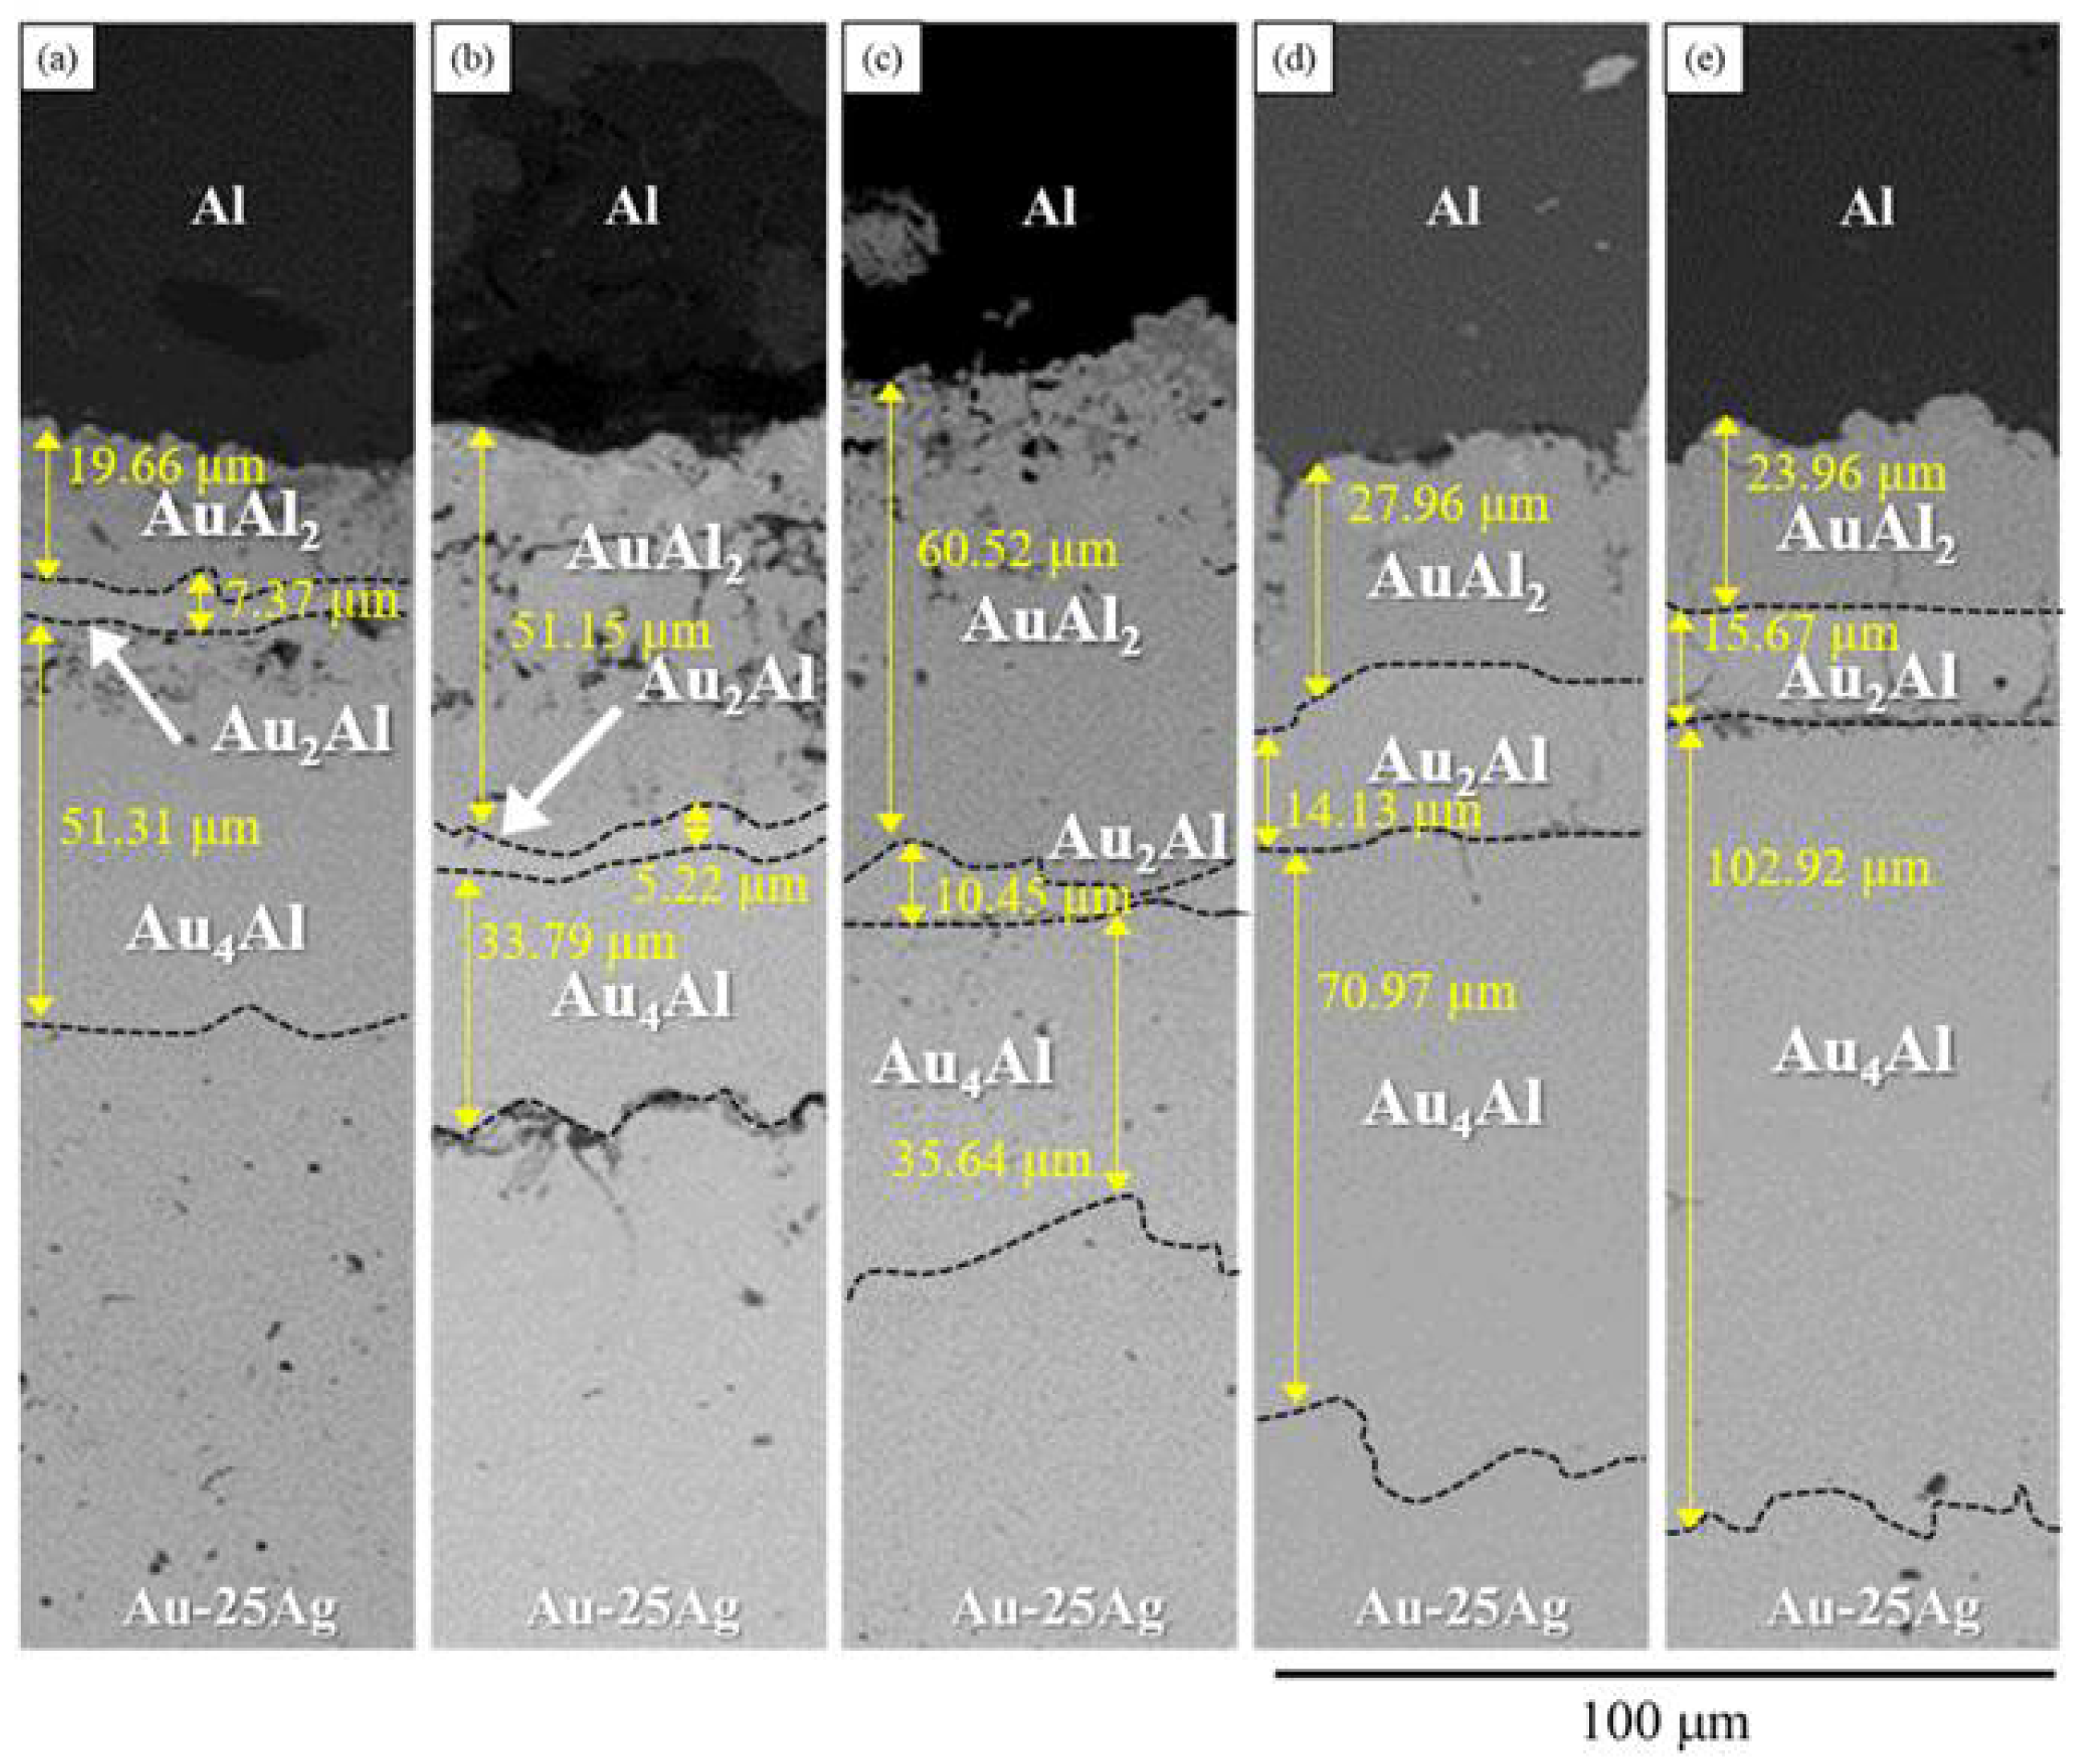
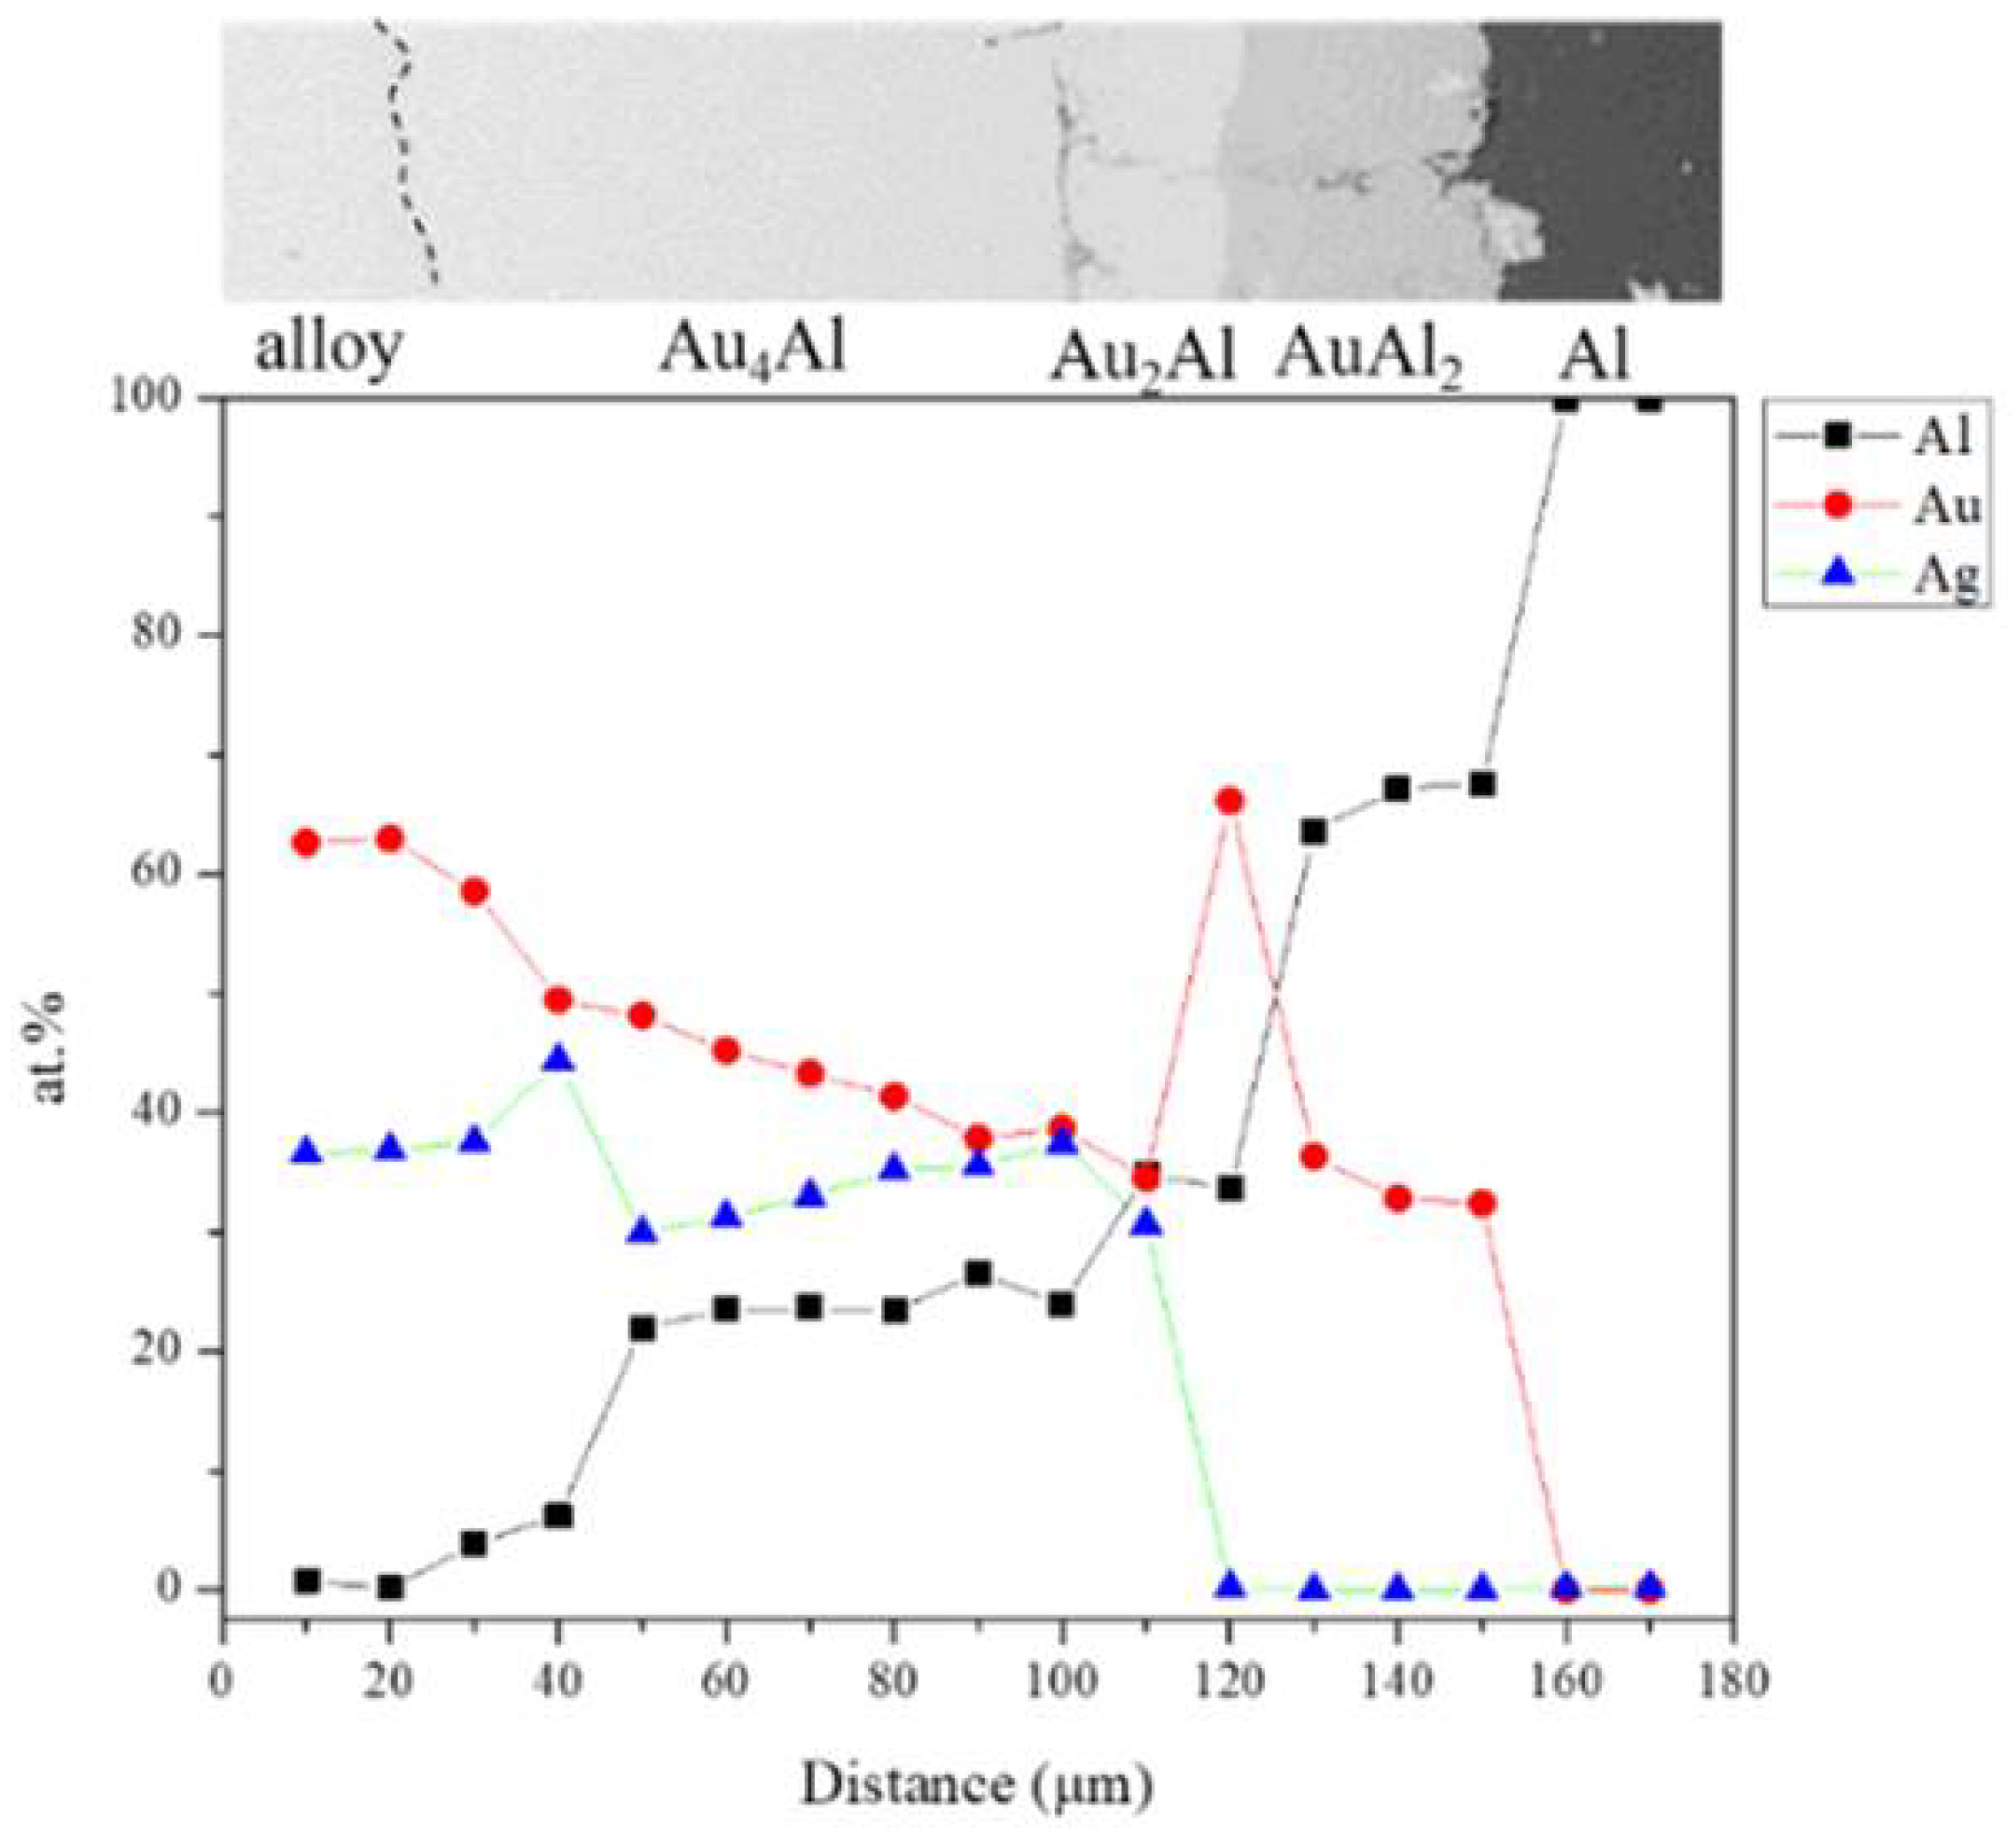
3.2. Interfacial Reaction in the Au-25Ag/Al Reaction Couple at 450 °C
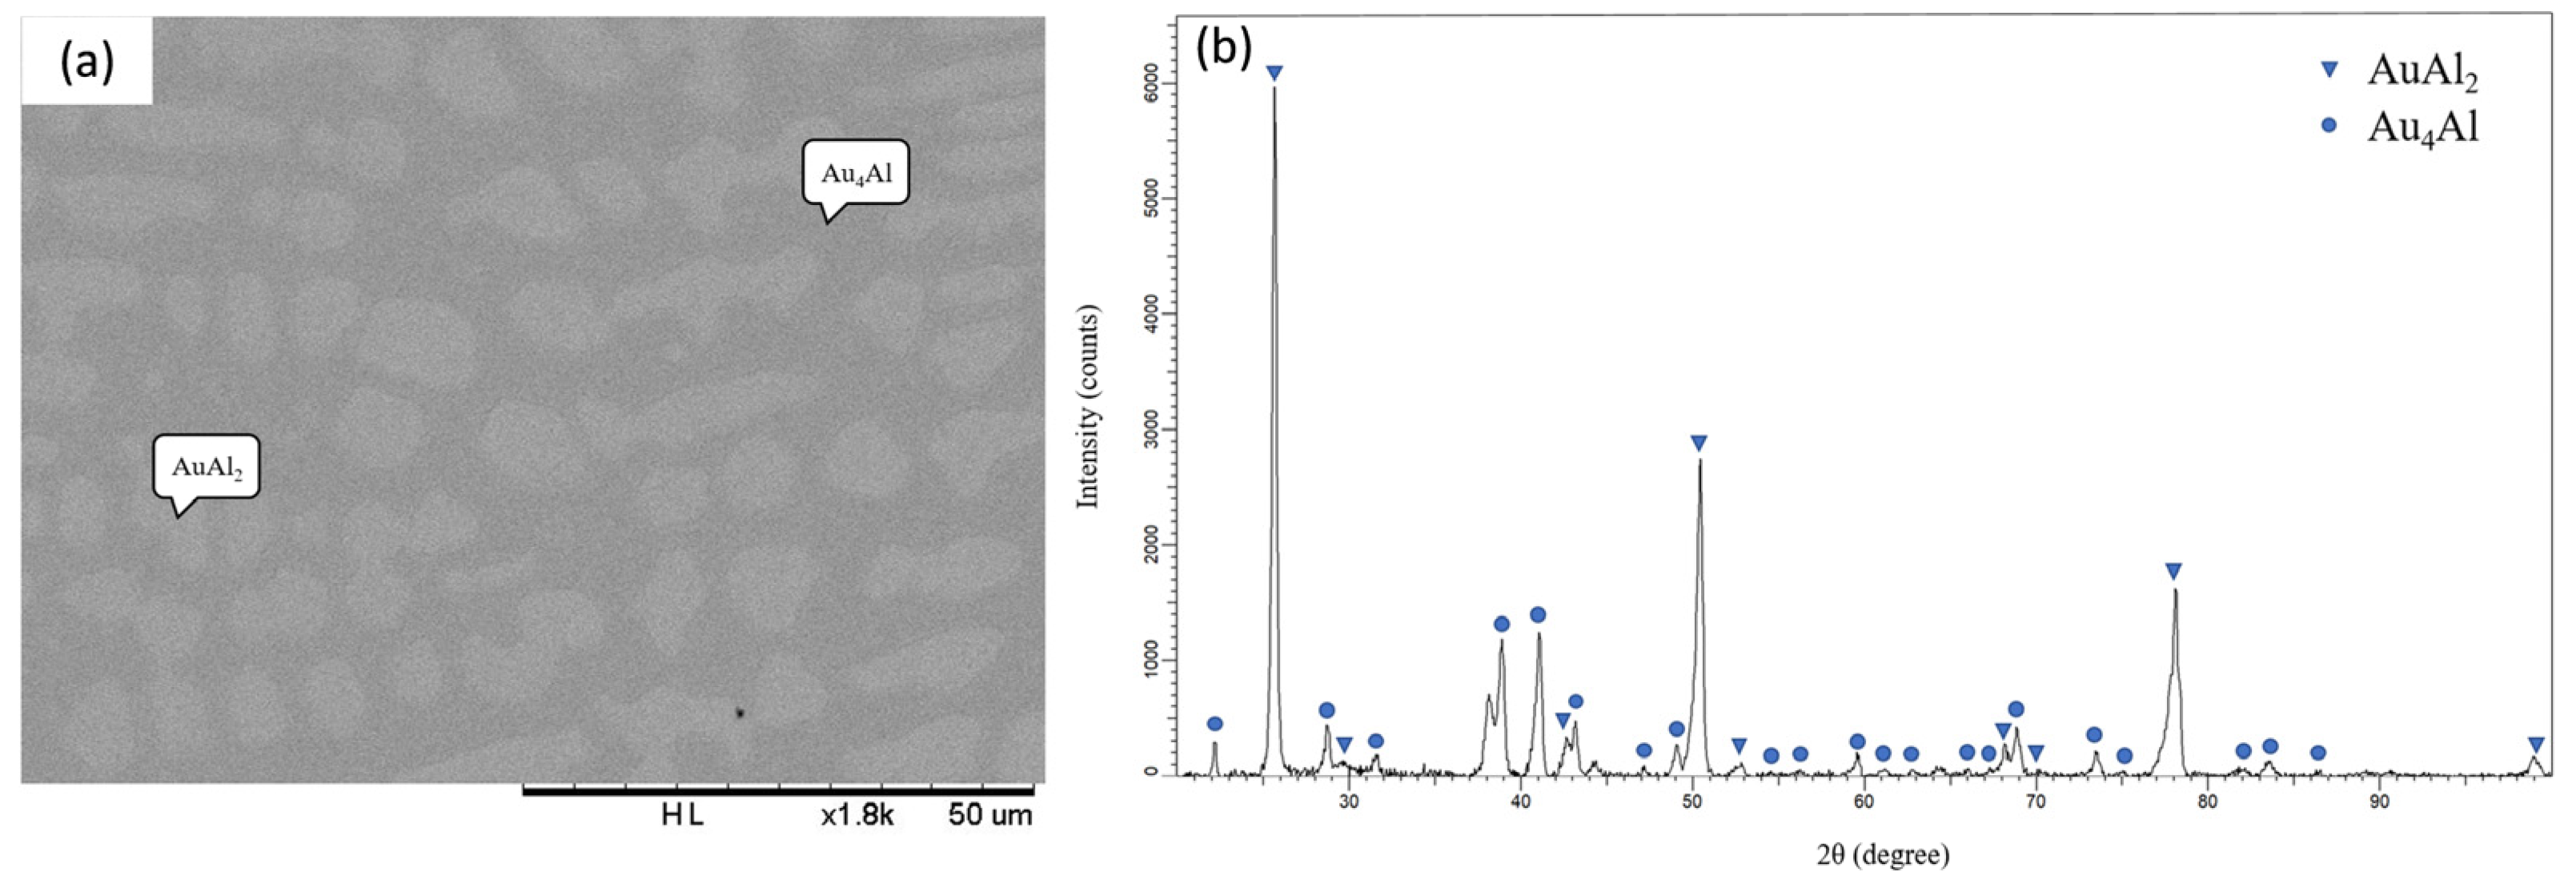
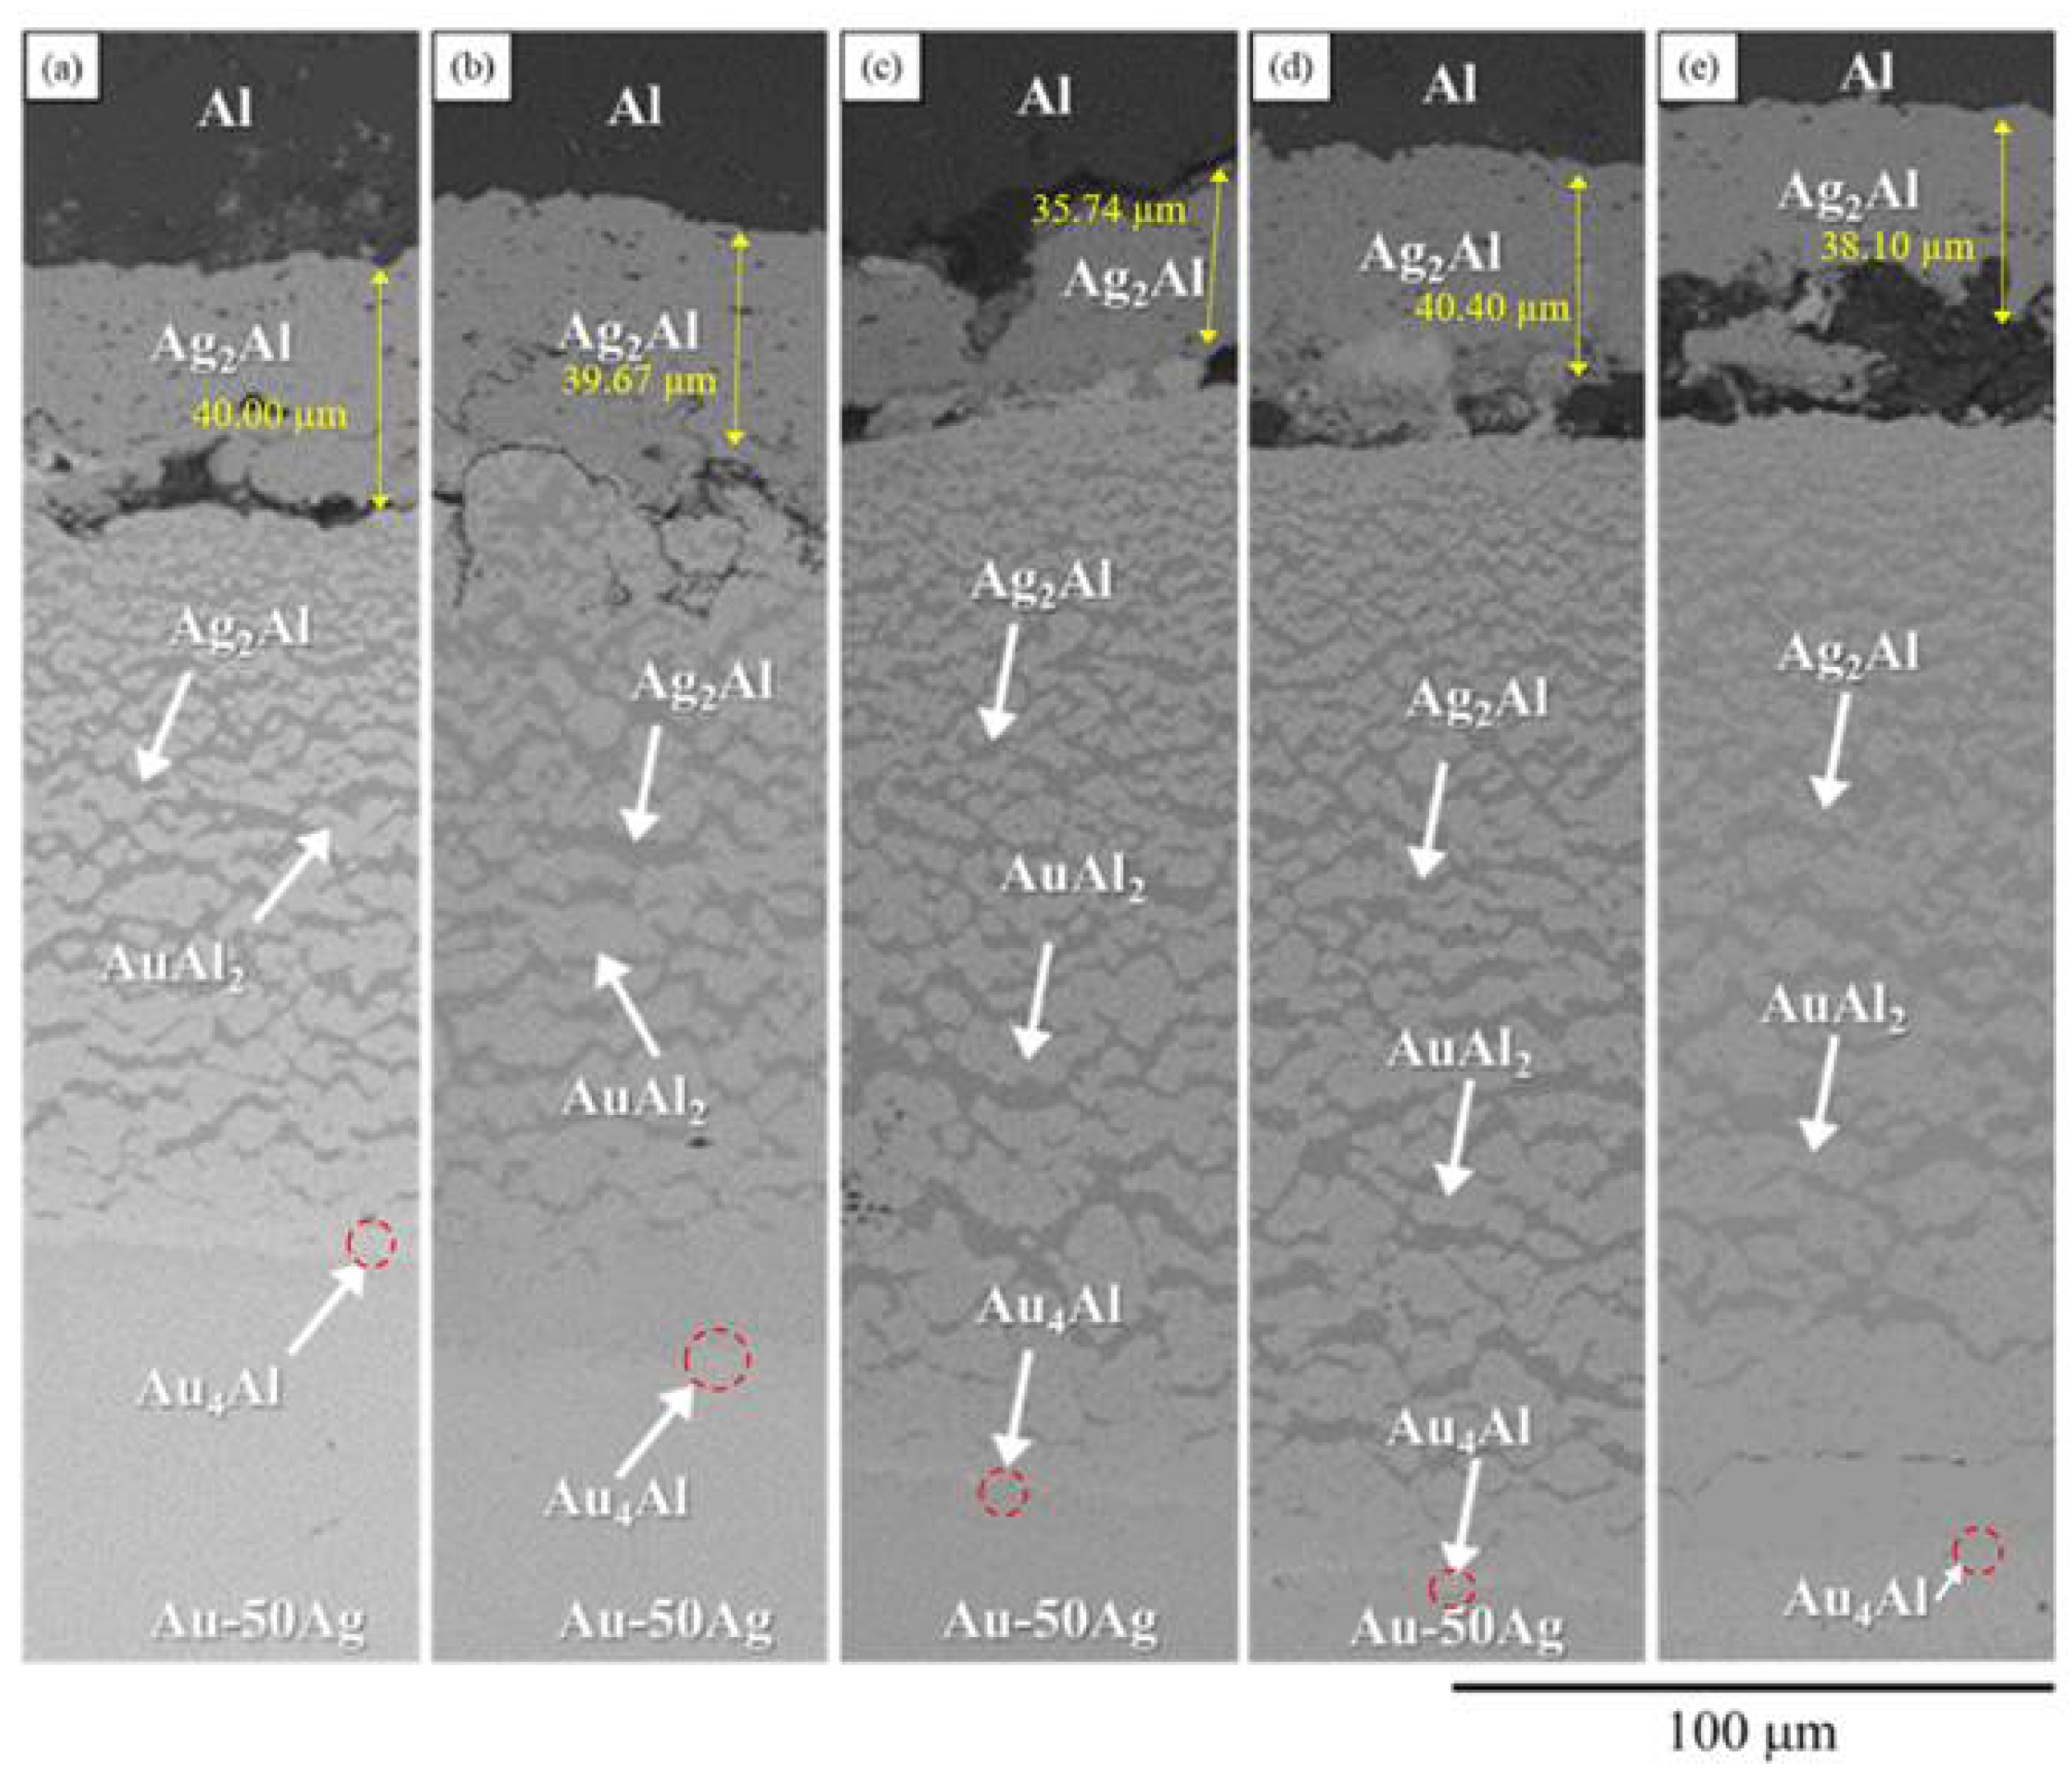
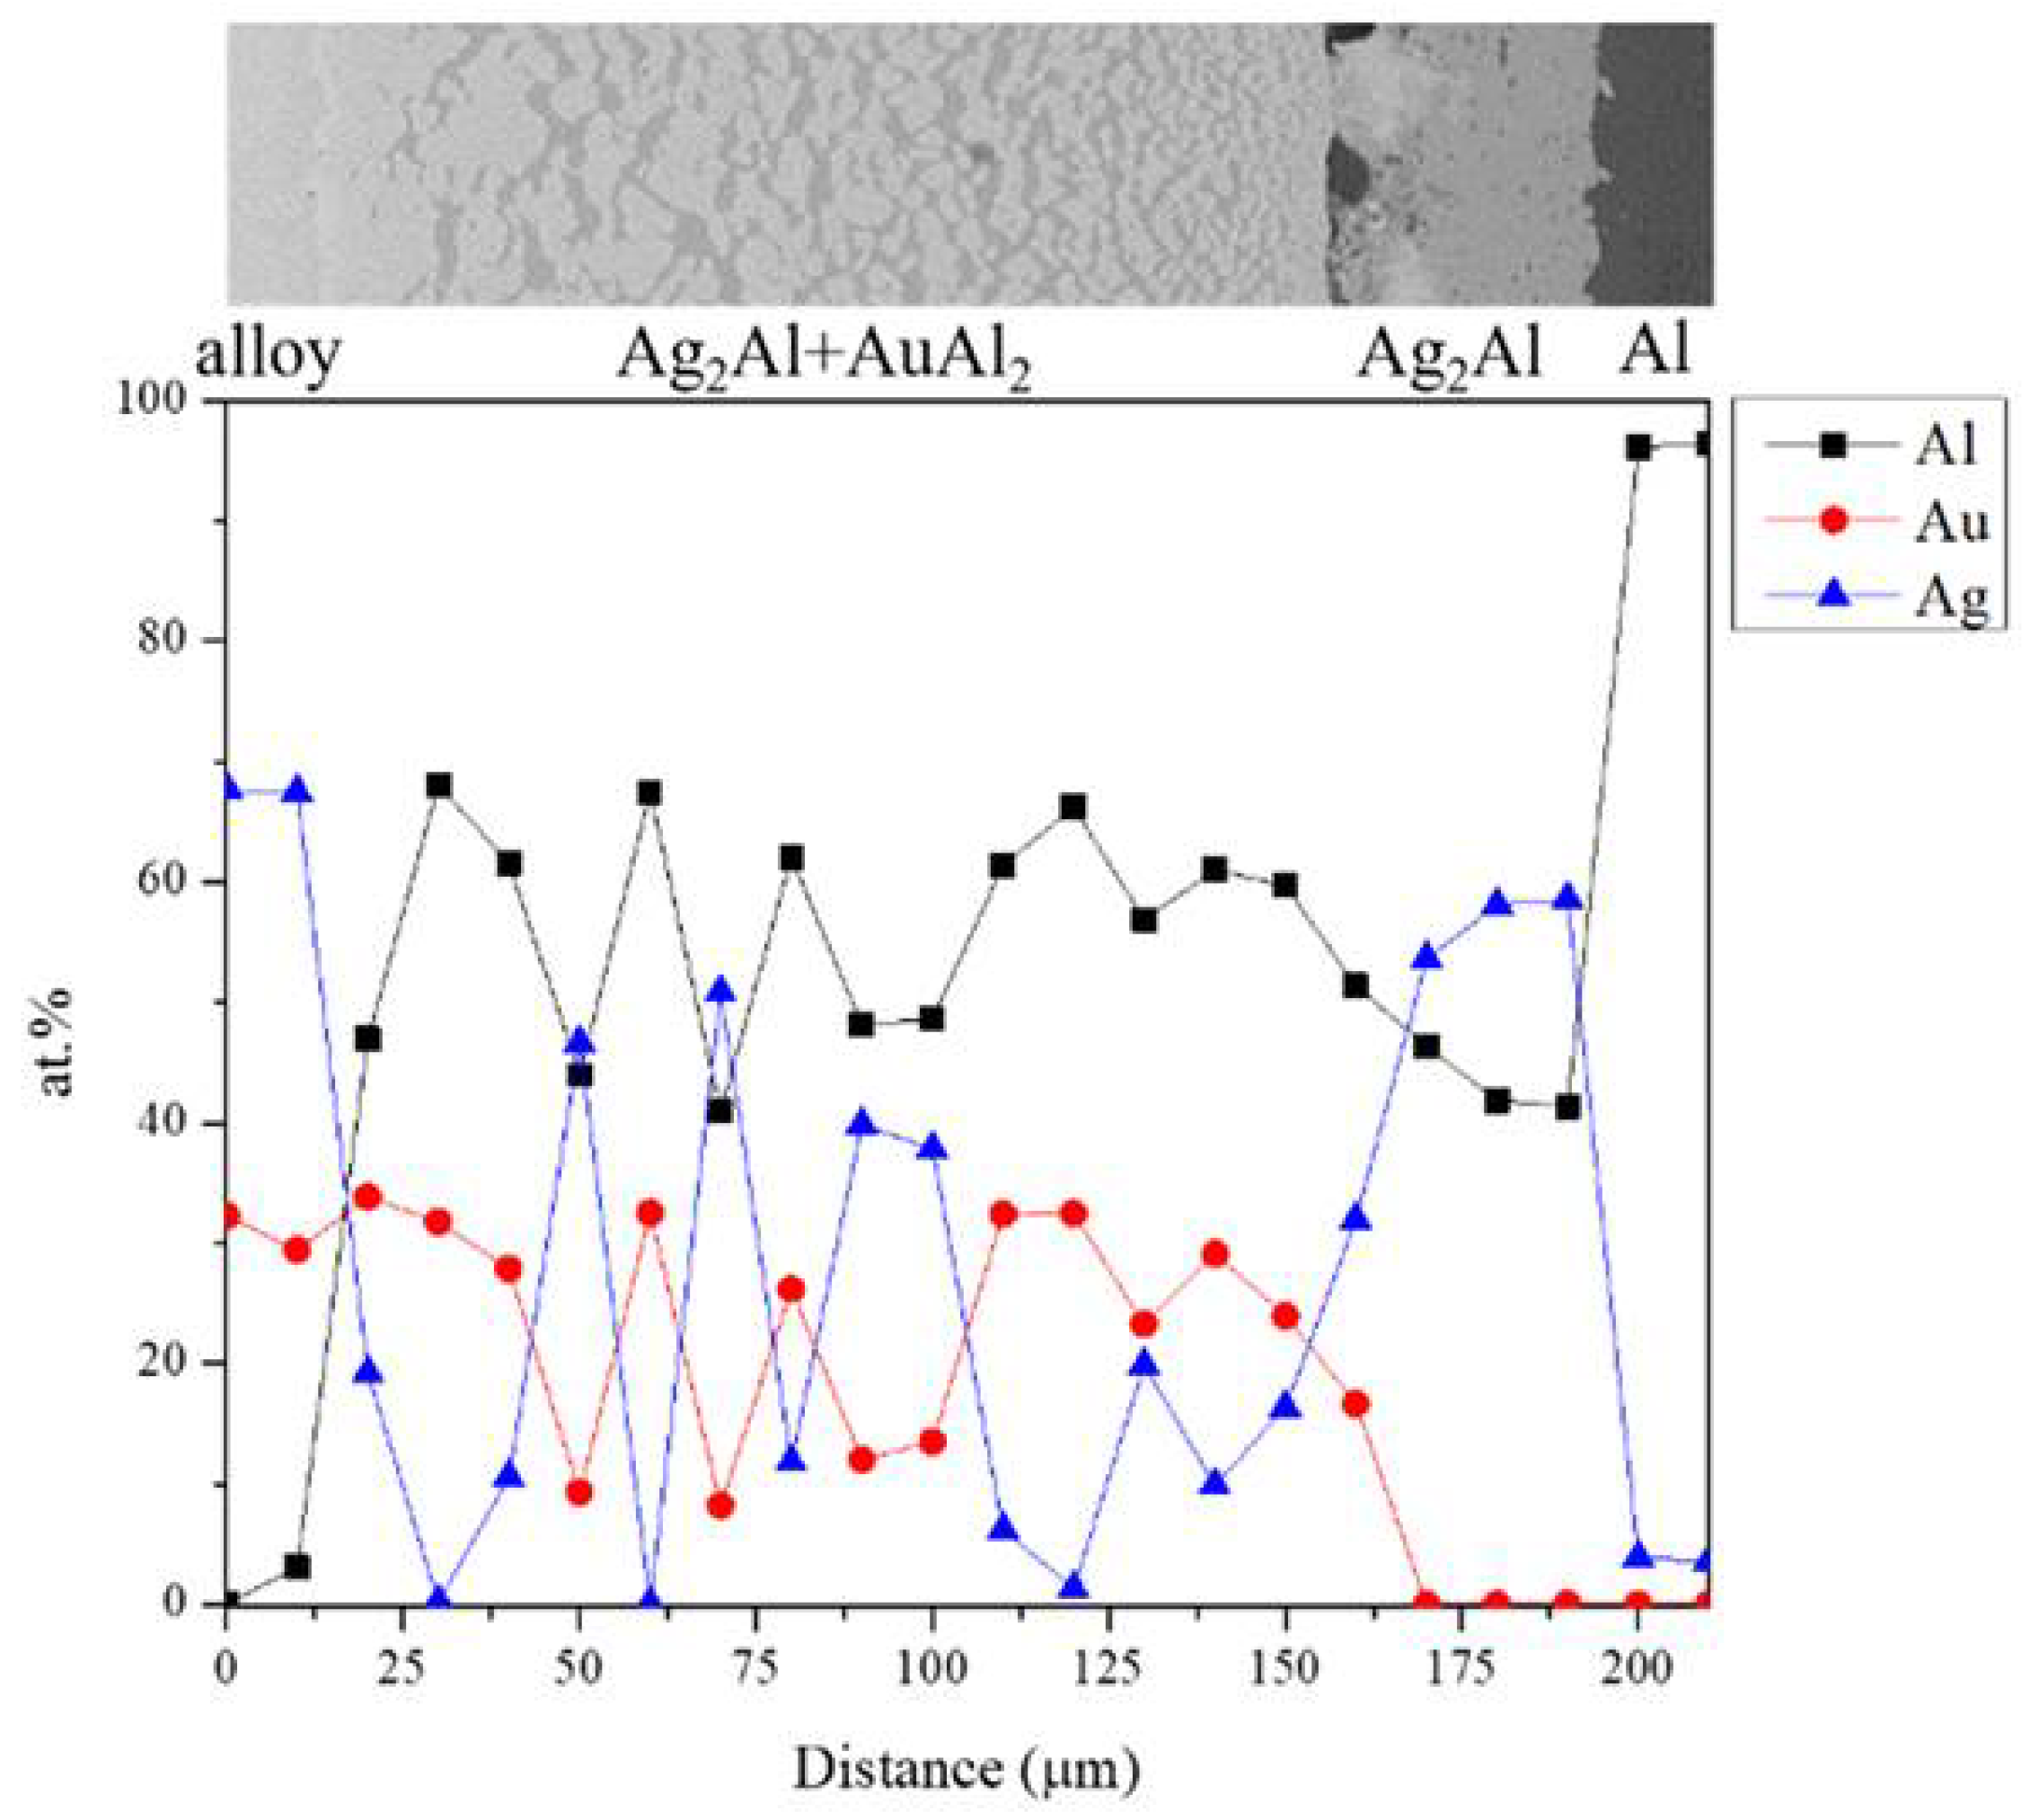
3.3. Interfacial Reactions in the Au-50Ag/Al Reaction Couple
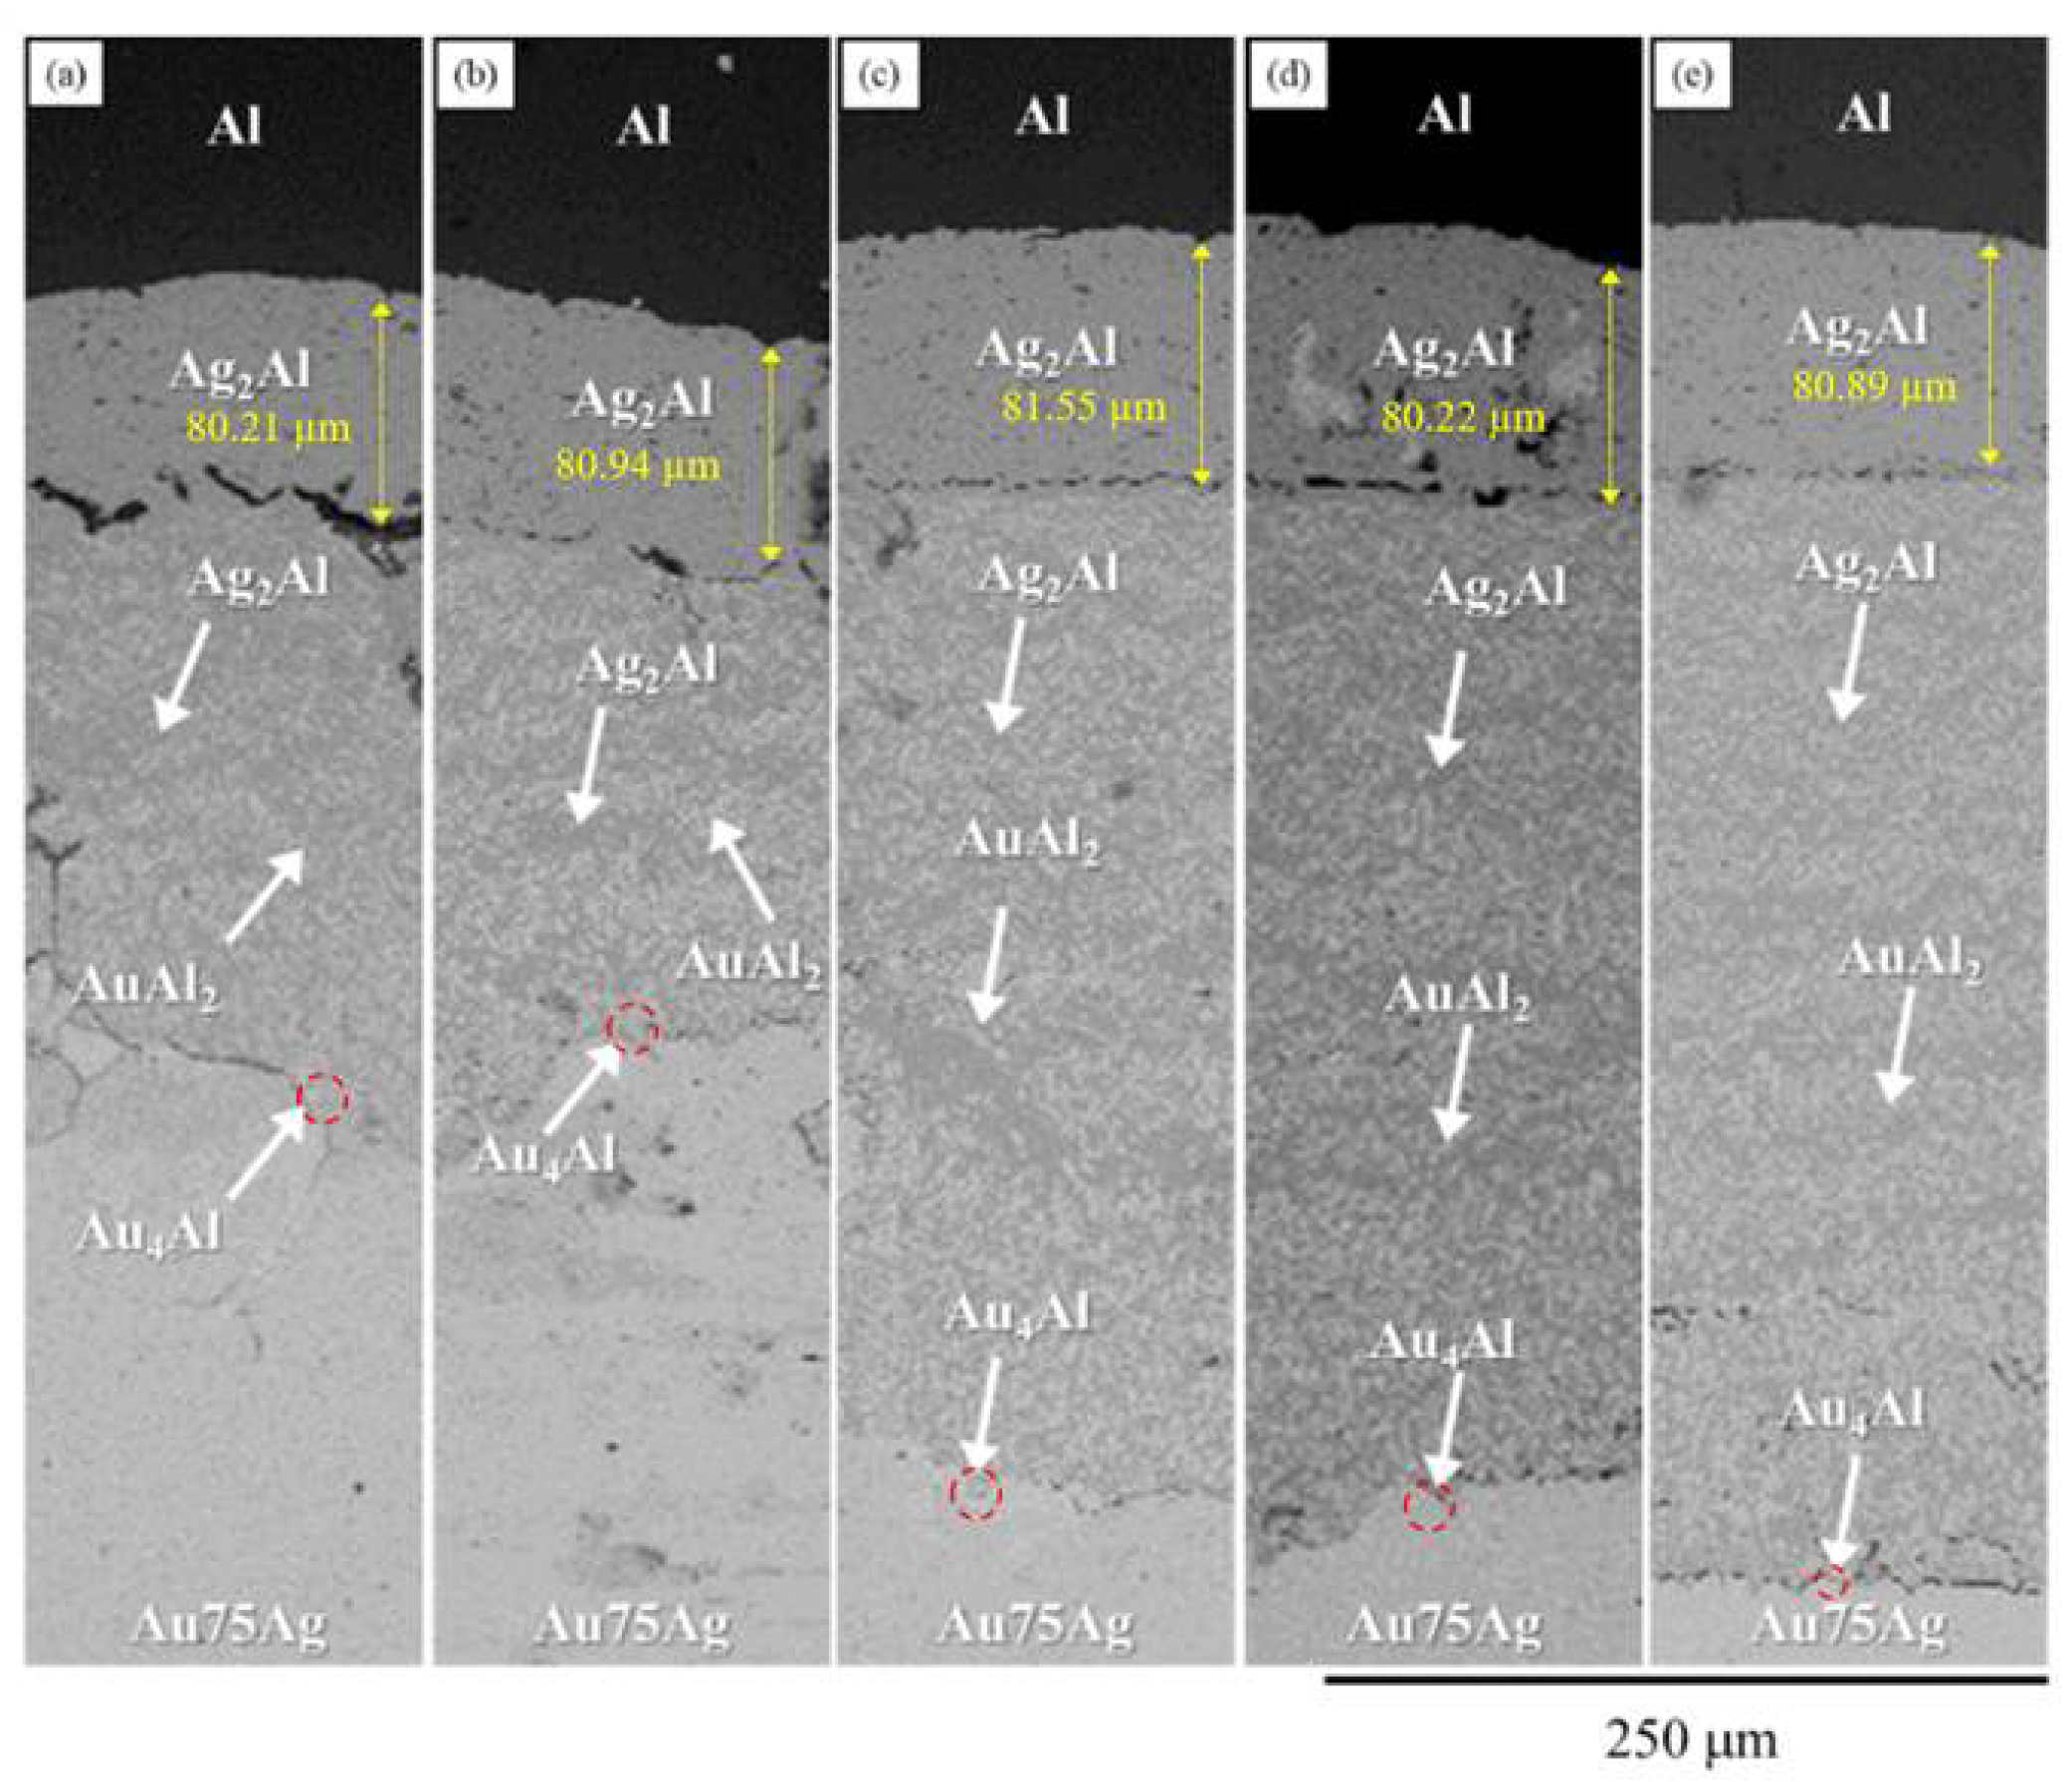
3.4. Ag Content Effect and Reaction Kinetics in the Au-xAg/Al Reaction Couples
4. Conclusions
Author Contributions
Funding
Institutional Review Board Statement
Informed Consent Statement
Data Availability Statement
Acknowledgments
Conflicts of Interest
References
- Cho, J.S.; Jeong, H.S.; Moon, J.T.; Yoo, S.J.; Seo, J.S.; Lee, S.M.; Ha, S.W.; Her, E.K.; Kang, S.H.; Oh, K.H. Thermal reliability & IMC behaviour of low cost alternative Au-Ag-Pd wire bonds to Al metallization. In Proceedings of the 2009 59th Electronic Components and Technology Conference, San Diego, CA, USA, 26–29 May 2009. [Google Scholar]
- Wang, J.; Yodo, S.; Tatsumi, H.; Nishikawa, H. Thermal conductivity and reliability reinforcement for sintered microscale Ag particle with AlN nanoparticles additive. Mater. Charact. 2023, 203, 112150. [Google Scholar] [CrossRef]
- Hsueh, H.W.; Hung, F.Y.; Lui, T.S.; Chen, L.H.; Chen, K.J. Intermetallic Phase on the Interface of Ag-Au-Pd/Al Structure. Adv. Mater. Sci. Eng. 2014, 2014, 925768. [Google Scholar] [CrossRef]
- Minho, O.; Masanori, K. Kinetics of Solid-State Reactive Diffusion between Au and Al. Mater. Trans. 2011, 52, 677–684. [Google Scholar]
- Jian, M.; Hamasha, S.; Alahmer, A.; Hamasha, M.; Wei, X.; Belhadi, M.E.A.; Hamasha, K. Analysis and Modeling of Aged SAC-Bi Solder Joints Subjected to Varying Stress Cycling Conditions. Materials 2023, 16, 750. [Google Scholar] [CrossRef] [PubMed]
- Lu, C. Review on silver wire bonding. In Proceedings of the 8th International Microsystems, Packaging, Assembly and Circuits Technology Conference (IMPACT), Taipei, Taiwan, 9 January 2014. [Google Scholar]
- Feng, C.P.; Sun, K.Y.; Ji, J.C.; Hou, L.; Cui, G.P.; Zhao, Z.G.; Lan, H.B. 3D Printable, form stable, flexible phase-change-based electronic packaging materials for thermal management. Addit. Manuf. 2023, 71, 103586. [Google Scholar] [CrossRef]
- Okamoto, H.; Massalski, T.B. The Ag-Au (Silver-Gold). Bull. Alloy Phase Diagr. 1983, 4, 30–38. [Google Scholar] [CrossRef]
- Liou, W.K.; Yen, Y.W. Phase equilibria of the Au–Sn–Zn ternary system and interfacial reactions in Sn–Zn/Au couples. Intermetallics 2008, 17, 72–78. [Google Scholar] [CrossRef]
- Yang, C.Y.; Laksono, A.D.; Yen, Y.W.; Guo, Y.Z.; Wang, C.H.; Li, J.L.; Chiang, T.Y. Investigation of phase equilibria of the Au–Ni–Sn ternary system and interfacial reactions in the Au/Sn/Ni/Cu multilayer couple. Mater. Chem. Phys. 2022, 289, 126494. [Google Scholar] [CrossRef]
- McAlister, A.J. The Ag-Al (Silver-Aluminum) system. Bull. Alloy Phase Diagr. 1987, 8, 526–533. [Google Scholar] [CrossRef]
- Okamoto, H. Phase Diagrams for Binary Alloys, 2nd ed.; ASM International, Materials Park: Novelty, OH, USA, 2000; pp. 333–391. [Google Scholar]
- Prince, A.; Raynor, G.V.; Evans, D.S. Phase Diagrams of Ternary Gold Alloys, 1st ed.; Institute of Materials: London, UK, 1990; pp. 150–170. [Google Scholar]
- Petzow, G.; Effenberg, G. Ternary Alloys, a Comprehensive Compendium of Evaluated Constitutional Data and Phase Diagrams, 1st ed.; VCH Verlagsgesellschaft mbH: Weinheim, Germany, 1988; pp. 1145–1151. [Google Scholar]
- Joint Committee on Powder Diffraction Standards (JCPDS). Powder Diffraction File™ (PDF); International Centre for Diffraction Data (ICDD): Newtown Square, PA, USA, 2003. [Google Scholar]
- Han, X.; Liu, M.; Zhou, X. Study on Structures Stability, Mechanical Properties, and Electronic Properties of Alloy Ag–Au–Al: First-Principles Calculations and Experiments. Cryst. Res. Technol. 2023. [Google Scholar] [CrossRef]
- Guo, R.; Hang, T.; Mao, D.; Li, M.; Qian, K.; Lv, Z.; Chiu, H. Behavior of intermetallics formation and evolution in Ag–8Au–3Pd alloy wire bonds. J. Alloys Compd. 2014, 588, 622–627. [Google Scholar] [CrossRef]
- Chuang, T.H.; Chang, C.C.; Chuang, C.H.; Lee, J.D.; Tsai, H.H. Formation and Growth of Intermetallics in an Annealing-Twinned Ag-8Au-3Pd Wire Bonding Package During Reliability Tests. IEEE Trans. Compon. Packag. Manuf. Technol. 2013, 3, 3–9. [Google Scholar] [CrossRef]
- Xie, S.; Lin, P.; Yao, Q. Overview of Au-Al Bond Interface. In Proceedings of the International Conference on Electronics, Circuits and Information Engineering (ECIE), Zhengzhou, China, 22–24 January 2021; pp. 250–253. [Google Scholar]
- Yang, H.; Cao, K.; Zhao, X.; Liu, W.; Lu, J.; Lu, Y. Brittle-to-ductile transition of Au2Al and AuAl2 intermetallic compounds in wire bonding. Mater. Sci. Mater. Electron. 2019, 30, 862–866. [Google Scholar] [CrossRef]
- Fu, S.W.; Lee, C.C. A study on intermetallic compound formation in Ag–Al system and evaluation of its mechanical properties by micro-indentation. J. Mater. Sci. Mater. Electron. 2017, 29, 3985–3991. [Google Scholar] [CrossRef]
- Huo, Y.; Fu, S.W.; Chen, Y.L.; Lee, C.C. A reaction study of sulfur vapor with silver and silver–indium solid solution as a tarnishing test method. J. Mater. Sci. Mater. Electron. 2016, 27, 10382–10392. [Google Scholar] [CrossRef]
- Fu, S.W.; Lee, C.C. A corrosion study of Ag–Al intermetallic compounds in chlorine-containing epoxy molding compounds. J. Mater. Sci. Mater. Electron. 2017, 28, 15739–15747. [Google Scholar] [CrossRef]
- Kumar, A.; Chen, Z. Interdependent Intermetallic Compound Growth in an Electroless Ni-P/Sn-3.5Ag Reaction Couple. J. Electron. Mater 2010, 40, 213–223. [Google Scholar] [CrossRef]
- Yin, Z.; Lin, M.; Wu, Z. Effect of doping Ni nanoparticles on microstructure evolution and shear behavior of Sn–3.0Ag–0.5Cu(SAC305)/Cu–2.0Be solder joints during reflowing. J. Mater. Sci. Mater. Electron. 2020, 31, 4905–4914. [Google Scholar] [CrossRef]


| Alloy No. | Alloy Composition (at.%) | Phase in Equilibrium | Phase Composition (at.%) | ||
|---|---|---|---|---|---|
| Ag | Al | Au | |||
| 1 | Ag-80Al-10Au | AuAl2 | 3.35 | 69.60 | 27.05 |
| Ag2Al | 57.51 | 39.57 | 2.98 | ||
| Al | 5.26 | 93.08 | 1.66 | ||
| 2 | Ag-70Al-10Au | AuAl2 | 9.84 | 66.76 | 23.44 |
| Ag2Al | 52.22 | 44.95 | 2.83 | ||
| Al | 6.67 | 90.40 | 2.93 | ||
| 3 | Ag-70Al-20Au | AuAl2 | 2.01 | 67.11 | 30.88 |
| Ag2Al | 47.73 | 46.95 | 5.32 | ||
| Al | 3.64 | 93.21 | 3.15 | ||
| 4 | Ag-60Al-10Au | AuAl2 | 13.17 | 56.81 | 30.02 |
| Ag2Al | 53.15 | 43.26 | 3.59 | ||
| Al | 6.5 | 90.83 | 2.67 | ||
| 5 | Ag-60Al-30Au | Au4Al | 51.71 | 27.12 | 21.17 |
| AuAl2 | 3.17 | 64.92 | 31.91 | ||
| 6 | Ag-50Al-40Au | AuAl | 2.33 | 44.9 | 52.77 |
| Au4Al | 34.79 | 25.25 | 39.96 | ||
| AuAl2 | 2.48 | 62.34 | 35.18 | ||
| 7 | Ag-40Al-10Au | AuAl2 | 17.32 | 59.39 | 23.29 |
| Ag2Al | 65.23 | 30.37 | 4.4 | ||
| 8 | Ag-40Al-20Au | Au4Al | 60.34 | 23.11 | 16.55 |
| AuAl2 | 10.69 | 64.72 | 24.59 | ||
| 9 | Ag-40Al-50Au | Au2Al | 6.49 | 37.69 | 55.82 |
| Au4Al | 34.79 | 25.25 | 39.96 | ||
| AuAl | 5.91 | 43.11 | 50.98 | ||
| 10 | Ag-30Al-20Au | AuAl2 | 11.37 | 60.24 | 28.39 |
| Au4Al | 60.28 | 19.61 | 20.11 | ||
| 11 | Ag-30Al-50Au | Au2Al | 8.45 | 30.10 | 61.45 |
| Au4Al | 33.16 | 24.80 | 42.04 | ||
| 12 | Ag-20Al-60Au | Au4Al | 20.01 | 20.3 | 59.69 |
| 13 | Ag-20Al-70Au | (Ag, Au) | 17.52 | 10.06 | 72.42 |
| Au4Al | 19.00 | 19.23 | 61.77 | ||
| 14 | Ag-10Al-20Au | (Ag, Au) | 75.78 | 3.89 | 20.34 |
| Au4Al | 51.73 | 19.31 | 28.97 | ||
| 15 | Ag-10Al-30Au | (Ag, Au) | 68.09 | 4.85 | 27.06 |
| Au4Al | 47.58 | 15.88 | 36.54 | ||
| 16 | Ag-10Al-40Au | (Ag, Au) | 56.51 | 6.1 | 37.39 |
| Au4Al | 33.16 | 20.71 | 46.13 | ||
| 17 | Ag-10Al-50Au | (Ag, Au) | 42.48 | 7.59 | 49.94 |
| Au4Al | 30.3 | 18.56 | 51.14 | ||
| Reaction Couple | n Value |
|---|---|
| Au-25Ag | 0.90 |
| Au-50Ag | 0.80 |
| Au-75Ag | 0.87 |
Disclaimer/Publisher’s Note: The statements, opinions and data contained in all publications are solely those of the individual author(s) and contributor(s) and not of MDPI and/or the editor(s). MDPI and/or the editor(s) disclaim responsibility for any injury to people or property resulting from any ideas, methods, instructions or products referred to in the content. |
© 2023 by the authors. Licensee MDPI, Basel, Switzerland. This article is an open access article distributed under the terms and conditions of the Creative Commons Attribution (CC BY) license (https://creativecommons.org/licenses/by/4.0/).
Share and Cite
Ramadhani, M.; Laksono, A.D.; Liang, C.-L.; Yang, C.-Y.; Chen, K.-J.; Yen, Y.-W.; Hsiao, H.-M. Phase Equilibria of the Ag-Al-Au Ternary System and Interfacial Reactions in the Au-xAg/Al Couples at 450 °C. Materials 2023, 16, 7196. https://doi.org/10.3390/ma16227196
Ramadhani M, Laksono AD, Liang C-L, Yang C-Y, Chen K-J, Yen Y-W, Hsiao H-M. Phase Equilibria of the Ag-Al-Au Ternary System and Interfacial Reactions in the Au-xAg/Al Couples at 450 °C. Materials. 2023; 16(22):7196. https://doi.org/10.3390/ma16227196
Chicago/Turabian StyleRamadhani, Mavindra, Andromeda Dwi Laksono, Chien-Lung Liang, Chiao-Yi Yang, Kuo-Jung Chen, Yee-Wen Yen, and Hsien-Ming Hsiao. 2023. "Phase Equilibria of the Ag-Al-Au Ternary System and Interfacial Reactions in the Au-xAg/Al Couples at 450 °C" Materials 16, no. 22: 7196. https://doi.org/10.3390/ma16227196