
Interpretable Machine Learning-Based Prediction Model for Concrete Cover Separation of FRP-Strengthened RC Beams

1
School of Digital Construction, Shanghai Urban Construction Vocational College, Shanghai 201415, China
2
School of Civil Engineering, Chongqing Jiaotong University, Chongqing 400074, China
3
School of Civil Engineering and Engineering Management, Guangzhou Maritime University, Guangzhou 524088, China
*
Author to whom correspondence should be addressed.
Materials 2024, 17(9), 1957; https://doi.org/10.3390/ma17091957
Submission received: 11 March 2024
/
Revised: 16 April 2024
/
Accepted: 17 April 2024
/
Published: 23 April 2024
(This article belongs to the Special Issue Repair and Strengthening of Existing Reinforced Concrete Structures (Second Volume))
Abstract
:This study focuses on the prediction of concrete cover separation (CCS) in reinforced concrete beams strengthened by fiber-reinforced polymer (FRP) in flexure. First, machine learning models were constructed based on linear regression, support vector regression, BP neural networks, decision trees, random forests, and XGBoost algorithms. Secondly, the most suitable model for predicting CCS was identified based on the evaluation metrics and compared with the codes and the researcher’s model. Finally, a parametric study based on SHapley Additive exPlanations (SHAP) was carried out, and the following conclusions were obtained: XGBoost is best-suited for the prediction of CCS and codes, and researchers’ model accuracy needs to be improved and suffers from over or conservative estimation. The contributions of the concrete to the shear force and the yield strength of the reinforcement are the most important parameters for the CCS, where the shear force at the onset of CCS is approximately proportional to the contribution of the concrete to the shear force and approximately inversely proportional to the yield strength of the reinforcement.
1. Introduction
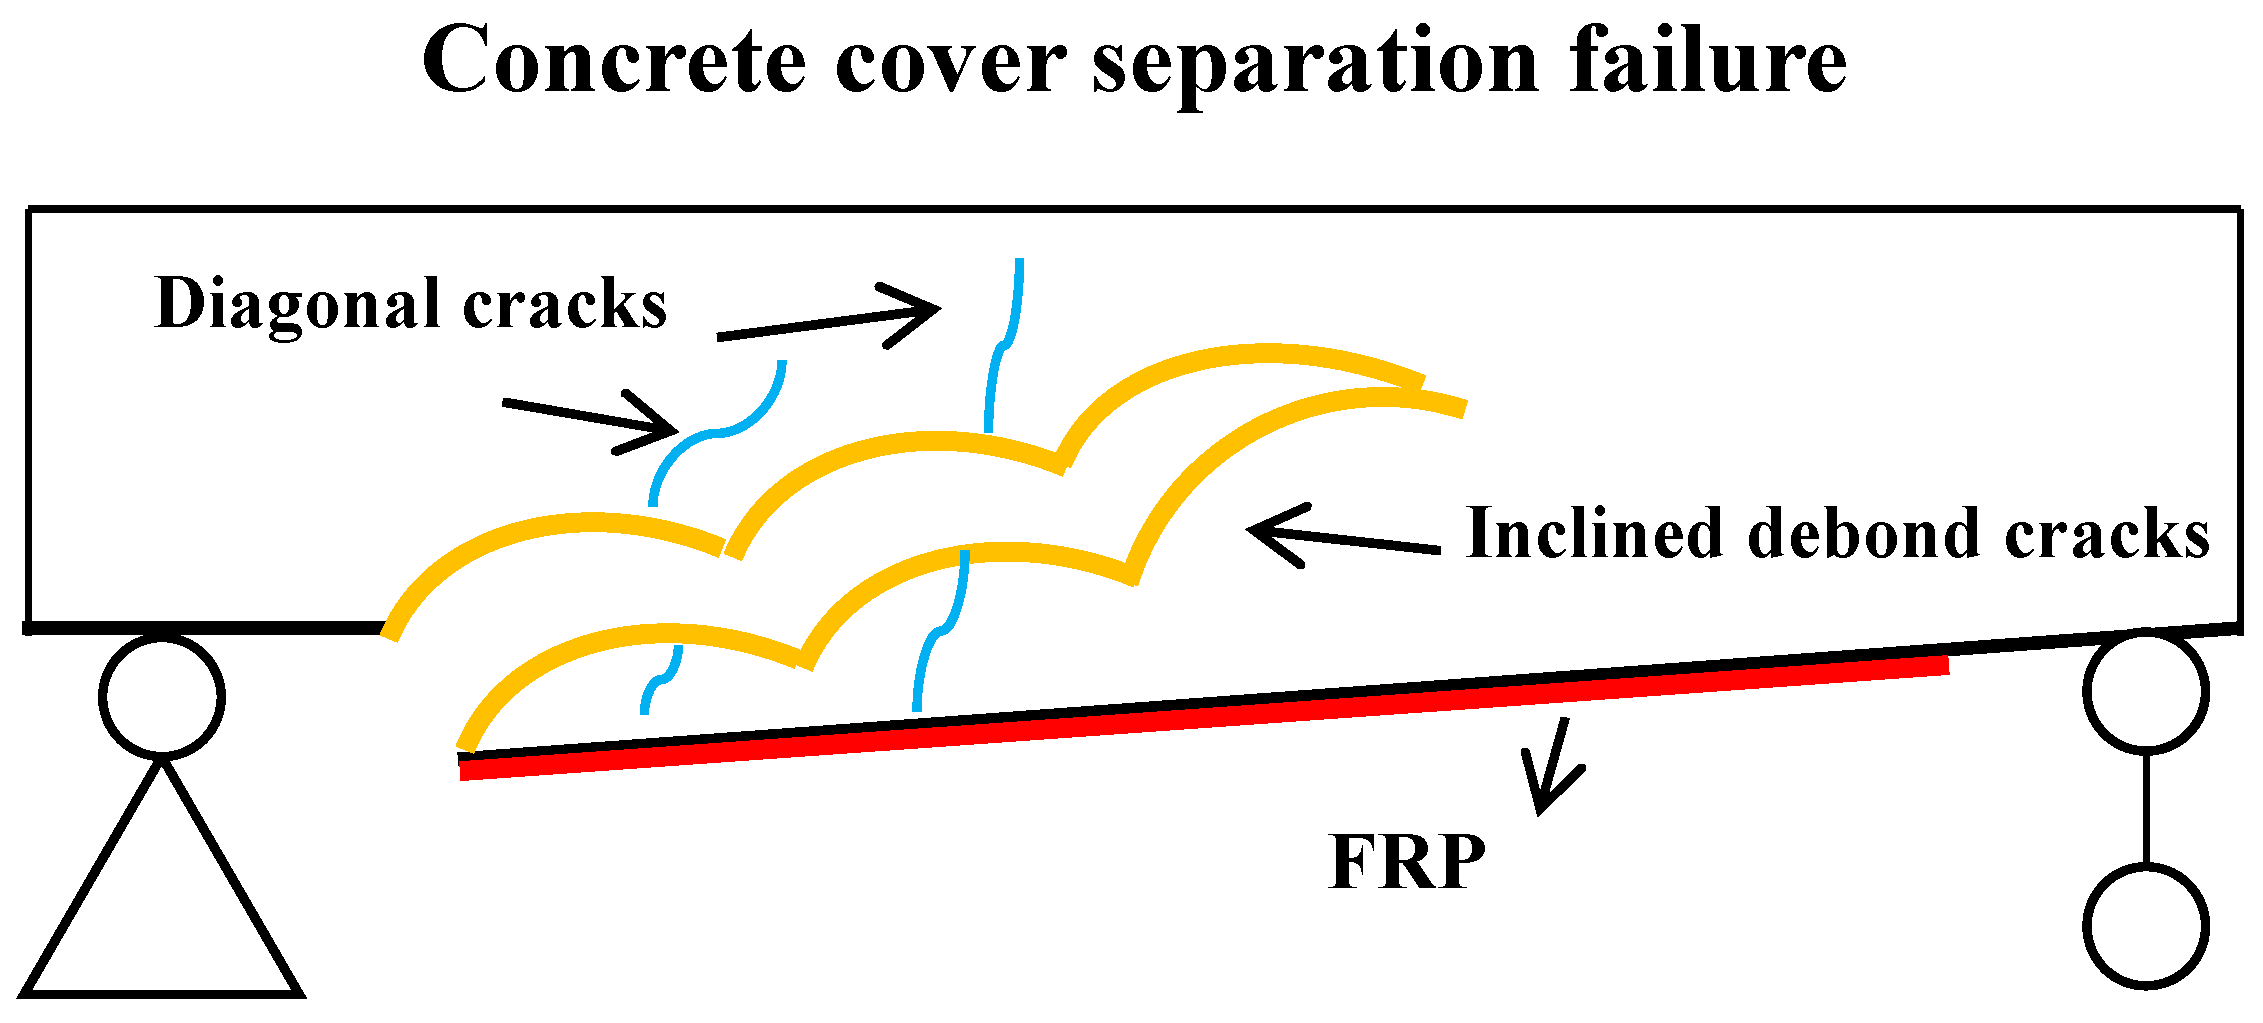
In recent years, there has been a worldwide increase in the demand for upgrading and maintaining aging concrete structures [1]. Strengthening and repairing these structures have proven to be more cost-effective, time-efficient, and resource-friendly compared to replacing them entirely. Various strengthening techniques have been developed to effectively address the need for the strengthening and rehabilitation of structures [2,3]. One particularly popular solution for externally bonded reinforcement is fiber-reinforced polymer (FRP). FRP offers exceptional material properties including high tensile strength, stiffness, corrosion resistance, durability, low weight, ease of construction, and cost-effectiveness. These remarkable properties resulted in the widespread acceptance of FRP as an effective reinforcement solution [4,5,6,7]. Despite the advantages of FRP as an externally bonded strengthening material, the bond strength between the FRP and concrete substrate presents a significant challenge. This weak link in the system often results in premature failure of the FRP before it reaches its expected service life. Experimental studies have demonstrated several failure modes of FRP-strengthened concrete beams under flexural conditions, including intermediate crack (IC) debonding, plate-end (PE) interfacial debonding, concrete cover separation (CCS), concrete crushing, and FRP rupture. These failure modes highlight the complexity of the interaction between FRP and concrete, emphasizing the need for further research and development to address the bond strength issue and optimize the performance of FRP strengthening systems [8]. Two significant failure modes observed in FRP-strengthened concrete beams are IC debonding and PE debonding, the latter of which consists of plate-end interfacial debonding and CCS (Figure 1). Both IC debonding and PE debonding are commonly observed failures in FRP-strengthened concrete beams [9]. IC debonding in FRP-strengthened concrete beams is primarily caused by the development of flexural, shear, or flexural–shear cracks in the mid-span region, which exhibit geometric discontinuity. These cracks typically initiate at the point of higher bending moment (mid-span) and propagate toward the ends of the FRP plate, following the direction of decreasing bending moment. This behavior is commonly observed during IC debonding failure [10,11]. PE debonding is more likely to occur in FRP-strengthened concrete beams with a small shear span and where the mechanical behavior of the beam is primarily governed by shear forces instead of bending moments. In such cases, the small bending moments within the beam lead to a concentration of shear forces near the plate ends. This concentration of shear forces increases the likelihood of interfacial debonding between the FRP plate and the concrete, as well as the possibility of CCS [12]. This type of failure can manifest itself in two forms: CCS occurring at the height of the tensile reinforcement or plate-end interfacial debonding between the FRP plate and the concrete. In CCS, the concrete cover separates from the main body of the beam, while in plate-end interfacial debonding, the bond between the FRP plate and the concrete weakens or breaks. Among the two forms mentioned, CCS is generally observed to be more common than plate-end interfacial debonding [13,14]. CCS failure in FRP-strengthened concrete beams can be influenced by various factors such as concrete strength, concrete protective layer thickness, reinforcement ratio, FRP size, and modulus of elasticity [15,16,17]. When the FRP plate is positioned close to the support, CCS typically occurs after the development of shear cracks [18]. The loading process amplifies these shear cracks, thereby augmenting the interfacial shear stress. In addition, shear cracks often coincide with a relative vertical displacement between the two fractured surfaces. This displacement results in an increase in the transverse positive tensile stress within the concrete layer situated between the FRP and the tensile reinforcement. The combination of increased positive tensile stresses and interfacial stresses ultimately induces horizontal cracking and CCS at the precise horizontal location of the tensile reinforcement and concrete cover. When the plates are positioned away from the support in beams, CCS failure occurs following the development of diagonal cracks. These cracks initiate at the end of the plate and propagate toward the interior of the beam until they reach the location of the tensile reinforcement. Once they reach the horizontal position of the reinforcement, the cracks propagate horizontally, eventually leading to CCS failure [18,19].
Researchers and codes such as AS, ACI, TR55, and fib have proposed predictive models to estimate the failure loads of CCS [20,21,22,23,24,25]. These models are based on limited experimental data, and their accuracy remains to be verified. Al-Ghrery et al. developed a gene expression programming model for CCS prediction based on the constructed database. Compared with other models, it has higher goodness-of-fit and lower mean absolute error, but the accuracy and interpretability of the model need to be improved [26]. Based on this, a model with high accuracy and interpretability is still to be established.
This study attempts to construct the CCS prediction model based on interpretable machine learning [27,28]. Models including linear regression, support vector machine, BP neural network, decision tree, random forest, and XGBoost are constructed and compared with the models of codes and researchers, and finally the optimal model obtained is analyzed for interpretability using SHapley additive exPlanations (SHAP).
2. Workflow
This paper consists of the following four main sections:
Dataset construction: A total of 127 data sets were collected. The following parameters were included: beam effective depth (ds), beam width (b), concrete strength (f′c), area of the longitudinal reinforcement (Ast), yield strength of the reinforcement (fsy), cross-sectional area of the FRP (Af), Young’s modulus of FRP (Ef), ratio of the design moment to the design shear at the end of the FRP (M*/V*), contribution of the hoop reinforcement to the shear force (Vus), and contribution of the concrete to the shear force (Vuc). The output parameter is the shear force at the end of the FRP (V*) when CCS failure occurs.
Machine learning model construction: Prediction of concrete cover separation using six machine learning methods: linear regression, support vector machine, BP neural network, decision tree, random forest, and XGBoost.
Model evaluation: Evaluation of machine learning and existing models based on goodness of fit, root mean square error, and coefficient of variation.
Model explainability: Parameter importance and sensitivity analysis using SHapley additive exPlanations.
3. Dataset Construction
3.1. Parameter Selection Criteria
The performance of machine learning models is strongly influenced by the quality of the dataset, and this study constructs the dataset based on the following criteria:
- (1)
- The failure mode of all beams is CCS, and there are no other modes.
- (2)
- The geometrical characteristics and parameters of the beams are described in detail.
- (3)
- The FRP sheets were not pre-stressed.
3.2. Inputs and Outputs
After researching the literature and data selection criteria based on Section 3.1, as shown in Table 1, a total of 127 experimental data sets from 36 researchers were collected for this study [8,12,14,29,30,31,32,33,34,35,36,37,38,39,40,41,42,43,44,45,46,47,48,49,50,51,52,53,54,55,56,57,58,59,60,61]. Detailed information on the parameters can be found in [26]. There are ten input parameters, which are beam effective depth (ds), beam width (b), concrete strength (f′c), area of the longitudinal reinforcement (Ast), yield strength of the reinforcement (fsy), cross-sectional area of the FRP (Af), Young’s modulus of FRP (Ef), ratio of the design moment to the design shear at the end of the FRP (M*/V*), contribution of the hoop reinforcement to the shear force (Vus), and contribution of the concrete to the shear force (Vuc). The output parameter is the shear force at the end of the FRP (V*) when CCS failure occurs.
3.3. Description of the Dataset
In general, the performance of machine learning models is good when the distribution of the parameters in the dataset does not differ much from each other at intervals and the correlation between the parameters is weak, so the distribution and correlation of the parameters were investigated in this part. The distribution of the parameters is shown in Table 2, and the correlation heat map of the parameters is shown in Figure 2.
As can be seen from Table 2, the distributions of Ast, Af, M*/V*, Vus, and Vuc are more concentrated, while the distributions of the other parameters are more discrete. From Figure 2, it can be seen that the correlation between most of the indicators is weak, except that there is a large correlation between A1 and A9 and A10. Therefore, the exclusion of A1 (ds) is taken into account in the modeling.
4. Machine Learning Models
4.1. Linear Regression
Linear regression (LR) modeling is a type of statistical model used to establish a linear relationship between variables [62]. It analyzes data by predicting the relationship between a dependent variable and one or more independent variables. Based on the method of least squares, the model parameters are estimated to minimize the difference between the predicted values and the actual observed values. The formula is as follows:
where y is the predicted value, β0 is the intercept, β1 through βk are the coefficients of the independent variables, and ε is the error term.
4.2. Support Vector Regression
Support vector regression (SVR) is a machine learning method for establishing the relationship between input variables and output variables [63]. The core idea of SVR is to find an optimal hyperplane in a high-dimensional space by using the principle of support vector machine (SVM), such that the interval between the training data points and this hyperplane is maximized. Unlike classification problems, the goal of SVR is to fit the training data as closely as possible given a certain tolerance and to minimize the error between the predicted results and the true values.
4.3. Backpropagation Neural Network
The backpropagation (BP) neural network model is an artificial neural network used to simulate the signaling process between neurons in the human brain. It consists of an input layer, a hidden layer, and an output layer, each of which contains multiple neurons, and the connections between neurons have weights that can be adjusted through learning [64]. The BP neural network trains the model by means of the backpropagation algorithm, which gradually reduces the error and improves the accuracy of the model by calculating the error between the output of the model and the actual output and propagating this error backward along the network in order to adjust the weights between the layers.
4.4. Decision Tree
Decision tree (DT) regression modeling is a machine learning method for establishing relationships between input variables and output variables [65]. Unlike decision trees in classification problems, decision tree regression models aim to predict continuous output variables rather than discrete labels. The model represents the relationship between data features and target variables by constructing a tree-like structure. Each node represents a feature; each branch represents a range of values for that feature, and the leaf nodes represent the predicted output values. The process of building a decision tree works by recursively partitioning the data set into subsets until a certain stopping condition is reached. One of the advantages of decision tree regression models is that they are easy to understand and interpret, as they generate models that can be visually represented as a series of simple rules.
4.5. Random Forest
Random forest (RF) regression modeling is an integrated learning approach to regression tasks based on an ensemble of decision trees. It improves the accuracy and stability of the model by constructing multiple decision trees and averaging or voting their outputs [66]. Random forests use data and feature randomization to create multiple decision trees, and by combining the outputs of multiple decision trees, random forests can better handle complex data relationships, reduce overfitting, and perform better with noisy data.
4.6. XGBoost
XGBoost (eXtreme gradient boosting) is a very popular machine learning algorithm for regression and classification tasks [67]. XGBoost is based on the gradient-boosting framework but uses a number of engineering optimizations to improve performance and accuracy. It is a decision tree-based model that predicts the values of continuous-type target variables by combining multiple decision trees. It does this by iteratively training weak classifiers (usually decision trees) and then adjusting subsequent classifiers based on the performance of previous classifiers to minimize the loss function. In this way, XGBoost is able to accumulate the predictive power of multiple models in an integrated model, thereby improving overall accuracy.
4.7. Shapley Additive Explanation
Shapley additive explanation (SHAP) is one of the most popular model-agnostic methods available for enhancing the explainability of machine learning models [68]. Grounded in cooperative game theory, SHAP assigns feature importance using Shapley values. The Shapley value for a feature is computed as the weighted sum of its marginal contributions across all possible feature subsets as shown in the equation below:
where is a feature subset, is the feature vector, and is the number of features. represents the prediction for feature values in set marginalized over features not included in set :
Averaging the absolute Shapley values across various instances, as illustrated in equation below, yields a more dependable measure of feature importance (). This approach offers a thorough assessment of each feature’s impact on the model’s predictions, emphasizing features with higher absolute Shapley values as more impactful in the prediction process.
5. Results and Discussion
5.1. Machine Learning Model Construction
The six algorithms presented in Section 3 were used to construct the machine learning model. The data collected in Section 2 were used, of which 80% were used as the training set and 20% as the test set, and the hyperparameters of each model were determined by grid search and five-fold cross-validation.
5.2. Performance Criteria
The performance of the model was evaluated using the distribution of deviations between the predicted and true values, the goodness of fit (R2), and the root mean square error (RMSE), and the expressions for R2 and RMSE are as follows:
5.3. Machine Learning Model Evaluation
The distribution of deviations between the predicted and true values of the six machine learning models are shown in Figure 4.
As can be seen from Figure 4, all machine learning models show better robustness, and their deviation distributions on both the training and test sets are approximately normally distributed. Among them, the bias distributions of DT and XGBoost are better than the other models. The above study shows the performance of each model in terms of deviation distribution. Considering that the deviation can only reflect the accuracy of the model to a certain extent, in order to further measure the performance of the model, Figure 5 further depicts the deviation, R2, and RMSE of each machine learning model on the training and test sets using Taylor diagrams.
As can be seen from Figure 5, XGBoost has the highest R2 and the lowest RMSE on both the training and test sets. LR, SVR, and RF have better performance on the training set, but perform poorly on the test set, and the generalization ability needs to be improved.
5.4. Existing Model Evaluation
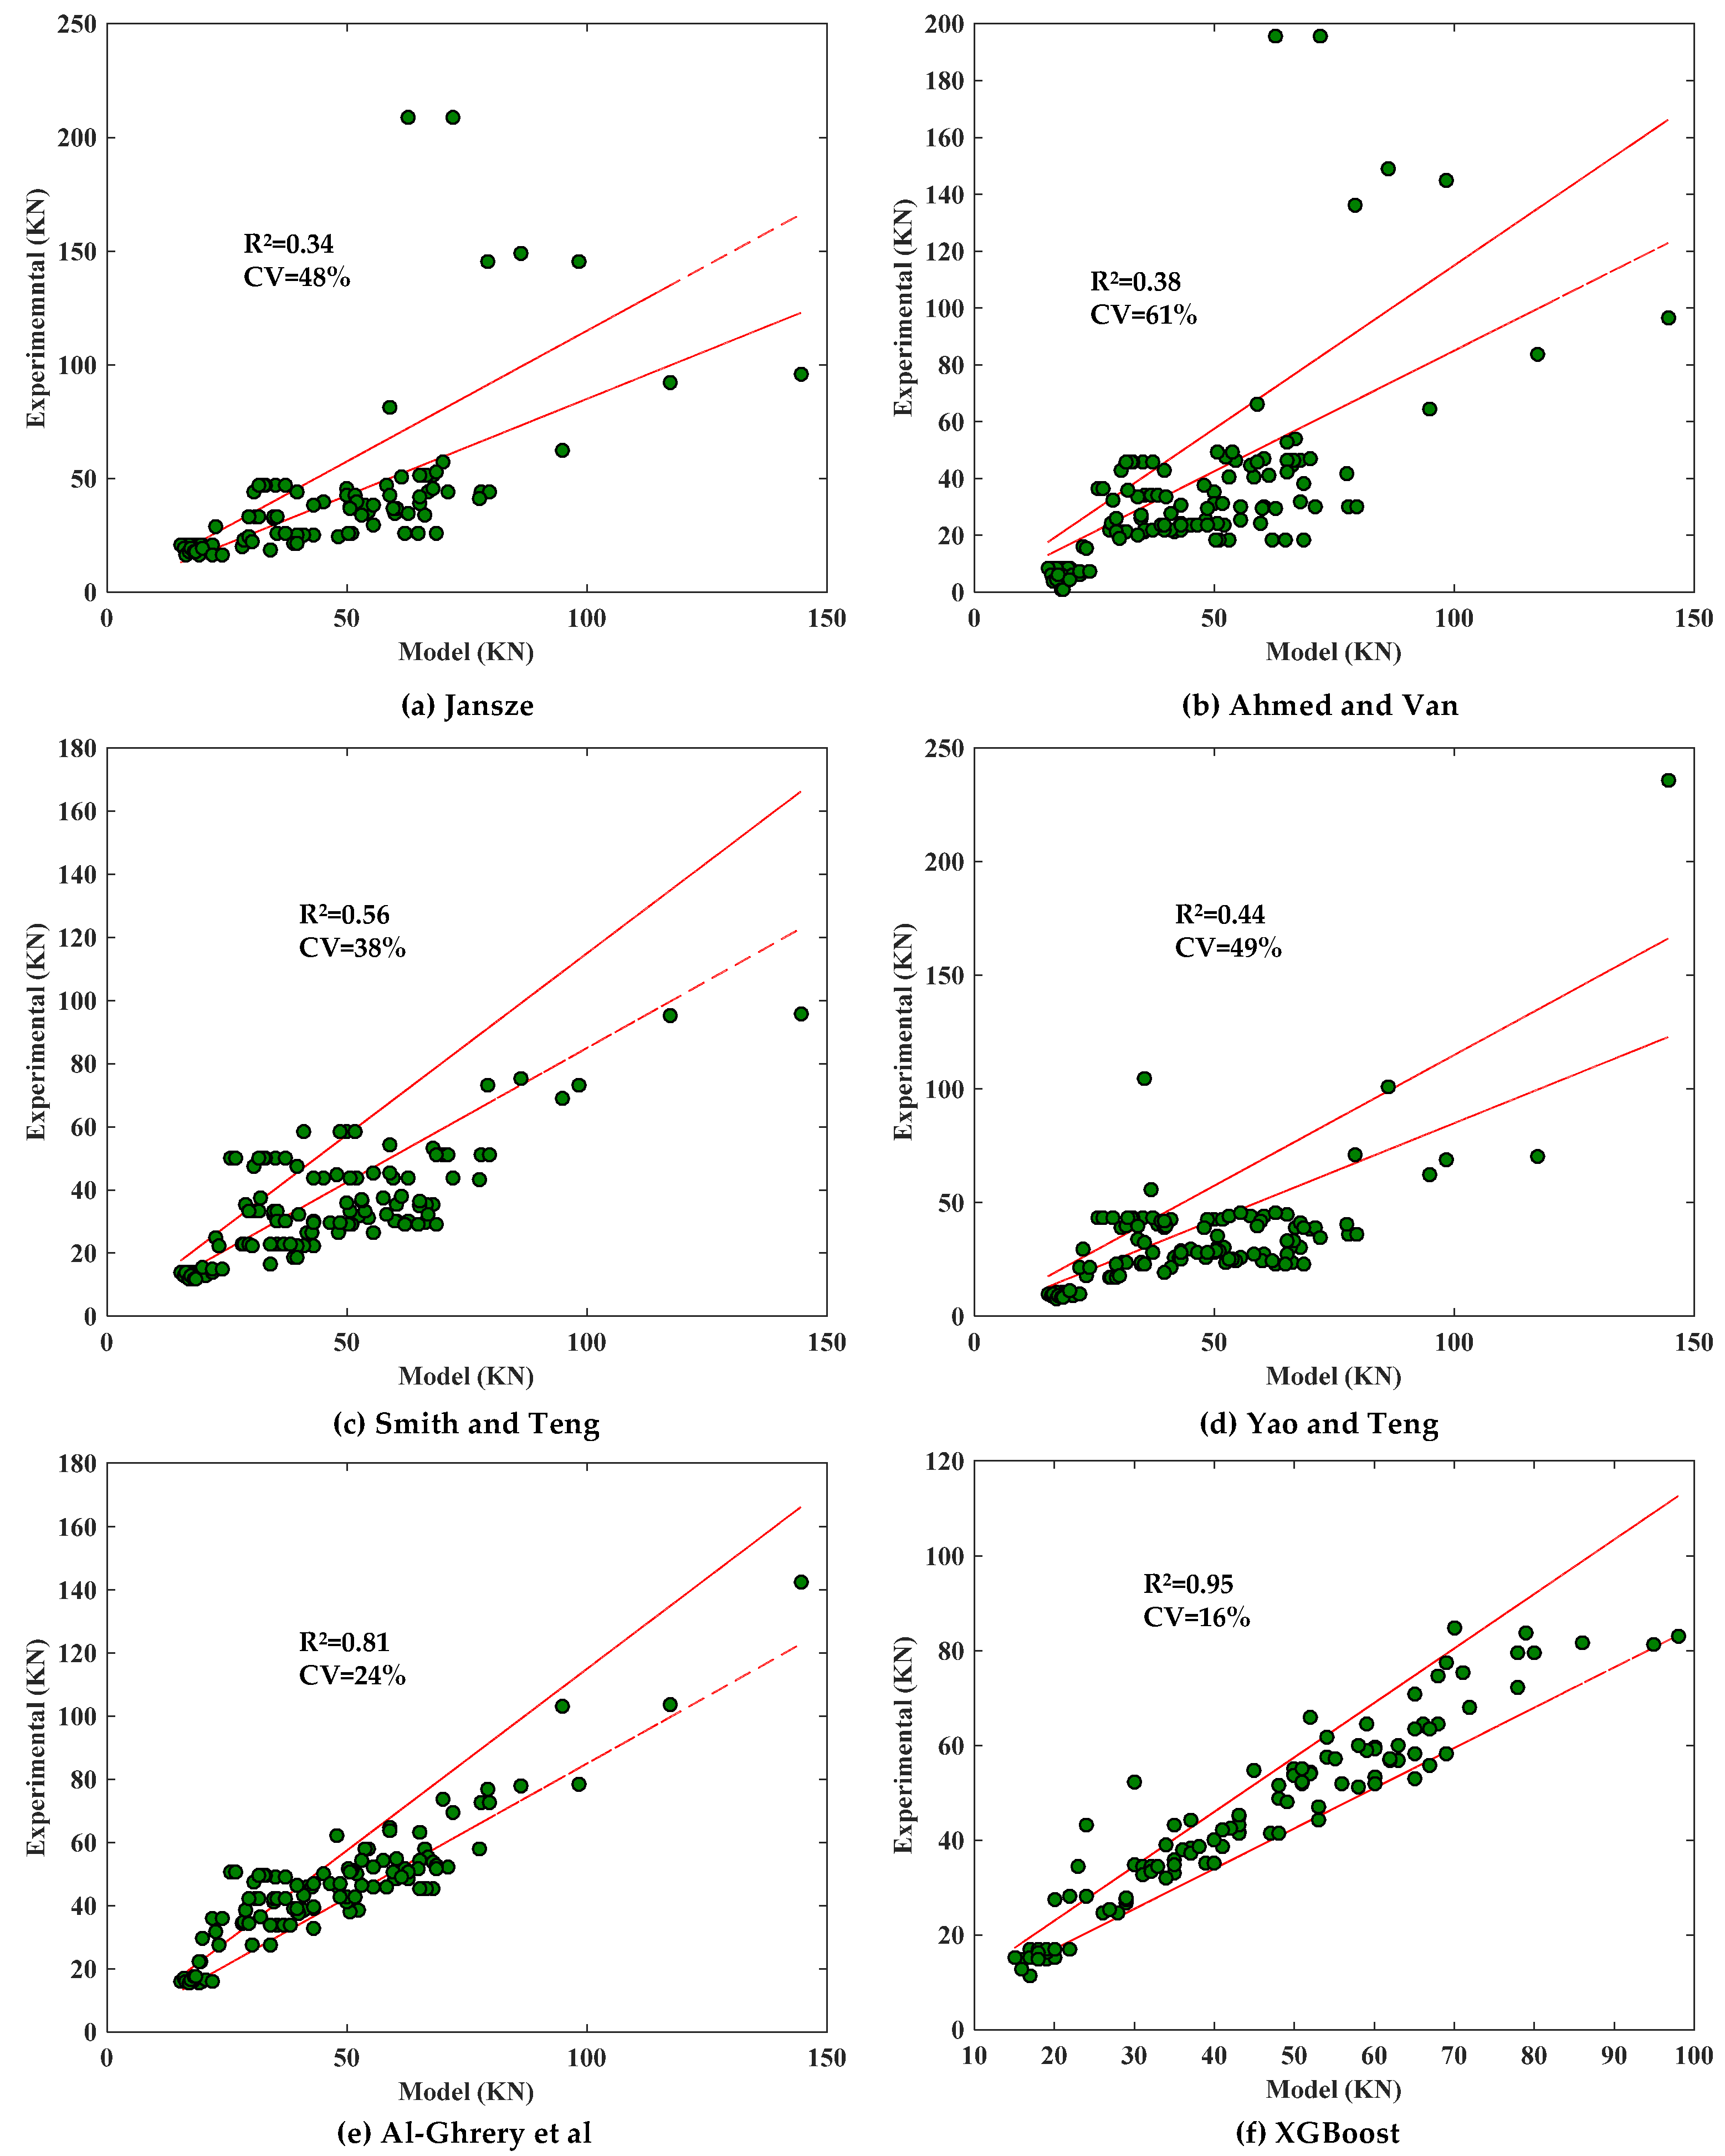
The existing models for predicting CCS were analyzed using the database created in Section 2. The models were evaluated using the R2 and the coefficient of variation (CV), and the relationship between the calculated and experimental values of the code-suggested models is shown in Figure 6, and the relationship between the calculated and experimental values of the researcher-suggested models is shown in Figure 7.
As can be seen from Figure 6, the model proposed by ACI performs well, but both it and the model of fib are conservative; in addition, the models proposed by TR55 and AS overestimate the shear force at the end of the FRP sheet when CCS occurs. As can be seen from Figure 7, the XGBoost model developed in this paper has the highest R2 (0.95) and the lowest CV (16%), which is better than the models proposed by the researchers and codes in Figure 6 and Figure 7.
6. Parametric Study
As can be seen in Section 4.3, XGBoost performs best for all the machine learning models. It is therefore used for parametric studies. Two methods were used, one based on the importance ranking of the parameters themselves during the model training process, and one based on the model interpretable analysis of SHapley additive exPlanations (SHAP). The former is shown in Figure 8, and the latter is shown in Figure 9.
As can be seen from Figure 8 and Figure 9, there is a large difference between the XGBoost-based parameter importance ranking and the SHAP-based results. However, they both consider that f′c and Vus have a large effect on V*, and Ast and b have a smaller effect on V*. The sensitivities between each parameter and V* are also shown in SHAP, which is shown in Figure 10.
Figure 10 shows the relationship between the four main parameters and V*. It can be seen that when Vuc is small (<15), Vuc and V* have an approximately linear relationship, but as Vuc increases, it does not cause a significant change in V*. There is an inverse relationship between V* and fsv, but the trend is not significant. In addition, when f′c is small (<50 MPa), the relationship between V* and f′c is not obvious, and when f′c is large, as f′c increases, V* decreases. There is no obvious relationship between Vus and V*.
7. Conclusions
In this study, a prediction model for the concrete cover separation in FRP flexure-strengthened RC beams based on machine learning was evaluated against the codes and the researcher’s model. Finally, a parametric study based on SHAP was carried out. The following conclusions were obtained:
- (1)
- Of all the machine learning models, XGBoost is the best at predicting CCS, with a better distribution of deviations on both the training and test sets. In addition, the XGBoost model also has the maximum goodness-of-fit, the minimum standard deviation, and the minimum root mean square error on both the training and test sets.
- (2)
- The models proposed by AS and TR55 overestimated the shear force during CCS, while the models of ACI, fib, and most researchers are conservative. In addition, the R2 and CV of these models are not satisfactory. Compared to the above models, XGBoost has a higher R2 (0.95) and a lower CV (16%).
- (3)
- The parameters that have a greater influence on V* are the contribution of the concrete to the shear force, the yield strength of the reinforcement, the concrete strength, and the contribution of the hoop reinforcement where V* is approximately proportional to the contribution of the concrete to the shear force and approximately inversely proportional to the yield strength of the reinforcement and the concrete strength.
- (4)
- In this study, the parameters affecting CCS failure were statistically analyzed based on SHAP. However, mechanism-based analyses are scarce and further research is needed in the future.
Author Contributions
Conceptualization, methodology, software, validation, writing—original draft, and writing, S.Z.; supervision, funding acquisition, and writing, T.H.; supervision, funding acquisition, and writing, Y.Y. All authors have read and agreed to the published version of the manuscript.
Funding
This research received no external funding.
Institutional Review Board Statement
Not applicable.
Informed Consent Statement
Informed consent was obtained from all subjects involved in the study.
Data Availability Statement
The raw data supporting the conclusions of this article will be made available by the authors on request.
Conflicts of Interest
The authors declare no conflicts of interest.
References
- del Rey Castillo, E.; Kanitkar, R.; Smith, S.T.; Griffith, M.C.; Ingham, J.M. Design approach for FRP spike anchors in FRP-strengthened RC structures. Compos. Struct. 2019, 214, 23–33. [Google Scholar] [CrossRef]
- Singh, A.; del Rey Castillo, E.; Ingham, J. FRP-to-FRP bond characterization and force-based bond length model. Compos. Struct. 2018, 210, 724–734. [Google Scholar] [CrossRef]
- Fathalla, E.; Rajapakse, R.; Mihaylov, B.I. Modeling the shear behavior of deep beams strengthened with FRP sheets. Eng. Struct. 2022, 260, 114232. [Google Scholar] [CrossRef]
- Raza, A.; Khan, Q.U.Z.; Ahmad, A. Prediction of Axial Compressive Strength for FRP-Confined Concrete Compression Members. KSCE J. Civ. Eng. 2020, 24, 2099–2109. [Google Scholar] [CrossRef]
- Kang, S.M.; Kim, J.K. Prediction of the Moment Capacity of FRP-Strengthened RC Beams Exposed to Fire Using ANNs. KSCE J. Civ. Eng. 2023, 27, 3471–3483. [Google Scholar] [CrossRef]
- Omar, Z.; Sugiman, S.; Mansor, H.; Ahmad, H. Utilizing XFEM model to predict the flexural strength of woven fabric Kenaf FRP plate strengthened on plain concrete beam. Case Stud. Constr. Mater. 2023, 18, e02056. [Google Scholar] [CrossRef]
- Shabani, E.; Mostofinejad, D.; Saljoughian, A. Bond behavior of prestressed FRP sheet-concrete joints: Comparison of EBROG and EBR methods. Constr. Build. Mater. 2023, 400, 132752. [Google Scholar] [CrossRef]
- Pham, H.B.; Al-Mahaidi, R. Prediction Models for Debonding Failure Loads of Carbon Fiber Reinforced Polymer Retrofitted Reinforced Concrete Beams. J. Compos. Constr. 2006, 10, 48–59. [Google Scholar] [CrossRef]
- Al-Saawani, M.A.; El-Sayed, A.K.; Al-Negheimish, A.I. Assessment of plate-end debonding design provisions for RC beams strengthened with FRP. Lat. Am. J. Solids Struct. 2020, 17, e255. [Google Scholar] [CrossRef]
- Pham, H.; Al-Mahaidi, R. Experimental investigation into flexural retrofitting of reinforced concrete bridge beams using FRP composites. Compos. Struct. 2004, 66, 617–625. [Google Scholar] [CrossRef]
- Li, G.; Hu, T.; Shao, Y.; Bai, D. Data-driven model for predicting intermediate crack induced debonding of FRP-strengthened RC beams in flexure. Structures 2022, 41, 1178–1189. [Google Scholar] [CrossRef]
- Smith, S.T.; Teng, J.G. Shear-Bending Interaction in Debonding Failures of FRP-Plated RC Beams. Adv. Struct. Eng. 2003, 6, 183–199. [Google Scholar] [CrossRef]
- Teng, J.; Yao, J. Plate end debonding in FRP-plated RC beams—II: Strength model. Eng. Struct. 2007, 29, 2472–2486. [Google Scholar] [CrossRef]
- Jian, Y.; Teng, G. Plate end debonding in FRP-plated RC beams—I: Experiments. Eng. Struct. 2007, 29, 2457–2471. [Google Scholar]
- Oehlers, D.J. Reinforced Concrete Beams with Plates Glued to their Soffits. J. Struct. Eng. 1992, 118, 2023–2038. [Google Scholar] [CrossRef]
- Smith, S.; Teng, J. FRP-strengthened RC beams. II: Assessment of debonding strength models. Eng. Struct. 2001, 24, 397–417. [Google Scholar] [CrossRef]
- Zhang, S.S.; Teng, J.G. End cover separation in RC beams strengthened in flexure with bonded FRP reinforcement: Simplified finite element approach. Mater. Struct. 2015, 49, 2223–2236. [Google Scholar] [CrossRef]
- Achintha, M.; Burgoyne, C. Fracture mechanics of plate debonding: Validation against experiment. Constr. Build. Mater. 2011, 25, 2961–2971. [Google Scholar] [CrossRef]
- Achintha, P.M.M.; Burgoyne, C.J. Fracture mechanics of plate debonding. J. Compos. Constr. 2008, 12, 396–404. [Google Scholar] [CrossRef]
- AS 5100.8:2017; Rehabilitation and Strengthening of Existing Bridges. Australian Standard: Sydney, Australia, 2017.
- ACI Committee 440. Guide for the Design and Construction of Externally Bonded FRP Systems for Strengthening Concrete Structures; American Concrete Institute: Farmington Hills, MI, USA, 2017. [Google Scholar]
- Clarke, J. Design guidance for strengthening concrete structures using fibre composite materials. Concrete 2012, 8, 46. [Google Scholar]
- Matthys, S.; Fib Working Group. Externally Applied FRP Reinforcement for Concrete Structures; International Federation for Structural Concrete: Lausanne, Switzerland, 2019; Volume 90. [Google Scholar]
- Jansze, W. Strengthening of RC Members in Bending by Externally Bonded Steel Plates. Ph.D. Thesis, Delft University of Technology, Delft, The Netherlands, 1997. [Google Scholar]
- Ahmed, O.; Van Gemert, D. Effect of longitudinal carbon fiber reinforced plastic laminates on shear capacity of reinforced concrete beams. In Proceedings of the SP-188: 4th Intl Symposium—Fiber Reinforced Polymer Reinforcement for Reinforced Concrete Structures, Baltimore, MD, USA, 31 October–5 November 1999; Volume 188, pp. 933–944. [Google Scholar]
- Al-Ghrery, K.; Kalfat, R.; Al-Mahaidi, R.; Oukaili, N.; Al-Mosawe, A. Prediction of Concrete Cover Separation in Reinforced Concrete Beams Strengthened with FRP. J. Compos. Constr. 2021, 25, 04021022. [Google Scholar] [CrossRef]
- Parisi, F.; Ruggieri, S.; Lovreglio, R.; Fanti, M.P.; Uva, G. On the use of mechanics-informed models to structural engineering systems: Application of graph neural networks for structural analysis. Structures 2024, 59, 105712. [Google Scholar] [CrossRef]
- Cardellicchio, A.; Ruggieri, S.; Nettis, A.; Renò, V.; Uva, G. Physical interpretation of machine learning-based recognition of defects for the risk management of existing bridge heritage. Eng. Fail. Anal. 2023, 149, 107237. [Google Scholar] [CrossRef]
- Ahmed, O.; Van Gemert, D.; Vandewalle, L. Improved model for plate-end shear of CFRP strengthened RC beams. Cem. Concr. Compos. 2001, 23, 3–19. [Google Scholar] [CrossRef]
- Garden, H.N.; Hollaway, L.C.; Thorne, A.M.; Robust. A preliminary evaluation of carbon fibre reinforced polymer plates for strengthening reinforced concrete members. Struct. Build. 1997, 122, 127–142. [Google Scholar] [CrossRef]
- Garden, H.N.; Quantrill, R.J.; Hollaway, L.C.; Thorne, A.M.; Parke, G.A.R. An experimental study of the anchorage length of carbon fibre composite plates used to strengthen reinforced concrete beams. Constr. Build. Mater. 1998, 12, 203–219. [Google Scholar] [CrossRef]
- Fanning, P.J.; Kelly, O. Ultimate Response of RC Beams Strengthened with CFRP Plates. J. Compos. Constr. 2001, 5, 122–127. [Google Scholar] [CrossRef]
- Gao, B.; Kim, J.-K.; Leung, C.K. Strengthening efficiency of taper ended FRP strips bonded to RC beams. Compos. Sci. Technol. 2006, 66, 2257–2264. [Google Scholar] [CrossRef]
- Kotynia, R.; Abdel Baky, H.; Neale, K.W.; Ebead, U.A. Flexural strengthening of RC beams with externally bonded CFRP systems: Test results and 3D nonlinear FE analysis. J. Compos. Constr. 2008, 12, 190–201. [Google Scholar] [CrossRef]
- Maalej, M.; Bian, Y. Interfacial shear stress concentration in FRP-strengthened beams. Compos. Struct. 2001, 54, 417–426. [Google Scholar] [CrossRef]
- Musa, N.; Mohammed, B.; Liew, M. Flexural strength of RC beams with multiple layers of CFRP sheet. Int. J. Civ. Eng. Technol. 2017, 5, 134–143. [Google Scholar]
- Nguyen, D.M.; Chan, T.K.; Cheong, H.K. Brittle Failure and Bond Development Length of CFRP-Concrete Beams. J. Compos. Constr. 2001, 5, 12–17. [Google Scholar] [CrossRef]
- Sabzi, J.; Esfahani, M.R. Effects of tensile steel bars arrangement on concrete cover separation of RC beams strengthened by CFRP sheets. Constr. Build. Mater. 2018, 162, 470–479. [Google Scholar] [CrossRef]
- Xiong, G.; Jiang, X.; Liu, J.; Chen, L. A way for preventing tension delamination of concrete cover in midspan of FRP strengthened beams. Constr. Build. Mater. 2007, 21, 402–408. [Google Scholar] [CrossRef]
- Gao, B.; Kim, J.K.; Leung, C.K.Y. Taper ended FRP strips bonded to RC beams: Experiments and FEM analysis. In Proceedings of the Second International Conference on FRP in Civil Engineering, Adelaide, Australia, 8–10 December 2004. [Google Scholar]
- Rahimi, H.; Hutchinson, A. Concrete Beams Strengthened with Externally Bonded FRP Plates. J. Compos. Constr. 2001, 5, 44–56. [Google Scholar] [CrossRef]
- Quantrill, R.J.; Hollaway, L.C.; Thorne, A.M. Experimental and analytical investigation of FRP strengthened beam response: Part I. Mag. Concr. Res. 1996, 48, 331–342. [Google Scholar] [CrossRef]
- Quantrill, R.J.; Hollaway, L.C.; Thorne, A.M. Predictions of the maximum plate end stresses of FRP strengthened beams: Part II. Mag. Concr. Res. 1996, 48, 343–351. [Google Scholar] [CrossRef]
- David, E.; Djelal, C.; Ragneau, E.; Bodin, F.B. Use of FRP to strengthen and repair RC beams: Experimental study and numerical simulations. In Proceedings of the 8th International Conference on Advanced Composites for Concrete Repair, London, UK, 13–15 July 1999. [Google Scholar]
- Buyle-Bodin, F.; David, E. Use of Carbon Fibre Textile to Control Premature Failure of Reinforced Concrete Beams Strengthened with Bonded CFRP Plates. J. Ind. Text. 2004, 33, 145–157. [Google Scholar] [CrossRef]
- Saadatmanesh, H.; Ehsani, M.R. RC beams strengthened with GFRP plates. I: Experimental study. J. Struct. Eng. 1991, 117, 3417–3433. [Google Scholar] [CrossRef]
- Arduini, M.; Di Tommaso, A.; Nanni, A. Brittle failure in FRP plate and sheet bonded beams. Struct. J. 1997, 94, 363–370. [Google Scholar]
- Beber, A.J.; Filho, A.C.; Campagnolo, J.L. Flexural strengthening of R/C beams with CFRP sheets. Struct. Faults Repair 1999, 99. [Google Scholar]
- Ritchie, P.A.; Thomas, D.A.; Lu, L.W.; Connelly, G.M. External Reinforcement of Concrete Beams Using Fiber Reinforced Plastic. Master’s Thesis, Lehigh University, Bethlehem, PA, USA, 1988. [Google Scholar]
- Pham, H.B.; Al-Mahaid, R. An Investigation into Debonding of FRP in Flexural Strengthening; ARRB Transport Research, Limited: Melbourne, VIC, Autralia, 2003. [Google Scholar]
- Leung, K.C. Effects of adhesive properties on strengthening of concrete beams with composite strips. In FRP Composites in Civil Engineering: Proceedings of the International Conference on FRP Composites in Civil Engineering, Hong Kong, China, 12–15 December 2001; Taylor & Francis: Milton Park, UK, 2001; Volume 1. [Google Scholar]
- Zarnic, R.; Bosiljkov, V. Behavior of Beams Strengthened with FRP and Steel Plates. In Proceedings of the 2001 Structures Congress and Exposition, Washington, DC, USA, 21–23 May 2001; pp. 1–6. [Google Scholar]
- Tumialan, G.J. Concrete Cover Delamination in Reinforced Concrete Beams Strengthened with CFRP Sheets. Master’s Thesis, University of Missouri, Columbia, MO, USA, 1998. [Google Scholar]
- Pimanmas, A.; Pornpongsaroj, P. Peeling behaviour of reinforced concrete beams strengthened with CFRP plates under various end restraint conditions. Mag. Concr. Res. 2004, 56, 73–81. [Google Scholar] [CrossRef]
- Buyukozturk, O.; Gunes, O.; Karaca, E. Characterization and modeling of debonding in RC beams strengthened with FRP composites. In Proceedings of the 15th ASCE Engineering Mechanics Conference, New York, NY, USA, 2–5 June 2002. [Google Scholar]
- Al-Saawani, A.M.; El-Sayed, A.K.; Al-Negheimish, I.A. Effect of basic design parameters on IC debonding of CFRP-strengthened shallow RC beams. J. Reinf. Plast. Compos. 2015, 34, 1526–1539. [Google Scholar] [CrossRef]
- Al-Tamimi, A.K.; Hawileh, R.; Abdalla, J.; Rasheed, H.A. Effects of Ratio of CFRP Plate Length to Shear Span and End Anchorage on Flexural Behavior of SCC RC Beams. J. Compos. Constr. 2011, 15, 908–919. [Google Scholar] [CrossRef]
- Benjeddou, O.; Ouezdou, M.B.; Bedday, A. Damaged RC beams repaired by bonding of CFRP laminates. Constr. Build. Mater. 2007, 21, 1301–1310. [Google Scholar] [CrossRef]
- Esfahani, M.R.; Kianoush, M.; Tajari, A. Flexural behaviour of reinforced concrete beams strengthened by CFRP sheets. Eng. Struct. 2007, 29, 2428–2444. [Google Scholar] [CrossRef]
- Jeevan, N.; Reddy, H.N.J. Strengthening of RC beams using externally bonded laminate (EBL) technique with end anchorages under flexure. Asian J. Civ. Eng. 2018, 19, 263–272. [Google Scholar] [CrossRef]
- Skuturna, T.; Valivonis, J. Experimental study on the effect of anchorage systems on RC beams strengthened using FRP. Compos. Part B Eng. 2016, 91, 283–290. [Google Scholar] [CrossRef]
- He, T.; Lv, C.; Li, W.; Huang, G.; Hu, Z.; Xu, J. The Dielectric Constant of Ba6−3x(Sm1−yNdy)8+2xTi18O54 (x = 2/3) Ceramics for Microwave Communication by Linear Regression Analysis. Materials 2020, 13, 5733. [Google Scholar] [CrossRef]
- Abd, A.M.; Abd, S.M. Modelling the strength of lightweight foamed concrete using support vector machine (SVM). Case Stud. Constr. Mater. 2017, 6, 8–15. [Google Scholar] [CrossRef]
- Zhong, W.; Ding, H.; Zhao, X.; Fan, L. Mechanical properties prediction of geopolymer concrete subjected to high temperature by BP neural network. Constr. Build. Mater. 2023, 409, 133780. [Google Scholar] [CrossRef]
- Barrios, J.M.; Romero, P.E. Decision Tree Methods for Predicting Surface Roughness in Fused Deposition Modeling Parts. Materials 2019, 12, 2574. [Google Scholar] [CrossRef] [PubMed]
- Khan, I.A.; Birkhofer, H.; Kunz, D.; Lukas, D.; Ploshikhin, V. A Random Forest Classifier for Anomaly Detection in Laser-Powder Bed Fusion Using Optical Monitoring. Materials 2023, 16, 6470. [Google Scholar] [CrossRef] [PubMed]
- Liu, X.; Liu, T.; Feng, P. Long-term performance prediction framework based on XGBoost decision tree for pultruded FRP composites exposed to water, humidity and alkaline solution. Compos. Struct. 2022, 284, 115184. [Google Scholar] [CrossRef]
- Taffese, W.Z.; Espinosa-Leal, L. Unveiling non-steady chloride migration insights through explainable machine learning. J. Build. Eng. 2024, 82, 108370. [Google Scholar] [CrossRef]
Figure 1.
CCS failure.

Figure 2.
Correlation thermal Earth map of features.

Figure 3.
Machine learning models.

Figure 4.
Deviations between predicted and real values.

Figure 5.
Taylor diagram of model performance for machine learning. (a) Training; (b) Test.

Figure 6.
Performance of the model proposed by codes.


Figure 8.
Importance of parameters based on XGBoost.

Figure 9.
Importance of parameters based on SHAP.

Figure 10.
SHAP-based parameter sensitivity study.


Table 1.
Data sources.
| Reference | Number | Reference | Number |
|---|---|---|---|
| [8] | [44] | 4 | |
| [12] | [45] | 1 | |
| [14] | 5 | [46] | 1 |
| [29] | 4 | [47] | 3 |
| [30] | 10 | [48] | 6 |
| [31] | 5 | [49] | 5 |
| [32] | 4 | [50] | 1 |
| [33] | 5 | [51] | 3 |
| [34] | 1 | [52] | 1 |
| [35] | 3 | [53] | 3 |
| [36] | 4 | [54] | 2 |
| [37] | 4 | [55] | 1 |
| [38] | 1 | [56] | 1 |
| [39] | 1 | [57] | 2 |
| [40] | 3 | [58] | 1 |
| [41] | 6 | [59] | 2 |
| [42] | 3 | [60] | 1 |
| [43] | 3 | [61] | 6 |
Table 2.
Statistical values for input.
| Parameter | ds (A1) | B (A2) | f′c (A3) | Ast (A4) | fsy (A5) | Af (A6) | Ef (A7) | M*/V* (A8) | Vus (A9) | Vuc (A10) |
|---|---|---|---|---|---|---|---|---|---|---|
| Min. | 69 | 100 | 19 | 57 | 350 | 13 | 10 | 0 | 3 | 4 |
| Max. | 375 | 400 | 80 | 1272 | 611 | 912 | 271 | 550 | 491 | 182 |
| Average | 176 | 139 | 42 | 224 | 481 | 120 | 185 | 128 | 89 | 34 |
| Standard deviation | 47% | 35% | 53% | 18% | 79% | 13% | 68% | 23% | 18% | 19% |
Disclaimer/Publisher’s Note: The statements, opinions and data contained in all publications are solely those of the individual author(s) and contributor(s) and not of MDPI and/or the editor(s). MDPI and/or the editor(s) disclaim responsibility for any injury to people or property resulting from any ideas, methods, instructions or products referred to in the content. |
© 2024 by the authors. Licensee MDPI, Basel, Switzerland. This article is an open access article distributed under the terms and conditions of the Creative Commons Attribution (CC BY) license (https://creativecommons.org/licenses/by/4.0/).
Share and Cite
MDPI and ACS Style
Zheng, S.; Hu, T.; Yu, Y. Interpretable Machine Learning-Based Prediction Model for Concrete Cover Separation of FRP-Strengthened RC Beams. Materials 2024, 17, 1957. https://doi.org/10.3390/ma17091957
AMA Style
Zheng S, Hu T, Yu Y. Interpretable Machine Learning-Based Prediction Model for Concrete Cover Separation of FRP-Strengthened RC Beams. Materials. 2024; 17(9):1957. https://doi.org/10.3390/ma17091957
Chicago/Turabian StyleZheng, Sheng, Tianyu Hu, and Yong Yu. 2024. "Interpretable Machine Learning-Based Prediction Model for Concrete Cover Separation of FRP-Strengthened RC Beams" Materials 17, no. 9: 1957. https://doi.org/10.3390/ma17091957
Note that from the first issue of 2016, this journal uses article numbers instead of page numbers. See further details here.