3.1. Methane Self-Diffusion in CMS Membranes
Methane self-diffusion was investigated by PFG NMR in the following three carbon molecular sieve membrane samples: 6FDA/BPDA(1:1)-DAM CMS pyrolized in an inert gas (6FDA/BPDA), Matrimid
® CMS pyrolized in an inert gas (Matrimid Sample 1), and Matrimid
® CMS pyrolized under vacuum (Matrimid Sample 2). Diffusion data was obtained using combined application of proton and carbon-13 PFG NMR. It was observed that in all cases the PFG NMR attenuation curves show monoexponential behavior in agreement with Equation (1),
n = 1 (
Figure 2). This indicates that under any given measurement conditions used there is no significant distribution over methane self-diffusion coefficient inside membrane pieces of each studied membrane sample. It is important to note that under our experimental conditions the diffusivity of methane in the gas phase of the samples is expected to be at least four orders of magnitude larger than that inside the membranes. This estimate was confirmed by our direct PFG NMR measurements. As a result, the PFG NMR signal from methane in the gas phase was completely attenuated when the smallest (non-zero) gradient was used in the measurements of the PFG NMR attenuation curves shown in
Figure 2. It was also observed that the diffusion data for methane measured under the same conditions by
1H and
13C PFG NMR were identical within the experimental uncertainty.
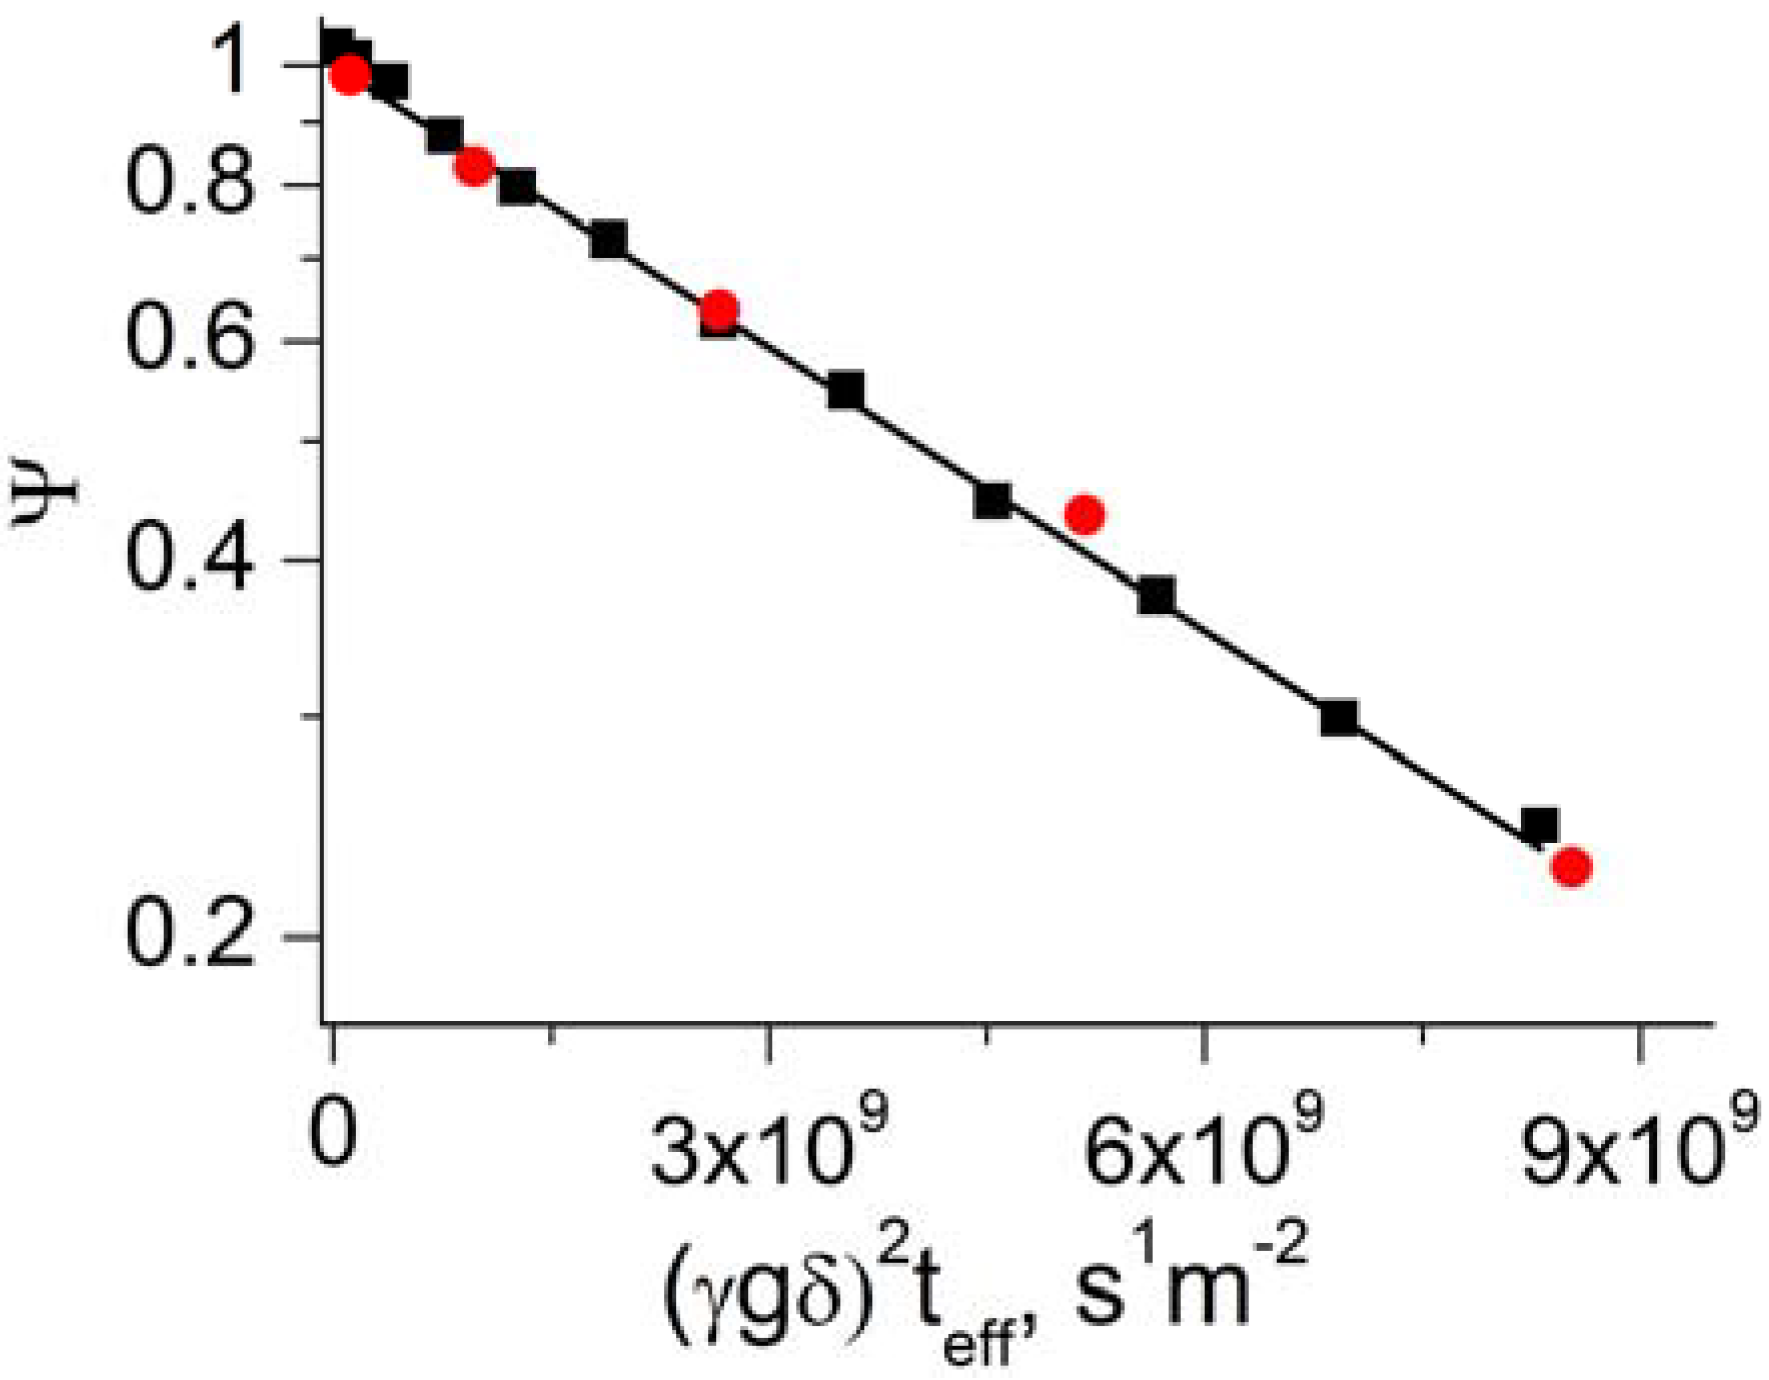
Figure 2 shows an example of such data. In the presentation of this figure the proton and carbon-13 PFG NMR attenuation curves measured for diffusion of
13C-labeled CH
4 have to coincide to reveal the same diffusion behavior. Such coincidence is evident in the figure. The observed agreement between the diffusivities measured at very different resonance frequencies of 750 and 188.6 MHz corresponding, respectively, to
1H and
13C nuclei provide strong evidence that the reported diffusion data are not distorted by magnetic susceptibility effects or by any other disturbing effects.
Figure 2.
Examples of PFG NMR attenuation curves measured for methane diffusion in 6FDA/BPDA using proton (■) and carbon-13 () PFG NMR. The measurements were performed for the effective diffusion time of 9 ms at T = 321 K. The 13-interval and PGSTE LED PFG NMR pulse sequences were used for proton and carbon-13 measurements, respectively. The line shows the result of fitting both attenuation curves by Equation (1) with n = 1.
Table 1 shows the methane diffusivities and the corresponding values of root MSD obtained by fitting the measured PFG NMR attenuation curves by Equation (1) (
n = 1) and Equation (2). The diffusion data are reported for the broad range of temperatures and effective diffusion times used in this study. In all cases the reported values of root MSD were at least 5 times smaller than the smallest dimension (
i.e., thickness) of the membrane pieces. Hence, the measured diffusivities correspond to intra-membrane diffusion under conditions when the boundaries of the membrane pieces are not expected to influence the diffusion behavior. In this case it is not expected to observe any measurable fraction of methane molecules performing long-range diffusion,
i.e., diffusion under conditions of fast exchange of methane molecules between the membrane pieces and the surrounding gas phase. It is seen in
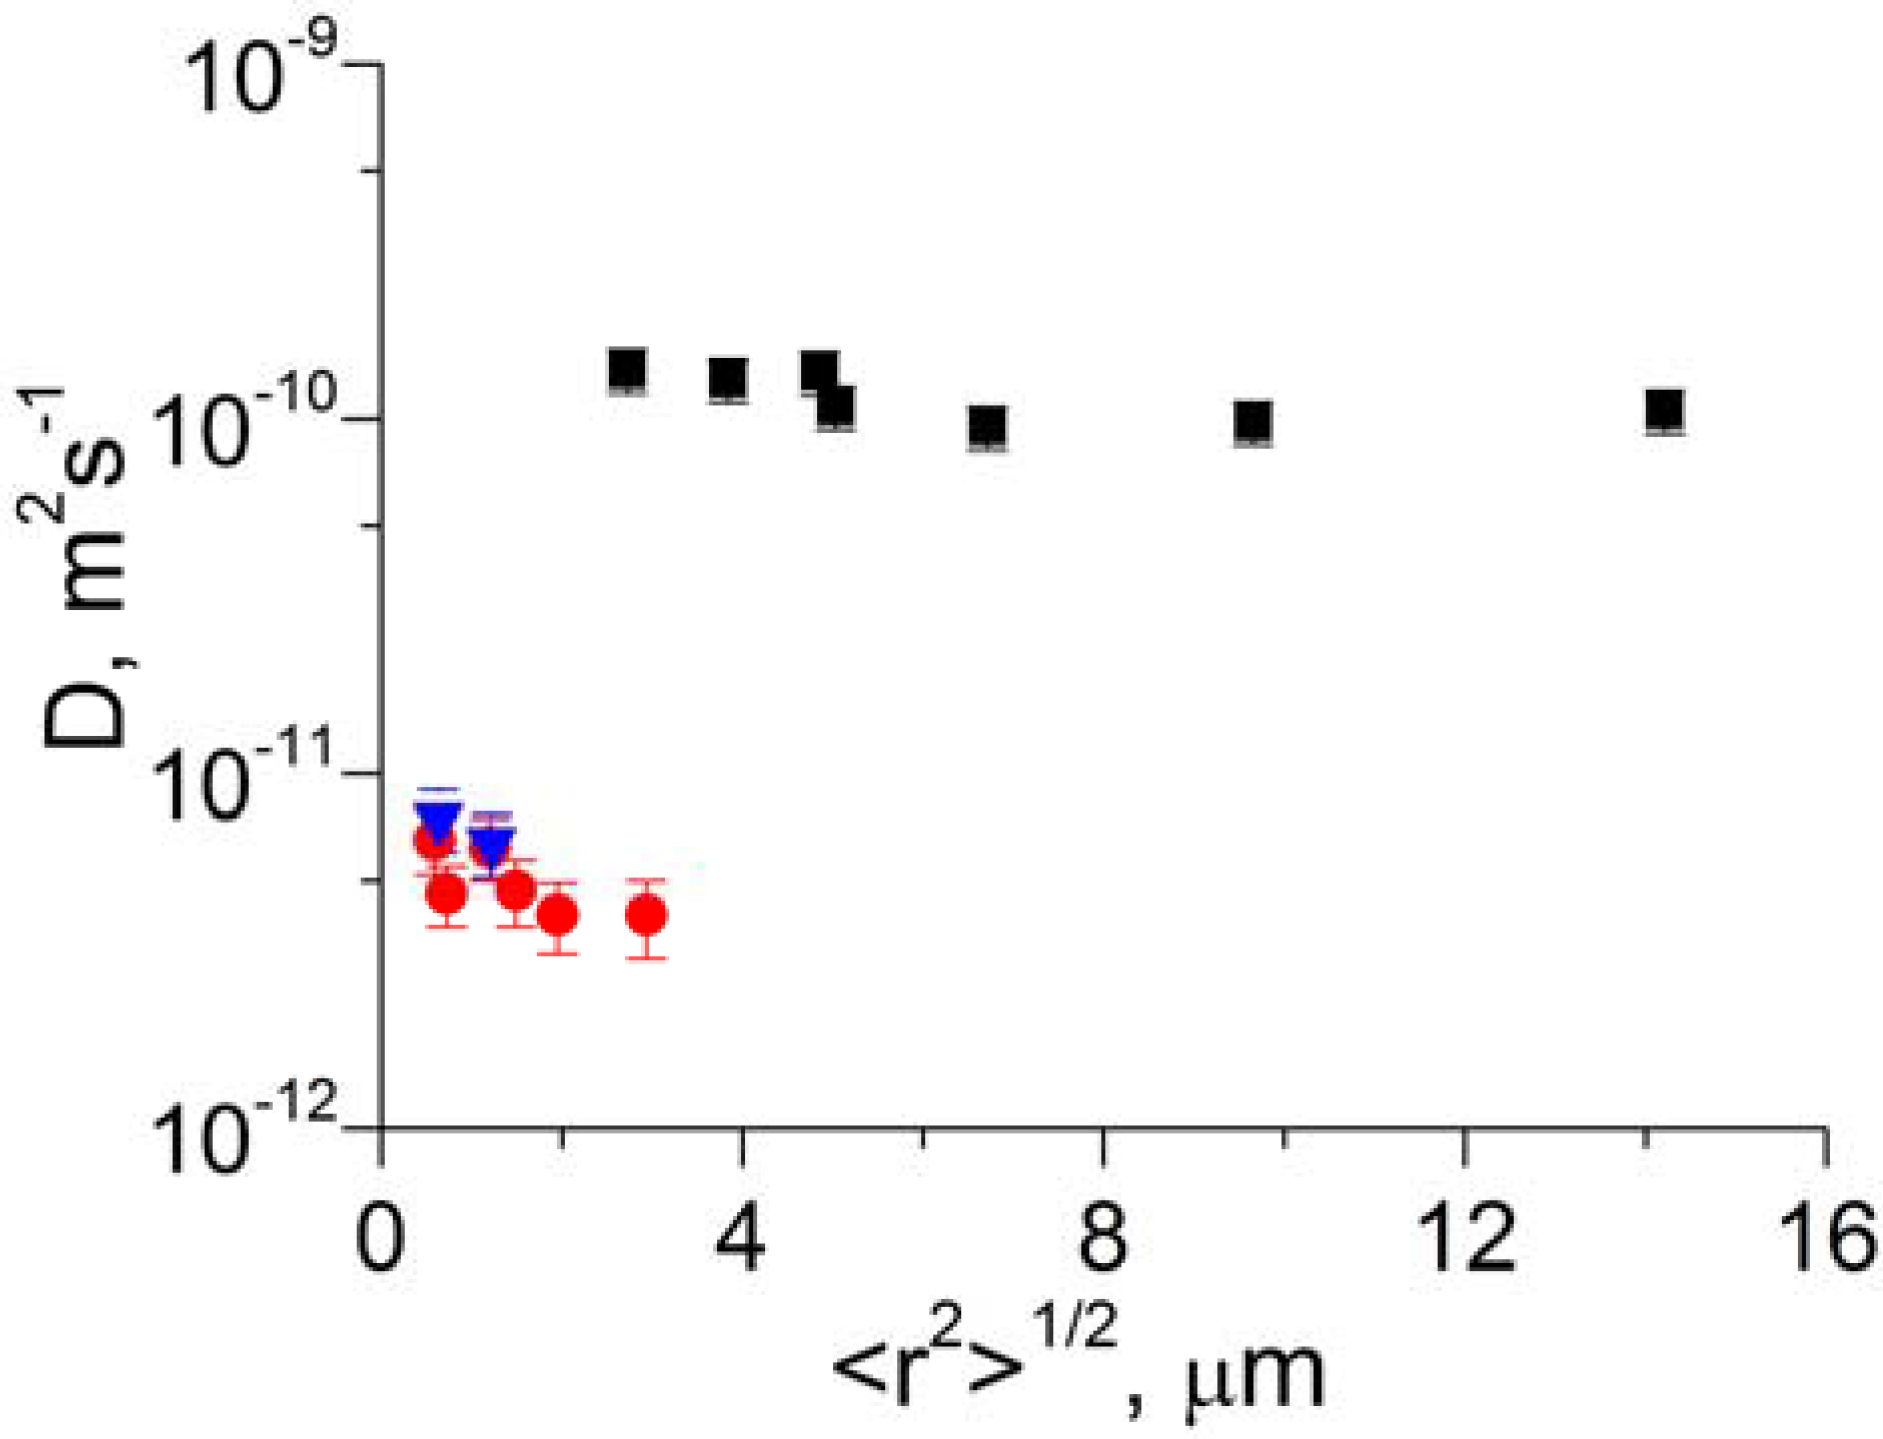
Table 1 that within the experimental uncertainty the intra-membrane diffusivities of methane do not change with increasing values of the root MSD. This is illustrated in
Figure 3 which presents examples of the measured dependencies of the methane diffusivities on the root MSD. This data demonstrates that the diffusion properties of the studied membranes remain homogeneous over a broad range of length scales starting with the length scales as small as 600 nm to as large as 14 µm which is comparable with the membrane thickness of 60 ± 10 µm.
Table 1.
Data for methane self-diffusion in: (a) 6FDA/BPDA, and (b) Matrimid Samples 1 and 2. Self-diffusion coefficients and the corresponding values of the root MSD were obtained from fitting PFG NMR attenuation curves measured for methane diffusion at different temperatures (T) and effective diffusion times (teff) by Equation (1) with n = 1 and Equation (2). The data obtained by 13C PFG NMR is labeled by (*). All other data was obtained by 1H PFG NMR.
(a)
| Sample | T (K) | teff (ms) | D (m2·s−1) | Root MSD (µm) |
|---|
| 6FDA/BPDA loaded with methane | 297 | 9 | (1.4 ± 0.2) × 10−10 | 2.7 ± 0.2 |
| 9 | (1.2 ± 0.2) × 10−10 * | 2.6 ± 0.2 |
| 19 | (1.3 ± 0.2) × 10−10 | 3.8 ± 0.3 |
| 19 | (1.3 ± 0.2) × 10−10 * | 3.8 ± 0.3 |
| 29 | (1.4 ± 0.2) × 10−10 * | 4.9 ± 0.3 |
| 39 | (1.2 ± 0.2) × 10−10 | 5.3 ± 0.4 |
| 39 | (1.2 ± 0.2) × 10−10 * | 5.3 ± 0.4 |
| 79 | (9.5 ± 1.3) × 10−11 * | 6.7 ± 0.5 |
| 159 | (9.8 ± 1.4) × 10−11 * | 9.7 ± 0.7 |
| 319 | (1.1 ± 0.1) × 10−10 * | 14.0 ± 1.0 |
| 319 | 9 | (1.7 ± 0.2) × 10−10 | 3.0 ± 0.2 |
| 9 | (1.7 ± 0.2) × 10−10 * | 3.0 ± 0.2 |
| 19 | (1.5 ± 0.2) × 10−10 | 4.1 ± 0.3 |
| 39 | (1.4 ± 0.2) × 10−10 | 5.7 ± 0.4 |
| 39 | (1.5 ± 0.2) × 10−10 * | 5.9 ± 0.4 |
| 340 | 9 | (2.2 ± 0.3) × 10−10 | 3.4 ± 0.2 |
| 9 | (2.1 ± 0.3) × 10−10 | 3.4 ± 0.2 |
| 19 | (2.2 ± 0.3) × 10−10 | 5.0 ± 0.3 |
| 39 | (2 ± 0.3) × 10−10 * | 6.8 ± 0.5 |
| 353 | 9 | (2.7 ± 0.4) × 10−10 | 3.8 ± 0.3 |
| 9 | (2.8 ± 0.4) × 10−10 * | 3.9 ± 0.3 |
| 19 | (2.6 ± 0.4) × 10−10 | 5.4 ± 0.4 |
| 39 | (2.4 ± 0.3) × 10−10 | 7.5 ± 0.5 |
(b)
| Sample | T (K) | teff (ms) | D (m2·s−1) | Root MSD (µm) |
|---|
| Matrimid Sample 1 loaded with methane | 297 | 9 | (6.5 ± 1.3) × 10−12 | 0.6 ± 0.06 |
| 19 | (4.6 ± 0.9) × 10−12 | 0.7 ± 0.1 |
| 39 | (6.2 ± 1.2) × 10−12 | 1.2 ± 0.1 |
| 79 | (4.7 ± 1) × 10−12 | 1.5 ± 0.2 |
| 159 | (4 ± 0.9) × 10−12 | 2.0 ± 0.2 |
| 359 | (4 ± 1) × 10−12 | 2.9 ± 0.4 |
| 339 | 9 | (9.4 ± 2) × 10−12 | 0.7 ± 0.07 |
| 356 | 9 | (1.2 ± 0.2) × 10−11 | 0.8 ± 0.05 |
| Matrimid Sample 2 loaded with methane | 297 | 9 | (7.5 ± 1.5) × 10−12 | 0.6 ± 0.1 |
| 39 | (6.4 ± 1.3) × 10−12 | 1.2 ± 0.1 |
| 336 | 9 | (8.5 ± 1.5) × 10−12 | 0.7 ± 0.1 |
| 356 | 9 | (1.3 ± 0.2) × 10−11 | 0.8 ± 0.1 |
Figure 3.
Dependences of the methane self-diffusion coefficient on the root MSD at T = 297 K for 6FDA/BPDA (■), Matrimid Sample 1 (), and Matrimid Sample 2 (). The data was obtained using Equation (1) with n = 1 and Equation (2).
Figure 3.
Dependences of the methane self-diffusion coefficient on the root MSD at T = 297 K for 6FDA/BPDA (■), Matrimid Sample 1 (), and Matrimid Sample 2 (). The data was obtained using Equation (1) with n = 1 and Equation (2).
The temperature dependence of the methane self-diffusivities in the three membrane samples is shown in
Figure 4. For each sample, the temperature dependence was found to be in agreement with an Arrhenius law
where
Ea is the apparent activation energy of diffusion. Application of Equation (3) to the measured data yields the following activation energies: 8 kJ/mol for 6FDA/BPDA and 10 kJ/mol for Matrimid Sample 1 and Matrimid Sample 2. The experimental uncertainty of these values was estimated to be in the range of a factor of 2.
It is seen in
Table 1 and
Figure 4 that under the same or similar measurement conditions the methane self-diffusivity in 6FDA/BPDA is about an order of magnitude larger than that in both Matrimid samples. At the same time, in all three samples the activation energy for methane diffusion was found to be the same within the experimental uncertainty. This observation can be explained by assuming that 6FDA/BPDA has a higher relative abundance of sufficiently large pores permeable to methane than the Matrimid samples. This is in agreement with the data on permeation experiments conducted on these membrane types and with the data analysis reported in references [
5,
20]. In a qualitative agreement with the self-diffusion data reported in
Table 1 the permeation experiments yielded the effective transport diffusivities of methane that are much lower in Matrimid
® type CMS than in 6FDA/BPDA type CMS [
5]. The quantitative comparison of the transport diffusivities with the self-diffusivities reported in this work cannot be done easily because the transport diffusivities represent the effective (average) values over a broad range of methane loadings in the membranes corresponding to a large methane pressure difference (around 50 psia) between the feed side and the permeate side of the membranes. Hence, both the thermodynamic factor and loading dependence of diffusivity are expected to contribute to the difference between the transport and self-diffusivity values [
8,
9].
Figure 4.
Temperature dependences of the methane self-diffusion coefficient measured by PFG NMR for the effective diffusion time 9 ms in 6FDA/BPDA (■), Matrimid Sample 1 (), and Matrimid Sample 2 (). Lines show the fit to the Arrehenius law (Equation (3)).
Figure 4.
Temperature dependences of the methane self-diffusion coefficient measured by PFG NMR for the effective diffusion time 9 ms in 6FDA/BPDA (■), Matrimid Sample 1 (), and Matrimid Sample 2 (). Lines show the fit to the Arrehenius law (Equation (3)).
3.2. Self-Diffusion of Isooctane in FAU/EMT Intergrowth
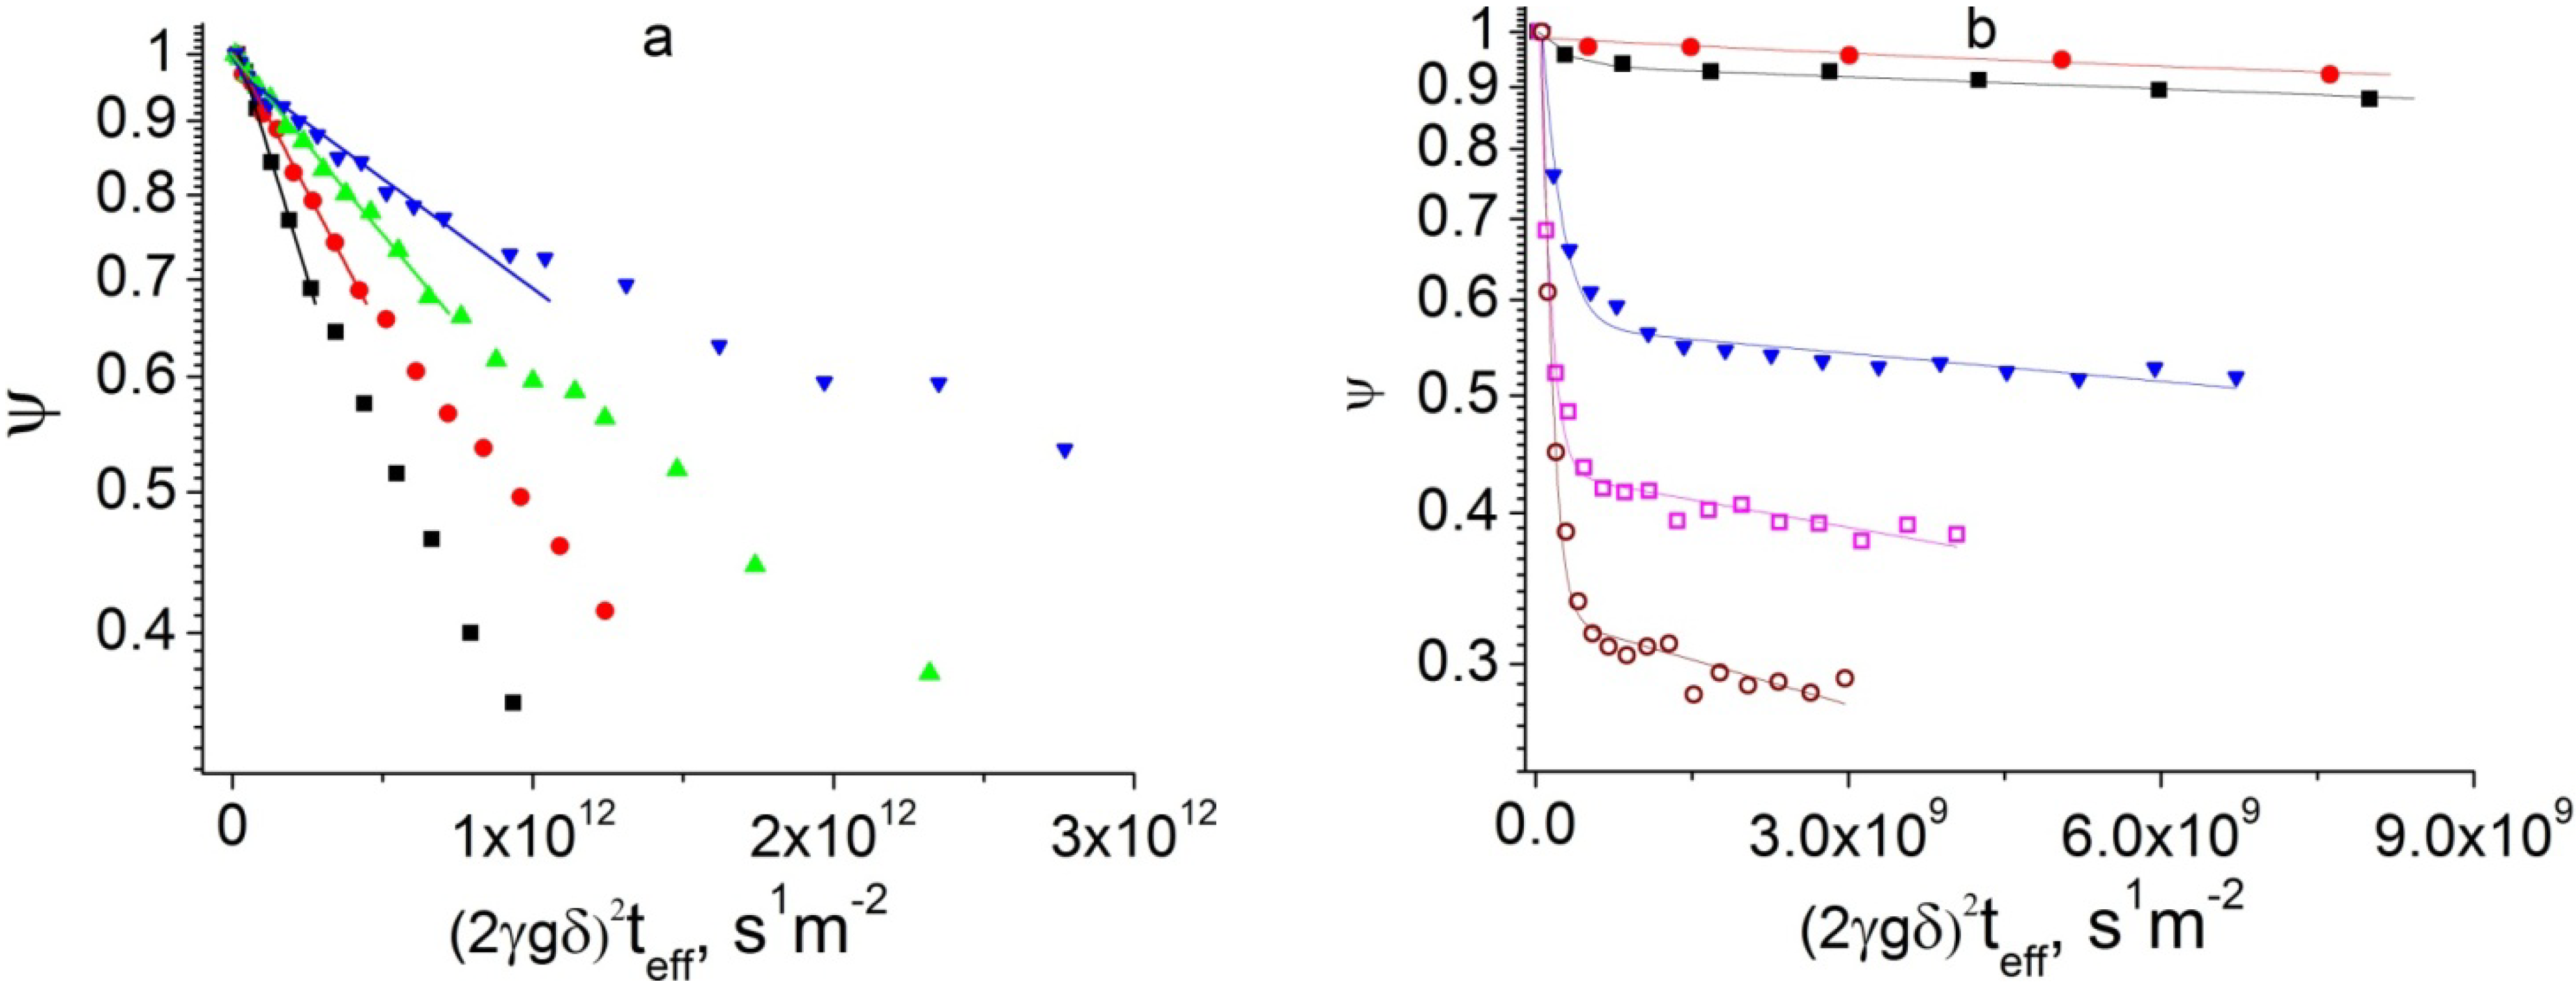
Figure 5a shows examples of the PFG NMR attenuation curves measured for isooctane diffusion in the FAU/EMT intergrowth for different effective diffusion times at 264 K. In the presentation of this figure the initial parts of the attenuation curves measured for different effective diffusion times have to coincide if the effective diffusivity, which can be defined by the initial slope of the attenuation curves [
8], does not depend on diffusion time. The data in
Figure 5a show that the initial slope of the attenuation curves decreases with increasing effective diffusion time. This indicates that the effective diffusivity of isooctane decreases as the diffusion time increases. The shape of the attenuation curves in the figure is relatively close to mono-exponential in agreement with Equation (1),
n = 1. The results of fitting of the initial parts of the attenuation curves in
Figure 5a by this equation are shown in the figure and also given in
Table 2. It is important to note that while the effective diffusivity continuously decreases with increasing diffusion time, the values of the root MSD remain independent of diffusion time within the experimental uncertainty (
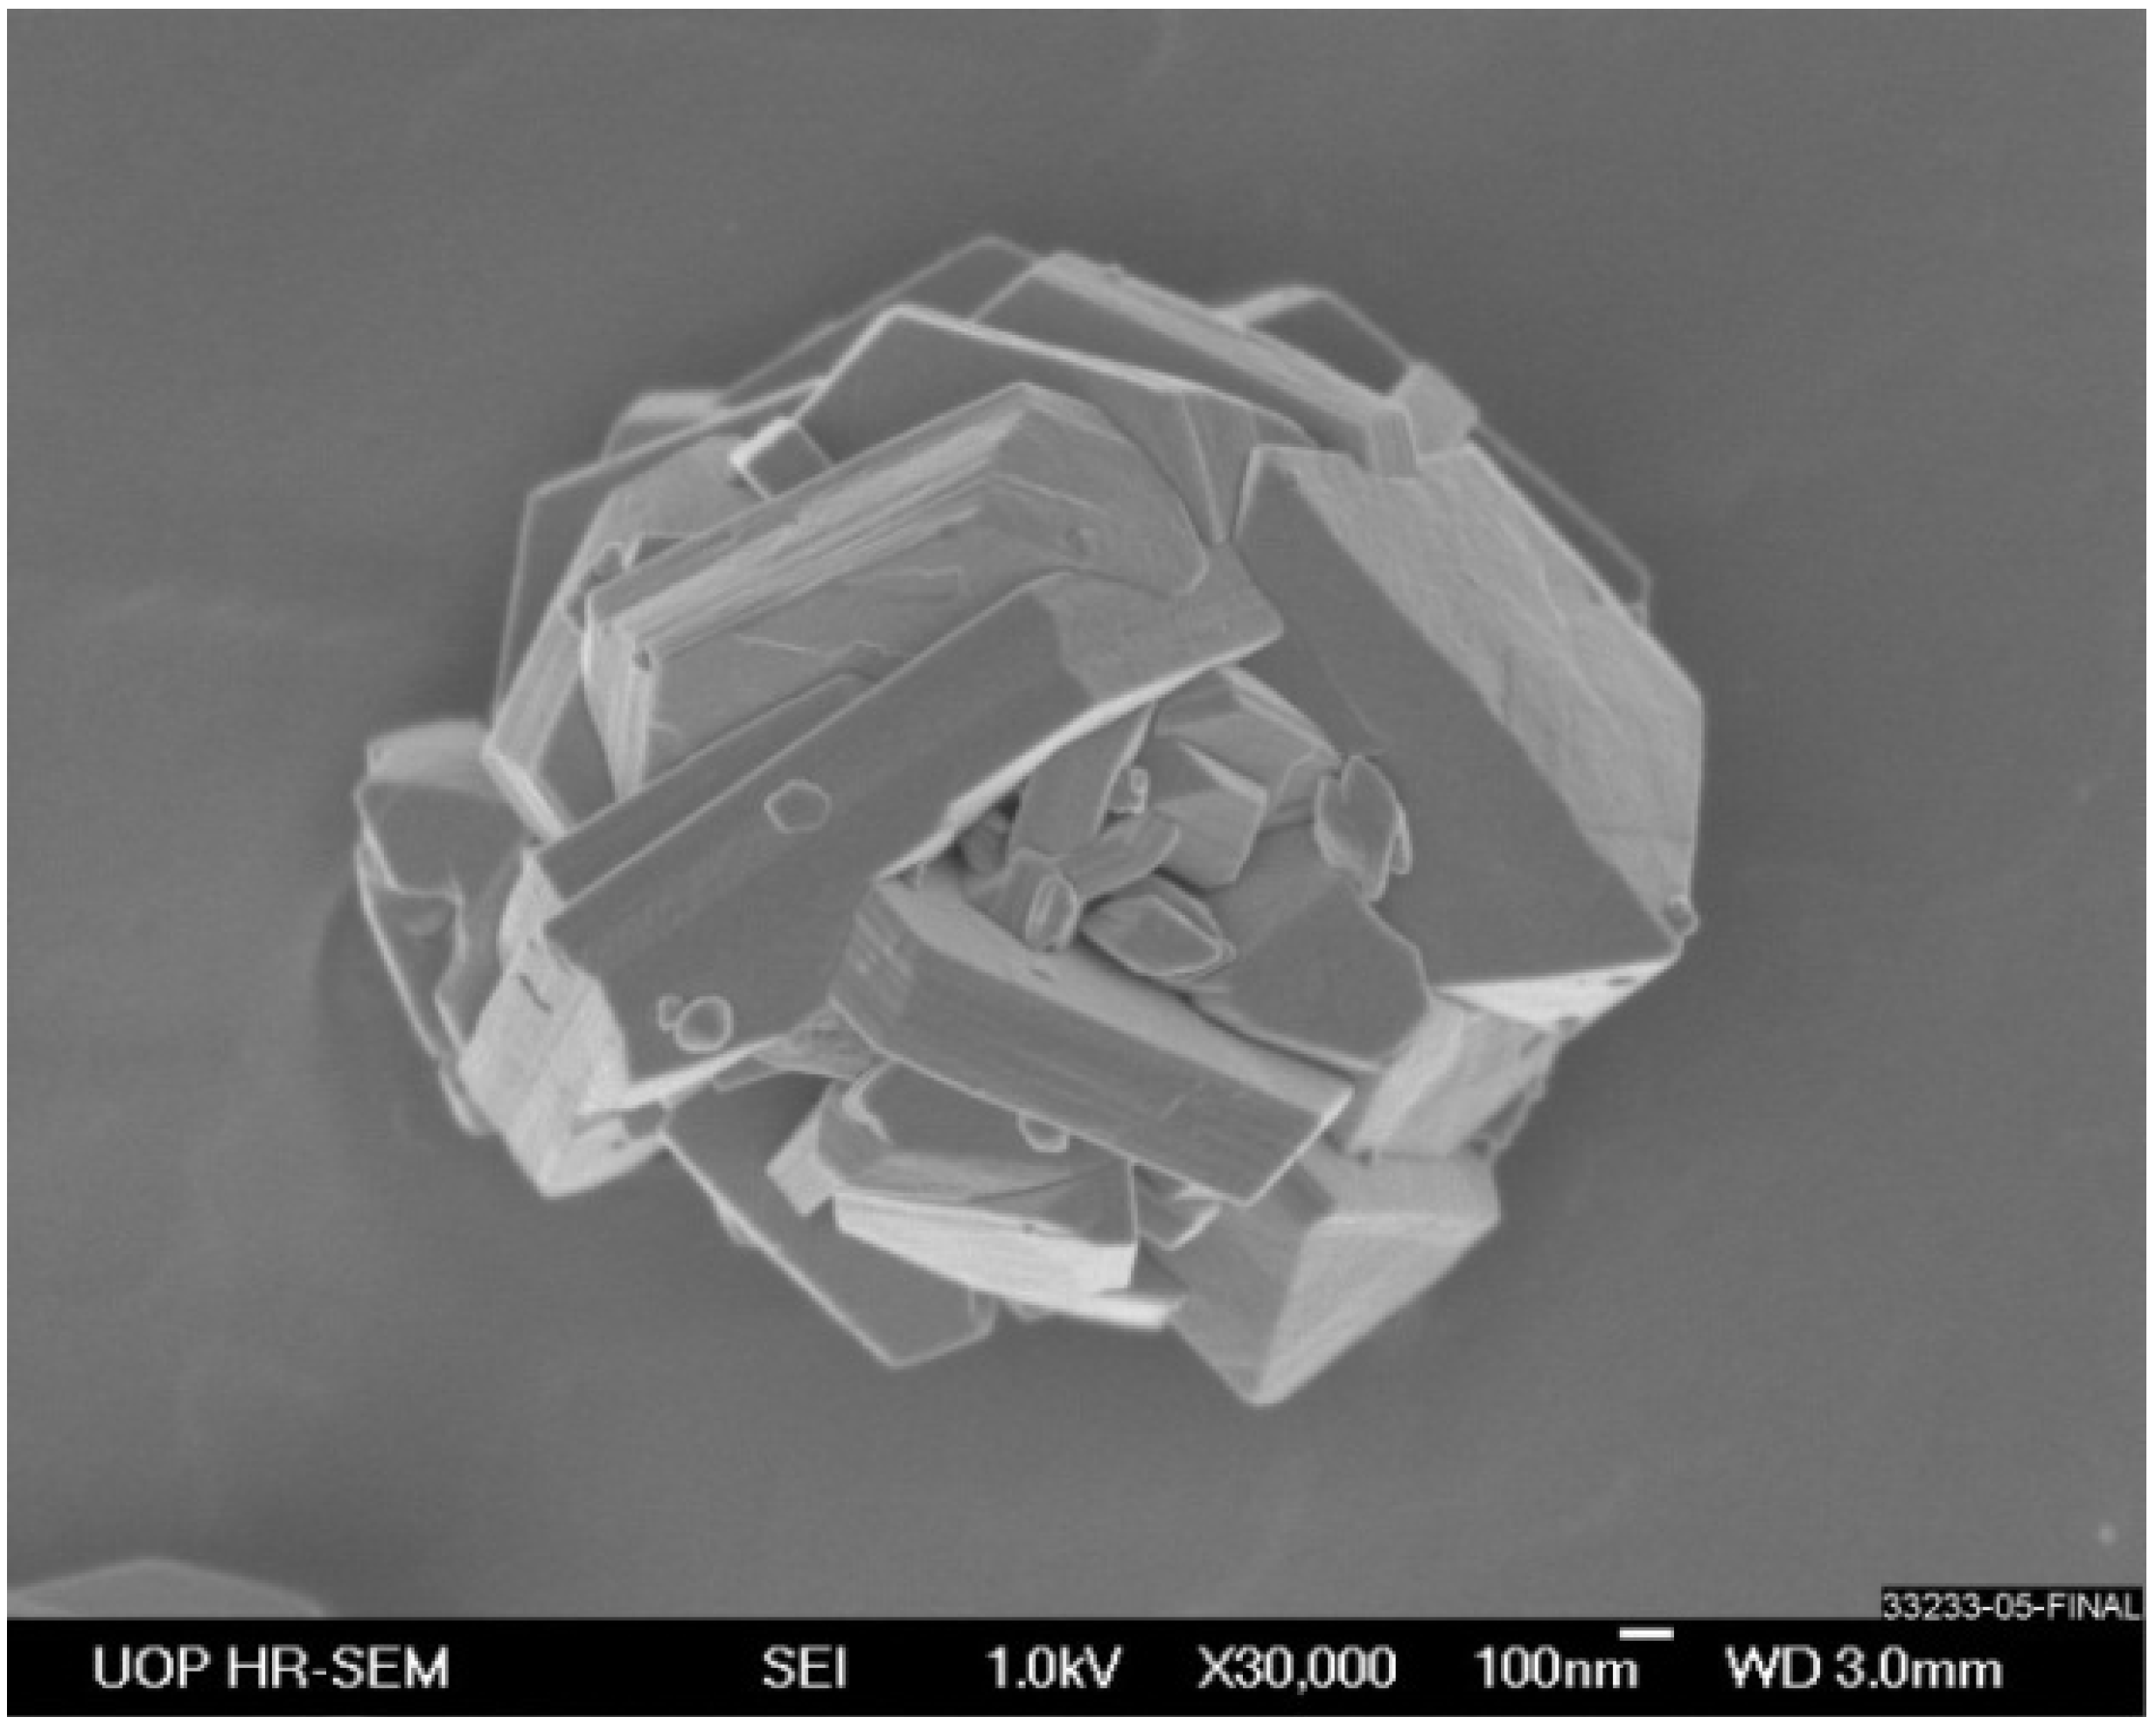
Table 2). The latter values are much smaller than the characteristic size of the particles of the FAU/EMT intergrowth (around 2.8 microns). At the same time, the root MSD values are comparable with the sizes of the individual FAU and EMT blocks forming these particles.
Figure 1 shows that the block sizes are between around 0.1 and 1 micron.
Figure 5.
(a) Proton PFG NMR attenuation curves measured by the 13-interval PFG NMR sequence for diffusion of isooctane in the FAU/EMT intergrowth at T = 264 K for the following effective diffusion times: 6.0 ms (■), 10.5 ms (), 20.5 ms (), and 40.5 ms (). The lines show the initial slopes of the attenuation curves; (b) Proton PFG NMR attenuation curves measured by the 13-interval PFG NMR sequence for diffusion of isooctane in the FAU/EMT intergrowth at T = 289 K for the following effective diffusion times: 5.7 ms (■), 10.2 ms (), 40.1 ms (), 80.1 ms (), and 120.1 ms (). The lines show the best fit curves of the measured data by Equation (1) with n = 2.
Table 2.
Results of fitting of the initial parts of the attenuation curves in
Figure 5a by Equation (1),
n = 1 and the corresponding effective diameters of the particle components surrounded by transport barriers
deff. The values of
deff were obtained by using Equation (4).
Table 2.
Results of fitting of the initial parts of the attenuation curves in Figure 5a by Equation (1), n = 1 and the corresponding effective diameters of the particle components surrounded by transport barriers deff. The values of deff were obtained by using Equation (4).
| Sample | T (K) | t eff (ms) | Deff (m2·s−1) | Root MSD (µm) | deff (µm) |
|---|
| FAU/EMT intergrowth loaded with isooctane | 264 | 6.0 | (1.6 ± 0.2) × 10−12 | 0.24 ± 0.2 | 0.44 ± 0.4 |
| 10.5 | (9.0 ± 1.4) × 10−13 | 0.24 ± 0.2 | 0.44 ± 0.4 |
| 20.5 | (5.7 ± 0.9) × 10−13 | 0.26 ± 0.2 | 0.48 ± 0.5 |
| 40.5 | (2.7 ± 0.4) × 10−13 | 0.26 ± 0.2 | 0.48 ± 0.5 |
These results can be explained by assuming transport barriers at the interfaces between intergrowth components in the particles of the FAU/EMT intergrowth. These barriers are essentially impermeable for isooctane molecules for diffusion times up to 41 ms at 264 K, as indicated by the unchanging values of the root MSD in
Table 2. An existence of a distribution over the sizes of the particle components surrounded by the transport barriers explains small deviations of the PFG NMR attenuation curves in
Figure 5a from the monoexponential behavior [
8]. Assuming that all particle components separated by the transport barriers can be approximated by spheres with the diameter
deff, the following expression can be used to estimate the value of
deff [
8,
21,
22].
Table 2 presents the values of
deff that were obtained using Equation (4). It is seen that these values obtained for different diffusion times are all the same within the experimental uncertainty. The values of
deff characterize the mean size of the particle components surrounded by the transport barriers. This size is found to be within the range of the observed sizes of the intergrowth components (
Figure 1). Hence, these data indicate that the intergrowth components are surrounded by the observed transport barriers.
Figure 5b shows examples of the measured PFG NMR attenuation curves for isooctane in the FAU/EMT intergrowth at a higher temperature of 289 K. It is seen in
Figure 5b that the attenuation curves at large diffusion times show fast initial decay, which is followed by much slower signal attenuation at larger gradient strengths. The onset of the slow attenuation shifts to higher attenuation values with increasing diffusion time. Such behavior indicates a transition of the diffusion process from the intraparticle to long-range regimes as diffusion time increases [
8]. In the former regime sorbate displacements are smaller than or comparable with the particle sizes, while in the latter regime these displacements are larger than the particle sizes. As a result, with increasing diffusion time the fraction of molecules corresponding to intraparticle diffusion is expected to decrease, while that corresponding to long-range diffusion is expected to increase. The sorbate fractions and diffusivities corresponding to intraparticle (slow attenuation) and long-range (fast attenuation) diffusion can be obtained from the biexponential fit of the attenuation curves (Equation (1) with
n = 2).
Table 3 presents the resulting diffusivities and molecular fractions for intraparticle diffusion (
D2 and
p2) and for long-range diffusion (
D1 and
p1).
Table 3.
Results of fitting of the PFG NMR attenuation curves measured for isooctane diffusion in the FAU/EMT intergrowth at
T = 289 K by Equation (2) with
n = 2. The intraparticle diffusivities (
D2) were obtained from the attenuation curves measured at the extended gradient range (not shown in
Figure 5). Star (*) indicates values with a large (in the range of a factor of 2–4) experimental uncertainty.
Table 3.
Results of fitting of the PFG NMR attenuation curves measured for isooctane diffusion in the FAU/EMT intergrowth at T = 289 K by Equation (2) with n = 2. The intraparticle diffusivities (D2) were obtained from the attenuation curves measured at the extended gradient range (not shown in Figure 5). Star (*) indicates values with a large (in the range of a factor of 2–4) experimental uncertainty.
| Sample | T(K) | teff (ms) | D1 (m2·s−1) | p1 | Root MSD 1 (µm) | D2 (m2·s−1) | P2 | Root MSD 2 (µm) |
|---|
| FAU/EMT intergrowth loaded with isooctane | 289 | 5.7 | 4 × 10⁻⁹ * | 0.1 ± 0.07 | 11 * | (3.5 ± 0.5) × 10−12 | 0.9 ± 0.07 | 0.34 ± 0.02 |
| 10.2 | 2 × 10⁻⁹ * | 0.1 ± 0.07 | 11 * | (2.5 ± 0.4) × 10−12 | 0.9 ± 0.07 | 0.39 ± 0.03 |
| 40.1 | (6 ± 3) × 10−9 | 0.5 ± 0.1 | 39 ± 10 | (1.5 ± 0.2) × 10−12 | 0.5 ± 0.1 | 0.43 ± 0.03 |
| 80.1 | (1.1 ± 0.3) × 10−8 | 0.7 ± 0.1 | 74 ± 11 | (4.0 ± 0.6) × 10−13 | 0.3 ± 0.1 | 0.44 ± 0.04 |
| 120.1 | (1.3 ± 0.5) × 10−8 | 0.8 ± 0.1 | 96 ± 20 | (3.5 ± 0.5) × 10−13 | 0.2 ± 0.1 | 0.34 ± 0.02 |
It is seen in the table that within the experimental uncertainty the values of long-range diffusivities (
D1) do not depend on diffusion time. At the same time, the fraction of molecules (
p1) corresponding to long-range diffusion increases significantly with increasing diffusion time. This is an expected behavior for the transition from the intraparticle to long-range diffusion regime with increasing diffusion time [
8]. Also, in agreement with the assignment of the ensemble 1 to molecules exhibiting long-range diffusion, the values of the root MSD for this ensemble (
Table 3) are larger than the characteristic size of the particles of the FAU/EMT intergrowth (~2.8 μm). For diffusion in zeolite beds the long-range diffusivity often can be estimated (in the first approximation) as the diffusivity in the gas phase of the bed multiplied by the fraction of diffusing molecules located in the gas phase of the bed at any particular point of time. As a result, the values of long-range diffusivities can be several orders of magnitude larger than those for diffusion inside zeolite particles [
8]. It is seen in
Table 3 that the effective intraparticle diffusivities continuously decrease with increasing diffusion time. This shows that also at a higher temperature of 289 K the intraparticle diffusion of isooctane has a mostly restricted character. The values of the root MSD obtained for this diffusion process increase slowly with increasing diffusion time. Hence, in contrast to the behavior observed at 264 K, under our measurement conditions at 289 K isooctane molecules show an ability to gradually penetrate through the intraparticle transport barriers. The latter is also manifested by the existence of the molecular fraction exhibiting long-range diffusion. The dependence of this fraction on diffusion time shown in
Table 3 allows estimating the permeability of the transport barriers that were most clearly observed experimentally at 264 K. This permeability can be obtained in the framework of the tracer desorption technique [
8] by estimating the value of the intraparticle mean life time (
τintra):
where, in addition to the values of
p1 given in
Table 3, one can use that
p1(0) = 0 and
p1(∞) = 1. The value of
τintra can be estimated using Equation (5) and taking into account that for the tracer exchange processes strongly influenced by the penetration through the transport barriers [
8]. Using this expression it was found that
τintra = 104 ± 10 ms at 289 K. The intraparticle mean life time is related to the corresponding permeability (
kp) of the transport barriers
[
8], which separate the particle components with the characteristic diameters equal to
deff
This relation is justified by the expectation that on their way out of the zeolite particles isooctane molecules have to cross over at least one of the transport barriers separating the particle components with the characteristic diameter
deff. Using Equation (6) we find
kp ≥ 0.8 × 10
−6 m/s at 289 K.
It is of interest to compare intraparticle diffusivities of isooctane in the FAU/EMT intergrowth with the corresponding diffusivities in the pure FAU and pure EMT zeolites. Clearly, in the particles of the pure zeolites there is no intergrowth of different zeolite types and no corresponding transport barriers at the interfaces between alternating FAU and EMT blocks. PFG NMR diffusion measurements of isooctane diffusion in the pure zeolites were performed using the 13-interval PFG NMR. The results of these measurements are shown in
Table 4. These values were obtained in the same way as discussed above by fitting the measured PFG NMR curves using Equation (1) with
n = 2 for a transition range between the intraparticle and long-range diffusion. The data for the pure zeolites were obtained at the same or comparable temperatures as those used in the studies of the FAU/EMT intergrowth. In all cases no dependence of the intraparticle diffusivities on diffusion time was observed for the pure zeolite samples. The lack of such dependence indicates that for the measured range of the root MSDs there are no significant diffusion restrictions by transport barriers inside the particles of the pure zeolite samples. The isooctane diffusivity in the FAU-type zeolite was found to be in a good agreement with the previously reported data [
23].The effective intraparticle diffusivities of isooctane in the FAU and EMT samples were found to be significantly higher than that in the FAU/EMT intergrowth for large diffusion times at 264 K (compare data in
Table 2 and
Table 4). Clearly, this is in agreement with the conclusion that the isooctane diffusion in the FAU/EMT intergrowth at 264 K is strongly influenced by the intraparticle transport resistances resulting in lower effective intraparticle diffusivities in the intergrowth in comparison to those in the pure zeolites.
Table 4.
Intracrystalline diffusivities of isooctane in the FAU and EMT zeolites. The diffusivities were obtained for the shown range of the effective diffusion times and the corresponding values of the root MSD by fitting the measured PFG NMR attenuation curves using Equation (1) with n = 2.
Table 4.
Intracrystalline diffusivities of isooctane in the FAU and EMT zeolites. The diffusivities were obtained for the shown range of the effective diffusion times and the corresponding values of the root MSD by fitting the measured PFG NMR attenuation curves using Equation (1) with n = 2.
| Sample | T (K) | D (m2·s−1) | teff (ms) | Root MSD (µm) |
|---|
| FAU loaded with isooctane | 266 | (3.7 ± 0.7) × 10−12 | 9.5–39.5 | 0.5–0.9 |
| EMT loaded with isooctane | 264 | (1.7 ± 0.3) × 10−12 | 9.2–39.2 | 0.3–0.6 |
It is quite likely that the intraparticle transport barriers, which are reported in this paper, are located at the interfaces between intergrowth components of the FAU/EMT intergrowth. Similar intracrystalline transport barriers were observed previously in other zeolite types [
13,
14,
15,
16]. It can be assumed that the reason for the existence of the barriers is a partial blockage of the channel openings at the interfaces. Such assumption is in agreement with the observed reduction of the influence of the transport barriers on the overall diffusion process due to temperature increase. In the opposite case of temperature independent transport barriers a few channel or pore openings are expected to be free of any defects, while the remaining openings are completely blocked for diffusing molecules [
24,
25].
The data in
Table 4 show that the value of the intraparticle diffusivity of isooctane in the FAU zeolite is approximately a factor of two higher than that in the EMT zeolite. This observation correlates with the fact that the size of the channels connecting cages is somewhat smaller in the latter zeolite than in the former [
10]. For relatively bulky molecules, including isooctane, such difference in the channel sizes can be a reason of a slower diffusion in the EMT zeolite in comparison to that in the FAU zeolite.


