Transcriptomic and Metabolomic Analysis of the Heat-Stress Response of Populus tomentosa Carr.
by
 and
and
Shixiong Ren
1, 
Kaibiao Ma
1,
Zhaogeng Lu
1,
Gang Chen
2,
Jiawen Cui
1,
Peixi Tong
1,
Li Wang
1,
Nianjun Teng
3 and
Biao Jin
1,* 1
College of Horticulture and Plant Protection, Yangzhou University, Yangzhou 225009, China
2
College of Bioscience and Biotechnology, Yangzhou University, Yangzhou 225009, China
3
College of Horticulture, Nanjing Agricultural University, Nanjing 210095, China
*
Author to whom correspondence should be addressed.
Forests 2019, 10(5), 383; https://doi.org/10.3390/f10050383
Submission received: 4 March 2019
/
Revised: 19 April 2019
/
Accepted: 25 April 2019
/
Published: 30 April 2019
(This article belongs to the Section Forest Ecophysiology and Biology)
Abstract
:Plants have evolved mechanisms of stress tolerance responses to heat stress. However, little is known about metabolic responses to heat stress in trees. In this study, we exposed Populus tomentosa Carr. to control (25 °C) and heat stress (45 °C) treatments and analyzed the metabolic and transcriptomic effects. Heat stress increased the cellular concentration of H2O2 and the activities of antioxidant enzymes. The levels of proline, raffinose, and melibiose were increased by heat stress, whereas those of pyruvate, fumarate, and myo-inositol were decreased. The expression levels of most genes (PSB27, PSB28, LHCA5, PETB, and PETC) related to the light-harvesting complexes and photosynthetic electron transport system were downregulated by heat stress. Association analysis between key genes and altered metabolites indicated that glycolysis was enhanced, whereas the tricarboxylic acid (TCA) cycle was suppressed. The inositol phosphate; galactose; valine, leucine, and isoleucine; and arginine and proline metabolic pathways were significantly affected by heat stress. In addition, several transcription factors, including HSFA2, HSFA3, HSFA9, HSF4, MYB27, MYB4R1, and bZIP60 were upregulated, whereas WRKY13 and WRKY50 were downregulated by heat stress. Interestingly, under heat stress, the expression of DREB1, DREB2, DREB2E, and DREB5 was dramatically upregulated at 12 h. Our results suggest that proline, raffinose, melibiose, and several genes (e.g., PSB27, LHCA5, and PETB) and transcription factors (e.g., HSFAs and DREBs) are involved in the response to heat stress in P. tomentosa.
1. Introduction
Climate change has increased the frequency of extreme high temperatures worldwide [1]. High temperature (HT) is a major environmental stress that limits plant growth, metabolism, and productivity. As sessile organisms, plants have developed complex and diverse systems to respond to high temperatures [2]. For example, plants use antioxidants to alleviate oxidative stress by scavenging excess reactive oxygen species (ROS) and change osmotic stress by accumulating osmoregulatory metabolites such as proline, glycine, betaine, and soluble sugars (e.g., sucrose, glucose, and galactose) [3]. In addition, plants can respond to heat stress by a wide range of transcriptional changes and produce heat-shock proteins (HSPs) to maintain cellular homeostasis [4] and improve heat tolerance. Therefore, transcriptomic studies have been used to identify heat responsive transcripts in many plants, such as tomato [5], grapevine [6], rice [7], and Arabidopsis [8].
Different from transcriptomics, metabolomics can directly exhibit the metabolite changes induced by stress. Metabolomics has been applied to explore the metabolites involved in heat-stress regulation in plants, such as Arabidopsis [9], tomato [10], maize [11], and wheat [12]. Some soluble sugars (sucrose, glucose, galactinol, raffinose) and organic acids (citric acid, fumaric acid, malic acid, ferulic acid) were identified as products or regulators in heat-stress response pathways [9,12]. Furthermore, transcriptomics in combination with metabolomics has been applied in rice to investigate the regulatory networks involved in the response to heat stress [13]. This has enabled elucidation of the gene-to-metabolite pathways associated with heat stress in plants.
Poplar, a model woody plant, has been the focus of several transcriptomic studies on the influence of abiotic stresses, including salinity [14], heat [15,16], drought [17], and heat and drought [18,19]. The response of poplar to heat stress is essential for studying tree response to the future hot waves predicted by climate change. Song et al. [16] identified photosynthesis recovery genes in heat-stressed Populus simonii Carr.by microarray expression profiling. Chen et al. [15] investigated the global transcriptome of heat-stressed Populus euphratica Oliv. In addition, Jia et al. identified the genes involved in the heat-stress response of P. alba × P. tremula var. glandulosa saplings [18] and overlapping heat-/drought-responsive genes in P. simonii cuttings at 30 °C [19]. However, despite the importance of metabolic changes in the heat-stress response, no metabolomics study in poplar has been reported. Particularly, an integrated metabolomic and transcriptomic analysis can provide comprehensive information on the molecular regulatory networks involved in the response to heat stress. Populus tomentosa, an economically important tree species, is widely distributed in China [20]. It is fast growing and highly resistant to environmental stresses, especially to high temperature stress. However, how it responses to heat stress is largely unknown. Since high temperature could significantly affect photosynthesis and respiration, many related metabolites or genes might be involved in these biological processes. Therefore, we hypothesized that (i) high temperature would cause significant changes in some metabolites in P. tomentosa, and (ii) these changes are regulated by some responsive genes or transcription factors.
To test our hypotheses, we performed an integrated transcriptomic and metabolomic analysis of the response to heat stress in P. tomentosa leaves, and evaluated the associated morphological, physiological, biochemical, and molecular changes. Our findings provide important information to elucidate potential mechanisms in multi-level responses to heat stress conditions in poplars.
2. Materials and Methods
2.1. Plant Materials and Treatments
This study was performed at Yangzhou University (32.39°N, 119.42°E) in China. P. tomentosa seeds (from the same tree) were collected on May 30, 2016. Seeds were germinated in containers with peat (65 × 65 × 75 mm; 4–6 seeds per pot). After 15 days, seedlings were transplanted to pots (diameter, 16 cm top and 13 cm bottom; height, 17.5 cm; one seedling per pot) filled with a mixture of vermiculite and peat (1:1, v/v), and were regularly watered under natural conditions for 2 months.
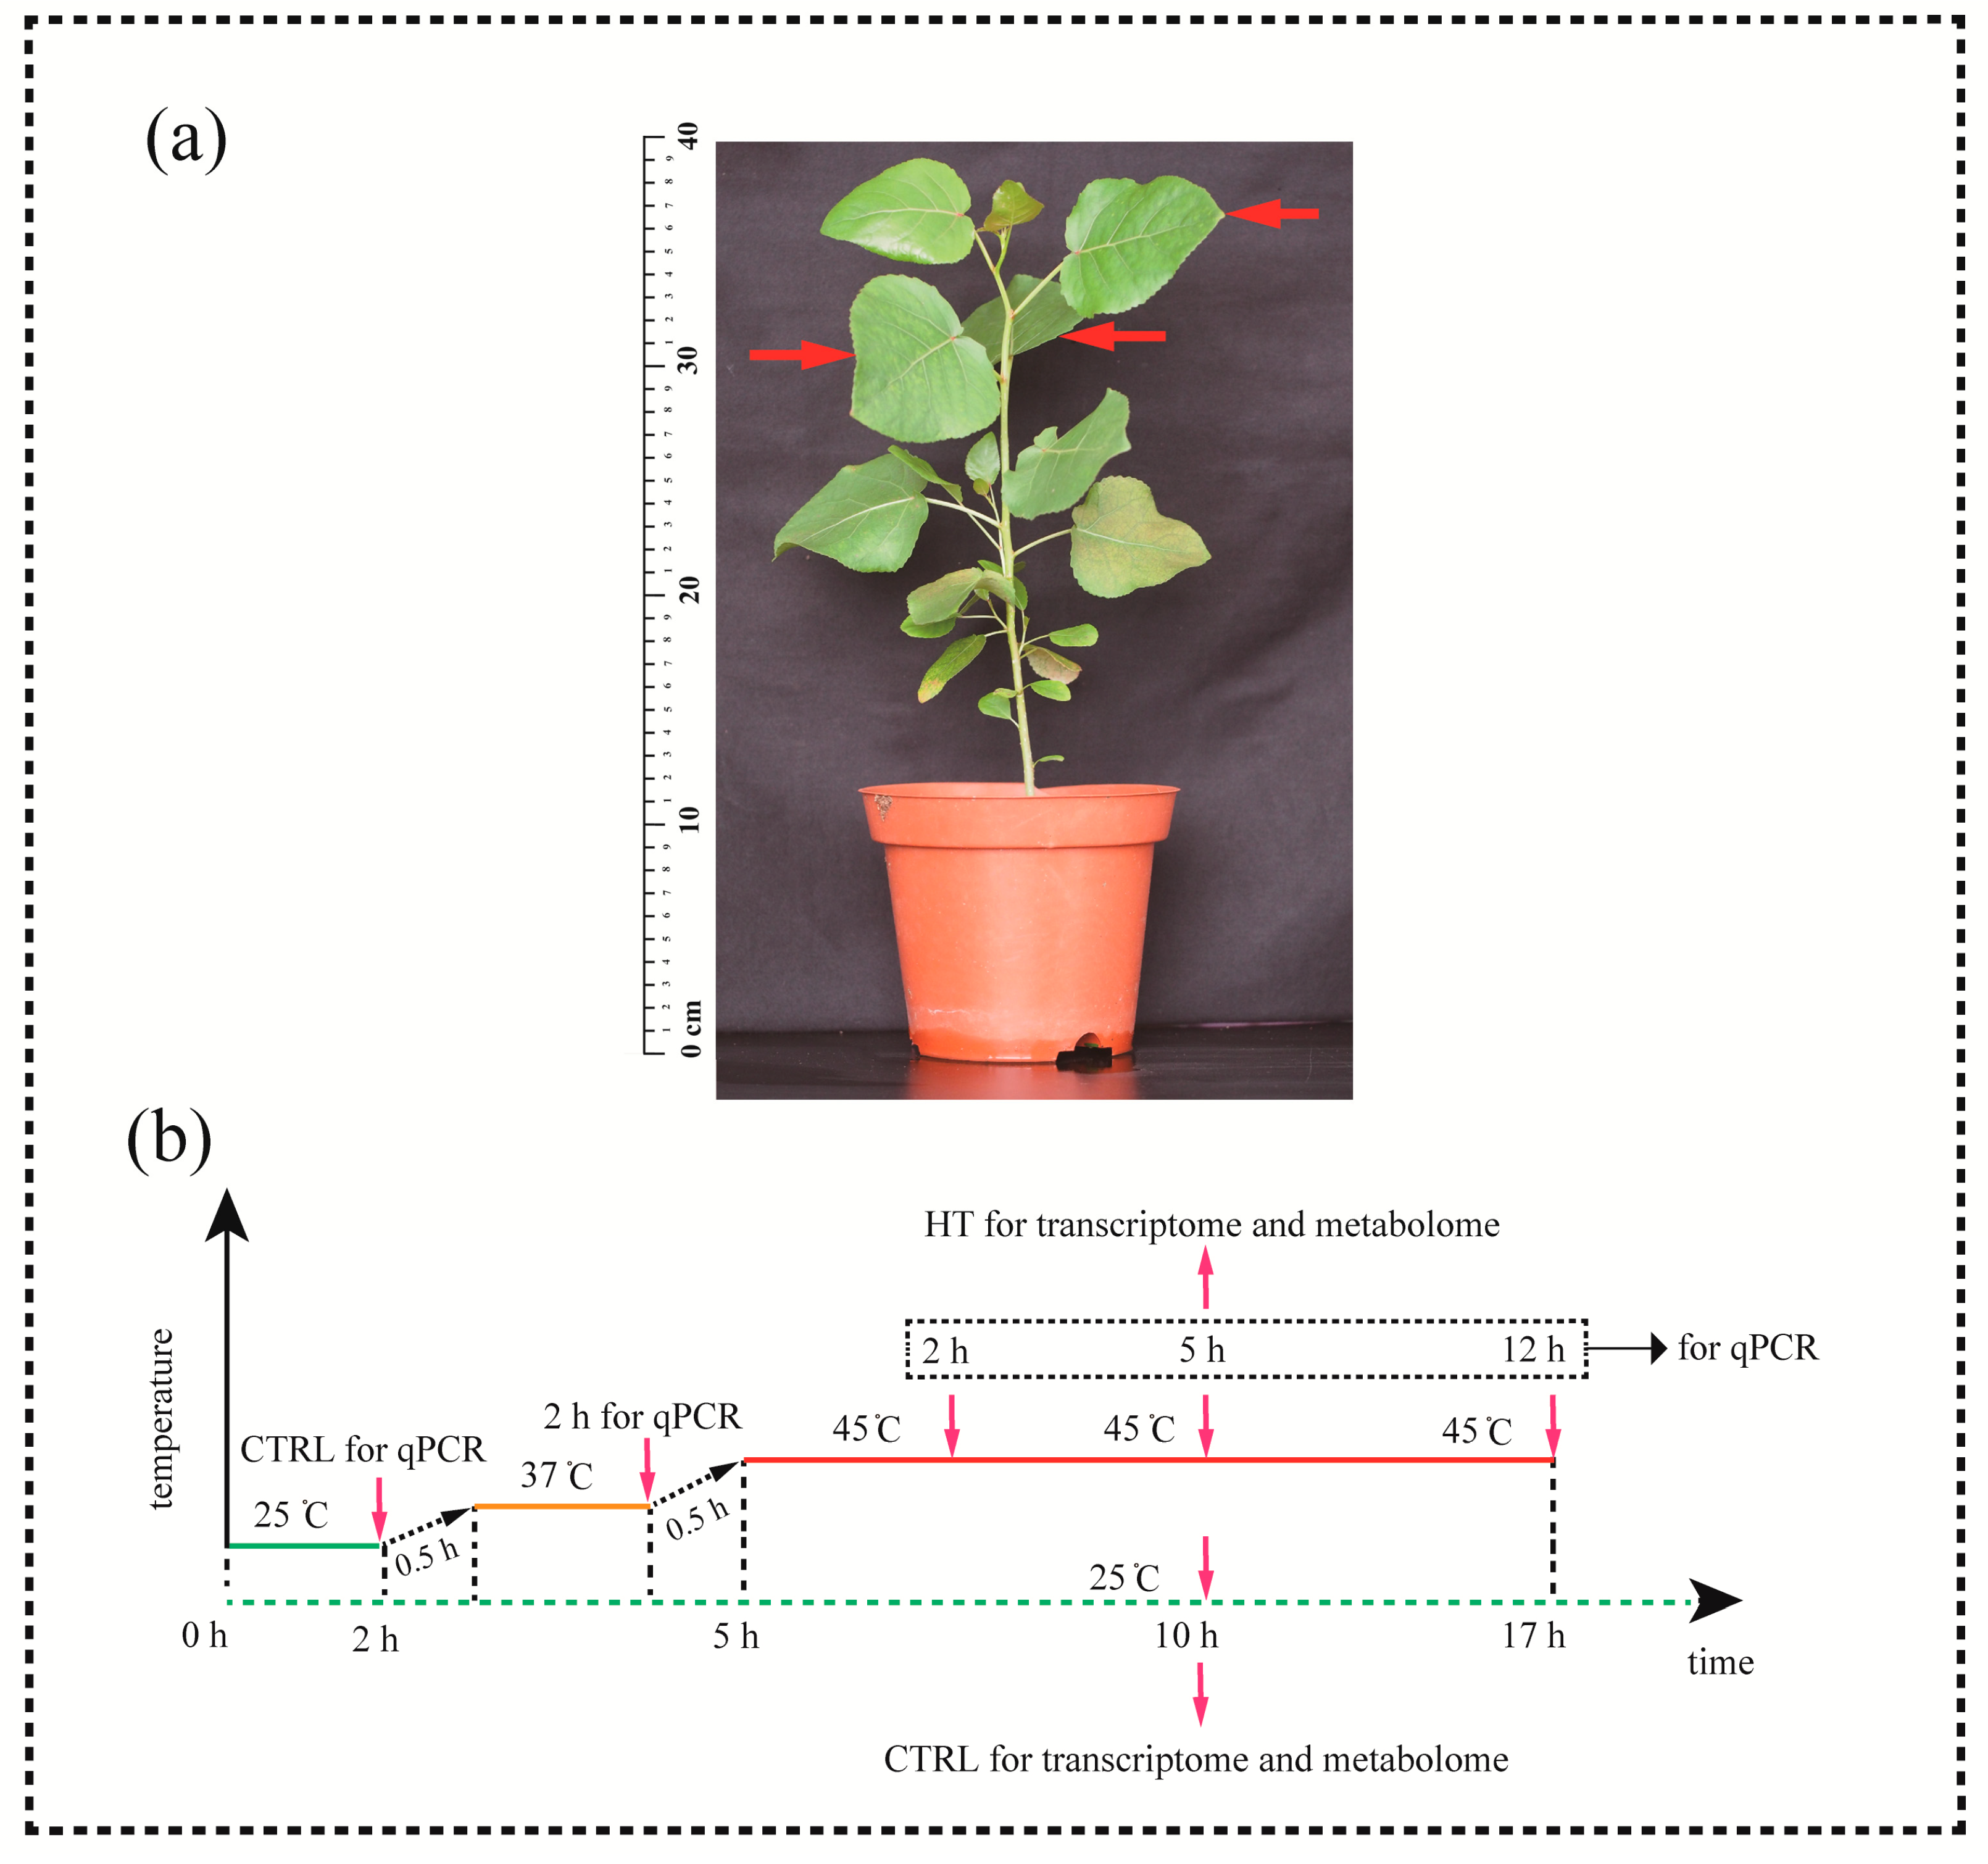
Healthy seedlings (height, ~30 cm) were divided into control and heat-stress groups (Figure 1a). The seedlings were grown in growth chambers (RXZ-300B, Ningbo Dongnan Instruments Co. Ltd., Ningbo, China; photoperiod, day 25 °C for 16 h/night 20 °C for 8 h; light intensity, 350 μmol m−2 s−1 provided by fluorescent tubes in the day) for seven days for adaptation. Relative humidity (RH) was maintained at 80%–90%.
Plants in the heat-stress groups were subjected to elevated temperatures in growth chambers during the day photoperiod. The treatment timeline: 25 °C, 2 h (control [CTRL] for qPCR); 25 °C→37 °C, 0.5 h; non-lethal temperature (37 °C, 2 h); 37 °C→45 °C, 0.5 h; and at 45 °C for 5 h (Figure 1b; red arrows indicate sampling time points). Plants in the CTRL groups for transcriptome and metabolome were grown in growth chambers at 25 °C for 10 h (Figure 1b). This temperature setting was designed mainly according to the previous research in poplar responses to heat stress [15]. The third to fifth leaves below the apical bud were sampled from saplings (Figure 1b; red arrows). The leaves were snap-frozen in liquid nitrogen and stored at −80 °C for further analysis.
2.2. RNA Isolation and Illumina Sequencing
Total RNA was extracted from the CTRL and heat-stressed leaves (three biological replicates each) using the MiniBEST Plant RNA Extraction Kit (TaKaRa, Dalian, China). RNA concentration and integrity were evaluated using the Qubit RNA Assay Kit and Qubit 2.0 Fluorometer (Life Technologies, Carlsbad, CA, USA) and the RNA Nano 6000 Assay Kit of the Bioanalyzer 2100 system (Agilent Technologies, Santa Clara, CA, USA), respectively. Sequencing libraries were generated using the NEBNext Ultra RNA Library Prep Kit for Illumina (New England Biolabs, Ipswich, MA, USA) in accordance with the manufacturer’s instructions, and mRNA was purified from total RNA using poly-T oligo-attached magnetic beads. cDNA synthesis was subsequently performed as described previously [21]. RNA sequencing was performed on the Illumina Hiseq 4000 platform. A Perl script was used to remove raw reads containing adapter sequences, poly-N, and low quality reads (>10% unknown nucleotides). The clean reads were mapped to the Populus trichocarpa Torr. & Gray reference genome ([22]) using TopHat v2.0.12. HTSeq v0.6.1 was used to determine the read count of each gene, and gene expression levels were estimated as fragments per transcript kilobase per million fragments mapped (FPKM) values [23]. Differentially expressed genes (DEGs) were defined as those with an adjusted q-value < 0.05 and a |log2 fold-change| > 1, as determined by DESeq.
The sequencing data have been deposited in the Gene Expression Omnibus (GEO) database under accession number GSE124805.
Gene ontology (GO) enrichment analysis of DEGs was carried out with the GOseq R package [24]. All DEGs were assigned to pathways of the KEGG database, and their enrichment in DEGs was assessed using KOBAS software [25]. Corrected p-values (q-values) <0.05 were considered indicative of terms or pathways significantly enriched in DEGs.
2.3. Metabolite Preparation
Leaf tissue samples (0.06 g) were added to 2 mL EP tubes, soaked in 0.48 mL of extraction solvent (methanol:H2O, 3:1) with 24 μL (2 mg/mL) of adonitol as an internal standard. Extractions were uniformed in a ball mill for 4 min at 50 Hz, followed by ultrasonication for 5 min in ice water and centrifugation for 15 min at 13,000 rpm and 4 °C. Next, 0.35 mL of supernatant was transferred to a fresh 2 mL GC/MS glass flask and dried in a vacuum concentrator without heating.
The dried metabolites were added to 80 μL of methoxy amination hydrochloride (20 mg/mL in pyridine) and incubated for 30 min at 80 °C. Next, 100 μL of the BSTFA regent (1% TMCS, v/v) were added to the samples, followed by incubation for 1.5 h at 70 °C and blending for GC/TOF-MS analysis.
2.4. Metabolomic Analysis
GC/TOF-MS analysis was performed on an Agilent 7890 gas chromatograph, connected to a Pegasus HT time-of-flight mass spectrometer. The GC was equipped with a DB-5MS capillary column (5% diphenyl, 95% dimethyl polysiloxane). Helium was used as the carrier gas at a constant flow rate of 1 mL min−1 with a splitless injector (1 μL aliquot of the analyte). The temperature was 50 °C for the first minute, followed by an increase to 310 °C at 10 °C/min over 26 min, and a hold at 310 °C for 8 min. The temperatures of the injection, transfer line, and ion source were set at 280, 270, and 220 °C, respectively. The energy was −70 eV in electron-impact mode. MS data were acquired in full-scan mode at 50–500 m/z at a rate of 20 spectra per second after a solvent delay of 460 s.
Chroma TOF 4.3X software and the LECO-Fiehn Rtx5 database (LECO Corporation, St. Joseph, MI, USA) were used for raw peak extraction, data baseline filtering, baseline calibration, peak alignment, deconvolution analysis, peak identification, and peak-area integration [26]. The retention time index (RI) method was used for peak identification, with an RI tolerance of 5000.
The variable importance in the projection (VIP) values of the first principal component >1 combined with Student’s t-test (p < 0.05) were used to screen metabolites (each treatment involved at least six biological replicates).
2.5. Scanning Electron Microscopy
Small strips (approximately 0.5 × 0.5 cm) were sheared from the areas between the margin and midrib of fresh leaves, rapidly fixed in 2.5% glutaraldehyde at 4 °C for 24 h, and dehydrated in an ethanol series (30% to 100%). The samples were subjected to automatic critical point drying (Leica, Wetzlar, Germany). The dried samples were mounted in metal stubs and sputter coated (Bal-Tec, Balzers, Switzerland) with a thin conductive film of gold. The coated samples were examined and photographed using scanning electron microscopy (SEM) (Hitachi High-Technologies Corporation, Tokyo, Japan) at 15.0 kV [27]. The average area of stomatal opening was calculated from at least 40 stomata using ImageJ software (V1.51; National Institutes of Health, Bethesda, MD, USA).
2.6. Assay of Antioxidant Enzyme Activity
Fresh leaves were sampled and ground to a fine powder in liquid nitrogen. Samples (0.1 g) were mixed with distilled water (1 mL) in an ice bath, centrifuged at 8000× g for 10 min at 4°C, and the supernatants were used for further experiments. The activities of superoxide dismutase (SOD), catalase (CAT), and peroxidase (POD) were measured using commercial kits (Suzhou Comin Bioengineering, Suzhou, China). Each sample comprised three to five leaves to ensure a sufficient quantity of leaf tissue, and three biological replicates per treatment were performed.
SOD activity was measured using the nitro-blue tetrazolium (NBT) method [28]. SOD can scavenge the superoxide anion radical (O2−), which is generated from xanthine morpholine by xanthine oxidase, and O2− reduces NBT, as indicated by observing absorbance at 560 nm after 30 min. CAT and POD activity assays were performed in a water bath at 25 °C for 10 min and the absorbance of H2O2 was read at 240 and 470 nm, respectively.
2.7. Soluble Sugar and Soluble Protein Assays
Samples (0.1 g) were mixed with 1 mL distilled water in plastic centrifuge tubes and transferred to a water bath for 10 min at 95 °C. After cooling, the samples were centrifuged at 8000× g at 25 °C for 10 min. The supernatants were transferred to 10 mL tubes and the volume equalized to 10 mL with distilled water. The soluble sugar concentration was determined by anthrone colorimetry using a commercial kit (Suzhou Comin Bioengineering, Suzhou, China).
Samples (0.1 g) were mixed with 1 mL distilled water in an ice bath, and centrifuged at 8000× g and 4 °C for 10 min. The soluble protein concentration was determined using the Coomassie Brilliant Blue method with a commercial kit (Suzhou Comin Bioengineering). Each treatment involved at least three biological replicates.
2.8. H2O2 Assay
Samples (0.1 g) were mixed with 50 mmol·L−1 phosphate buffer (0.9 mL) in an ice bath, and centrifuged at 10,000× g for 10 min at 4° C. The H2O2 concentration was measured using a colorimetric method via a commercial kit (Nanjing Jiancheng Bioengineering Institute, Nanjing, China). Each treatment involved at least three biological replicates.
2.9. Real-Time Reverse Transcription PCR
To evaluate gene expression levels, we carried out quantitative reverse transcription-polymerase chain reaction (qRT-PCR). RNA samples (containing approximately 1 μg total RNA) were treated with gDNA Eraser to eliminate any contaminant gDNA, and RNA solution (20 μL) was subjected to reverse transcription with HiScript II Q Select RT SuperMix for qPCR (+gDNA wiper) following the manufacturer’s instructions (Vazyme, Nanjing, China). Primer 5.0 was used to design gene-specific primers, and actin2 was used as the internal reference gene. qRT-PCR was performed using a Bio-Rad CFX96 Real-Time System (Bio-Rad, Hercules, CA, USA) with the ChamQ SYBR qPCR Master Mix (Perfect Real Time) (Vazyme, Nanjing, China) commercial kit. The qRT-PCR conditions comprised an initial denaturation at 94 °C for 30 s, followed by 40 cycles of 95 °C for 10 s, 60 °C for 30 s, 95 °C for 15 s, 60 °C for 60 s, and a final 15 s at 95 °C. The 2−ΔΔCt comparative threshold cycle (Ct) method was used to evaluate gene expression levels. Bio-Rad CFX Manager v1.6.541.1028 software (Bio-Rad, Hercules, CA, USA) was used to calculate Ct values, and each reaction involved three biological replicates.
2.10. Statistical Analysis
The antioxidant enzyme activity, soluble sugar, soluble protein, H2O2, and qRT-PCR experiments were all repeated three times in our study. In stomatal variation experiment, we calculated 40 stomata randomly for each group. The experimental data between control and treatments were analyzed based on Student’s t-test at p less than 0.05 (SPSS 18.0 software for Windows) (SPSS, Chicago, IL, USA) [29].
3. Results
3.1. Stomatal Variation and Physiological Changes under Heat Stress
We used SEM to observe stomatal closure and opening. There was a marked difference in stomatal opening between 25 °C and 45 °C (Figure 2a–d). The area of stomatal opening at 45 °C (Figure 2b,d) was smaller than that at 25 °C (Figure 2a,c). Some stomata were almost fully closed under heat stress (Figure 2b, arrows). The average stomatal area decreased from 34.13 μm2 in the control to 23.32 μm2 under heat stress (a decrease of 31.67%) (Figure 2e).
Compared to the control, the total soluble sugar per unit leaf fresh weight was decreased by 32.11% in heat stress (p < 0.01) (Figure 3a), whereas the H2O2 concentration increased by about 16.22% (0.01 < p < 0.05) (Figure 3b). However, the soluble protein content did not differ significantly between the control and heat-stressed plants (Figure 3c). In addition, compared to the control, SOD and CAT activity were increased 130.51% (P < 0.01) and 43.52% (0.01 < P < 0.05), respectively, by heat stress (Figure 3d,e). Nonetheless, there was no significant difference in POD activity between the control and heat-stressed plants (Figure 3f).
3.2. Transcriptomic Changes in Response to Heat Stress
Using the Illumina HiSeq 4000 platform, we generated 73,405,830 and 73,497,212 raw reads from control and heat-stressed plants, respectively. After quality checks and data cleaning, we obtained 71,828,148 (control) and 70,418,198 (heat stress) clean reads (Table S1). The clean datasets were mapped to the P. trichocarpa genome; 87.60% (control) and 83.82% (heat stress) of the sequences could be aligned with the reference genome.
A total of 7738 DEGs between the control and heat-stressed plants were found. Among them, 3888 DEGs were upregulated and 3850 DEGs were downregulated in the heat-stressed relative to the control plants (Figure S1). The GO terms response to abiotic stimulus, response to heat, membrane-bounded organelle, chloroplast thylakoid, chloroplast stroma, and photosynthesis membrane (Figure S2a, arrows) were significantly enriched. The pyruvate metabolism, photosynthesis, pentose phosphate pathway, glycolysis/gluconeogenesis, arginine and proline metabolism, carbon metabolism, and carbon fixation in photosynthetic organisms Kyoto Encyclopedia of Genes and Genomes (KEGG) pathways were significantly enriched in DEGs (Figure S2b, arrows). Some important DEGs and were listed in Table S2, and DEGs more than 1.5-log2 fold change were listed in Table S3.
3.3. Genes Associated with Photosynthesis and Respiration
Photosynthesis is a heat-sensitive process. Accordingly, we performed KEGG and GO enrichment analyses to identify genes associated with the photosynthetic electron transport system. Compared to the control, the majority of DEGs related to photosynthesis electron flow were significantly downregulated by heat stress (Figure 4a), including nine DEGs related to photosystem I (PSI), seven related to photosystem II (PSII), two DEGs encoding cytochrome b6f complex, two DEGs related to light harvesting complex II (LHC II), and four DEGs related to light harvesting complex I (LHC I). Among them, the expression of PSB27, PQL3, and PPD3 (PS II); PSAD, PSAG1, PSAG2, and PSAK (PS I); LHCB5 (LHC II), LHCA3, LHCA4, LHCA5, and LHCA6 (LHC I); and PETC were all 2-log-fold lower under heat stress (Figure 4a). The expression of PSB28 and PETB was also reduced under heat stress. Therefore, PS II and PS I were suppressed by heat stress. GO analysis showed that four DEGs related to NADH dehydrogenase activity and PETH1 and PETH2 (related to ferredoxin-NADP+ reductase activity) were downregulated by heat stress (Figure 4a). Additionally, four genes related to ATP synthesis-coupled electron transport were downregulated, and one (POPTR_0004s20010) was upregulated, by heat stress. Thus, the photosynthetic light reaction was inhibited by heat stress.
Regarding oxidative phosphorylation, compared to the control, 11 genes related to NADH dehydrogenase were downregulated by heat stress. NADUAFB1, for example, was 2.85-log-fold downregulated. Two DEGs (COX5B and COX6B) encoding cytochrome c oxidase were downregulated, as were eight DEGs related to F-type ATPase, indicating suppression of oxidative phosphorylation (Figure 4b).
3.4. Integrated Analysis of Osmotic and Resistant Substance Metabolism-associated Gene Expression and Metabolite Levels
The following KEGG pathways were enriched in DEGs under heat stress: valine, leucine, and isoleucine biosynthesis; galactose metabolism; and glycine, serine, and threonine metabolism (Figure 5a).
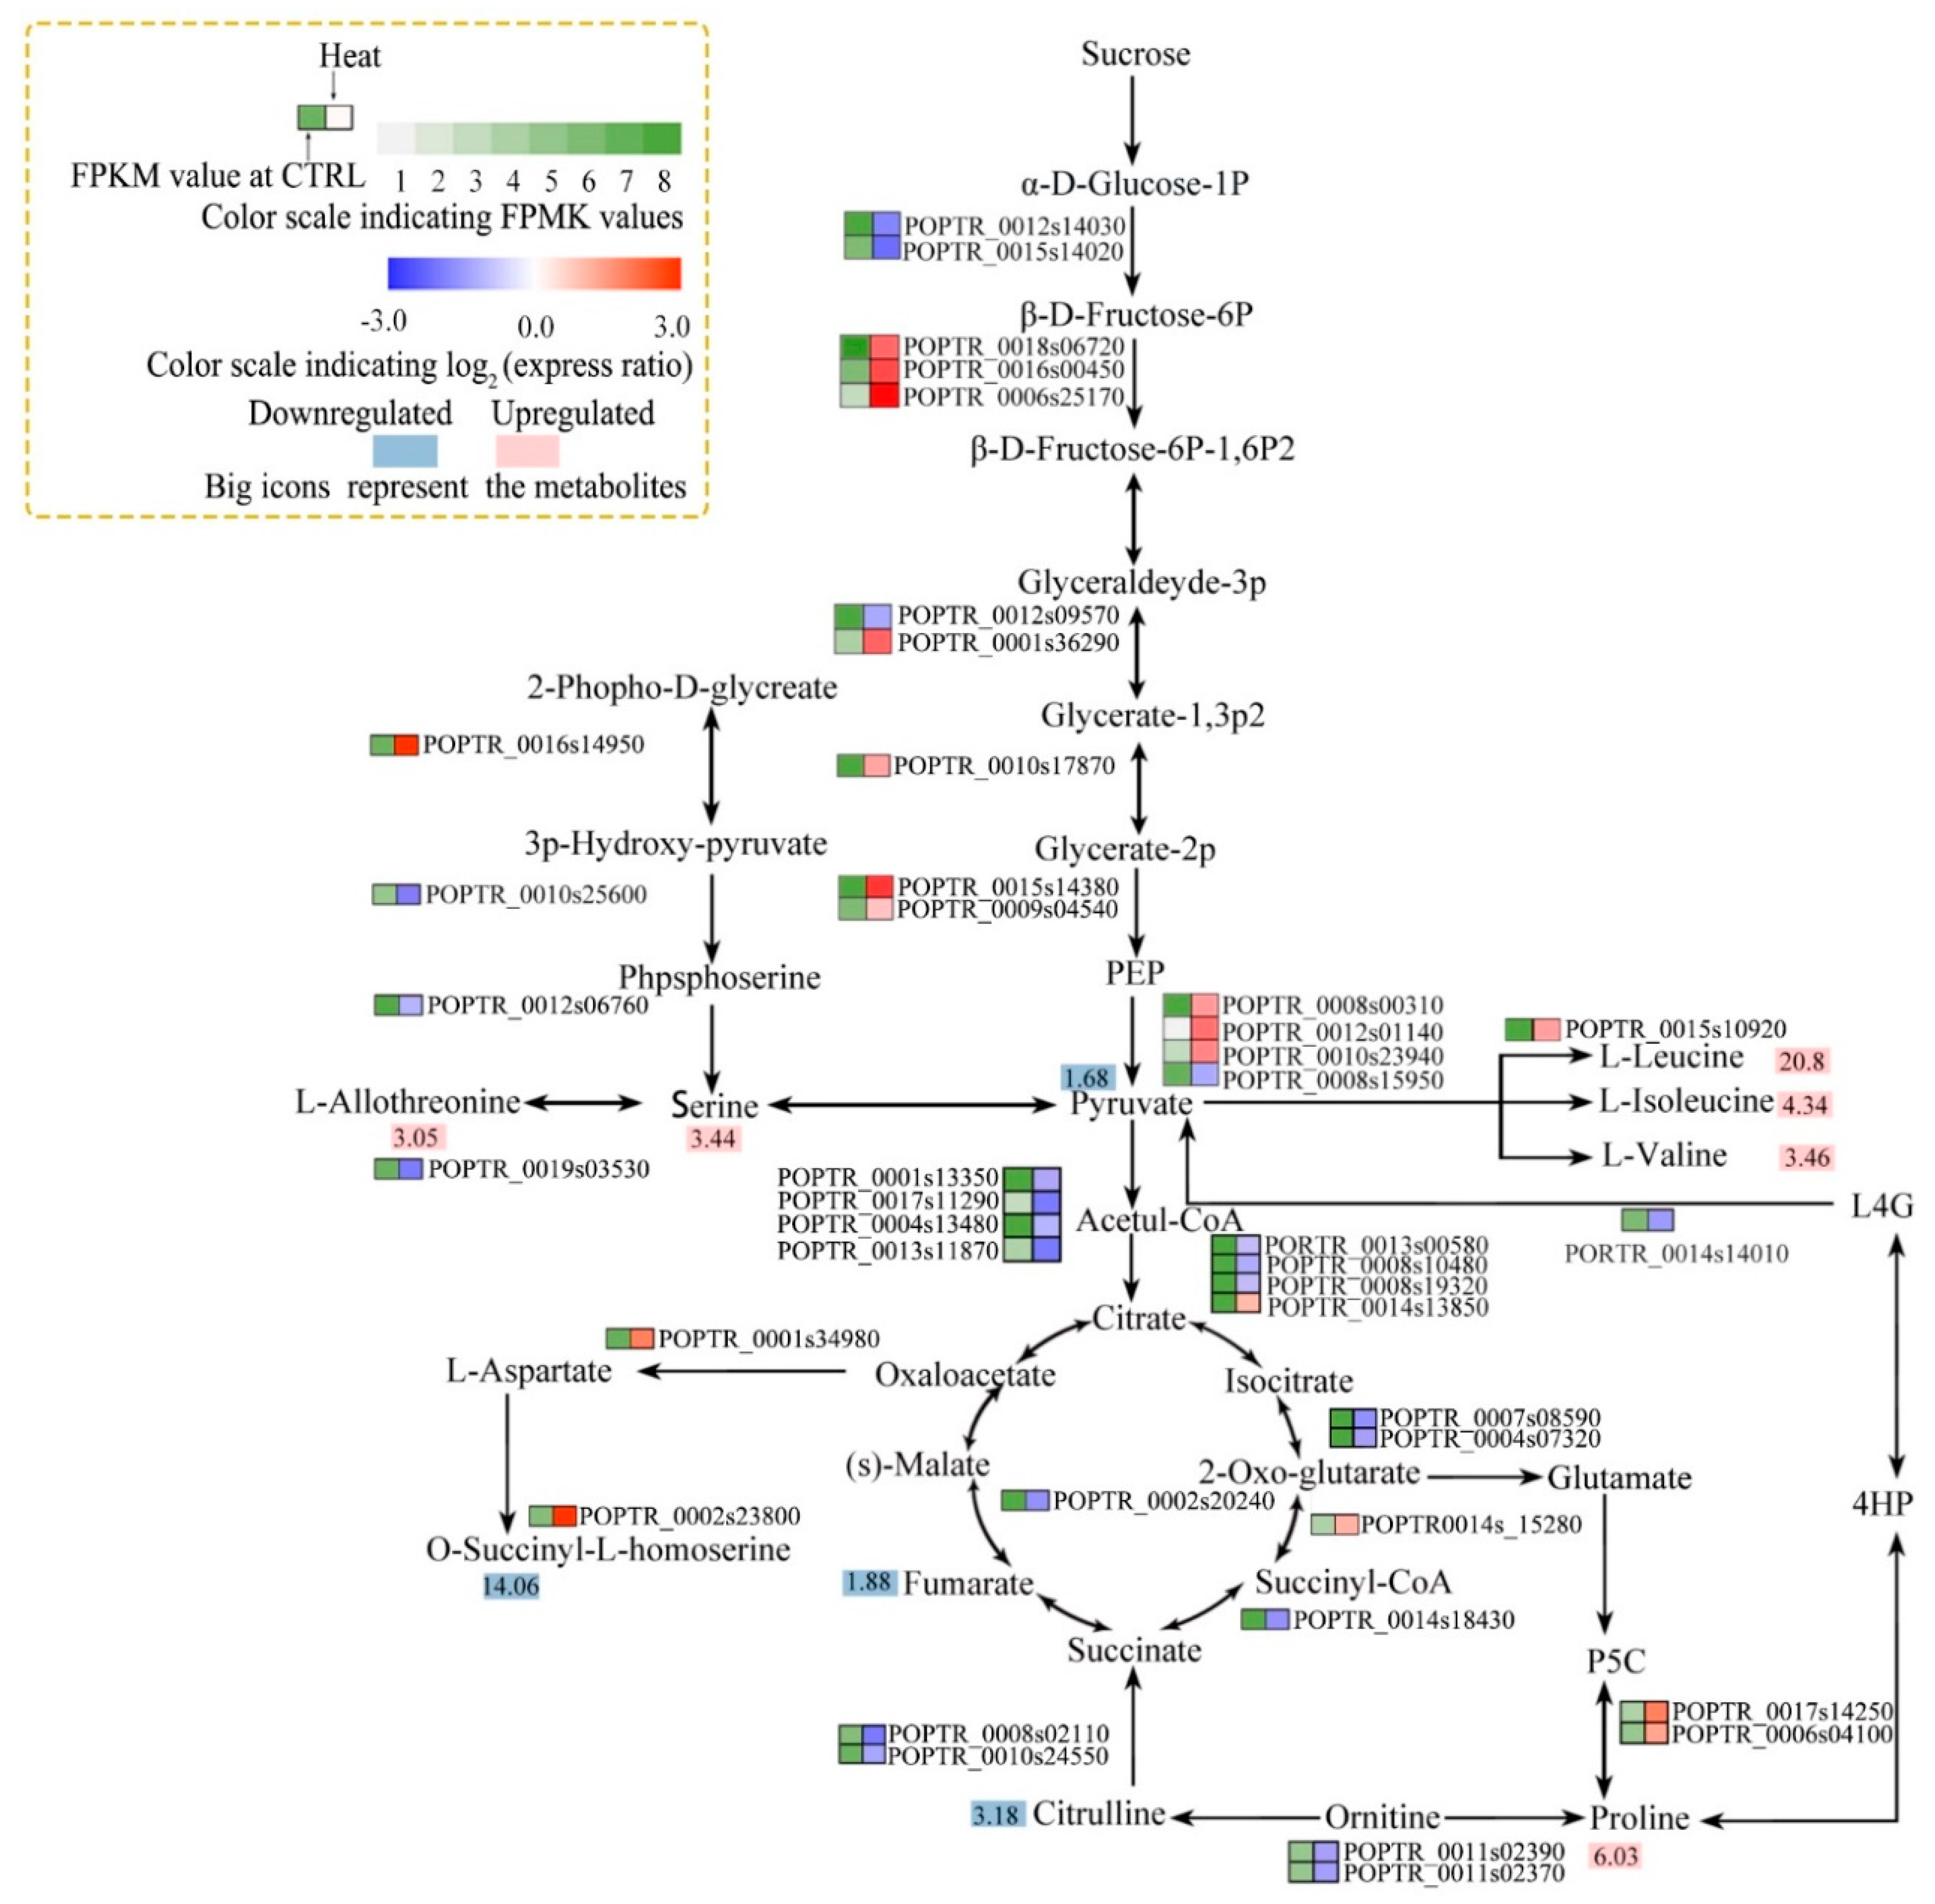
An association analysis between metabolite levels and gene expression detected seven integrative pathways (Figure 6; Figure 7): inositol phosphate metabolism; galactose metabolism; arginine and proline biosynthesis metabolism; glycine, serine, and threonine metabolism; glycolysis/gluconeogenesis; citrate cycle (TCA); and valine, leucine, and isoleucine biosynthesis.
In plants, carbohydrates and proline play key roles in the osmoregulatory response to stress. The levels of several carbohydrate conjugates (such as myo-inositol, galactinol, raffinose, and melibiose) and proline were significantly increased by heat stress (Figure 6). The genes encoding 1-L-myo-inositol-1-phosphate synthase and inositol-1-monophosphatase (in the inositol phosphate and galactose metabolism pathways) were significantly downregulated by heat stress (Figure 6). This was associated with reduced myo-inositol levels under heat stress (Figure 5b and Figure 6). Two DEGs related to galactinol (a metabolite of myo-inositol) synthesis and five DEGs related to raffinose synthesis were upregulated by heat stress. However, the melibiose level increased despite the downregulation of two related DEGs (Figure 6). The gene encoding 1-pyrroline-5-carboxylate synthetase (in the arginine and proline metabolism pathway) was upregulated and the proline content was increased 6.03-log-fold by heat stress (Figure 5b and Figure 7). The genes encoding phosphofructokinase, phosphoglyceratekinase, enolase, and pyruvatekinase (involved in glycolysis/gluconeogenesis) were upregulated by heat stress (Figure 7); however, two genes encoding phosphoglucomutase were downregulated. The genes encoding pyruvate dehydrogenase E1 component subunit beta-1, pyruvate dehydrogenase E1 component subunit beta-3, dihydrolipoamide acetyltransferase, isocitrate dehydrogenase, succinate-CoA ligase, fumarate hydratase, and ATP citrate lyase (TCA cycle) were downregulated, and that encoding aconitate hydratase was upregulated, by heat stress. This is consistent with the decreased pyruvate and fumaric acid levels under heat stress (Figure 5b and Figure 7). Finally, the valine, leucine, and isoleucine levels were significantly increased, and the gene encoding acetolactate synthase was upregulated, by heat stress (Figure 5b and Figure 7).
3.5. Transcription Factors Involved in Heat Treatment
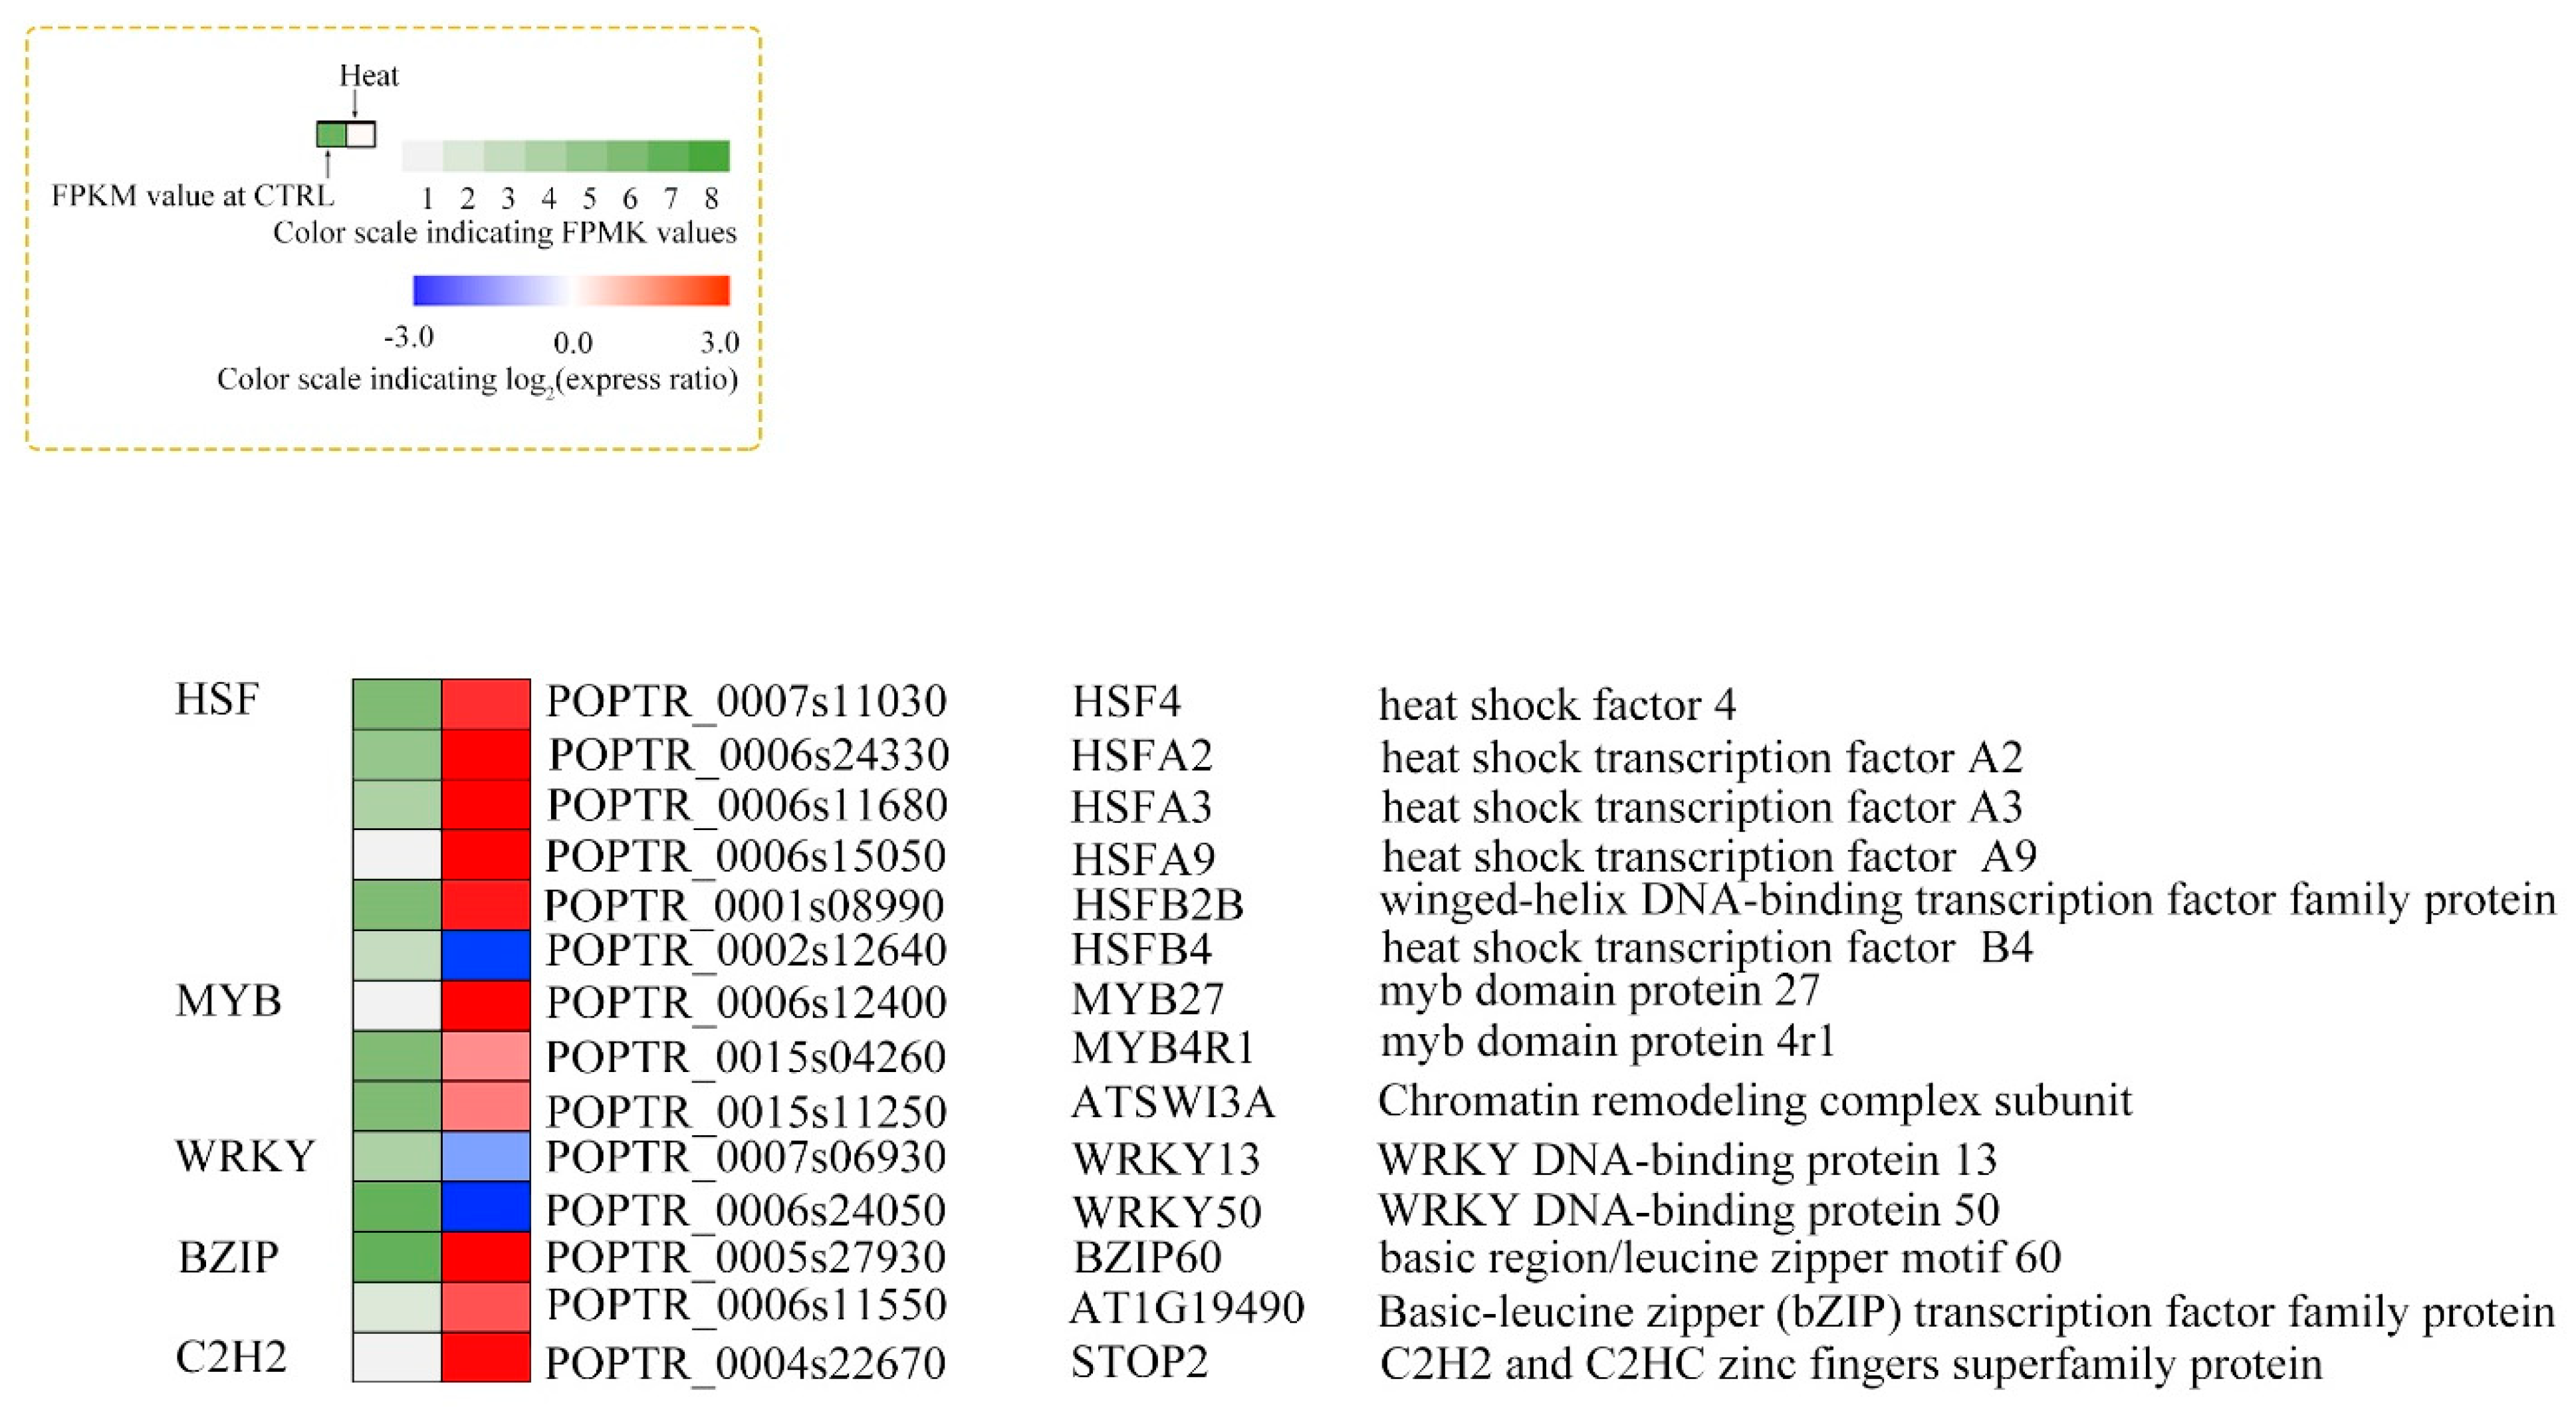
A total of 553 DEGs were identified as transcription factors (TFs) of 68 TF families (Table S4). We examined five of these TF families: HSFs, MYBs, WRKYs, BZIPs, and C2H2s.
The expression levels of HSFA9, HSFA3, HSFA2, and HSF4 were significantly upregulated by heat stress. In contrast, that of HSFB4 was significantly downregulated. Compared with the control, MYB27 and MYB4R1 were upregulated by heat stress. The genes encoding the WRKY50 and WRKY13 TFs were downregulated by heat stress. Notably, the gene encoding the C2H2 and C2HC zinc finger superfamily protein (STOP2) was upregulated by heat stress, as was bzip60 (Figure 8).
The responses of P. tomentosa to heat stress are summarized in Table 1.
3.6. Validation of Gene Expression by qRT-PCR
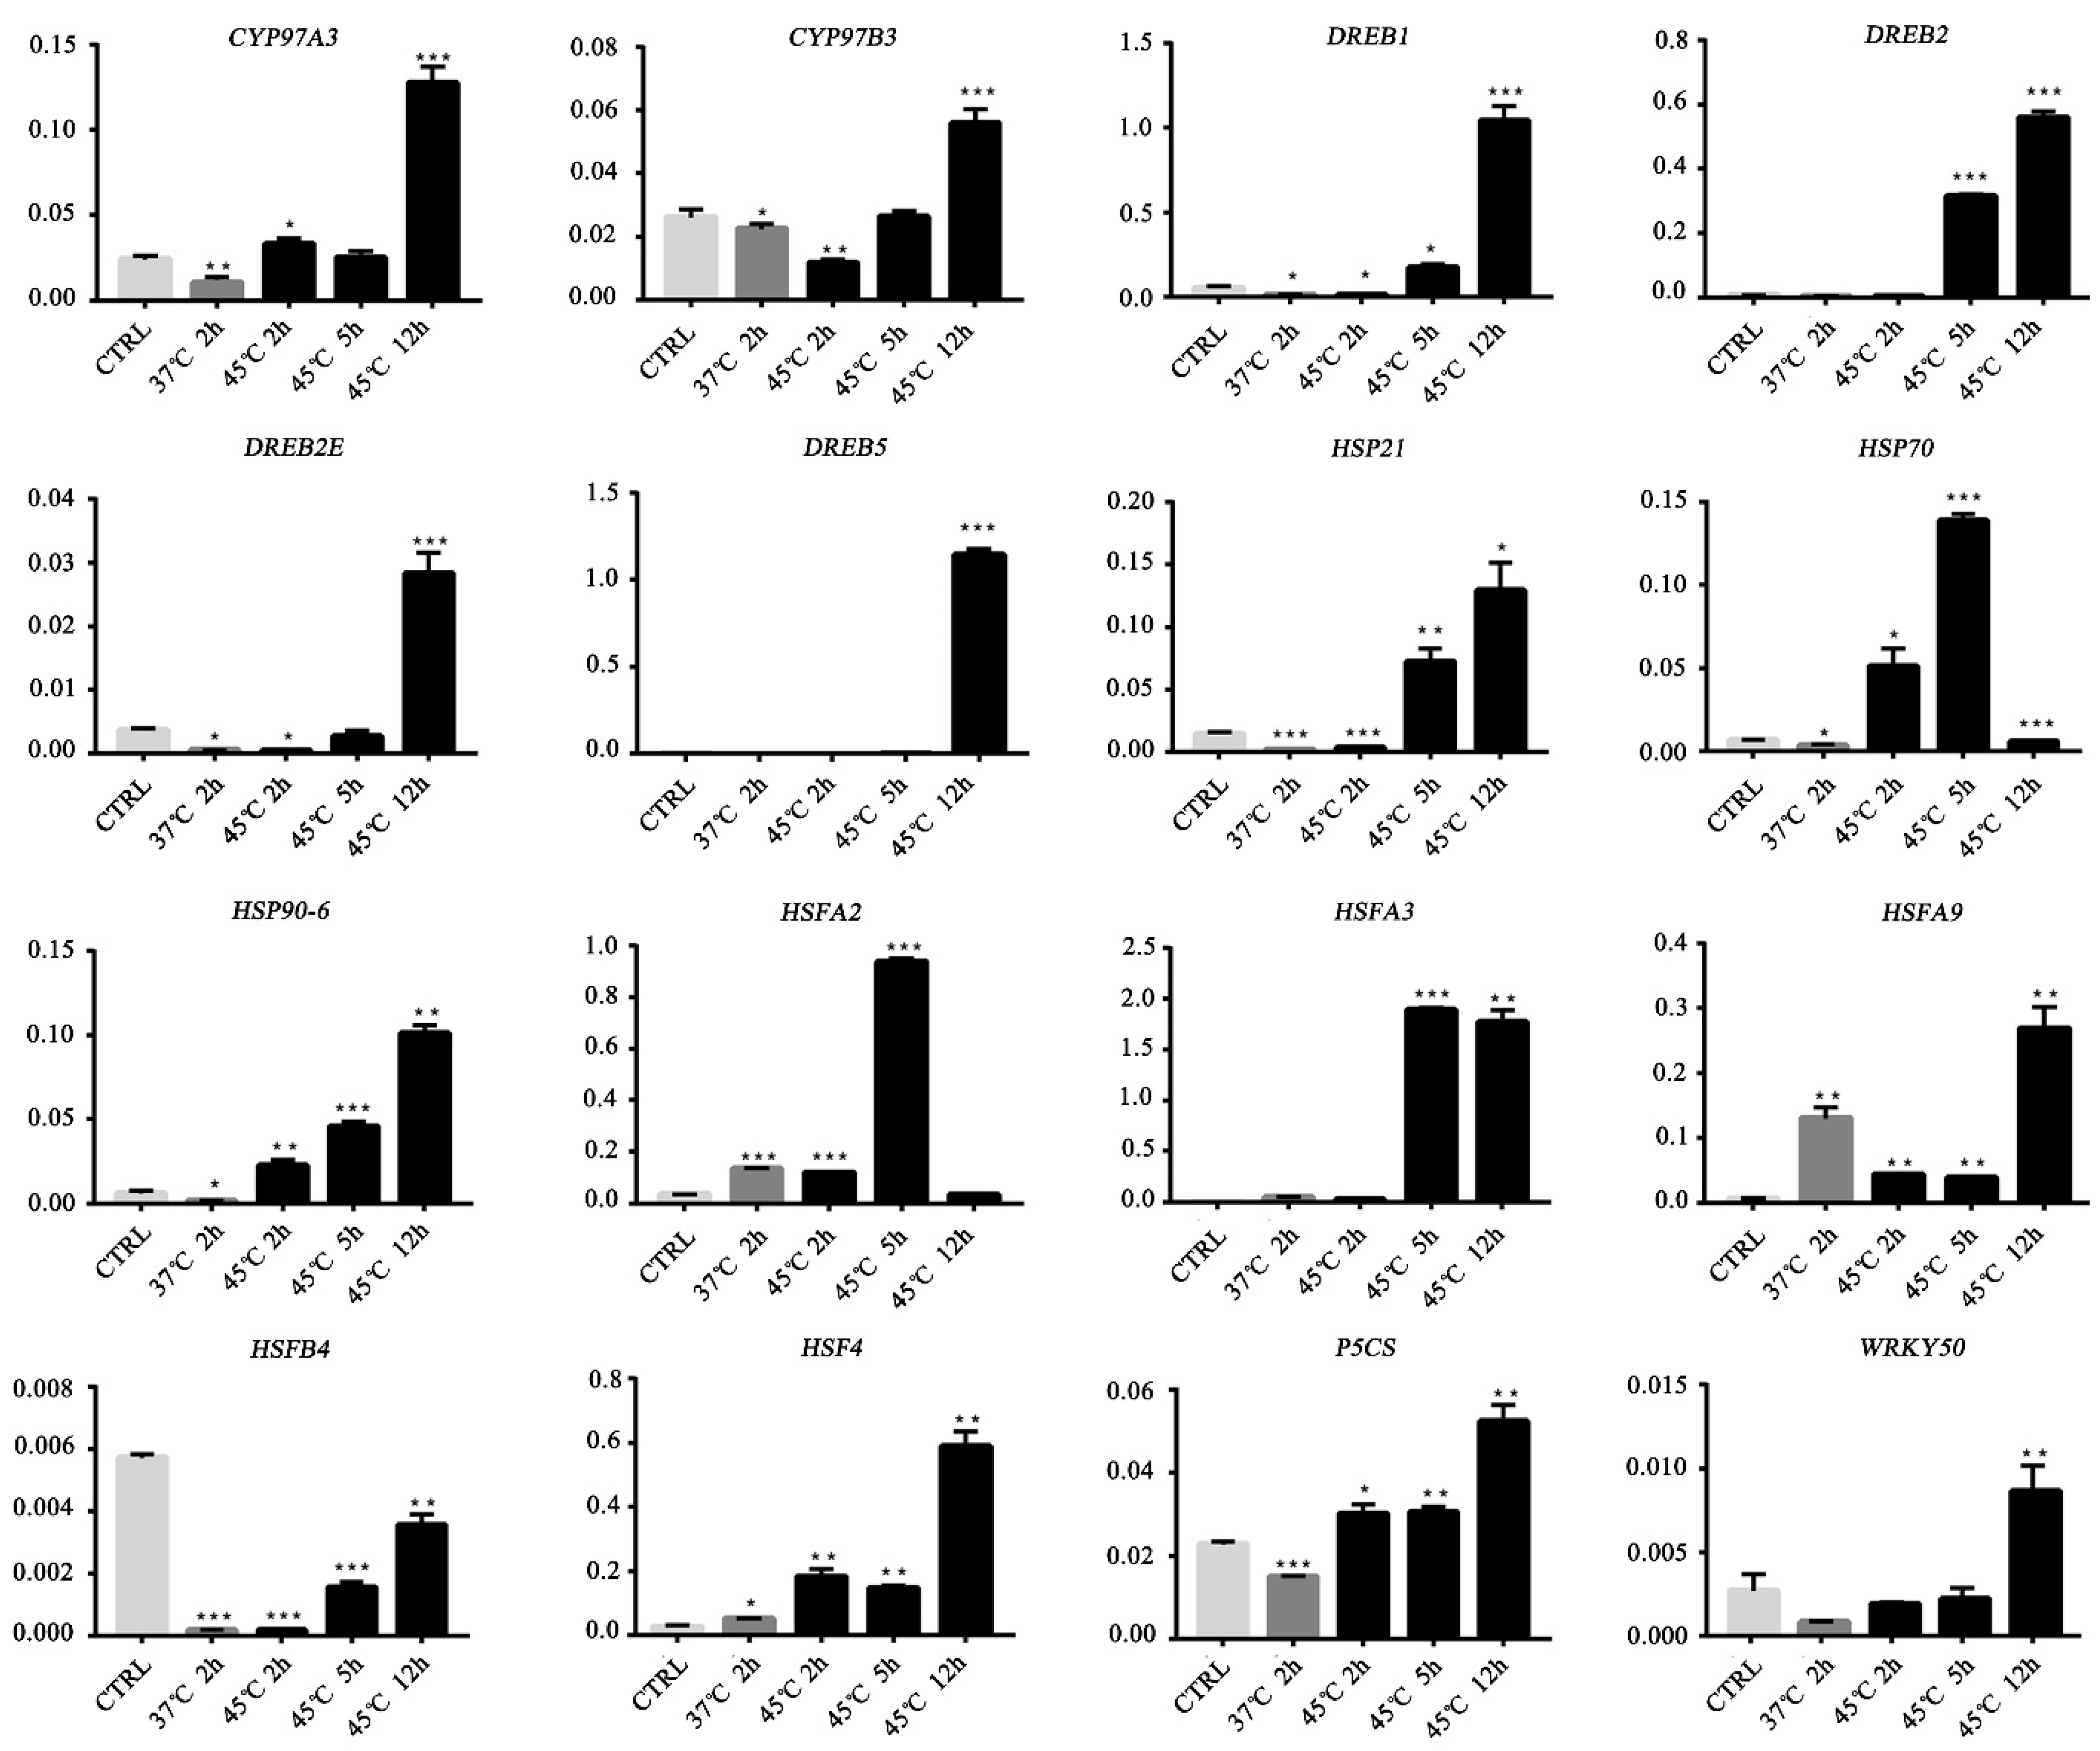
We verified the expression levels of 16 genes by qRT-PCR (Figure 9, Table S5). Compared with the control, HSF4 was significantly upregulated at four time points. The expression of CYP97A3, CYP97B3, DREB1, DREB2, DREB2E, DREB5, HSP21, HSP90-6, HSFA9, HSF4, HSFA3, P5CS, and WRKY50 peaked after 12 h at 45 °C. HSFA2 and HSFA9 were significantly upregulated after 2 h at 37 °C, whereas CYP97A3, CYP97B3, DREB1, DREB2E, HSP21 and HSFB4 were significantly downregulated. HSP70, HSP90-6, HSFA3, HSFA9, HSF4, and P5CS were upregulated after 5 h at 45°C. However, HSFB4 was significantly downregulated at four time points. The qRT-PCR data on 9 of the 12 genes detected were similar to the transcriptomic results; however, the expression levels of CYP97B3 and CYP97A3 were not significantly different between the control and heat-stressed plants (Figure 9).
4. Discussion
4.1. Effects of Heat Stress on Antioxidant Activity
Heat stress induces the production of reactive oxygen species (ROS) in plants [30]. However, if ROS production passes a threshold value, it can lead to oxidative damage. Thus, the oxidant–antioxidant balance is critical for plant survival. For example, corresponding, plants can increase their production of antioxidant enzymes such as SOD, POD, and CAT, which scavenge and remove ROS [31,32]. In this study, the production of H2O2 was increased under heat stress (45 °C), accompanied by a significant increase in the activity of SOD and CAT. Similar phenomena have been reported in other woody plants [33]. Nevertheless, a previous study in poplar reported no significant difference in the H2O2 level between ambient temperature (25 °C) and high temperature (30 °C), and SOD and CAT activity were decreased at 30 °C [18]. Because poplar is heat tolerant, the decreased activities of SOD and CAT suggest that exposure to 30 °C does not impose heat stress. However, exposure to 45 °C increased the activities of antioxidant enzymes, suggesting cellular damage and enhanced scavenging of ROS.
4.2. Effects of Heat Stress on Photosynthesis
Photosynthesis is suppressed at temperatures outside the optimal range [34]. Heat stress affects the light-harvesting systems, electron transport, NADPH and ATP synthesis, photosynthetic carbon cycle, and the utilization of assimilates [35,36]. Damage to any of these components can reduce photosynthetic capacity. PS II is the most heat-sensitive component of the photosynthetic apparatus [16]. Several protein subunits (e.g., Psb27 and Psb28) and cofactors (e.g., CP43) in photosynthetic electron transport mediate PSII repair under heat stress [37,38]. Light-harvesting-related proteins (LHCs) are important for light harvesting and photoprotection, and the Lhca1-6 and Lhcb1-8 LHC sub-classes are associated with photoprotection of PSI and PSII, respectively [39]. In this study, several genes related to the photosynthetic electron transport system and ATP synthase were downregulated under heat stress. These results indicate that photosynthetic electron transport and photophosphorylation are suppressed by heat stress. In particular, PSB27, LHCA3, LHCA5, and LHCA6 were downregulated eight-fold under heat stress, suggesting inhibition of photoprotection of PSII and PSI. Cytochrome b6f also mediates PSII repair by driving ATP synthesis in chloroplasts [16], and PETB and PETC (encoding the cytochrome b6f complex) were significantly downregulated by heat stress, suggesting a negative effect on PSII repair. Overall, these results suggest that PSII and PSI were damaged at 45 °C, resulting in suppression of the photosynthetic machinery in P. tomentosa.
4.3. Effects of Heat Stress on Respiration
Plant respiration generally increases with temperature [40]. Stomatal regulation can increase transpiration to cool the leaf in response to elevated temperatures; in contrast, excessive heat induces stomatal closure, resulting in reduced photosynthesis [41]. In this study, the size of the stomatal opening decreased significantly at 45 °C, suggesting a negative effect on gas exchange in leaves. Respiration comprises glycolysis, the TCA cycle, and the mitochondrial electron transport chain (ETC). These pathways can produce energy equivalents and carbon skeletons for the biosynthesis of metabolites [42]. In glycolysis and TCA cycle, high temperature can increase the levels of sucrose and pyruvate but decrease those of sugar phosphates and some organic acids [43]. The TCA cycle also supports ATP synthesis, and is embedded in a wider metabolic network [44]. Generally, the levels of TCA cycle intermediates, such as pyruvic acid, fumarate, malate, and citrate, are affected by heat stress [45]. The ETC transfers electrons from NADH to oxygen (the ultimate electron acceptor), and NADH ubiquinone oxidoreductase in the mitochondrial ETC is thermolabile [40].
In this study, most of the glycolysis pathway-related DEGs were upregulated by heat stress, suggesting enhanced consumption of glucose and reduction of carbohydrate. These genes encoding ATP citrate lyase, isocitrate dehydrogenase, and fumarate hydratase (involved in the TCA cycle) were downregulated by heat stress. Moreover, the levels of TCA cycle metabolites, such as pyruvate and fumarate, were reduced by heat stress. These results suggest that heat suppressed the TCA cycle. Some genes related to respiratory electron transfer and oxidative phosphorylation, including NADUFA1, NADUFA5, NADUFB1, COX5B, and COX6B, were significantly downregulated by heat stress. In addition, all ATP citrate lyases were downregulated. Therefore, heat stress decreased respiratory electron transfer and oxidative phosphorylation, resulting in reduced oxidative respiration.
4.4. Osmotic and Resistant Substance Metabolism in Response to Heat Stress
The plant heat-stress response involves adjustment of cellular osmosis via biosynthesis of osmoprotectants. Galactinol-and-raffinose synthase is a key enzyme in the synthesis of raffinose-family oligosaccharides, which function as osmoprotectants in plant cells [46,47]. The levels of raffinose and melibiose were increased by heat stress in this study, and the genes encoding galactinol and raffinose synthase were significantly upregulated, suggesting their importance in the response to heat stress.
Proline accumulation is a common physiological response to heat stresses, and has negative effects on plants during heat stress [48]. However, proline can also function as a metabolic signal of activation of anti-stress response system, including ROS detoxification, induction of the specific gene expression, and protection of membrane integrity [49]. In this study, the proline level was increased by heat stress, and the important proline synthesis gene P5CS (POPTR_0006s04100) was upregulated. Therefore, P. tomentosa responds to heat stress by upregulating P5CS, resulting in increased proline levels.
The above results indicate that exposure to 45 °C imposed osmotic stress on P. tomentosa, which affected sugar biosynthesis, remobilization, or redistribution, and caused increased accumulation of osmolytes, resulting in osmotic adaptation. In addition, the comprehensive changes in sugars and organic acid might also contribute to heat stress defenses.
4.5. Transcription Factors Involved in the Response to Heat Stress
HSPs function as molecular chaperones to prevent accumulation of denatured or misfolded proteins and facilitate protein reactivation after stresses [2]. These HSPs include HSP100, HSP90, HSP70, HSP60, and small HSPs [2], of which HSP70 is the most abundant. The HSP90s are involved in the maintenance of phenotypic plasticity and developmental stability [50]. Hsp70 and Hsp90-6 were upregulated 7549- and 8.5-fold, respectively, after 5 h at 45 °C. qRT-PCR showed that Hsp70 and Hsp90-6 were upregulated after 2, 5, and 12 h at 45 °C. Thus, Hsp70 and Hsp90-6 are involved in the maintenance of heat-stress tolerance in P. tomentosa.
Complex transcriptional networks (e.g., involving HSFs, DREBs, WRKYs, and bZIPs) are involved in the response to heat stress [51]. HSFs regulate the expression of HSPs in response to heat stress; e.g., HsfA2 induces the expression of HSP70 and HSP101 [52] and protects against oxidative damage to organelles under heat stress [53]. HsfA3 confers increased thermotolerance and its expression is directly regulated by DREB2s under heat stress [54]. In poplar, DREB2, DREB2C, and HsfA3 were significantly upregulated under heat stress [16]. Here, HsfA2, HsfA3, HsfA4, HsfA9, DREB2, and DREB2E were significantly upregulated by heat stress. We speculate that the HSFAs and DREB2s TFs induce the expression of HSPs and are integrated into the complex stress-response networks that mediate stress tolerance in P. tomentosa.
Other TFs, such as bZIPs, MYBs, and WRKYs, are involved in stress responses. bZIPs are endoplasmic reticulum (ER) stress sensors in plants that regulate abscisic acid (ABA) and stress signaling, and contribute to stress tolerance [55]. Members of the MYB and WRKY families participate in plant responses to heat stress. For example, WRKY25 increases the expression of HsfA2, HsfB1, HsfB2a, and Hsp101, and WRKY39 enhances thermotolerance [56,57]. In this study, we identified 20 DEGs encoding bZIP-family proteins, of which 17 were upregulated, bZIP60 significantly so, suggesting that bZIPs play important roles in sensing ER stress and activating gene expressing in P. tomentosa under heat stress. In addition, MYB27 and MYB4R1 were upregulated after 5 h of heat stress, whereas WRKY50 was upregulated after 12 h in our qRT-PCR validation experiments. Therefore, P. tomentosa may employ MYBs and WRKYs to response heat at different phases after heat stress.
5. Conclusions
Heat stress induced significant physiological, transcriptomic, and metabolomic changes in the leaves of P. tomentosa. Heat stress increased cellular H2O2, antioxidant enzyme activities, proline, raffinose, and melibiose, whereas it decreased soluble sugar, pyruvate, fumarate, and myo-inositol. In photosynthesis, heat stress suppressed expressions of most genes related to the light-harvesting complexes and photosynthetic electron transport system. In respiration, heat stress enhanced glycolysis, and retarded the TCA cycle. Heat stress significantly affected carbohydrate metabolic pathways. Our results provide important information of metabolites, genes and transcription factors that involved in the response to heat stress in P. tomentosa.
Supplementary Materials
The following are available online at https://www.mdpi.com/1999-4907/10/5/383/s1, Figure S1: Volcano Plot for DEGs (Heat vs CTRL), Figure S2: Gene ontology (GO) and Kyoto Encyclopedia of Genes and Genomes (KEGG) enrichment analyses. (a) Top 30 enriched GO terms between heat treatments and the control (arrows indicate important GO terms associated with heat stress). * Significant enrichment. (b) Top 20 enriched KEGG pathways between heat treatments and the control (arrows, significant enrichments associated with heat stress), Table S1: A list of the quality of sequencing data, Table S2: Detailed information of some important DEGs under heat stress for 5 hours, Table S3: Detailed information of DEGs (more than 1.5-log2 fold change) under heat stress, Table S4: DEGs encoding transcription factor families, Table S5: Primers used for qRT-PCR.
Author Contributions
S.R. and B.J. designed the research. K.M., Z.L. and S.R. performed the experiments. J.C., G.C., N.T. and P.T. participated to the result analyses and interpretation of data. S.R., B.J. and L.W. wrote the manuscript.
Funding
This work was supported by the National Key Research and Development Program (2016YFD0600105).
Acknowledgments
We thank Novogene Bioinformatics Technology Co., Ltd for helping with RNA-sequencing, and Biotree Bio-technology Co., Ltd for metabolomic analysis.
Conflicts of Interest
The authors declare no conflict of interest.
References
- Easterling, D.R.; Meehl, G.A.; Parmesan, C.; Changnon, S.A.; Karl, T.R.; Mearns, L.O. Climate extremes: Observations, modeling, and impacts. Science 2000, 289, 2068–2074. [Google Scholar] [CrossRef]
- Ohama, N.; Sato, H.; Shinozaki, K.; Yamaguchi-Shinozak, K. Transcriptional regulatory network of plant heat stress response. Trends Plant Sci. 2017, 22, 53–65. [Google Scholar] [CrossRef] [PubMed]
- Bita, C.E.; Gerats, T. Plant tolerance to high temperature in a changing environment: Scientific fundamentals and production of heat stress-tolerant crops. Front. Plant Sci. 2013, 4, 273. [Google Scholar] [CrossRef] [PubMed]
- Gupta, S.C.; Sharma, A.; Mishra, M.; Mishra, R.K.; Chowdhuri, D.K. Heat shock proteins in toxicology: How close and how far? Life Sci. 2010, 86, 377–384. [Google Scholar] [CrossRef] [PubMed]
- Bita, C.E.; Zenoni, S.; Vriezen, W.H.; Mariani, C.; Pezzotti, M.; Gerats, T. Temperature stress differentially modulates transcription in meiotic anthers of heat-tolerant and heat-sensitive tomato plants. BMC Genom. 2011, 12, 384. [Google Scholar] [CrossRef] [PubMed]
- Rienth, M.; Torregrosa, L.; Luchaire, N.; Chatbanyong, R.; Lecourieux, D.; Kelly, M.T.; Romieu, C. Day and night heat stress trigger different transcriptomic responses in green and ripening grapevine (Vitis vinifera) fruit. BMC Plant Biol. 2014, 14, 108. [Google Scholar] [CrossRef]
- Yang, J.; Chen, X.; Zhu, C.; Peng, X.; He, X.; Fu, J.; Ouyang, L.; Bian, J.; Hu, L.; Sun, X.; et al. RNA-seq reveals differentially expressed genes of rice (Oryza sativa) spikelet in response to temperature interacting with nitrogen at meiosis stage. BMC Genom. 2015, 16, 959. [Google Scholar] [CrossRef]
- Ohama, N.; Kusakabe, K.; Mizoi, J.; Zhao, H.; Kidokoro, S.; Koizumi, S.; Takahashi, F.; Ishida, T.; Yanagisawa, S.; Shinozaki, K.; et al. The transcriptional cascade in the heat stress response of Arabidopsis is strictly regulated at the level of transcription factor expression. Plant Cell 2016, 28, 181–201. [Google Scholar] [CrossRef]
- Kaplan, F.; Kopka, J.; Haskell, D.W.; Zhao, W.; Schiller, K.C.; Gatzke, N.; Sung, D.Y.; Guy, C.L. Exploring the temperature-stress metabolome of Arabidopsis. Plant Physiol. 2004, 136, 4159–4168. [Google Scholar] [CrossRef]
- Luengwilai, K.; Saltveit, M.; Beckles, D.M. Metabolite content of harvested Micro-Tom tomato (Solanum lycopersicum L.) fruit is altered by chilling and protective heat-shock treatments as shown by GC–MS metabolic profiling. Postharvest Biol. Technol. 2012, 63, 116–122. [Google Scholar] [CrossRef]
- Obata, T.; Witt, S.; Lisec, J.; Palacios-Rojas, N.; Florez-Sarasa, I.; Yousfi, S.; Araus, J.L.; Cairns, J.E.; Fernie, A.R. Metabolite profiles of maize leaves in drought, heat and combined stress field trials reveal the relationship between metabolism and grain yield. Plant Physiol. 2015, 169, 2665–2683. [Google Scholar] [CrossRef] [PubMed]
- De Leonardis, A.M.; Fragasso, M.; Beleggia, R.; Ficco, D.B.M.; De Vita, P.; Mastrangelo, A.M. Effects of heat stress on metabolite accumulation and composition, and nutritional properties of durum wheat grain. Int. J. Mol. Sci. 2015, 16, 30382–30404. [Google Scholar] [CrossRef] [PubMed]
- Glaubitz, U.; Li, X.; Schaedel, S.; Erban, A.; Sulpice, R.; Kopka, J.; Hincha, D.K.; Zuther, E. Integrated analysis of rice transcriptomic and metabolomic responses to elevated night temperatures identifies sensitivity- and tolerance-related profiles. Plant Cell Environ. 2017, 40, 121–137. [Google Scholar] [CrossRef]
- Janz, D.; Lautner, S.; Wildhagen, H.; Behnke, K.; Schnitzler, J.P.; Rennenberg, H.; Fromm, J.; Polle, A. Salt stress induces the formation of a novel type of ‘pressure wood’ in two Populus species. New Phytol. 2012, 194, 129–141. [Google Scholar] [CrossRef]
- Chen, J.; Yin, W.; Xia, X. Transcriptome profiles of Populus euphratica upon heat shock stress. Curr. Genom. 2014, 15, 326–340. [Google Scholar] [CrossRef]
- Song, Y.; Chen, Q.; Ci, D.; Shao, X.; Zhang, D. Effects of high temperature on photosynthesis and related gene expression in poplar. BMC Plant Biol. 2014, 14, 111. [Google Scholar] [CrossRef] [PubMed]
- Peng, S.; Jiang, H.; Zhang, S.; Chen, L.; Li, X.; Korpelainen, H.; Li, C. Transcriptional profiling reveals sexual differences of the leaf transcriptomes in response to drought stress in Populus yunnanensis. Tree Physiol. 2012, 32, 1541–1555. [Google Scholar] [CrossRef] [PubMed]
- Jia, J.; Li, S.; Cao, X.; Li, H.; Shi, W.; Polle, A.; Liu, T.X.; Peng, C.; Luo, Z.B. Physiological and transcriptional regulation in poplar roots and leaves during acclimation to high temperature and drought. Physiol. Plant 2016, 157, 38–53. [Google Scholar] [CrossRef]
- Jia, J.; Zhou, J.; Shi, W.; Cao, X.; Luo, J.; Polle, A.; Luo, Z.B. Comparative transcriptomic analysis reveals the roles of overlapping heat-/drought-responsive genes in poplars exposed to high temperature and drought. Sci. Rep. 2017, 7, 43215. [Google Scholar] [CrossRef] [Green Version]
- Cui, J.W.; Lu, W.C.; Lu, Z.G.; Ren, S.X.; Zhao, B.B.; Wang, L.; Teng, N.J.; Jin, B. Identification and analysis of microRNAs in the SAM and leaves of Populus tomentosa. Forests 2019, 10, 130. [Google Scholar] [CrossRef]
- Lu, Z.; Xu, J.; Li, W.; Zhang, L.; Cui, J.; He, Q.; Wang, L.; Jin, B. Transcriptomic analysis reveals mechanisms of sterile and fertile flower differentiation and development in Viburnum macrocephalum f. keteleeri. Front. Plant Sci. 2017, 8, 261. [Google Scholar] [CrossRef] [PubMed]
- Populus trichocarpa Genome. Available online: ftp://ftp.ensemblgenomes.org/pub/release-40/plants/fasta/populus_trichocarpa/ (accessed on 29 April 2019).
- Trapnell, C.; Pachter, L.; Salzberg, S.L. TopHat: Discovering splice junctions with RNA-Seq. Bioinformatics 2009, 25, 1105–1111. [Google Scholar] [CrossRef] [PubMed]
- Young, M.D.; Wakefield, M.J.; Smyth, G.K.; Oshlack, A. Gene ontology analysis for RNA-seq: Accounting for selection bias. Genome Biol. 2010, 11, R14. [Google Scholar] [CrossRef] [PubMed]
- Mao, X.; Cai, T.; Olyarchuk, J.G.; Wei, L. Automated genome annotation and pathway identification using the KEGG Orthology (KO) as a controlled vocabulary. Bioinformatics 2005, 21, 3787–3793. [Google Scholar] [CrossRef] [Green Version]
- Kind, T.; Wohlgemuth, G.; Lee, D.Y.; Lu, Y.; Palazoglu, M.; Shahbaz, S.; Fiehn, O. FiehnLib–mass spectral and retention index libraries for metabolomics based on quadrupole and time-of-flight gas chromatography/mass spectrometry. Anal. Chem. 2009, 81, 10038–10048. [Google Scholar] [CrossRef]
- Lu, Y.; Zhang, L.; Cheng, F.; Zhao, J.; Cui, J.; Li, W.; Wang, L.; Jin, B. The morphology, ultrastructure, element distribution and motion behaviour in pollen of Ginkgo biloba L. Trees 2016, 30, 2189–2201. [Google Scholar] [CrossRef]
- Bournonville, C.F.; Díaz-Ricci, J.C. Quantitative determination of superoxide in plant leaves using a modified NBT staining method. Phytochem. Anal. 2011, 22, 268–271. [Google Scholar] [CrossRef]
- Allen, P.J.; Bennett, K. PASW Statistics by SPSS: A Practical Guide: Version 18.0; Cengage Learning: South Melbourne, Austria, 2010. [Google Scholar]
- Baxter, A.; Mittler, R.; Suzuki, N. ROS as key players in plant stress signalling. J. Exp. Bot. 2013, 65, 1229–1240. [Google Scholar] [CrossRef] [Green Version]
- Jin, B.; Wang, L.; Wang, J.; Jiang, K.Z.; Wang, Y.; Jiang, X.X.; Ni, C.Y.; Wang, Y.L.; Teng, N.J. The effect of experimental warming on leaf functional traits, leaf structure and leaf biochemistry in Arabidopsis thaliana. BMC Plant Biol. 2011, 11, 35. [Google Scholar] [CrossRef]
- Ciou, J.Y.; Lin, H.H.; Chiang, P.Y.; Wang, C.C.; Charles, A.L. The role of polyphenol oxidase and peroxidase in the browning of water caltrop pericarp during heat treatment. Food Chem. 2011, 127, 523–527. [Google Scholar] [CrossRef]
- Silva, E.N.; Ferreira-Silva, S.L.; Fontenele, A.V.; Ribeiro, R.V.; Viégas, R.A.; Silveira, J.A.G. Photosynthetic changes and protective mechanisms against oxidative damage subjected to isolated and combined drought and heat stresses in Jatropha curcas plants. J. Plant Physiol. 2010, 167, 1157–1164. [Google Scholar] [CrossRef]
- Ashraf, M.; Harris, P.J.C. Photosynthesis under stressful environments: An overview. Photosynthetica 2013, 51, 163–190. [Google Scholar] [CrossRef]
- Kurek, I.; Chang, T.K.; Bertain, S.M.; Madrigal, A.; Liu, L.; Lassner, M.W.; Zhu, G. Enhanced thermostability of Arabidopsis Rubisco activase improves photosynthesis and growth rates under moderate heat stress. Plant Cell 2007, 19, 3230–3241. [Google Scholar] [CrossRef]
- Sharkey, T.D.; Zhang, R. High temperature effects on electron and proton circuits of photosynthesis. J. Integr. Plant Biol. 2010, 52, 712–722. [Google Scholar] [CrossRef]
- Liu, H.; Huang, R.Y.C.; Chen, J.; Gross, M.L.; Pakrasi, H.B. Psb27, a transiently associated protein, binds to the chlorophyll binding protein CP43 in photosystem II assembly intermediates. Proc. Natl. Acad. Sci. USA 2011, 108, 18536–18541. [Google Scholar] [CrossRef]
- Sakata, S.; Mizusawa, N.; Kubota-Kawai, H.; Sakurai, I.; Wada, H. Psb28 is involved in recovery of photosystem II at high temperature in Synechocystis sp. PCC 6803. Biochim. Biophys. Acta 2013, 1827, 50–59. [Google Scholar] [CrossRef]
- Alboresi, A.; Caffarri, S.; Nogue, F.; Bassi, R.; Morosinotto, T. In silico and biochemical analysis of Physcomitrella patens photosynthetic antenna: Identification of subunits which evolved upon land adaptation. PLoS ONE 2008, 3, e2033. [Google Scholar] [CrossRef]
- Downs, C.A.; Heckathorn, S.A. The mitochondrial small heat-shock protein protects NADH: Ubiquinone oxidoreductase of the electron transport chain during heat stress in plants. FEBS Lett. 1998, 430, 246–250. [Google Scholar] [CrossRef]
- Zhou, H.H.; Chen, Y.N.; Li, W.H.; Chen, Y.P. Photosynthesis of Populus euphratica in relation to groundwater depths and high temperature in arid environment, northwest China. Photosynthetica 2010, 48, 257–268. [Google Scholar] [CrossRef]
- Bolton, M.D. Primary metabolism and plant defense—Fuel for the fire. Mol. Plant Microbe Interact. 2009, 22, 487–497. [Google Scholar] [CrossRef]
- Yamakawa, H.; Hakata, M. Atlas of rice grain filling-related metabolism under high temperature: Joint analysis of metabolome and transcriptome demonstrated inhibition of starch accumulation and induction of amino acid accumulation. Plant Cell Physiol. 2010, 51, 795–809. [Google Scholar] [CrossRef]
- Araujo, W.L.; Nunes-Nesi, A.; Nikoloski, Z.; Sweetlove, L.J.; Fernie, A.R. Metabolic control and regulation of the tricarboxylic acid cycle in photosynthetic and heterotrophic plant tissues. Plant Cell Environ. 2012, 35, 1–21. [Google Scholar] [CrossRef]
- Sicher, R. Combined effects of CO2 enrichment and elevated growth temperatures on metabolites in soybean leaflets: Evidence for dynamic changes of TCA cycle intermediates. Planta 2013, 238, 369–380. [Google Scholar] [CrossRef]
- Hamanishi, E.T.; Barchet, G.L.H.; Dauwe, R.; Mansfield, S.D.; Campbell, M.M. Poplar trees reconfigure the transcriptome and metabolome in response to drought in a genotype-and time-of-day-dependent manner. BMC Genom. 2015, 16, 329. [Google Scholar] [CrossRef]
- Nishizawa, A.; Yabuta, Y.; Shigeoka, S. Galactinol and raffinose constitute a novel function to protect plants from oxidative damage. Plant Physiol. 2008, 147, 1251–1263. [Google Scholar] [CrossRef]
- Lv, W.T.; Lin, B.; Zhang, M.; Xue, J.H. Proline accumulation is inhibitory to Arabidopsis seedlings during heat stress. Plant Physiol. 2011, 156, 1921–1933. [Google Scholar] [CrossRef]
- Szabados, L.; Savoure, A. Proline: A multifunctional amino acid. Trends Plant Sci. 2010, 15, 89–97. [Google Scholar] [CrossRef]
- Hahn, A.; Bublak, D.; Schleiff, E.; Scharf, K.D. Crosstalk between Hsp90 and Hsp70 chaperones and heat stress transcription factors in tomato. Plant Cell 2011, 23, 741–755. [Google Scholar] [CrossRef]
- Grover, A.; Mittal, D.; Negi, M.; Lavania, D. Generating high temperature tolerant transgenic plants: Achievements and challenges. Plant Sci. 2013, 205–206, 38–47. [Google Scholar] [CrossRef]
- Tripp, J.; Mishra, S.K.; Scharf, K.D. Functional dissection of the cytosolic chaperone network in tomato mesophyll protoplasts. Plant Cell Environ. 2009, 32, 123–133. [Google Scholar] [CrossRef] [Green Version]
- Zhang, L.; Li, Y.; Xing, D.; Gao, C. Characterization of mitochondrial dynamics and subcellular localization of ROS reveal that HsfA2 alleviates oxidative damage caused by heat stress in Arabidopsis. J. Exp. Bot. 2009, 60, 2073–2091. [Google Scholar] [CrossRef]
- Li, Z.; Zhang, L.; Wang, A.; Xu, X.; Li, J. Ectopic overexpression of SlHsfA3, a heat stress transcription factor from tomato, confers increased thermotolerance and salt hypersensitivity in germination in transgenic Arabidopsis. PLoS ONE 2013, 8, e54880. [Google Scholar] [CrossRef]
- Zhu, J.K. Abiotic stress signaling and responses in plants. Cell 2016, 167, 313–324. [Google Scholar] [CrossRef] [Green Version]
- Li, S.; Fu, Q.; Huang, W.; Yu, D. Functional analysis of an Arabidopsis transcription factor WRKY25 in heat stress. Plant Cell Rep. 2009, 28, 683–693. [Google Scholar] [CrossRef]
- Li, S.; Zhou, X.; Chen, L.; Huang, W.; Yu, D. Functional characterization of Arabidopsis thaliana WRKY39 in heat stress. Mol. Cells 2010, 29, 475–483. [Google Scholar] [CrossRef]
Figure 1.
Plant material and experimental design. (a) Sampling locations (arrows). (b) Schematic diagram of the experimental design. HT, heat treatment; CTRL, control. The red line indicates the timeline of heat treatment. The green dashed line indicates the timeline of control. The red arrows indicate sampling time points (for qPCR: 25 °C 2 h, 37 °C 2h, 45 °C 2 h, 5 h, 12 h; for transcriptome and metabolome: 45 °C 5 h, 25 °C 10 h).

Figure 2.
Changes in stomata characteristics at high temperatures. Scanning electron microscope (SEM) images of stomata and guard cells. (a,c), control; (b,d), heat treatment, 45 °C for 5 h. (e) Areas were calculated using ImageJ software (n = 40). Bars indicate means ± SE (n = 3). ** p < 0.01.
Figure 2.
Changes in stomata characteristics at high temperatures. Scanning electron microscope (SEM) images of stomata and guard cells. (a,c), control; (b,d), heat treatment, 45 °C for 5 h. (e) Areas were calculated using ImageJ software (n = 40). Bars indicate means ± SE (n = 3). ** p < 0.01.

Figure 3.
Changes in physiological and biochemical indices at 45 °C high temperature. (a) Soluble sugar; (b) H2O2; (c) soluble protein; (d) superoxide dismutase (SOD) activity; (e) catalase (CAT) activity; (f) peroxidase (POD) activity. Bars indicate means ± SE (n = 3). * p < 0.05; ** p < 0.01.
Figure 3.
Changes in physiological and biochemical indices at 45 °C high temperature. (a) Soluble sugar; (b) H2O2; (c) soluble protein; (d) superoxide dismutase (SOD) activity; (e) catalase (CAT) activity; (f) peroxidase (POD) activity. Bars indicate means ± SE (n = 3). * p < 0.05; ** p < 0.01.

Figure 4.
Changes in the expression of genes related to photosynthesis and oxidative phosphorylation under heat stress. (a) Pathway diagram of the light reactions of photosynthesis. LHC I/II, light-harvesting complex I/II; PS I/II, photosystem I/II; PQ, plastoquinone; Cyt b6, cytochrome b6f complex; PC, plastocyanin; Chl, chlorophyll; Fdx, ferredoxin. (b) Pathway diagram of oxidative phosphorylation. NAD, Nicotinamide adenine dinucleotide; UQ, ubiquinone; Cyt c, cytochrome; ADP, adenosine diphosphate; ATP, adenosine triphosphate. Colors at right indicate the log2 expression ratio [log2 (heat/control_ mean)], and at left the fragments per transcript kilobase per million fragments mapped (FPKM) value of the control. (Levels 1–8, FPKM values of 0–10, 10–20, 20–40, 40–80, 80–160, 160–320, 320–640, and 640+, respectively).
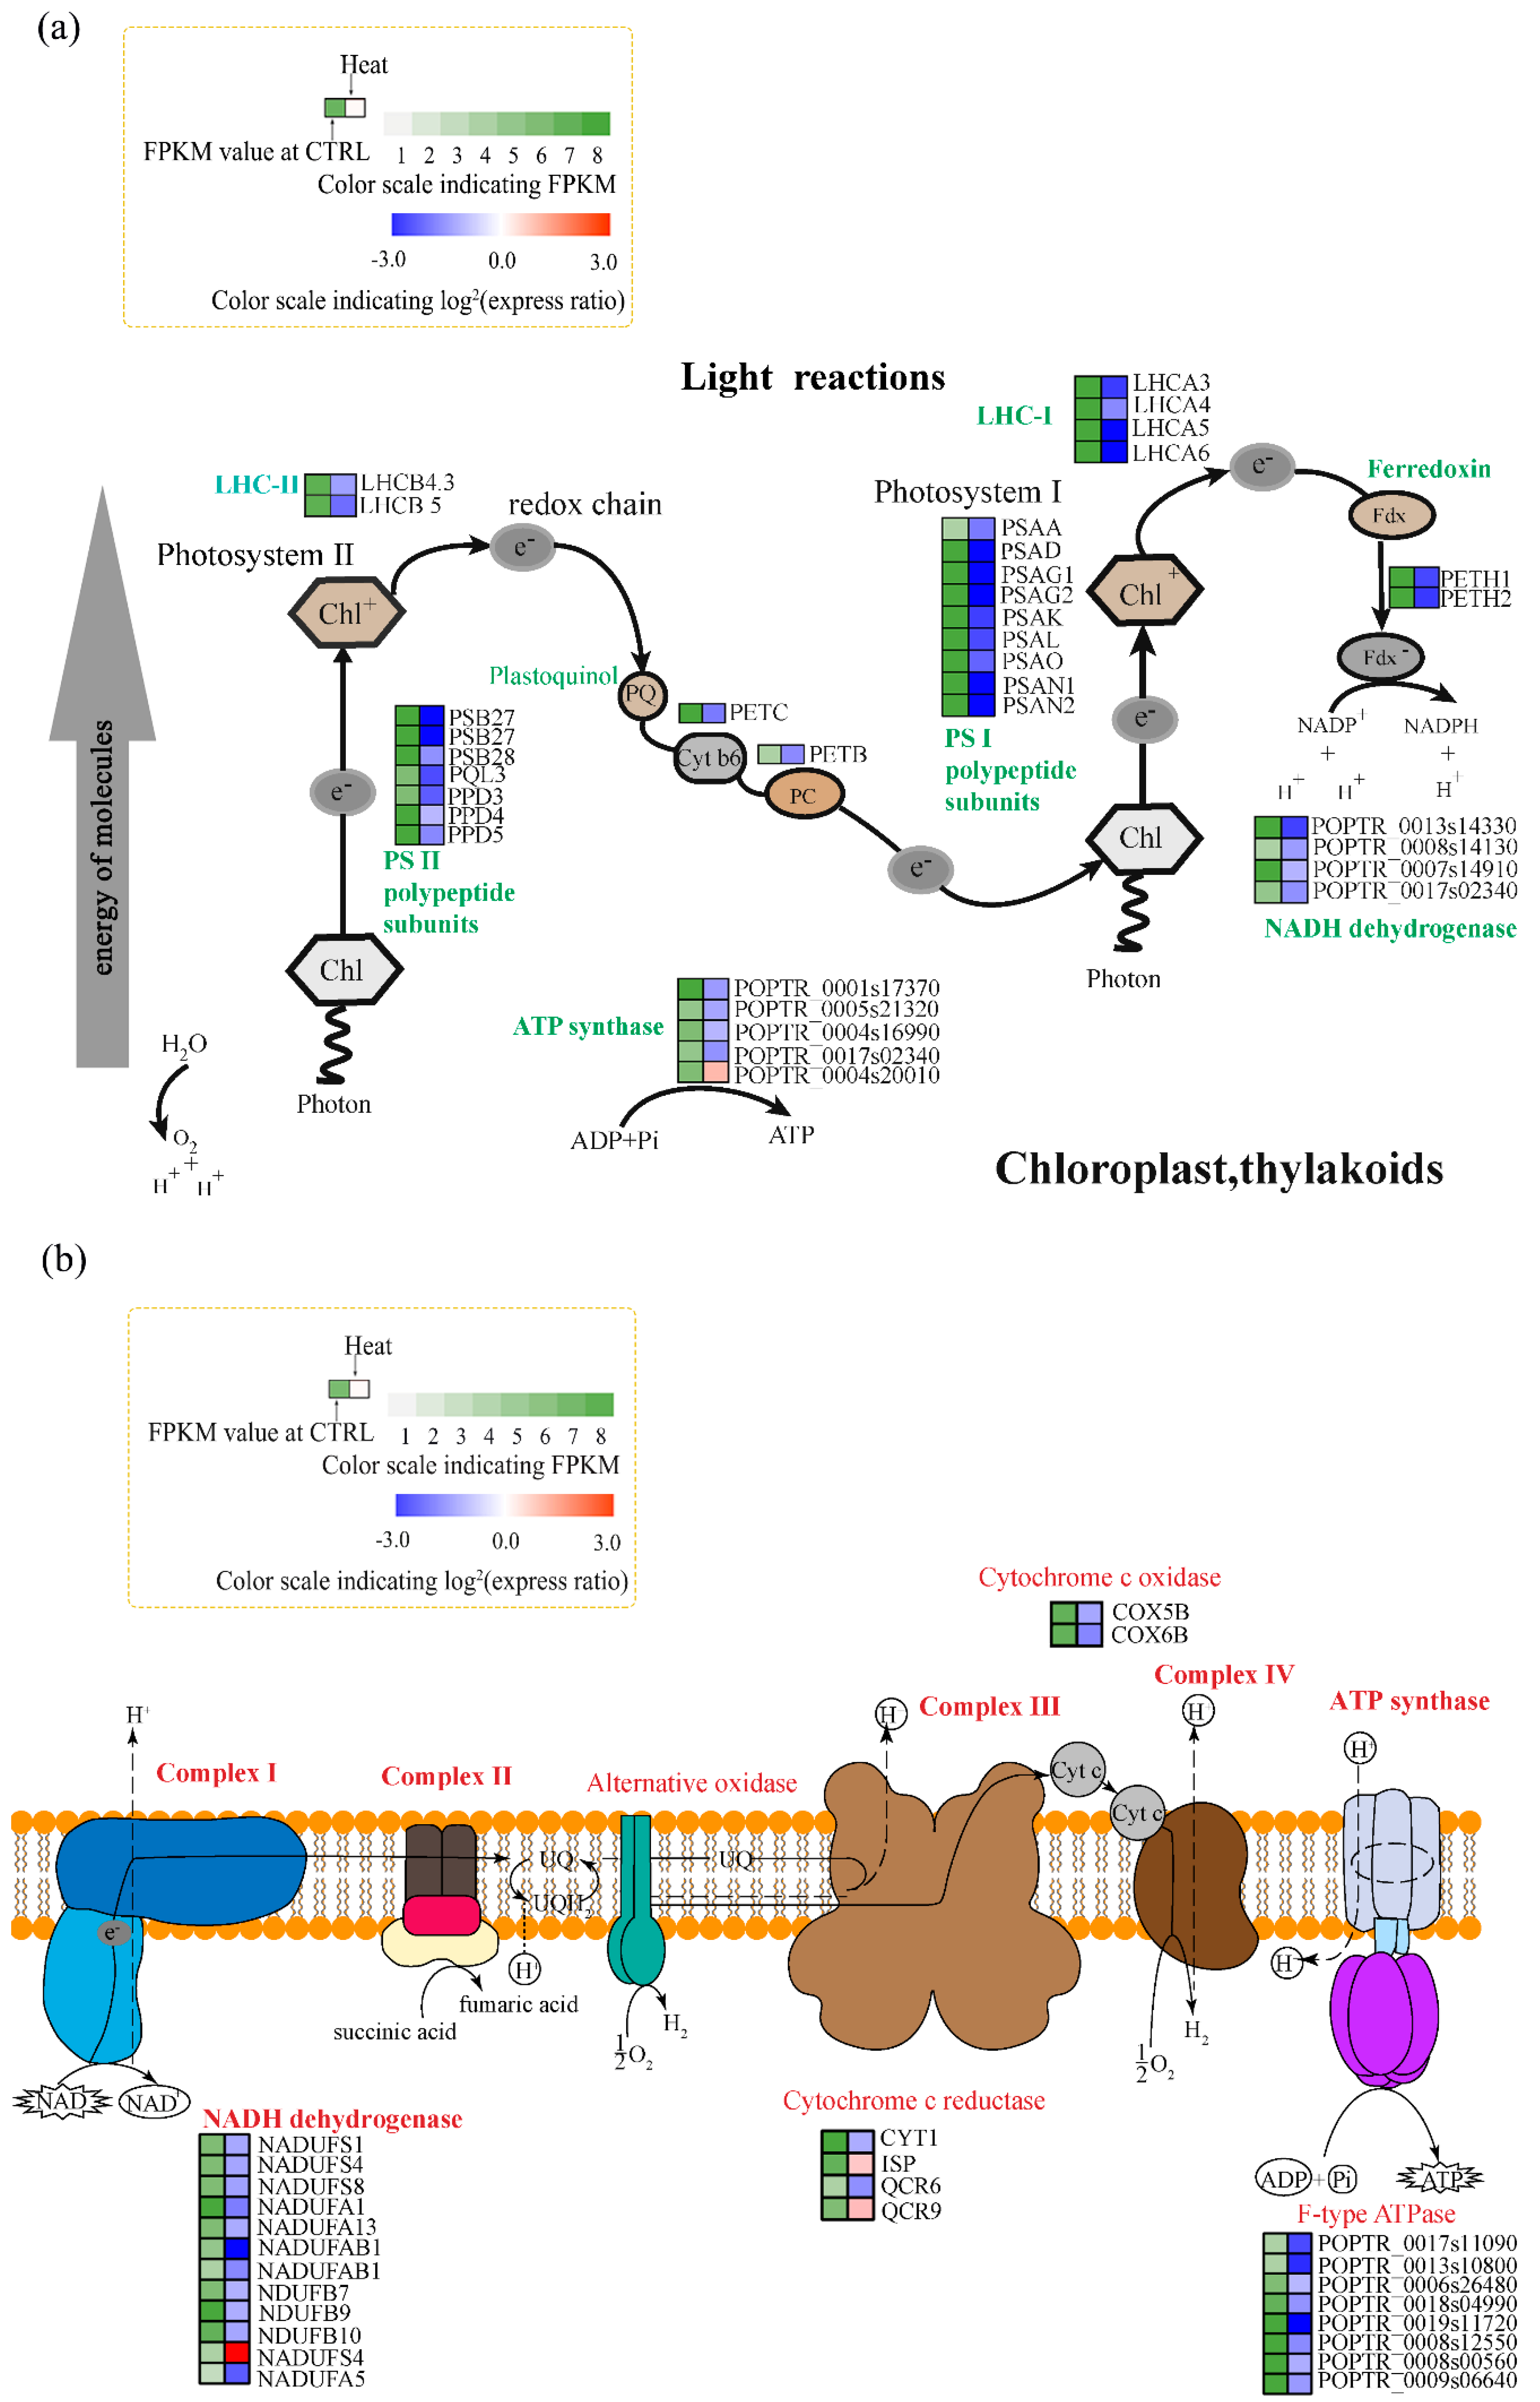
Figure 5.
Metabolic changes in P. tomentosa under heat stress. (a) Map of enriched metabolic pathways; X-axis (pathway impact) and Y-axis [−log(p)] show the topological analysis of impact factors and the p-value by pathway enrichment analysis, respectively. (b) Metabolites whose levels differed significantly between heat stress and the control.

Figure 6.
Associated pathway analysis of metabolite levels and enzyme activities. Inositol phosphate metabolism and galactose metabolism pathways. Metabolites whose levels did not differ were omitted. Colors at right indicate the log2 expression ratio [log2 (heat/control_ mean)], and at left, the FPKM value of the control. (Levels 1–8, FPKM values of 0–10, 10–20, 20–40, 40–80, 80–160, 160–320, 320–640, and 640+, respectively). Large icons, metabolites; red, upregulation; blue, downregulation.
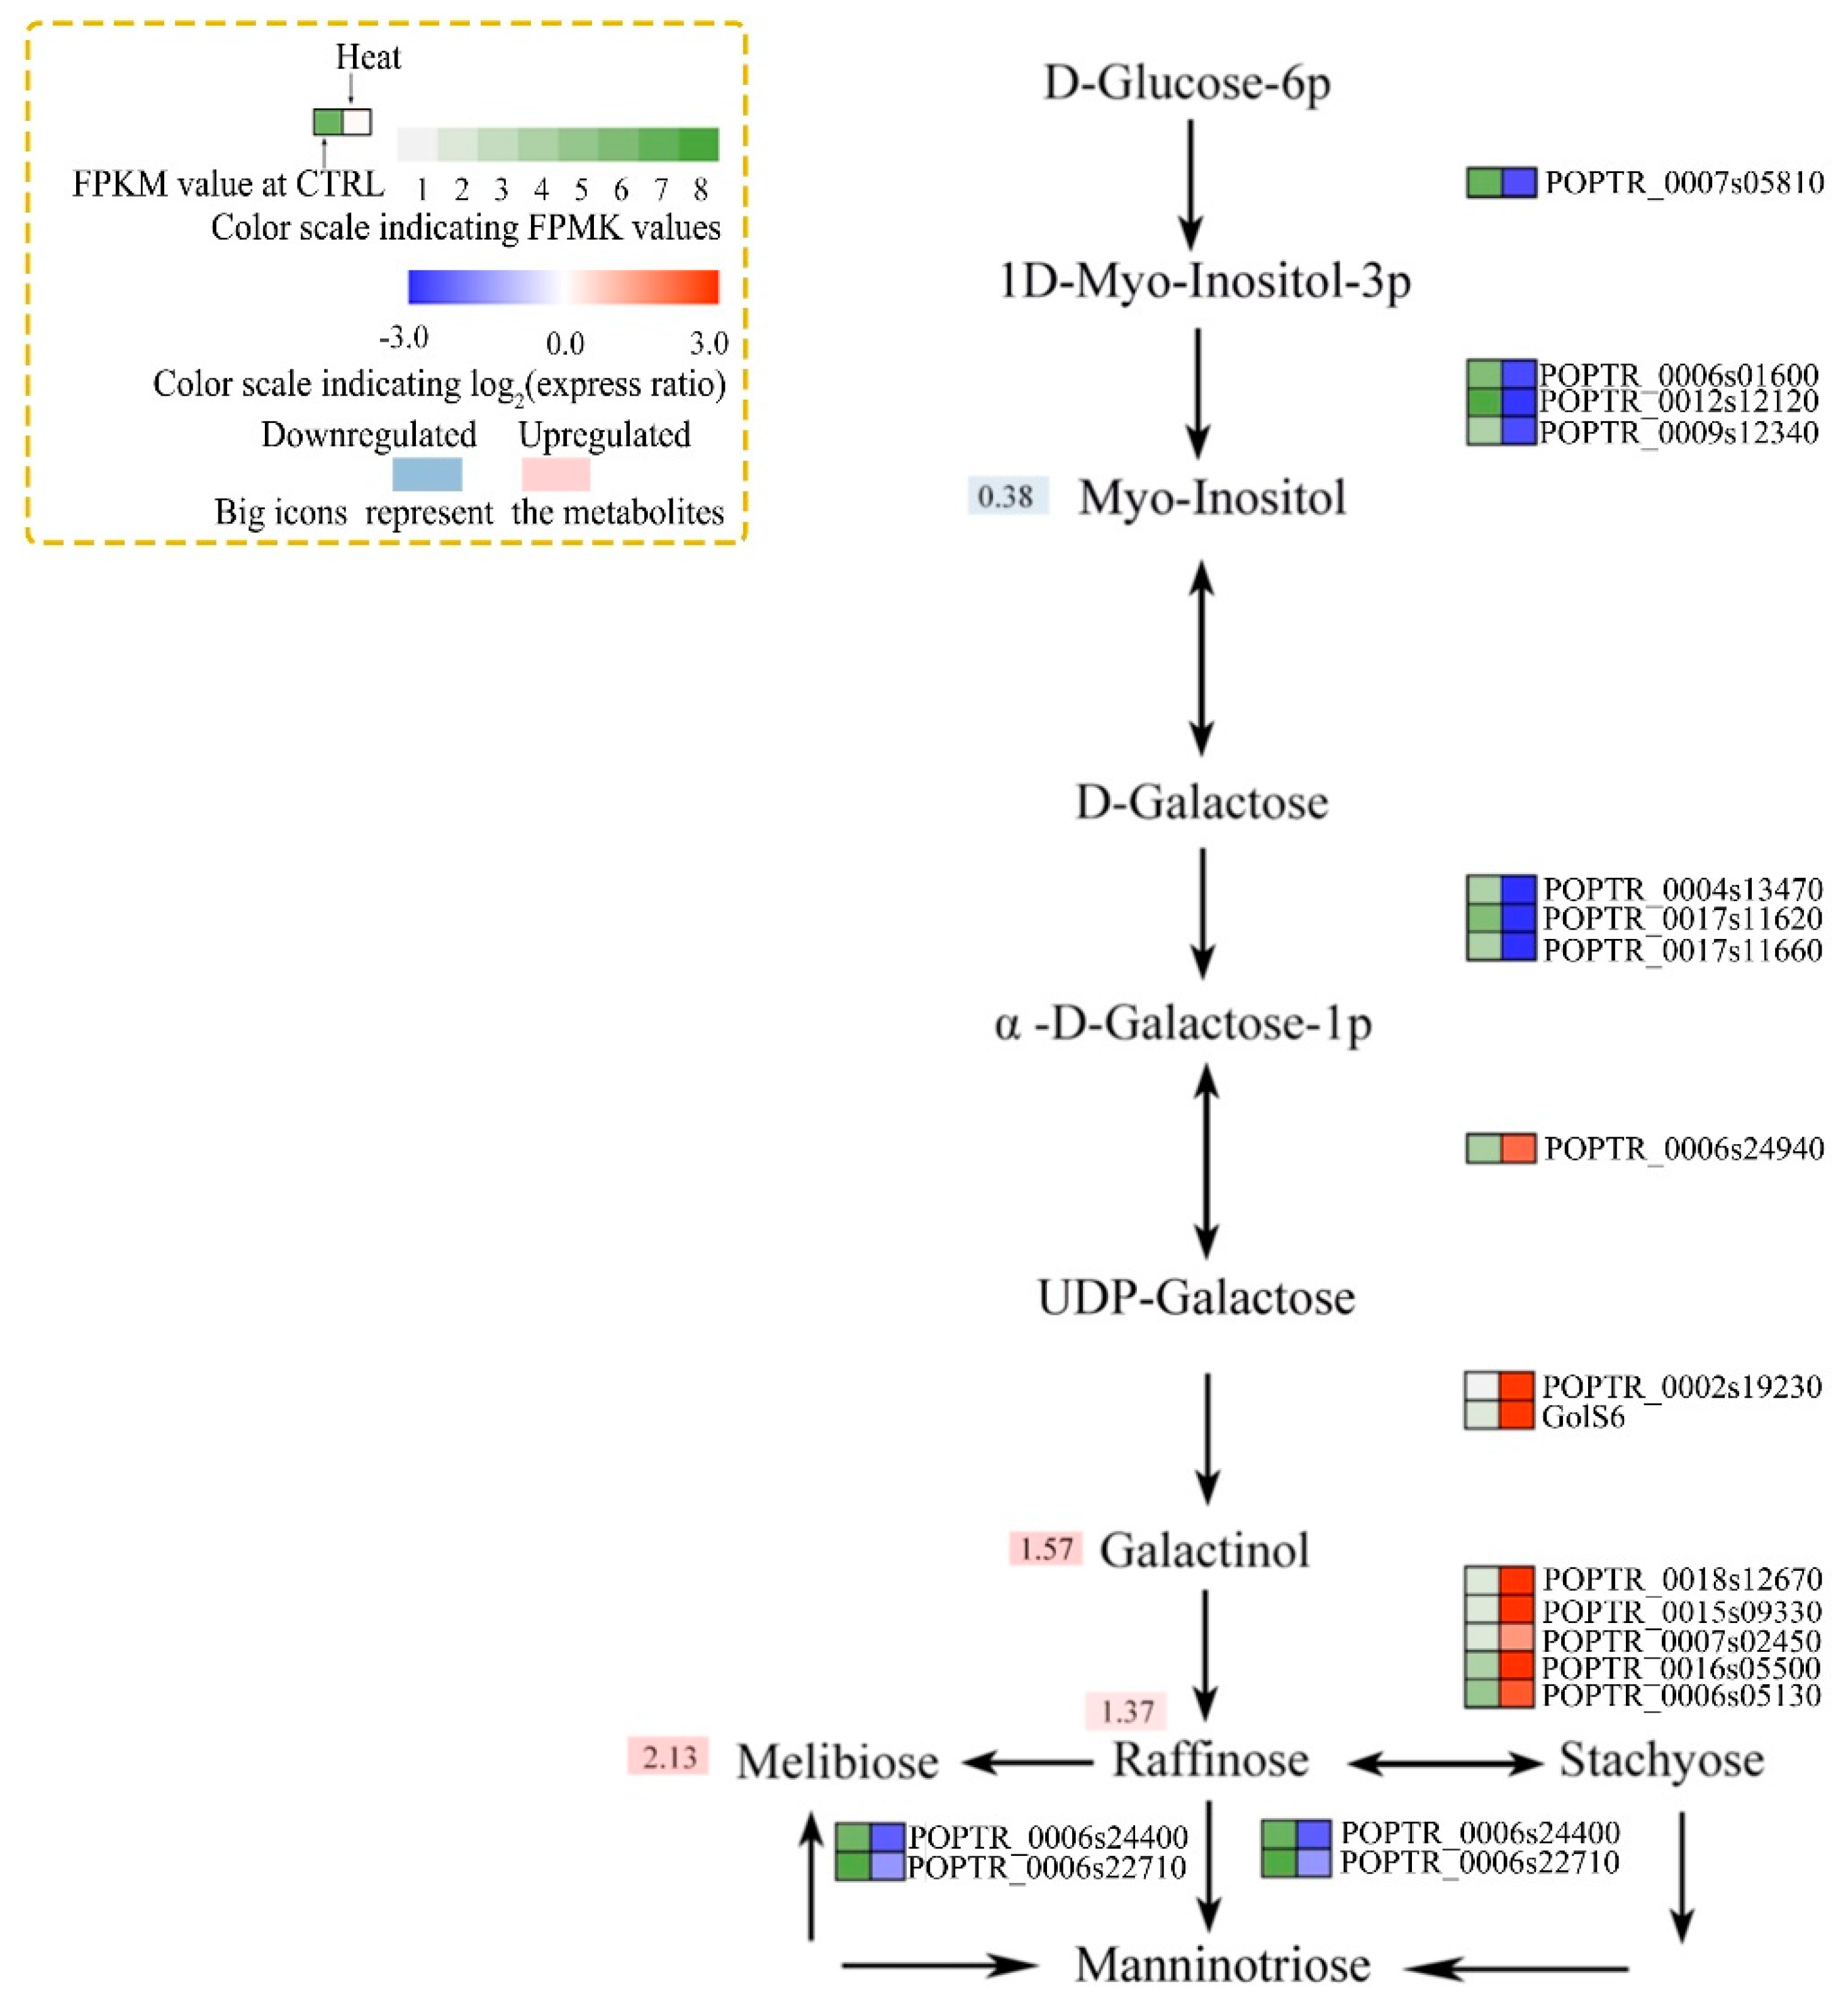
Figure 7.
Associated pathway analysis of metabolite levels and enzyme activities. Arginine and proline biosynthesis metabolism; glycine, serine, and threonine metabolism; glycolysis/gluconeogenesis; citrate cycle (TCA); and valine, leucine, and isoleucine biosynthesis pathways. Metabolites whose levels did not differ were omitted. Colors at right indicate the log2 expression ratio [log2 (heat/control_ mean)], and at left, the FPKM value of the control. (Levels 1–8, FPKM values of 0–10, 10–20, 20–40, 40–80, 80–160, 160–320, 320–640, and 640+, respectively). Large icons, metabolites; red, upregulation; blue, downregulation.

Figure 8.
Heatmaps of changes in the expression of transcription factors under heat stress. Fourteen transcription factors (belonging to five groups) were differentially expressed.
Figure 8.
Heatmaps of changes in the expression of transcription factors under heat stress. Fourteen transcription factors (belonging to five groups) were differentially expressed.

Figure 9.
Quantitative qRT-PCR of 16 candidate genes (CYP97A3, CYP97B3, DREB1, DREB2, DREB2E, DREB5, HSP21, HSP70, HSP90-6, HSF4, HSFA2, HSFA3, HSFA9, HSFB4, and WRKY50). Error bars represent standard errors. Bars are means ± SD; n = 3. * p < 0.05; ** p < 0.01; *** p < 0.001.
Figure 9.
Quantitative qRT-PCR of 16 candidate genes (CYP97A3, CYP97B3, DREB1, DREB2, DREB2E, DREB5, HSP21, HSP70, HSP90-6, HSF4, HSFA2, HSFA3, HSFA9, HSFB4, and WRKY50). Error bars represent standard errors. Bars are means ± SD; n = 3. * p < 0.05; ** p < 0.01; *** p < 0.001.

Table 1.
Summary of responses in P. tomentosa subjected to heat stress.
| Index Type | Indexes |
|---|---|
| ROS scavenging | SOD ↑ H2O2 ↑ CAT ↑ |
| Stomata activity | Stomata opening ↓ |
| Photosynthesis | PSB27↓ PSB28 ↓ PQL3 ↓ PPD3 ↓ PSAD ↓ CB4.3 ↓ LCB5↓ LHA3 ↓ LHCA4 ↓ LCA5 ↓ LCA6 ↓ PETB ↓ PTEC↓ |
| Respiration (glycolysis) | Phosphofructokinase ↑ Phosphoglyceratekinase ↑ Enolase ↑ Pyruvatekinase ↑ Phosphoglucomutase ↓ |
| Respiration (TCA cycle) | Dihydrolipoamide Acetyltransferase ↓ Isocitrate dehydrogenase ↓ ATP citrate lyase ↓ Succinate—CoA ligaseligase ↓ Fumarate hydratase ↓ Aconitate hydratase ↑ |
| Respiration (ETC) | NADUAFB1↓ NADUFS4 ↑ COX5B↓ COX6B ↓ F-type ATPase ↓ |
| Lipids Amino acid | L-allothreonine ↑ Pelargonic acid ↑ Itaconic acid ↓Androstanediol ↓ Valine ↑ Leucine ↑ Isoleucine ↑ |
| Osmoprotectants | Proline ↑ Raffinose ↑ Melibose ↑ |
| TFs and HSPs | HSFA2 ↑ HSFA3 ↑ HSF4 ↑ HSFB4 ↑ HSFA9 ↑ HSP70 ↑ HSP90-6 ↑ DREB2 ↑ WRKY13↓ WRKY50 ↓ bZIP60↑ MYB27 ↑ MYB4R1 ↑ |
↑upregulated↓ downregulated
© 2019 by the authors. Licensee MDPI, Basel, Switzerland. This article is an open access article distributed under the terms and conditions of the Creative Commons Attribution (CC BY) license (http://creativecommons.org/licenses/by/4.0/).
Share and Cite
MDPI and ACS Style
Ren, S.; Ma, K.; Lu, Z.; Chen, G.; Cui, J.; Tong, P.; Wang, L.; Teng, N.; Jin, B. Transcriptomic and Metabolomic Analysis of the Heat-Stress Response of Populus tomentosa Carr. Forests 2019, 10, 383. https://doi.org/10.3390/f10050383
AMA Style
Ren S, Ma K, Lu Z, Chen G, Cui J, Tong P, Wang L, Teng N, Jin B. Transcriptomic and Metabolomic Analysis of the Heat-Stress Response of Populus tomentosa Carr. Forests. 2019; 10(5):383. https://doi.org/10.3390/f10050383
Chicago/Turabian StyleRen, Shixiong, Kaibiao Ma, Zhaogeng Lu, Gang Chen, Jiawen Cui, Peixi Tong, Li Wang, Nianjun Teng, and Biao Jin. 2019. "Transcriptomic and Metabolomic Analysis of the Heat-Stress Response of Populus tomentosa Carr." Forests 10, no. 5: 383. https://doi.org/10.3390/f10050383
Note that from the first issue of 2016, this journal uses article numbers instead of page numbers. See further details here.