Influence of Drought on Foliar Water Uptake Capacity of Temperate Tree Species


1
Laboratory of Plant Ecology, Department of Plants and Crops, Faculty of Bioscience Engineering, Ghent University, Coupure links 653, 9000 Gent, Belgium
2
Laboratory of Plant Ecophysiology, Department of Botany, Faculty of Science and Technology, University of Tartu, Lai 40, 51005 Tartu, Estonia
*
Author to whom correspondence should be addressed.
Forests 2019, 10(7), 562; https://doi.org/10.3390/f10070562
Submission received: 18 April 2019
/
Revised: 21 June 2019
/
Accepted: 26 June 2019
/
Published: 4 July 2019
(This article belongs to the Special Issue Water Cycling and Drought Responses of Forest Ecosystems)
Abstract
:Foliar water uptake (FWU) has been investigated in an increasing number of species from a variety of areas but has remained largely understudied in deciduous, temperate tree species from non-foggy regions. As leaf wetting events frequently occur in temperate regions, FWU might be more important than previously thought and should be investigated. As climate change progresses, the number of drought events is expected to increase, basically resulting in a decreasing number of leaf wetting events, which might make FWU a seemingly less important mechanism. However, the impact of drought on FWU might not be that unidirectional because drought will also cause a more negative tree water potential, which is expected to result in more FWU. It yet remains unclear whether drought results in a general increase or decrease in the amount of water absorbed by leaves. The main objectives of this study are, therefore: (i) to assess FWU-capacity in nine widely distributed key tree species from temperate regions, and (ii) to investigate the effect of drought on FWU in these species. Based on measurements of leaf and soil water potential and FWU-capacity, the effect of drought on FWU in temperate tree species was assessed. Eight out of nine temperate tree species were able to absorb water via their leaves. The amount of water absorbed by leaves and the response of this plant trait to drought were species-dependent, with a general increase in the amount of water absorbed as leaf water potential decreased. This relationship was less pronounced when using soil water potential as an independent variable. We were able to classify species according to their response in FWU to drought at the leaf level, but this classification changed when using drought at the soil level, and was driven by iso- and anisohydric behavior. FWU hence occurred in several key tree species from temperate regions, be it with some variability, which potentially allows these species to partly reduce the effects of drought stress. We recommend including this mechanism in future research regarding plant–water relations and to investigate the impact of different pathways used for FWU.
1. Introduction
Water transport within the soil–plant–atmosphere (SPAC) continuum is described by the cohesion-tension theory, expressing a passive upward water flow due to tension on the water column caused by transpiration at the leaf level [1]. According to this theory, water flow is driven by a difference in hydrostatic pressure or water potential [2] and regulated by stomata at the leaf level [3]. As such, this concept results in a water flow from soil through plants into the atmosphere.
During leaf wetting events, a water film with a water potential close to zero can be formed on the leaf surface. Water from this film can be absorbed by leaves, i.e., foliar water uptake (FWU), depending on leaf permeability [2,4,5]. Recent theoretical work by Vesala et al. (2017) has indicated that water can also be absorbed by leaves in the absence of leaf wetting events through reverse transpiration when a sufficiently high atmospheric relative humidity is reached [6]. Hydraulic redistribution of this absorbed water results in a complete reversal of the aforementioned SPAC-flow, inducing water transport from leaves toward stem and possibly roots [2,4,5,7,8]. The importance of FWU depends on timing, both diurnal and seasonal [5], and length of leaf wetting events, with duration of leaf wetting being more important than the amount of water supplied [9].
FWU has been demonstrated in an increasing number of species [4,7] originating from a variety of areas ranging from tropical montane cloud forests [7] to mangroves [10] and dryland ecosystems [11] but has so far been understudied in deciduous, temperate tree species from non-foggy regions. Leaf wetting events that may potentially lead to FWU occur on average once every three days on a yearly basis in temperate regions [5], hinting towards FWU as a frequently used mechanism by temperate trees. Furthermore, Burkhardt and Hunsche (2013) stated that microscopic leaf wetness occurs on almost any plant worldwide, often permanently [12]. As such, FWU might be a major underestimated water flow in temperate tree species [13] and should, therefore, be investigated.
As climate change progresses, the number of drought events is predicted to increase [14]. However, even when drought occurs, leaf wetting might still be present (e.g., morning dew, fog, or precipitation events which do not substantially wet the soil). This has led to speculations about an increased importance of FWU as climate change progresses [13]. On the one hand, a decrease in leaf water potential during drought results in a higher water potential difference between leaf and atmospheric water, which is the driving force for FWU [15]. On the other hand, the pathway used for FWU might be blocked during drought, e.g., if stomata are used in FWU, and these close during drought [3], leaves will absorb less water [4]. This makes the effect of drought on FWU not straightforward to predict, although, in general, it is assumed that drought will lead to an increase in FWU [13]. The extent of FWU contributing to the water relations for a given species hence not only depends on its ability to absorb water but also on the pathways used for FWU. These pathways (i.e., trichomes [16], hydathodes [17], stomata [18], or cuticular diffusion [19]) are species-dependent and in most cases still unclear. Furthermore, even if the number of leaf wetting events would decrease due to an increase in the number of drought events, the relative contribution of FWU to the water budget of plants might be more pronounced as a result of induced water shortage.
This study (i) investigates FWU-capacity in nine widely distributed key deciduous, temperate tree species from non-foggy regions, with a variety of leaf morphologies and contrasting stomatal behavior, which could potentially affect FWU, and (ii) compares the relative importance of FWU in these species during drought. We hypothesize that FWU and the impact of drought on FWU are species-dependent, with an expected general increase in FWU as drought intensifies.
2. Materials and Methods
2.1. Experimental Set-Up
Three- to four-year-old Alnus glutinosa L., Betula pendula Roth., Fagus sylvatica L., Liquidambar styraciflua L., Quercus robur L., Robinia pseudoacacia L., Sorbus aucuparia L., and Tilia cordata Mill. (eight trees per species, height class 150–175 cm) and two-year-old Populus tremula L. (eight trees, height class 125–150 cm) were planted on 21 March 2018 into pots (diameter 40 cm, height 25 cm) containing organic soil (Peltracom, Belgium) enriched with 4 g.L−1 slow releasing fertilizer (Osmocote Standard 8–9 m, Osmocote Garden, USA) in a greenhouse at the Faculty of Bioscience Engineering, Ghent University, Belgium. Initially, all trees were well-watered by drip irrigation. On 29 May 2018, drip irrigation was removed from half of the trees per species in order to assess the effect of climate change-driven drought on FWU-capacity (see below; Equation 2). Control and drought-treated trees were monitored (see 2.2) on average every four days between 9 May and 4 July 2018, until leaf senescence or shedding of leaves occurred, indicating severe drought stress (Figure S1).
2.2. Measurements
Soil water content (SWC; %) was measured with a frequency domain reflectometer (HH2 Moisture Meter Version 2.1, Delta-T Devices, UK) and converted to soil water potential (Ψsoil; MPa) by calibration with a tensiometer (CV5 U, Tensio-Technik, Germany) in a pot containing both sensors, filled with organic soil (Peltracom, Belgium) enriched with 4 g.L −1 slow releasing fertilizer (Osmocote Standard 8–9 M, Osmocote Garden, USA), without a tree. Based on this calibration, SWC of 10% and higher were converted to soil water potential. Lower values were not used because of the limited measurement range of the tensiometer (up to 800 hPa) (Figure S2). Due to limitations in the measurement range of the tensiometers, estimated soil water potential may differ from the actual soil water potential values under dry conditions, but the drought treatment was effective in reducing soil moisture (Figure S1) and therefore we can still consider the temporal variations in estimated soil water potential.
A randomly selected pair of leaves per tree was cut between 8.30 and 12 am and instantaneously used for measurements of leaf water potential (Ψleaf; MPa) and foliar water uptake capacity (FWU-capacity; mg.cm −2). Parallel sampled leaves were used because measurements would otherwise affect one another. Ψleaf was measured with a pressure chamber (Model 1000, PMS Instruments Company, USA). FWU-capacity was determined according to Limm et al. (2009) [20]. In short, fresh leaves were cut from the trees. Petioles of the cut leaves were immediately sealed by non-acid vinyl glue (Artemio, Belgium), weighed (M1; mg), taped to Petri dishes, submerged in distilled water, avoiding contact between water and petioles, and placed in a dark room. After four hours, leaves were patted dry, reweighed (M2; mg), and leaf area (A; cm2) was measured. FWU-capacity is calculated as:
Lastly, leaves were dried in a dry oven for over 48 hours at 80 °C, after which oven-dry mass was weighed (Md; mg). Difference in leaf water content was calculated as:
Water absorbed by leaves resulted in an increase in leaf water content (LWC), with LWCi (%.cm2.mg−1) indicating the increase in leaf water content per mg of water absorbed per unit of leaf area, represented by the slope in a versus FWU-capacity plot. In other words, LWCi indicates how much drought stress at leaf level is potentially alleviated by the absorbance of 1 mg of water per unit of leaf area, allowing an interspecific comparison of FWU. However, LWCi alone is not sufficient for interspecific comparison because the amount of water absorbed by the leaves determines the importance of this metric. When multiplying LWCi with the maximum amount of water absorbed by leaves (FWUmax; mg.cm−2), the potential relative importance of FWU to alleviate drought stress at leaf level (PRI; %) is obtained.
PRI differs from actual relative importance of FWU to alleviate drought stress (ARI; %. MPa −1) as PRI incorporates the maximum amount of water absorbed by the leaves while ARI uses the increase in FWU-capacity per MPa decrease in Ψleaf (FWUi; mg.cm −2. MPa −1). By multiplying LWCi with FWUi ARI of FWU to alleviate drought stress is calculated. FWUi is directly correlated to the effect of drought at leaf level on FWU-capacity.
2.3. Data-Processing and Terminology
A two-way analyses of variance (ANOVA) on all data was performed to assess the effect of (i) species and treatment (well-watered and drought), (ii) species and soil water potential, and (iii) species and leaf water potential on FWU-capacity, indicating a significant interaction effect (p < 0.05) for all three analyses. This confirms that the drought treatment had a significant effect on FWU-capacity and that there are interspecies effects on FWU-capacity due to drought at soil and leaf level. Using a one-way ANOVA, significant differences were found in the FWU-capacity between species, both in well-watered (p < 0.05) and drought-treated (p < 0.05) trees. Statistical difference between different species within the same treatment was assessed by Tukey’s HSD test, both for well-watered and drought-treated trees. Statistical difference between measured FWU-capacity and zero (i.e. no FWU) per species within the same treatment was tested by individual t-tests. Based on the central limit theorem, normality was assumed.
Further processing was done by distributing all data into equal intervals of the independent variable under investigation (FWU-capacity, Ψleaf or Ψsoil), filtering out pseudoreplications (i.e., if the same tree was measured more than once in the same interval, the mean of these measurements was used), and calculating the mean with standard error of different trees from the same species within the same interval. When only one measurement within an interval was present, this data point was not used. A linear regression model was applied to each dataset of calculated means per tree species, resulting in an intercept (β0), slope (β1), and coefficient of determination (R2) and p-values indicating whether or not the slope and/or intercept were significant at a 95% confidence level (p < 0.05). All statistical analyses were done in RStudio (R Core Team 2016).
When β1 was significant at a 95% confidence level, a significant increase or decrease was mentioned (Table 1). When β1 was not significant but β0 was, no linear effect was indicated. When both β1 and β0 were not significant and R2 was equal to or higher than 0.5, a tendency to increase or decrease was indicated. When both β1 and β0 were not significant and R2 was lower than 0.5, a no effect was reported.
3. Results
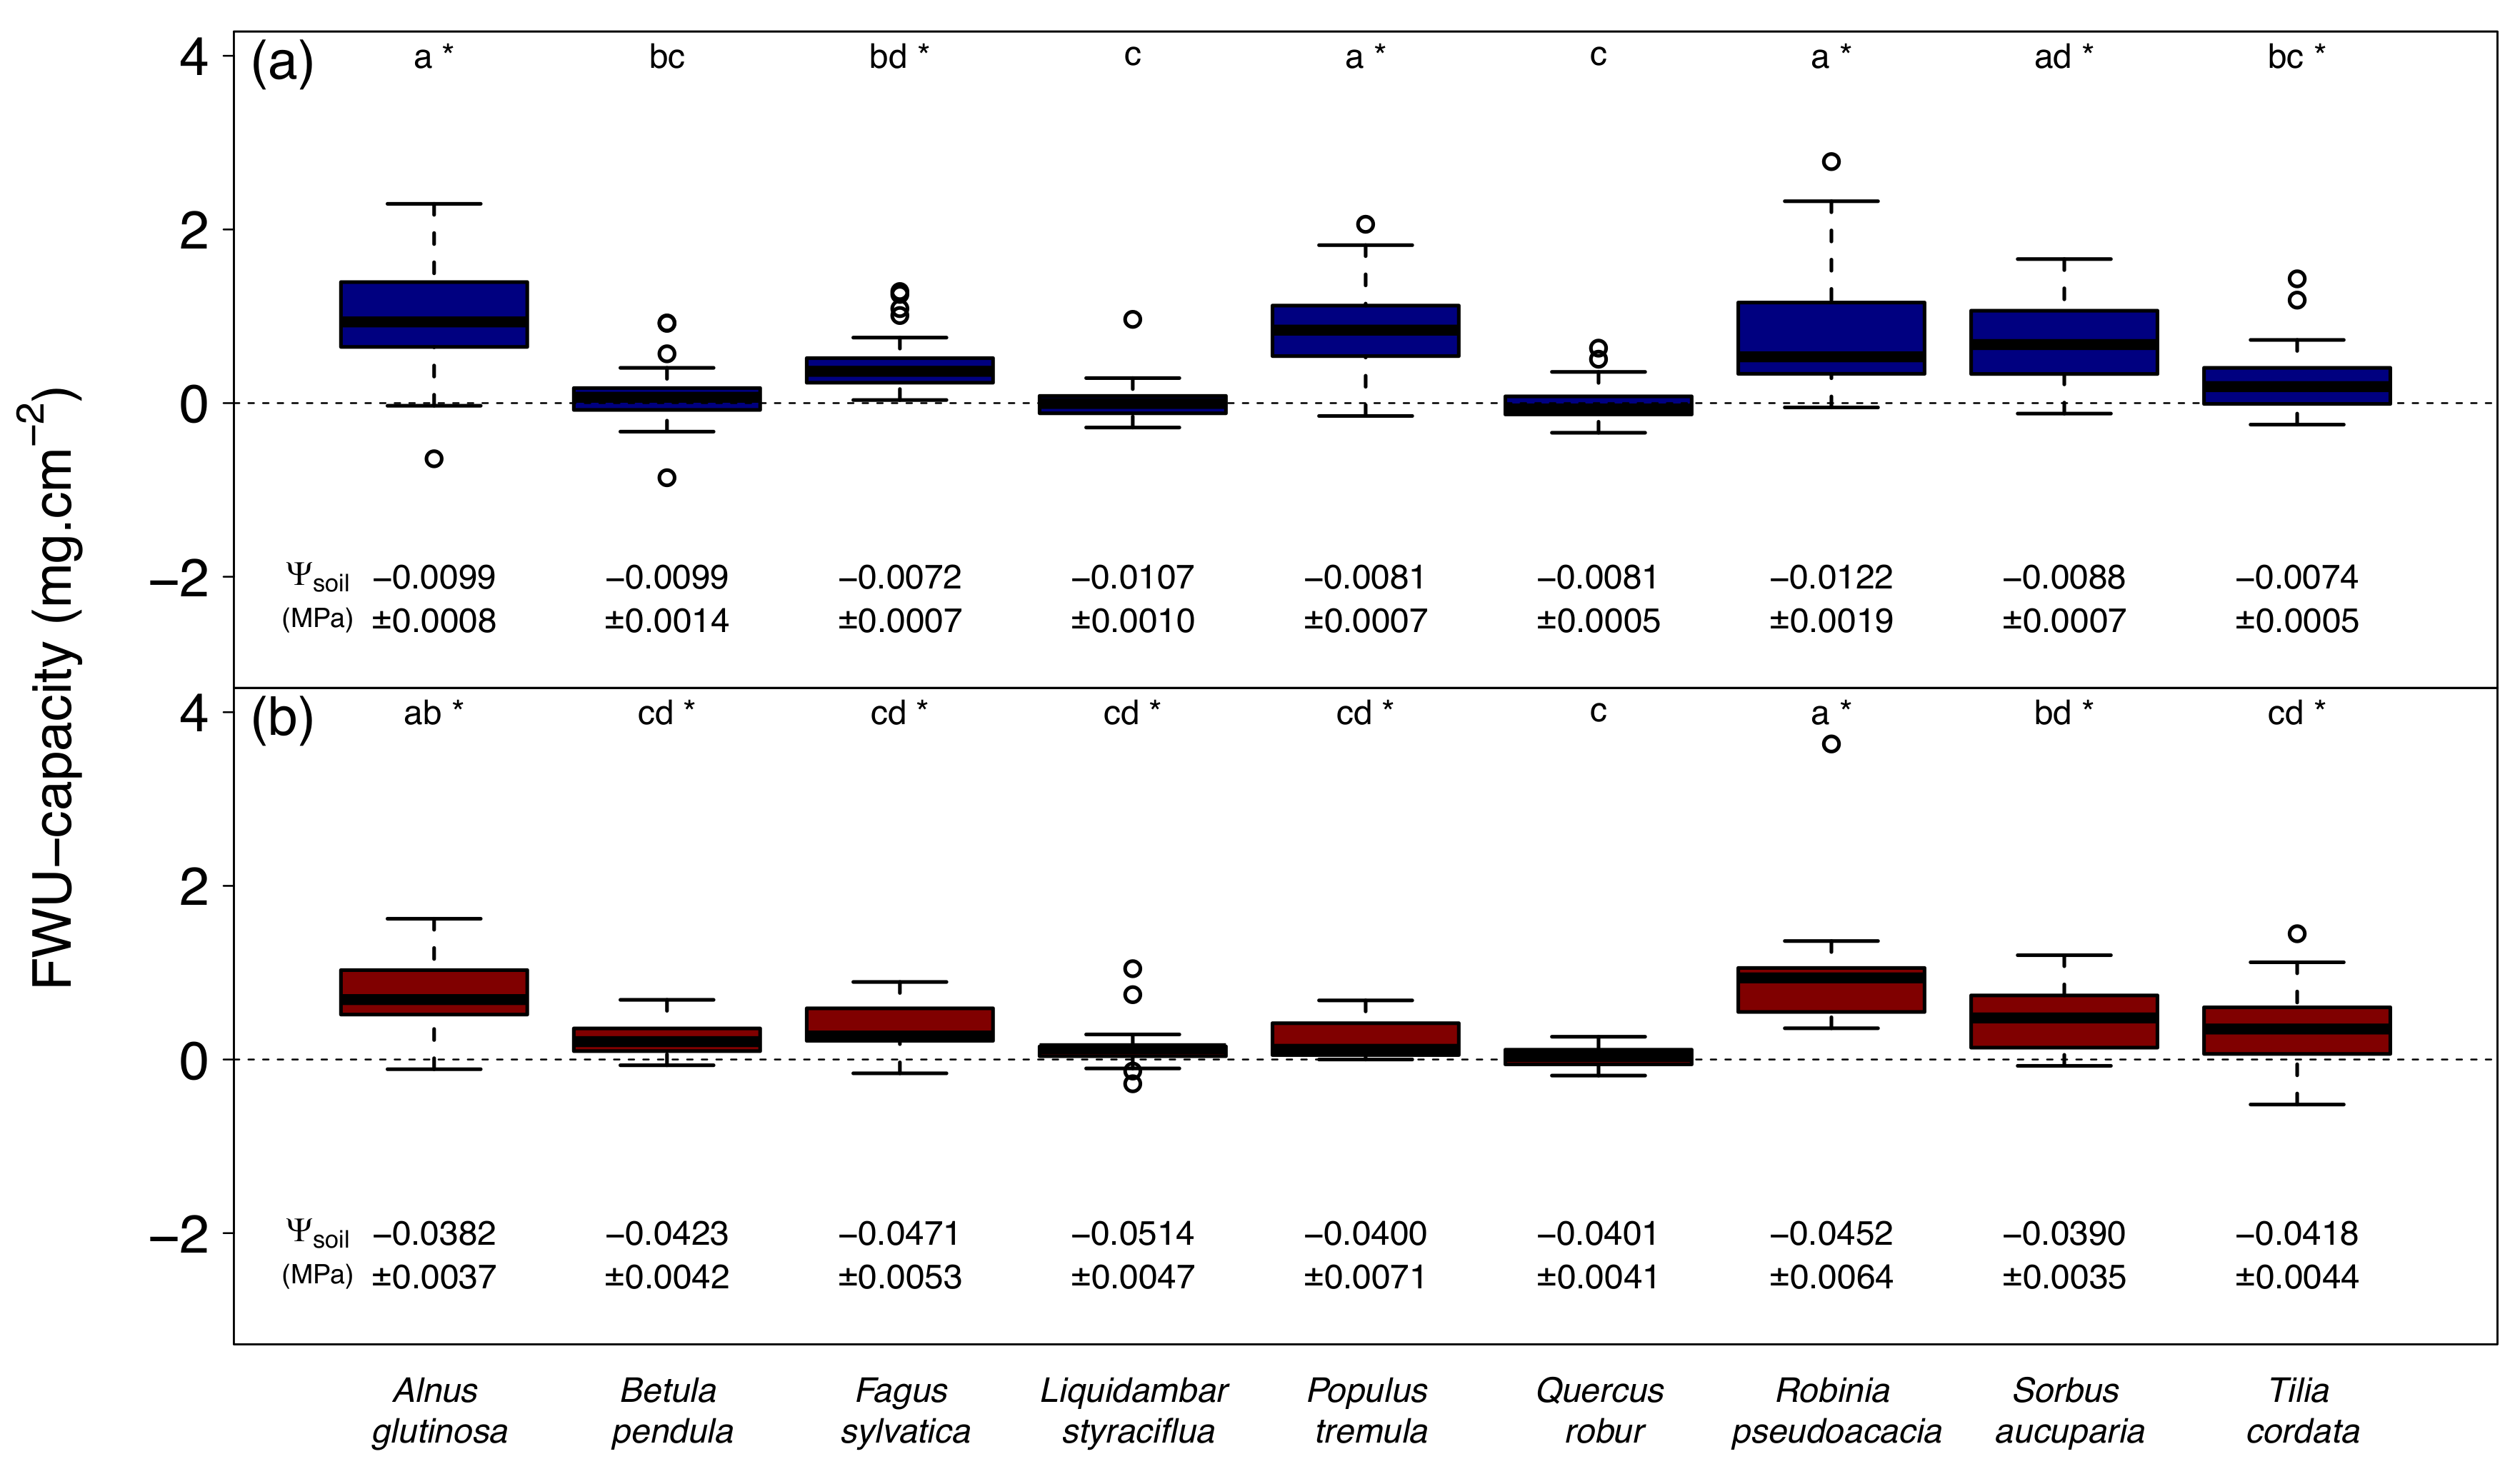
The amount of water absorbed by leaves is species-dependent, resulting in statistical differences between species in the same treatment (Figure 1). A few species (B. pendula, L. styraciflua, Q. robur) showed no significant FWU during well-watered conditions, but only Q. robur showed no significant FWU during drought (i.e., all measurements in drought-treated trees with Ψsoil of -0.0125 MPa or lower, until leaf senescence or leaf shedding occurred). The amount of water absorbed by leaves averaged across all species, excluding Q. robur, was 0.52 ± 0.13 and 0.46 ± 0.11 mg per cm2 of leaf area during well-watered and dry conditions, respectively.
Water absorbed by leaves resulted in a LWCi ranging from 1.4% for A. glutinosa to 3.1% for F. sylvatica, indicated by the slopes in Figure 2. Because the amount of water absorbed by leaves varied between species, PRI was highest in F. sylvatica, T. cordata, and P. tremula, while ARI was highest in A. glutinosa, followed by R. pseudoacacia, F. sylvatica, and P. tremula (Table 2).
While the majority of species indicated a significant (L. styraciflua, P. tremula, R. pseudoacacia) or tendency to (A. glutinosa, F. sylvatica) increase the amount of water absorbed by leaves with a decrease in Ψleaf measured prior to submergence, some species (B. pendula, Q. robur, S. aucuparia, T. cordata) showed no effect of Ψleaf on the amount of absorbed water (Figure 3).
About half of the species (B. pendula, F. sylvatica, P. tremula, Q. robur, S. aucuparia) showed no effect of Ψsoil on the amount of water absorbed by the leaves (Figure 4). Three species showed a significant increase in (R. pseudoacacia, T. cordata) or a tendency to increase (L. styraciflua) the amount of water absorbed as Ψsoil decreased, whereas A. glutinosa showed a tendency to decrease the amount of absorbed water with decreasing Ψsoil.
Most species (F. sylvatica, L. styraciflua, P. tremula, Q. robur, R. pseudoacacia, S. aucuparia, T. cordata) showed a significant decrease in Ψleaf as Ψsoil decreased (Figure 5). Whereas the slope of the linear model between Ψleaf and Ψsoil was relatively low for F. sylvatica, L. styraciflua, P. tremula, and Q. robur (slope 8–16), this slope was relatively high for R. pseudoacacia, S. aucuparia, and T. cordata (slope 30–31). A. glutnosa and B. pendula showed no effect of Ψsoil on Ψleaf.
4. Discussion
The amount of foliar absorbed water is species-specific resulting in significant differences between species during well-watered conditions, ranging from 0.0 to 1.0 mg of water per cm2 of leaf area in Q. robur and A. glutinosa, respectively (Figure 1a). In this treatment, six out of nine tree species were able to absorb water via their leaves, with values corresponding to those found by Limm et al. (2009) [20]. During drought, FWU ranged from 0.0 mg of water per cm2 of leaf area in Q. robur to 1.1 mg of water per cm2 of leaf area in R. pseudoacacia. While B. pendula, L. styraciflua, and Q. robur were not able to absorb water during well-watered conditions, Q. robur was the only species that did not absorb water in both treatments (Figure 1), resulting in eight out of nine species showing foliar water uptake. The inability of Q. robur to absorb leaf water might be caused by the high hydrophobic trichome densities present on Quercus spp. leaves [21]. It has been shown that reduction in transpirational water loss by trichomes is negligible [22], which makes the facilitating effect of a trichome-induced boundary layer on FWU less probable. However, while trichomes of some species decrease water retention, trichomes of other species increase retention and enhance leaf wetness [4], making trichome functionality very species-dependent.
While the amount of water absorbed by leaves is species-specific, absorption of the same amount of water resulted in distinct differences in leaf water content between different species (Figure 2). This indicates that the degree of drought stress at leaf level reduced by FWU (LWCi) is also species-specific, as quantified by the slope of the linear regressions in Figure 2. As the amount of water absorbed by leaves varied per species, PRI and ARI allowed a ranking of potential and actual relative importance of FWU to reduce drought stress in a given species (Table 2). As such, PRI was highest in F. sylvatica, T. cordata, and P. tremula, whereas ARI was highest in A. glutinosa, R. pseudoacacia, F. sylvatica, and P. tremula. These results show that the benefit of FWU is not equal in all species, identifying F. sylvatica and P. tremula (highest PRI and average ARI) as the ones which would benefit most from leaf wetting events leading to FWU, on a relative scale, during drought at leaf level.
Ψleaf was assumed to be the primary driving force for FWU with a lower (more negative) Ψleaf resulting in more absorption [7]. Our data demonstrate that this is valid for most species (significant: L. styraciflua, P. tremula, R. pseudoacacia; tendency to: A. glutinosa, F. sylvatica). However, some species (B. pendula, S. aucuparia, T. cordata) showed no tendency to change the amount of water absorbed by leaves in response to measured leaf water potential (Figure 3). The presence or absence of a relationship between Ψleaf and FWU can partly be explained by iso- and anisohydric behavior of the species. Isohydric species maintain a constant midday Ψleaf to reduce the risk of embolism formation during drought [23,24], which partly decouples Ψleaf from Ψsoil [24,25]. Anisohydric species exhibit a progressive decrease in midday Ψleaf as Ψsoil decreases [24], allowing them to function with a small hydraulic safety margin, which may result in embolism formation [23]. By examining the coupling or decoupling of Ψleaf to Ψsoil, A. glutinosa and B. pendula showed a Ψleaf regulation consistent with isohydric species (no effect of Ψsoil on Ψleaf) [26], while R. pseudoacacia, S. aucuparia, and T. cordata showed anisohydric behavior (significant effect of Ψsoil on Ψleaf with a high slope) [27,28,29,30] (Figure 5). F. sylvatica, L. styraciflua, P. tremula, and Q. robur showed an intermediate behavior (significant effect of Ψsoil on Ψleaf with a lower slope), despite indications in previous research of intermediate [30] to anisohydric behavior in F. sylvatica [26] and isohydric behavior in the other species [25,31,32]. This explains why FWU-capacity and Ψleaf in A. glutinosa and B. pendula were not significantly correlated, as there were no major fluctuations in Ψleaf (Figure 3). In general, trees respond to drought stress along a spectrum of iso- and anisohydry [23,24], making this subdivision useful but sometimes dubious because classification depends on the considered parameters (e.g. difference between predawn and minimum daily leaf water or slope of the regression between soil and minimum daily leaf water potential) allowing only a minority of species, if any, to conform strictly to iso- or anisohydric behavior [24,33].
Aforementioned observations allow a rough subdivision based on soil drought into species incapable (Q. robur) and capable of FWU. Within the group of species that absorb water via their leaves, there are isohydric species (A. glutinosa) which have the tendency to absorb less water during soil drought, anisohydric species (R. pseudoacacia, T. cordata) which absorb more water during soil drought, and the remaining species (B. pendula, F. sylvatica, L. styraciflua, P. tremula, S. aucuparia) which are in general irresponsive to soil drought. The latter does not imply that no FWU occurs, only that the amount of water absorbed is irresponsive to Ψsoil. Whereas the effect of drought on FWU is species-dependent, the amount of water absorbed by leaves across species remains constant (0.52 ± 0.13 and 0.46 ± 0.11 mg of water.cm −2 of leaf area during well-watered and dry conditions, respectively). Due to the coupling between Ψsoil and Ψleaf in F. sylvatica, L. styraciflua, P. tremula, Q. robur, R. pseudoacacia, S. aucuparia, and T. cordata, it would be expected that FWU-capacity of these species would be significantly coupled with Ψsoil. However, Q. robur was unable to absorb water with its leaves, resulting in no relationship between FWU-capacity and Ψsoil. R. pseudoacacia and T. cordata (significant) and L. styraciflua (tendency to) indicated an increased FWU-capacity in response to a decrease in Ψsoil. P. tremula (significant) and F. sylvatica showed a correlation between Ψleaf and FWU-capacity, but not between Ψsoil and FWU-capacity. S. aucuparia showed no effect of Ψleaf on FWU-capacity, which is puzzling and requires further research.
Other differences in FWU as a function of Ψleaf or Ψsoil between species might have been caused by the pathway used for FWU. For example, if stomata are used during FWU and they close during drought [3], leaves become less accessible to absorb water [4]. This would explain why Ψsoil had an inverse significant trend in A. glutinosa and B. pendula where a lower Ψsoil resulted in a lower amount of water absorbed by leaves (Figure 4). A decreased (A. glutinosa, B. pendula) or constant (F. sylvatica, S. aucuparia) FWU as a function of Ψleaf might indicate a blockage in the FWU-pathway during drought, disabling leaves to absorb more water (Figure 4). In general, the pathway used for FWU is still unclear and deserves further investigation.
Even though the amount of water absorbed by FWU was low, eight out of nine investigated temperate tree species were able to absorb water with their leaves, showing that FWU appears to be a frequently used mechanism by deciduous, temperate tree species from non-foggy regions. However, FWU-capacities measured in this study using cut leaves are an underestimation of FWU in intact trees as water absorbed by attached leaves will be redistributed toward the stem, and possibly the roots, and can, therefore, be orders of magnitude larger. FWU-capacity as quantified in this paper can be used to emphasize the general importance of FWU in certain biomes and to compare the relative importance between species. An overall assessment of the importance of FWU, indicating how much water is absorbed by leaves and used by trees, is best done with other methods, e.g., stable isotope tracing and sap flow measurements [34], although caution should be taken when performing isotopic experiments [35].
As the global importance of FWU is becoming more prevalent [13], we recommend focusing future research on the pathways used during FWU as well as the implications of FWU in different tree species regarding their functioning, performance, and growth. This would enable a thorough assessment of the importance of this plant trait, and implementation of this additional water transport pathway into terrestrial biosphere models which could help predicting climate change-induced changes in vegetation cover.
5. Conclusions
In this paper, we present conclusive evidence that the majority of investigated temperate tree species are able to absorb water with their leaves. These findings identify FWU as an additional water transport pathway, also in deciduous, temperate tree species from non-foggy regions. The amount of water absorbed by FWU and its impact on LWC is species-dependent, resulting in differences in potential relative importance of FWU to reduce drought stress effects at leaf level. When FWU responded to Ψleaf, a classification of tree species according to their actual relative importance of FWU to reduce drought stress at the leaf level was possible. Impact of soil drought on FWU was affected by iso- and anisohydric traits of the different species, with isohydric species showing a lower FWU when Ψsoil decreased and anisohydric and intermediate species absorbing more or a similar amount of water when Ψsoil decreased.
Supplementary Materials
The following are available online at https://www.mdpi.com/1999-4907/10/7/562/s1, Figure S1: (a) Mean soil water content (%) and (b) mean soil water potential (Ψsoil; MPa) per species as a function of day of the year. Figure S2: Soil water potential (Ψsoil; MPa) as a function of soil water content (%) with a modified hyperbola fit (R2 = 1.00) indicated in red. Shaded circles represent all data from three different tensiometers; full circles are averaged data without pseudoreplications.
Author Contributions
Conceptualization and validation of this project, as well as design of methodology were performed by J.D.M.S., J.S.v.d.C., O.K., and K.S. Measurements were performed by J.D.M.S., J.S.v.d.C., and O.K. Analysis, data cleaning, visualization, and writing of the original draft were performed by J.D.M.S. Writing, reviewing, and editing was done by J.S.v.d.C., O.K., and K.S. The project was supervised by K.S.
Funding
This work was supported by the Fund for Scientific Research–Flanders (FWO) through the PhD grant to J.D.M.S. and the European Regional Development Fund to O.K.
Acknowledgments
This work was supported by the Fund for Scientific Research–Flanders (FWO) through the PhD grant to J.D.M.S. and the European Regional Development Fund to O.K.
Conflicts of Interest
The authors declare no conflict of interest.
References
- Dixon, H.H.; Joly, J. On the ascent of sap. Philos. Trans. R. Soc. London 1895, 186, 563–576. [Google Scholar]
- Nadezhdina, N.; David, T.S.; David, J.S.; Ferreira, M.I.; Dohnal, M.; Tesař, M.; Gartner, K.; Leitgeb, E.; Nadezhdin, V.; Cermak, J.; et al. Trees never rest: the multiple facets of hydraulic redistribution. Ecohydrology 2010, 3, 431–444. [Google Scholar] [CrossRef]
- Steppe, K.; Sterck, F.; Deslauriers, A. Diel growth dynamics in tree stems: Linking anatomy and ecophysiology. Trends Plant Sci. 2015, 20, 335–343. [Google Scholar] [CrossRef] [PubMed]
- Berry, Z.C.; Emery, N.; Gotsch, S.G.; Goldsmith, G.R. Foliar water uptake: processes, pathways, and integration into plant water budgets. Plant. Cell Environ. 2018, 42, 410–423. [Google Scholar] [CrossRef] [PubMed]
- Dawson, T.E.; Goldsmith, G.R. The value of wet leaves. New Phytol. 2018, 219, 1156–1169. [Google Scholar] [CrossRef] [Green Version]
- Vesala, T.; Sevanto, S.; Grönholm, T.; Salmon, Y.; Nikinmaa, E.; Hari, P.; Hölttä, T. Effect of leaf water potential on internal humidity and CO2 dissolution: reverse transpiration and improved water use efficiency under negative pressure. Front. Plant Sci. 2017, 8, 1–10. [Google Scholar] [CrossRef] [PubMed]
- Goldsmith, G.R. Changing directions: The atmosphere-plant-soil continuum. New Phytol. 2013, 199, 4–6. [Google Scholar] [CrossRef]
- Breazeale, E.L.; Mcgeorge, W.T. Exudation pressure in roots of tomato plants under humid conditions. Soil 1953, 75, 293–298. [Google Scholar] [CrossRef]
- Stone, E.C. The ecological importance of dew. Q. Rev. Biol. 1963, 38, 328–341. [Google Scholar] [CrossRef]
- Steppe, K.; Vandegehuchte, M.W.; Van de Wal, B.A.E.; Hoste, P.; Guyot, A.; Lovelock, C.E.; Lockington, D.A. Direct uptake of canopy rainwater causes turgor-driven growth spurts in the mangrove Avicennia marina. Tree Physiol. 2018, 38, 979–991. [Google Scholar] [CrossRef]
- Breshears, D.D.; McDowell, N.G.; Goddard, K.L.; Dayem, K.E.; Martens, S.N.; Meyer, C.W.; Brown, K.M. Foliar absorption of intercepted rainfall improves woody plant water status most during drought. Ecology 2008, 89, 41–47. [Google Scholar] [CrossRef] [PubMed]
- Burkhardt, J.; Hunsche, M. “Breath figures” on leaf surfaces—Formation and effects of microscopic leaf wetness. Front. Plant Sci. 2013, 4, 1–9. [Google Scholar] [CrossRef] [PubMed]
- Schreel, J.D.M.; Steppe, K. Foliar water uptake changes the world of tree hydraulics. npj Clim. Atmos. Sci. 2019, 2, 1. [Google Scholar] [CrossRef]
- Churakova Sidorova, O.V.; Saurer, M.; Bryukhanova, M.V.; Siegwolf, R.T.W.; Bigler, C. Site-specific water-use strategies of mountain pine and larch to cope with recent climate change. Tree Physiol. 2016, 36, 942–953. [Google Scholar] [CrossRef] [PubMed] [Green Version]
- Simonin, K.A.; Santiago, L.S.; Dawson, T.E. Fog interception by Sequoia sempervirens (D. Don) crowns decouples physiology from soil water deficit. Plant Cell Environ. 2009, 32, 882–892. [Google Scholar] [CrossRef] [PubMed]
- Ohrui, T.; Nobira, H.; Sakata, Y.; Taji, T.; Yamamoto, C.; Nishida, K.; Yamakawa, T.; Sasuga, Y.; Yaguchi, Y.; Takenaga, H.; et al. Foliar trichome- and aquaporin-aided water uptake in a drought-resistant epiphyte Tillandsia ionantha Planchon. Planta 2007, 227, 47–56. [Google Scholar] [CrossRef] [PubMed]
- Martin, C.E.; von Willert, D.J. Leaf epidermal hydathodes and the ecophysiological consequences of foliar water uptake in species of Crassula from the Namib Desert in Southern Africa. Plant Biol. 2000, 2, 229–242. [Google Scholar] [CrossRef]
- Burkhardt, J.; Basi, S.; Pariyar, S.; Hunsche, M. Stomatal penetration by aqueous solutions - an update involving leaf surface particles. New Phytol. 2012, 196, 774–787. [Google Scholar] [CrossRef]
- Ketel, D.H.; Dirkse, W.G.; Ringoet, A. Water uptake from foliar-applied drops and its further distribution in the oat leaf. Acta Bot. Neerl. 1972, 21, 155–166. [Google Scholar] [CrossRef]
- Limm, E.B.; Simonin, K.A.; Bothman, A.G.; Dawson, T.E. Foliar water uptake: A common water acquisition strategy for plants of the redwood forest. Oecologia 2009, 161, 449–459. [Google Scholar] [CrossRef]
- Llamas, F.; Perez-Morales CAcedo, C.; Penas, A. Foliar trichomes of the evergreen and semi- deciduous species of the genus Quercus (Fagaceae) in the Iberian Peninsula. Bot. J. Linn. Soc. 1995, 117, 47–57. [Google Scholar] [CrossRef]
- Benz, B.W.; Martin, C.E. Foliar trichomes, boundary layers, and gas exchange in 12 species of epiphytic Tillandsia (Bromeliaceae). J. Plant Physiol. 2006, 163, 648–656. [Google Scholar] [CrossRef]
- Klockow, P.A.; Vogel, J.G.; Edgar, C.B.; Moore, G.W. Lagged mortality among tree species four years after an exceptional drought in east Texas. Ecosphere 2018, 9, 1–14. [Google Scholar] [CrossRef]
- Hochberg, U.; Rockwell, F.E.; Holbrook, N.M.; Cochard, H. Iso/Anisohydry: a plant - environment interaction rather than a simple hydraulic trait. Trends Plant Sci. 2018, 23, 112–120. [Google Scholar] [CrossRef] [PubMed]
- Abbruzzese, G.; Beritognolo, I.; Muleo, R.; Piazzai, M.; Sabatti, M.; Mugnozza, G.S.; Kuzminsky, E. Leaf morphological plasticity and stomatal conductance in three Populus alba L. genotypes subjected to salt stress. Environ. Exp. Bot. 2009, 66, 381–388. [Google Scholar] [CrossRef]
- Göransson, H.; Bambrick, M.T.; Godbold, D.L. Overyielding of temperate deciduous tree mixtures is maintained under throughfall reduction. Plant Soil 2016, 408, 285–298. [Google Scholar] [Green Version]
- Li, Q.; Wang, N.; Liu, X.; Liu, S.; Wang, H.; Zhang, W.; Wang, R.; Du, N. Growth and physiological responses to successional water deficit and recovery in four warm-temperate woody species. Physiol. Plant. 2019. [Google Scholar] [CrossRef]
- Vogt, U.K. Hydraulic vulnerability, vessel refilling, and seasonal courses of stem water potential of Sorbus aucuparia L. and Sambucus nigra L. J. Exp. Bot. 2001, 52, 1527–1536. [Google Scholar] [CrossRef]
- Stöhr, A.; Lösch, R. Xylem sap flow and drought stress of Fraxinus excelsior saplings. Tree Physiol. 2004, 24, 169–180. [Google Scholar]
- Moser, A.; Rötzer, T.; Pauleit, S.; Pretzsch, H. The urban environment can modify drought stress of small-leaved lime (Tilia cordata Mill.) and black locust (Robinia pseudoacacia L.). Forests 2016, 7. [Google Scholar] [CrossRef]
- Warren, J.M.; Norby, R.J.; Wullschleger, S.D. Elevated CO2 enhances leaf senescence during extreme drought in a temperate forest. Tree Physiol. 2011, 31, 117–130. [Google Scholar] [CrossRef] [PubMed]
- Urli, M.; Lamy, J.-B.; Sin, F.; Burlett, R.; Delzon, S.; Porté, A.J. The high vulnerability of Quercus robur to drought at its southern margin paves the way for Quercus ilex. Plant Ecol. 2014, 216, 177–187. [Google Scholar] [CrossRef]
- Fu, X.; Meinzer, F.C. Metrics and proxies for stringency of regulation of plant water status (iso/anisohydry): A global data set reveals coordination and trade-offs among water transport traits. Tree Physiol. 2018, 39, 122–134. [Google Scholar] [CrossRef]
- Schreel, J.D.M.; Van de Wal, B.A.E.; Hervé-Fernandez, P.; Boeckx, P.; Steppe, K. Hydraulic redistribution of foliar absorbed water causes turgor-driven growth in mangrove seedlings. Plant. Cell Environ. 2019. [Google Scholar] [CrossRef] [PubMed]
- Goldsmith, G.R.; Lehmann, M.M.; Cernusak, L.A.; Arend, M.; Siegwolf, R.T.W. Inferring foliar water uptake using stable isotopes of water. Oecologia 2017, 184, 763–766. [Google Scholar] [CrossRef] [Green Version]
Figure 1.
amount of water absorbed by leaves in nine temperate tree species per unit of leaf area (FWU-capacity), both during (a) well-watered and (b) dry conditions. Values for soil water potential (Ψsoil) are means ± standard error. Lower case letters indicate statistical differences between species within the same treatment (panel a or b) at a 95% confidence level. * indicates an FWU-capacity significantly different from zero at a 95% confidence level.

Figure 2.
Mean increase in leaf water content (ΔLWC) as a function of mean amount of water absorbed by leaves (FWU-capacity) in nine temperate tree species. Bars represent the standard error. β0, β1, and R2 indicate the intercept, slope, and coefficient of determination of the linear regression, respectively. * indicates a significant intercept or slope at 95% confidence level.

Figure 3.
amount of water absorbed by leaves (FWU-capacity) in nine temperate tree species as a function of mean leaf water potential (Ψleaf) prior to leaf submergence. Bars represent the standard error. β0, β1, and R2 indicate the intercept, slope, and coefficient of determination of the linear regression, respectively. Blue data indicate a significant increase in water absorbed as Ψleaf decreased. Green data indicate no significant trend. * indicates a significant intercept or slope at 95% confidence level.

Figure 4.
amount of water absorbed by leaves (FWU-capacity) in nine temperate tree species as a function of mean soil water potential (Ψsoil). Bars represent the standard error. β0, β1, and R2 indicate the intercept, slope, and coefficient of determination of the linear regression, respectively. Blue data indicate a significant increase in water absorbed as Ψsoil decreased. Red data indicate a significant decrease in water absorbed as Ψsoil decreased. Green data indicate no significant trend. * indicates a significant intercept or slope at 95% confidence level.

Figure 5.
leaf water potential (Ψleaf) in nine temperate tree species as a function of mean soil water potential (Ψsoil). Bars represent the standard error. β0, β1, and R2 indicate the intercept, slope, and coefficient of determination of the linear regression, respectively. Blue data indicate a significant decrease in Ψleaf as Ψsoil decreased. Green data indicate no significant trend. * indicates a significant intercept or slope at 95% confidence level.


Table 1.
table of terminology based on slope (β1), intercept (β0), and coefficient of determination (R2) of linear regression.
Table 1.
table of terminology based on slope (β1), intercept (β0), and coefficient of determination (R2) of linear regression.
| β1 | β0 | R2 | Terminology | |
|---|---|---|---|---|
| Significant (p < 0.05) |  | Significant | ||
| Not significant | Significant (p < 0.05) | | No effect | |
| Not significant | Not significant | ≥0.5 | | Tendency to |
| Not significant | Not significant | <0.5 | | No effect |
Table 2.
in leaf water content per mg absorbed water per unit of leaf area (LWCi; %.cm2.mg −1), maximum amount of water absorbed per unit of leaf area (FWUmax; mg.cm −2), potential relative importance of FWU (PRI; %), mean increase in amount of water absorbed by leaves per unit of area per MPa decrease in Ψleaf (FWUi; mg.cm −2.MPa −1), and actual relative importance of FWU during drought (ARI; %.MPa −1) per species. Values ± standard error.
| Species. | LWCi | FWUmax | PRI | FWUi | ARI |
|---|---|---|---|---|---|
| Alnus glutinosa | 1.4 ± 0.0 | 1.9 ± 0.0 | 2.7 ± 0.0 | 0.9 ± 0.4 | 1.3 ± 0.6 |
| Betula pendula | 2.1 ± 0.0 | 0.9 ± 0.0 | 1.9 ± 0.0 | x | x |
| Fagus sylvatica | 3.1 ± 0.3 | 1.0 ± 0.0 | 3.3 ± 0.3 | 0.2 ± 0.1 | 0.6 ± 0.4 |
| Liquidambar styraciflua | 1.6 ± 0.0 | 0.3 ± 0.0 | 0.5 ± 0.0 | 0.1 ± 0.0 | 0.2 ± 0.0 |
| Populus tremula | 2.0 ± 0.0 | 1.6 ± 0.0 | 3.2 ± 0.0 | 0.3 ± 0.1 | 0.6 ± 0.2 |
| Quercus robur | 2.2 ± 0.1 | 0.6 ± 0.1 | 1.3 ± 0.3 | x | x |
| Robinia pseudoacacia | 1.7 ± 0.3 | 1.1 ± 0.1 | 1.9 ± 0.5 | 0.5 ± 0.0 | 0.9 ± 0.2 |
| Sorbus aucuparia | 1.7 ± 0.0 | 1.4 ± 0.0 | 2.3 ± 0.0 | x | x |
| Tilia cordata | 2.3 ± 0.1 | 1.4 ± 0.0 | 3.3 ± 0.1 | x | x |
© 2019 by the authors. Licensee MDPI, Basel, Switzerland. This article is an open access article distributed under the terms and conditions of the Creative Commons Attribution (CC BY) license (http://creativecommons.org/licenses/by/4.0/).
Share and Cite
MDPI and ACS Style
Schreel, J.D.M.; von der Crone, J.S.; Kangur, O.; Steppe, K. Influence of Drought on Foliar Water Uptake Capacity of Temperate Tree Species. Forests 2019, 10, 562. https://doi.org/10.3390/f10070562
AMA Style
Schreel JDM, von der Crone JS, Kangur O, Steppe K. Influence of Drought on Foliar Water Uptake Capacity of Temperate Tree Species. Forests. 2019; 10(7):562. https://doi.org/10.3390/f10070562
Chicago/Turabian StyleSchreel, Jeroen D.M., Jonas S. von der Crone, Ott Kangur, and Kathy Steppe. 2019. "Influence of Drought on Foliar Water Uptake Capacity of Temperate Tree Species" Forests 10, no. 7: 562. https://doi.org/10.3390/f10070562
Note that from the first issue of 2016, this journal uses article numbers instead of page numbers. See further details here.