Article

Response of Ecosystem Water Use Efficiency to Drought over China during 1982–2015: Spatiotemporal Variability and Resilience

1
Jiangsu Provincial Key Laboratory of Geographic Information Science and Technology, International Institute for Earth System Sciences, Nanjing University, Nanjing 210023, China
2
Key Laboratory of Water Cycle and Related Land Surface Processes, Institute of Geographic Sciences and Natural Resources Research, Chinese Academy of Sciences, Beijing 100101, China
3
Jiangsu Center for Collaborative Innovation in Geographical Information Resource Development and Application, Nanjing 210023, China
4
Xinjiang Institute of Ecology and Geography, Chinese Academy of Sciences, Urumchi 830011, China
5
Center for Water Resources Research, Chinese Academy of Sciences, Beijing 1001018, China
6
Institute of Agricultural Remote Sensing and Geoinformation, Department of Environment and Resource, Zhejiang University, Hangzhou 310058, China
7
Natural Resources Service Center, Dalian 116023, China
*
Author to whom correspondence should be addressed.
Forests 2019, 10(7), 598; https://doi.org/10.3390/f10070598
Submission received: 16 May 2019 / Revised: 13 July 2019 / Accepted: 17 July 2019 / Published: 18 July 2019
(This article belongs to the Special Issue Water Cycling and Drought Responses of Forest Ecosystems)

Abstract

:
Ecosystem water use efficiency (WUE describes carbon-water flux coupling in terrestrial ecosystems. Understanding response and resilience of WUE to drought are essential for sustainable water resource and ecosystem management under increasing drought risks over China due to climate warming. Here we analyzed the response of ecosystem WUE to drought (spatiotemporal variability and resilience) over China during 1982–2015 based on an evapotranspiration (ET) dataset based on the model tree ensemble (MTE) algorithm using flux-tower ET measurements and satellite-retrieved GPP data. The results showed that the multiyear average WUE was 1.55 g C kg−1 H2O over China. WUE increased in 77.1% of Chinese territory during the past 34 years. During drought periods, the ecosystem WUE increased mainly in the northeast of Inner Mongolia, Northeast China and some regions in southern China with abundant forests but decreased in northwestern and central China. An apparent lagging effect of drought on ecosystem WUE was observed in the east of Inner Mongolia and Northeast China, the west and east regions of North China and the central part of Tibetan Plateau. Some ecosystems (e.g., deciduous needle-leaf forests, deciduous broadleaf forests, evergreen broadleaf forests and evergreen needle-leaf forests) in Central China, Northeast and Southwest China exhibited relatively greater resilience to drought than others by improving their WUE. Our findings would provide useful information for Chinese government to adopt a reasonable approach for maintaining the structure and functions of ecosystems under drought disturbance in future.

Graphical Abstract

1. Introduction

Drought is an intermittent disturbance when water supply does not satisfy the demand for a long time [1,2], which can bring profound effects on carbon-water fluxes in terrestrial ecosystems at global and regional scales [3,4]. Drought-induced water stress could constrain vegetation growth, trigger wildfire and lead to crop yield reduction, grassland degradation and biological invasion [5,6]. Both frequency and intensity of global drought would increase in the context of climate warming until the year 2100 [7,8,9]. Knowledge about how terrestrial ecosystems adapt to and recover from drought stress is obviously critical for governmental agents to implement effective measures for sustainable ecosystem development and water resources management under future drought disturbances [10,11].
Water use efficiency (WUE) is a widely accepted parameter in describing carbon-water flux coupling between terrestrial ecosystems and the atmosphere and linking biological (e.g., vegetation transpiration and photosynthesis) and physical (e.g., soil evaporation) processes [12,13]. It reflects how much water is consumed by an ecosystem while it obtains carbon unit, which can be quantified as the ratio of carbon uptake (measured by GPP—gross primary productivity, NPP—net primary productivity or NEP—net ecosystem productivity) and water consumption (measured by ET—evapotranspiration or precipitation) [14,15,16]. Many previous studies have investigated the spatiotemporal changes of WUE. For example, Zhou et al. (2017) showed that underlying WUE (GPP × VPD0.5/ET) increased slowly during 1901–1975 but increased rapidly from 1976 to 2010 over the world based on terrestrial biosphere models [17]. Tang et al. (2014) found that the WUE had a similar latitudinal trend on earth, increasing from the subtropics to about 51° N and then decreased in higher latitudes [18]. Ponce-Campos et al. (2013) indicated that the WUE varied with water availability at the global scale, with an increasing trend from moderate to extreme drought and a decreasing trend in wet conditions [19].
The ecosystem WUE is vulnerable to climate change because various abiotic factors (e.g., radiation, wind, precipitation and temperature) can have a huge impact on it [11,20,21]. Drought disturbances (less water available than in normal conditions) can influence plant transpiration and soil evaporation directly, and ultimately affect ecosystem WUE and productivity [2,22]. In the last three decades, the spatiotemporal responses of WUE to drought have been widely investigated. For example, Liu et al. (2015) calculated ecosystem WUE in China using the Boreal Ecosystem Productivity Simulator (BEPS) model, which indicated that WUE increased in Northeast China and central Inner Mongolia but WUE was reduced in Central China when drought happened from 2000 to 2011 [23]. Yu et al. (2008) indicated that WUE estimated from site measurements enhanced in drier regions (relative to precipitation-abundant regions [24]) in eastern China because plants decreased stomatal conductance to adapt to water-limited conditions [25]. Moreover, Yang et al. (2016) investigated the relationship between global WUE and wetness index (WI) and found that WUE rose in arid ecosystems but declined in semi-arid/sub-humid ecosystems during drought periods mainly because of distinct sensitivities of different ecosystems to changes in hydro-climatic conditions [26]. However, Huang et al. (2017) suggested that the global WUE negatively (both positively and negatively) responded to drought in arid (humid) ecosystems during 2000–2014 based on the spearman correlation between the WUE and Standardized Precipitation-Evapotranspiration Index (SPEI) [20]. The inconsistency may arise from distinct data source, time periods, biomes and the way WUE is defined in different studies. Although previous studies explored how drought affected the WUE at the global and point scales, the responses of regional WUE across different biomes and eco-climatic zones to drought were still not well understood.
Holling (1973) proposed the concept of system resilience to disturbances [27], which has been widely applied to terrestrial ecosystems in the past few decades [19,28]. The terrestrial ecosystem resilience represents the ability of an ecosystem to absorb disturbances from hydro-climate (e.g., drought) and to sustain or recover its structure and functions with ever-changing environments [28]. A resilient ecosystem could sustain or increase WUE to e nsure its productivity under water shortage conditions due to drought [29]. Ponce Campos et al. (2013) explored the relationship between WUE and drought during the drought in the early 21st century and found that Australian and North American ecosystems had strong biome-scale resilience according to increased WUE in the dry year [19]. Sharma et al. (2017) examined ecosystem resilience at the river basin scale in India during 2000–2014 based on the MODIS (Moderate Resolution Imaging Spectroradiometer) dataset and indicated that most basins in India were not resilient to disturbances [29].
Recently, previous studies have explored the spatiotemporal changes in WUE and the resilience in China [30,31], but how drought affected the WUE and the ecosystem resilience to drought in different biomes and nine sub-regions over China are not understood. In this study, the objectives are to (1) explore the spatiotemporal responses of WUE to drought over China during the period from 1982 to 2015 based on model tree ensemble-based evapotranspiration (MTE ET) and satellite-retrieved Global Land Surface Satellite (GLASS) Gross Primary Productivity (GPP) product; (2) assess the ecosystem resilience to drought in China at different scales (e.g., vegetation type and eco-climate regions). It will provide critical advice to the government for making reasonable ecosystem and water resources management strategies under natural and anthropogenic disturbances (e.g., drought).

2. Materials and Methods

2.1. Data Sources

Annual ET data used in this study were obtained from Li et al. (2018) [32], which estimated through machine learning approach (model tree ensemble, MTE) integrating eddy covariance ET and remote-sensing data from 1982 to 2015 at spatial resolution (hereafter MTE-ET, spatial resolution: 0.1°) [33,34]. Previous studies have demonstrated the capacity of MTE-ET to predict ET, even in regions where training data are not enough [32,35]. We used annual GLASS GPP product from 1982 to 2015 (hereafter GLASS-GPP, spatial resolution: 0.05°) produced by National Earth System Science Data Sharing Infrastructure, National Science and Technology Infrastructure of China (http://www.geodata.cn). It was estimated based on the Bayesian algorithm ensemble of eight light use efficiency models integrating the MODIS (Moderate Resolution Imaging Spectroradiometer) dataset, AVHRR (the Advanced Very High Resolution Radiometer) dataset and meteorological data [36]. The GLASS GPP was widely validated through 155 global eddy covariance measurements which contained nine terrestrial ecosystem types and applied in previous ecosystem carbon cycles studies at global and regional scales [36,37].
The widely used Standardized Precipitation-Evapotranspiration Index (SPEI, spatial resolution: 0.5°) developed by Vicente-Serrano et al. (2010) was applied which combined both flexible time scales and the sensitivity to changes in evaporative demand compared with other drought indexes (e.g., SPI—Standardized Precipitation Index and PDSI—Palmer Drought Severity Index) [38,39,40]. The 12-month SPEIs were selected to define annual drought severity during the period of 1982–2015 which can be directly acquired from the SPEI base version 2.5 products (http://digital.csic.es/handle/10261/153475). Annual gridded precipitation data (spatial resolution: 0.1°) was downloaded from the National Meteorological Information Center of the China Meteorological Administration (http://data.cma.cn/) at 613 meteorological stations in China, which was interpolated to raster data in order to be consistent with the resolution of ET and GPP through the Inverse Distance Weight (IDW) method which was weighted average interpolation based on the distance between points. Land cover map of 2015 (spatial resolution: 300 m ) from the European Space Agency Climate Change Initiative (http://maps.elie.ucl.ac.be/CCI/) was also aggregated to 0.1° by using the nearest neighbor method and also used to classify vegetation types (we reclassified the 38 land cover types into nine categories in this study, namely croplands—CRO, grasslands—GRA, evergreen broadleaf forests—EBF, deciduous broadleaf forests—DBF, evergreen needle-leaf forests—ENF, deciduous needle-leaf forests—DNF, mixed forests—MF, shrub lands—SHR and non-vegetation regions—NOV, Figure 1a) over China [41].
In addition, the study was carried out at nine sub-regions according to the Chinese climatic and administrative boundaries [42,43] and four eco-climatic zones according to multiyear average precipitation in China, as shown in Figure 1b. Moreover, GLASS-GPP and SPEI datasets were also uniformly aggregated to 0.1° using the nearest neighbor resampling method.

2.2. Methods

2.2.1. Trend and Correlation Analysis

In our study, we assessed the trends of annual WUE using the least-square regression model during 1982–2015 on a per-pixel basis [44]. A positive value of slope indicated an increasing trend, and vice versa. We applied Pearson correlation coefficient to examine the relationship between WUE and SPEI in China. Previous studies found the lagging effect of drought on ecosystem WUE and the lagging effect meant that previous-year drought could affect current-year WUE in the ecosystem [20,26,45]. In order to investigate the lagging effect, we established linear regression models between WUE and current-year SPEI as well as multivariable linear regression models among WUE, current-year, previous-year SPEI on each pixel as follows [20,26]:
WUE current = k × SPEI current + b ,
WUE current = k 1 × SPEI current + k 2 × SPEI previous + b ,
where WUEcurrent and SPEIcurrent represented current-year WUE and drought, SPEI previous represented previous-year SPEI. k (including k1 and k2) and b were slope and intercept of linear model, respectively. Akaike Information Criterion (AIC) was applied to assess the degree of fitting optimization and to determine whether the inclusion of previous-year SPEI improved the regression model between WUE and SPEI [46]. If the difference of AIC values between Equations (1) and (2) was higher than 2, the Equation (2) is optimized [47,48].

2.2.2. Resilience Analysis

The ecosystem resilience was considered as the ability of an ecosystem which could resist external disturbances (such as drought) and sustain the same structure and functions under changing conditions [19,49]. In this study, we used a dimensionless index (Rd) defined by Sharma et al. [29,50] to quantify terrestrial ecosystem resilience to drought on a per-pixel basis:
R d = WUE d WUE m ,
where Rd was ecosystem resilience index, WUEd was the WUE in driest year (the driest year can be determined according to the minimum of annual precipitation on each pixel) and WUEm was the mean annual WUE.
The value of Rd can be classified into four categories [29]: if Rd was greater than or equal to 1, the grid cell was considered to have resilience and it meant that the ecosystem can sustain its productivity by increasing or maintaining WUE during drought periods. The ecosystem was considered slightly non-resilient if 0.9 < Rd < 1, moderately non-resilient if Rd lied between 0.8 and 0.9, and severely non-resilient if Rd < 0.8.
Moreover, all analyses were performed in MATLAB R2017a (MathWorks, Natick, MA, USA), and maps were drawn using ArcMap 10.2 (Environment System Research Institute, Redlands, CA, USA).

3. Results

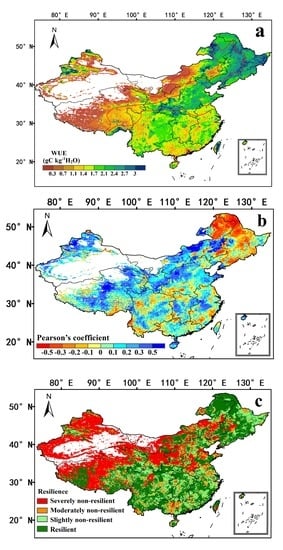
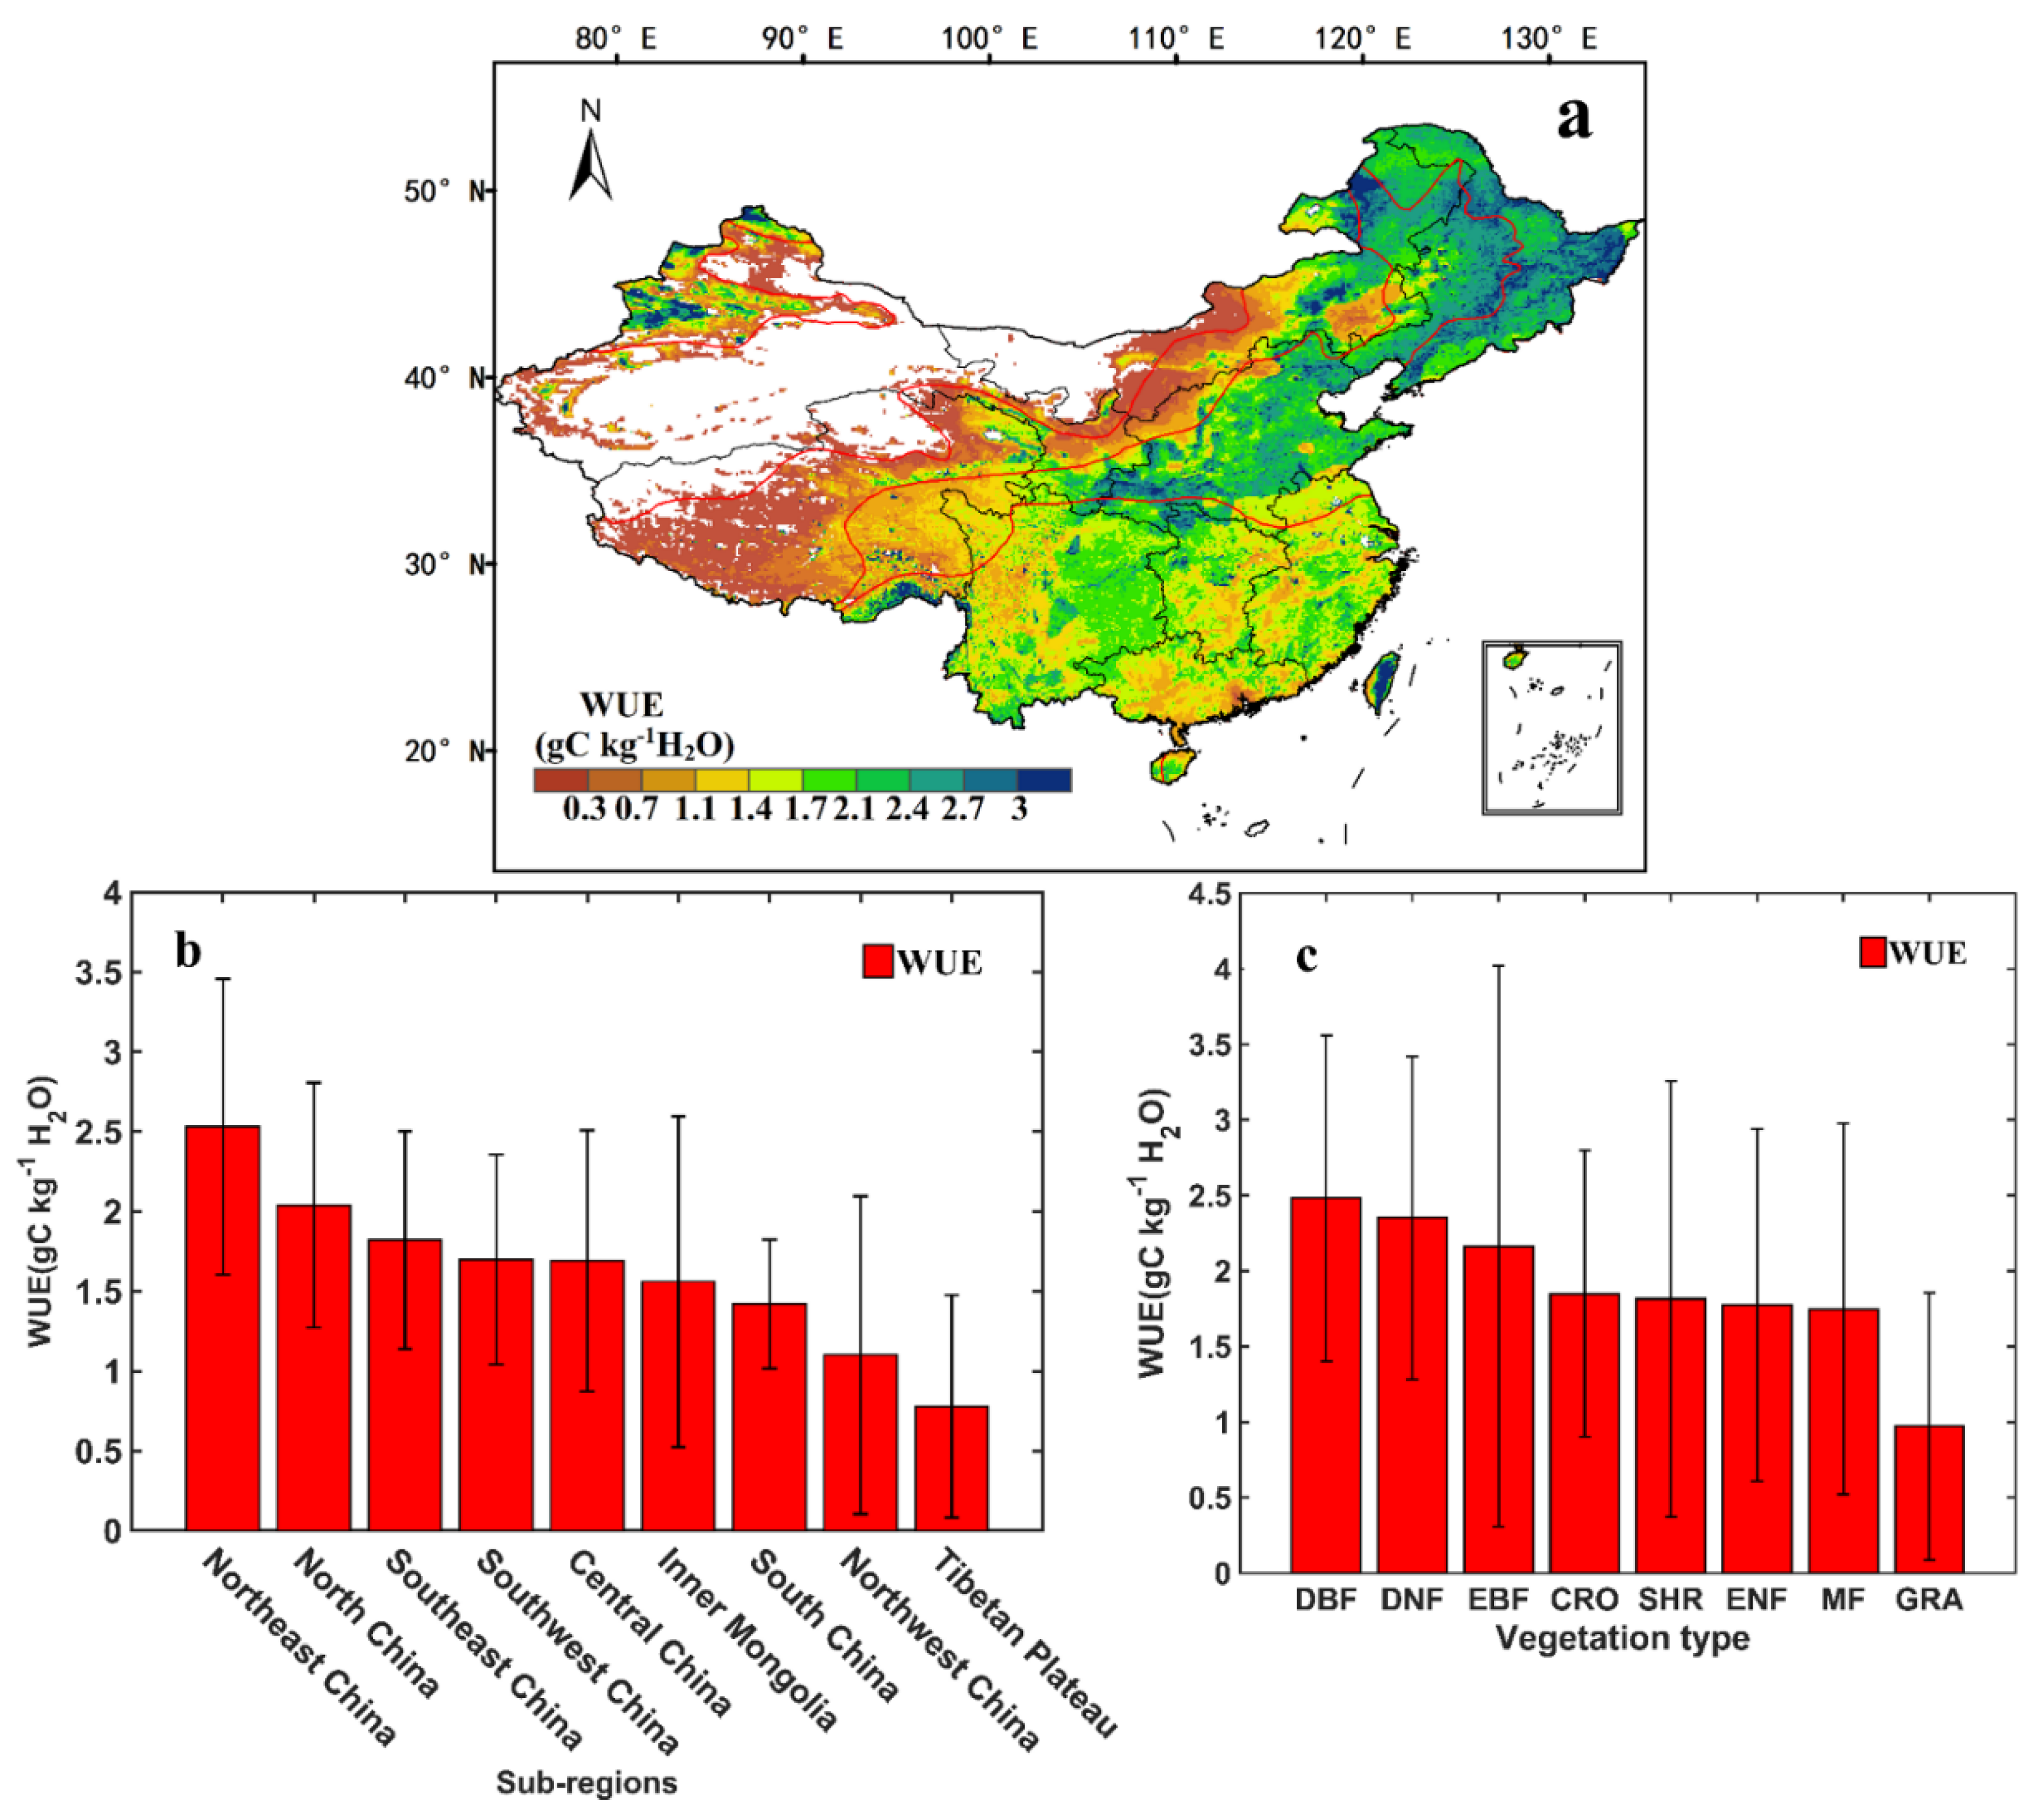
3.1. Spatial Distribution and Spatiotemporal Trends in Annual WUE over China

The spatial distribution of mean annual WUE showed large regional differences during the period 1982–2015 (Figure 2) with relatively higher values in southeastern China (sub-humid and humid zones) and lower values in northwestern China (sub-arid and arid zones). The multi-year average WUE was 1.55 g C kg−1 H2O (varied from 0 to 5.21 g C kg−1 H2O) in China with the highest regional WUE in Northeast China (2.53 g C kg−1 H2O) and the second in North China (2.04 g C kg−1 H2O). The average WUE in Central China, Inner Mongolia, Southeast China and Southwest China varied from 1.5 to 2.0 g C kg−1 H2O and the lowest WUE (0.78 g C kg−1 H2O) was in Tibetan Plateau among the nine sub-regions. For different vegetation types, the highest WUE was found for deciduous broadleaf forests (2.48 g C kg−1 H2O), followed by deciduous needle-leaf forests (2.35 g C kg−1 H2O) and evergreen broadleaf forests (2.16 g C kg−1 H2O). The annual mean WUE were similar in croplands (1.85 g C kg−1 H2O), shrub lands (1.81 g C kg−1 H2O), evergreen needle-leaf forests (1.77 g C kg−1 H2O) and mixed forests (1.75 g C kg−1 H2O). The grasslands had the lowest WUE (0.97 g C kg−1 H2O) among the eight vegetation categories.
The annual WUE showed a significantly increasing trend (slope: 8.5 × 10⁻³ g C kg−1 H2O per year) over China during the period of 1982–2015 (Figure 3a). Large inter-annual fluctuations were found in the WUE series with the highest value (1.75 g C kg−1 H2O) in 2013 and the lowest value (1.40 g C kg−1 H2O) in 1982. Spatially, WUE increased in approximately 77.1% of Chinese territory (significantly increased in 56.2% of Chinese territory) during the past 34 years, which was mostly distributed in the west parts in Inner Mongolia and Northeast China, the north parts in Southeast China, south parts in Southwest China and most regions in North China, South China and Tibetan Plateau. It should be noted that the increasing trends were relatively larger in the east of sub-humid zones. In contrast, the WUE in approximately 7.9% of Chinese territory exhibited negative trends, which distributed sporadically in the east of Inner Mongolia, Northeast China and Southeast China, south of North China and Northwest China, central region of Central China and north parts in Southwest China.

3.2. Effects of Drought on WUE in China during 1982–2015

The correlation between WUE and SPEI showed a large spatial heterogeneity in China from 1982 to 2015 (Figure 4). The WUE positively correlated to SPEI in approximately 65.4% of Chinese territory (significant in 13.7% of Chinese territory at the 0.05 level) whereas negatively correlated to SPEI in approximately 34.6% of Chinese territory (significant in 4.5% of Chinese territory, mainly in the northeast of Inner Mongolia and Northeast China and for DBF, DNF and SHR). The correlation coefficients were relatively higher in southwest parts of Inner Mongolia, central of Southeast China, Southwest China, Central China and South China and most regions of North China, Northwest China and Tibetan Plateau.
In order to explore the drought lagging effects on WUE in China, in our study we also calculated Pearson correlation coefficient between WUE and previous-year SPEI. As shown in Figure 5, the spatial distribution of correlations mostly coincides with that shown Figure 4, which indicated that the WUE responded to current-year drought and previous-year drought in the same direction in most parts of China. However, the WUE was positively correlated with current-year SPEI but negatively correlated with previous-year SPEI in the central of Inner Mongolia and some areas of South China, Central China and Southeast China. WUE was negatively correlated with current-year SPEI but positively correlated with previous-year SPEI in the central of Southwest China, north and east parts of Northeast China. In the DBF, DNF and SHR vegetation types, the WUE showed positive correlations with previous-year drought but negative correlations with current-year drought, which led to even greater effects on carbon and water exchange processes during long-lasting droughts. In our study, we also used Akaike Information Criterion (AIC) determine whether the inclusion of previous-year SPEI improved performances of the regression model between WUE and SPEI, which could also reveal the lagging effects of previous-year drought on WUE. Figure 5 showed that the difference in AIC of the two equations was less than −2 mainly in the east parts in Inner Mongolia and Northeast China, west and east parts in North China and central parts in Tibetan Plateau, which indicated that previous-year drought lagging effects on WUE in these regions were relatively larger than other regions.

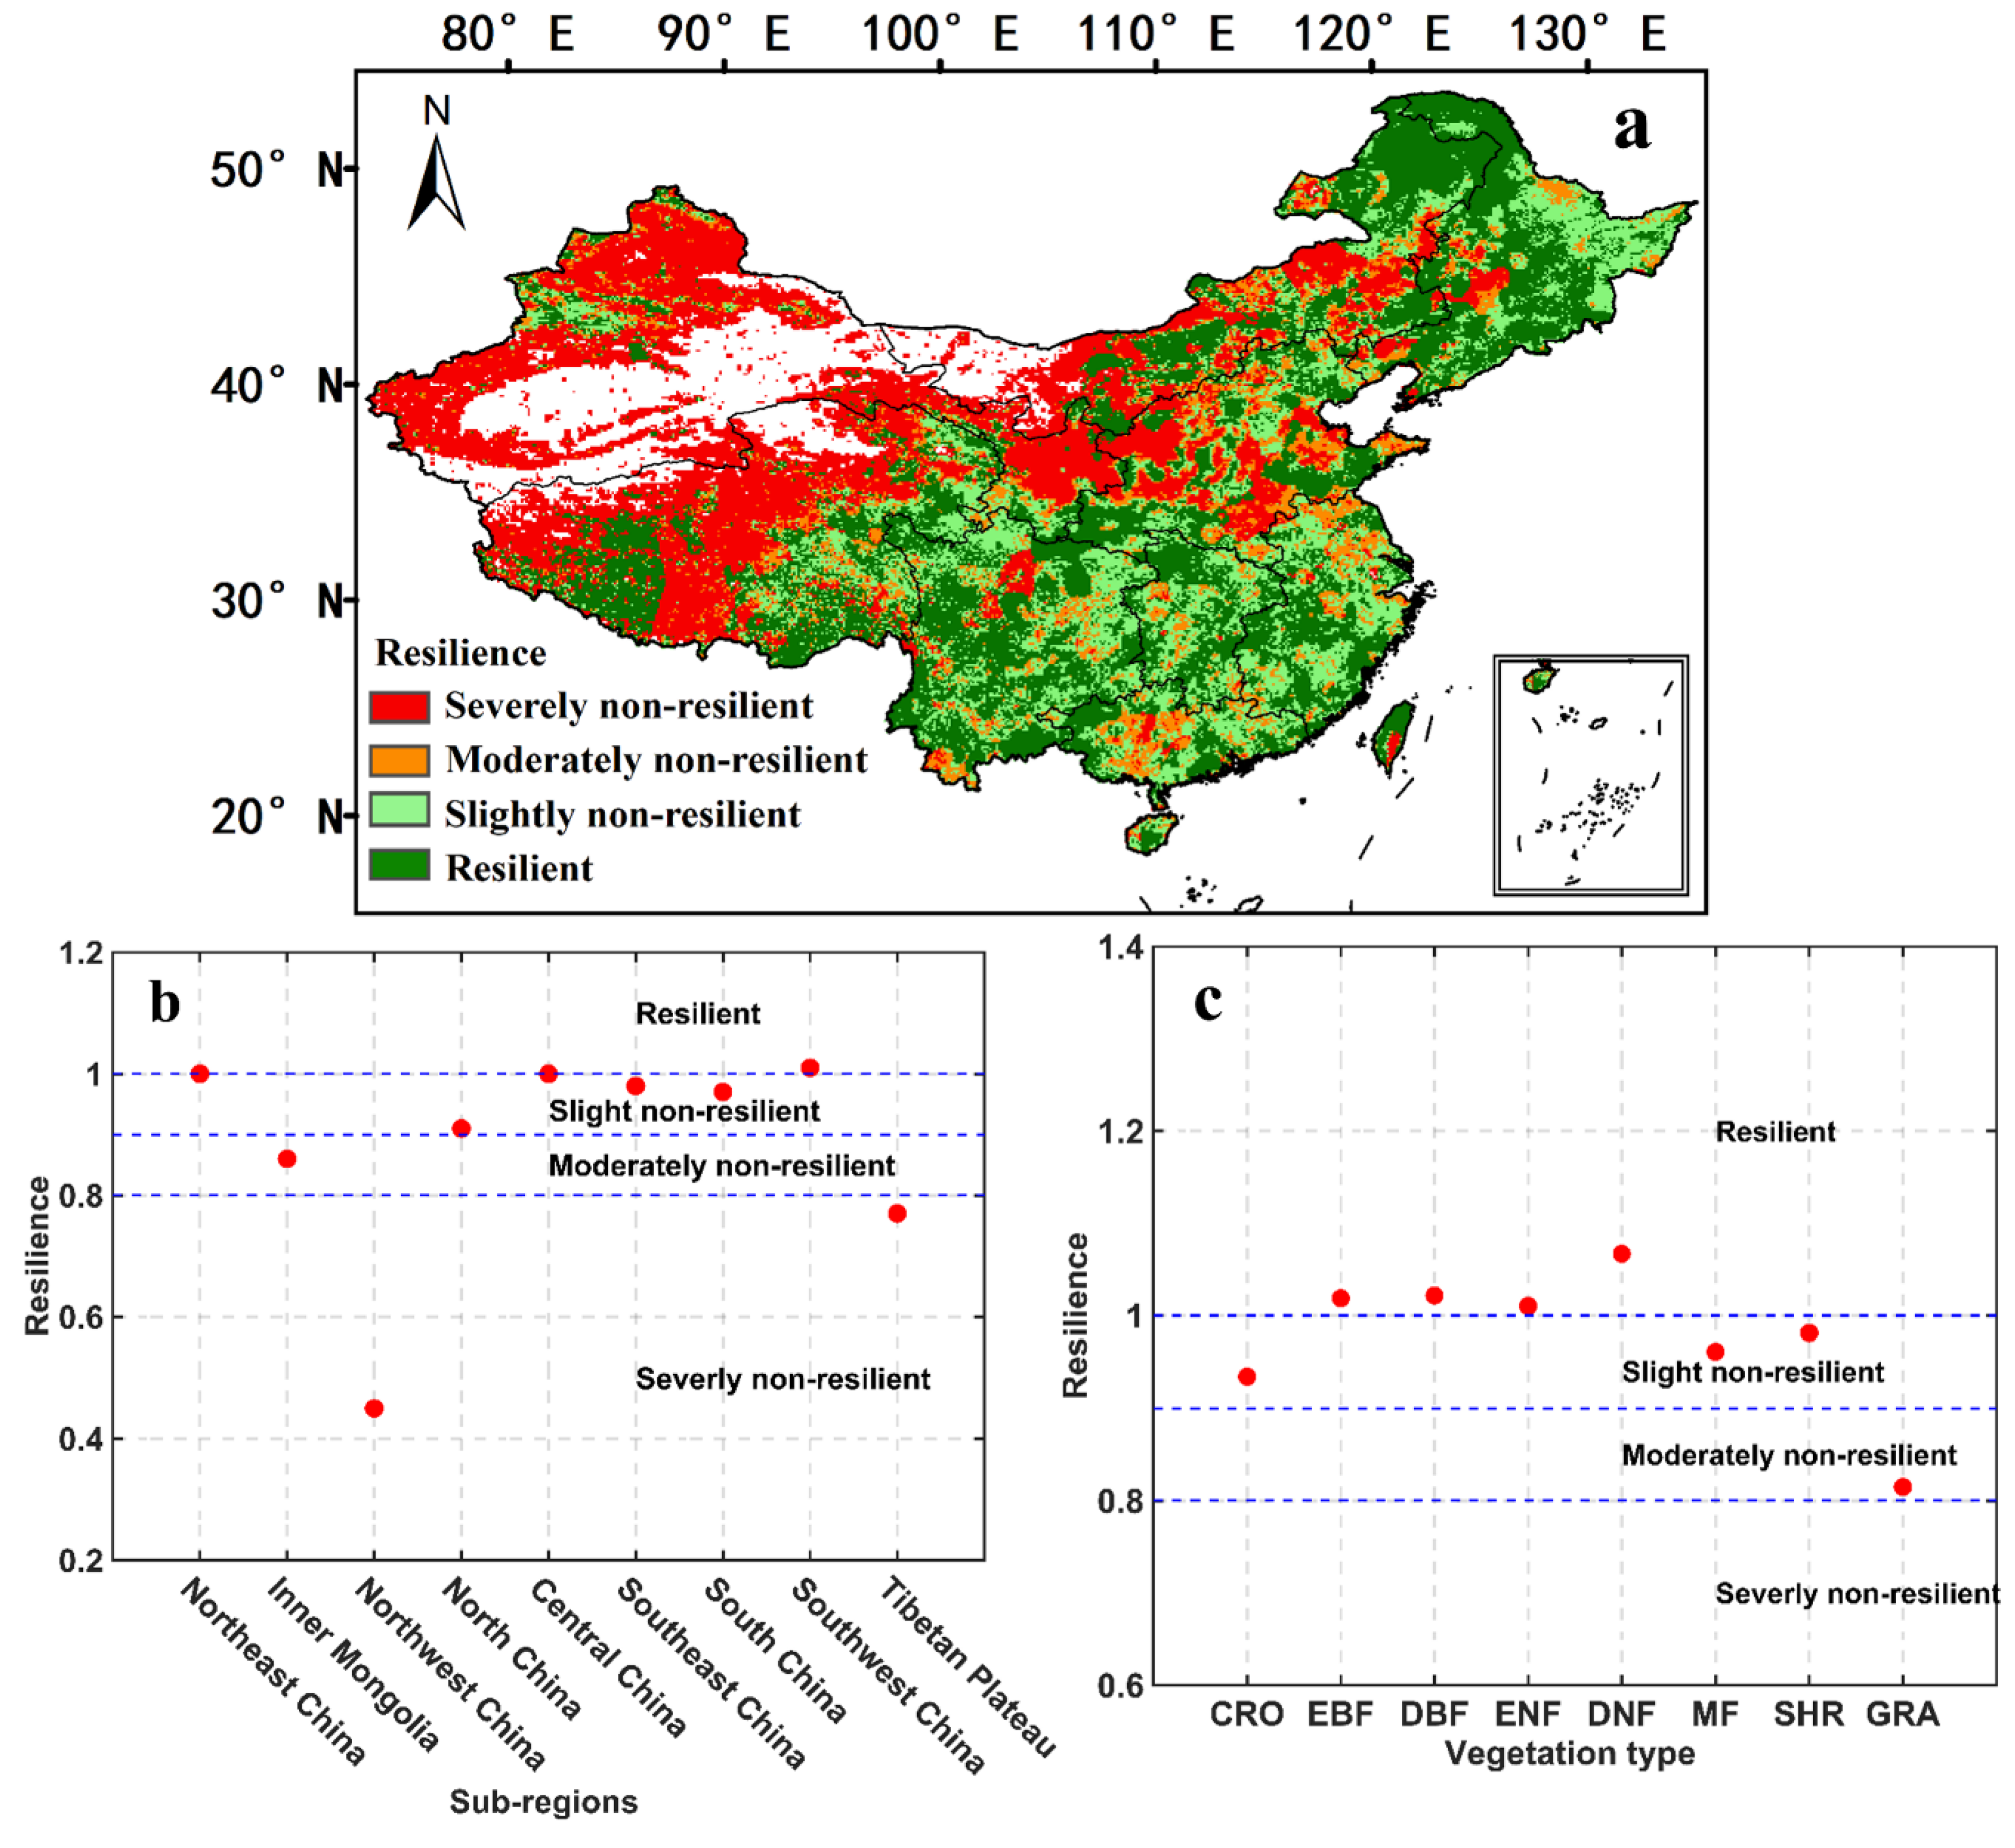
3.3. Ecosystem Resilience to Drought in China

Figure 6a shows the spatial distribution of ecosystem resilience to drought in China from 1982 to 2015, which evaluated the ability of an ecosystem to absorb and recover from the drought disturbances. On the whole, the terrestrial ecosystems were mostly resilient to drought in southeastern part of China and non-resilient to drought in northwestern China. Ecosystems in approximately 36.0% of Chinese territory were resilient to drought, which were mainly distributed in central parts in Northeast China, east parts in Inner Mongolia and most parts in Central China and Southwest China. On the contrary, about 21.7% of Chinese territory showed severely non-resilience, mainly located in almost all of Northwest China, central parts in North China, Tibetan Plateau and some regions in Inner Mongolia. Southwest China had the highest Rd (Rd = 1.0142) compared with other regions, followed by Northeast China and Central China. Moreover, ecosystems in Southeast China, North China and South China were slightly non-resilient to drought with Rd values of 0.9829, 0.9722 and 0.9032, respectively. Inner Mongolia was found to be moderately non-resilient, Northwest China (Rd = 0.4509) and Tibetan Plateau (Rd = 0.7677) had relatively lower Rd values, which meant that ecosystems in both regions were fragile and difficult to adapt to drought disturbances.
At vegetation type scale (Figure 6c), DNF, DBF, EBF and ENF exhibited relatively higher ecosystem resilience to drought (Rd ≥ 1) during the past 34 years. The croplands, shrub lands and mixed forests showed slightly non-resilient to drought with Rd values varying from 0.9 to 1. Grasslands had the lowest Rd (Rd = 0.8148), which meant that grassland was relatively more vulnerable to drought among all vegetation types.

4. Discussion

In our study, we estimated multiyear-averaged WUE (1.55 g C kg−1 H2O) and found large spatial differences of mean annual WUE in nine sub-regions due to the heterogeneities in climate, soils and plant physiological characteristics [20,23], which agreed mostly with Sun et al. (2018) and Liu et al. (2019) [31,32]. The highest annual WUE in Northeast China is probably due to its large areas of deciduous forests (DBF and DNF) [23,30] while the higher annual WUE in Central China, North China, Southeast China and Southwest China may be because of their suitable temperature, sufficient water supply [23] or large amount areas of crop lands [51,52]. In previous studies, the WUE of forests was usually higher than croplands, and grassland was usually the lowest [29,53,54]. However, the WUE in this study showed the following order: deciduous broadleaf forests > deciduous needle leaf forests > evergreen broadleaf forests > croplands > shrub lands > evergreen needle leaf forests > mixed forests > grasslands, which were similar to Liu et al. (2015) [23] except for croplands. The discrepancy in those studies could be partly attributed to the different environmental conditions, plant species, planting areas and cultivation methods. Moreover, the significant increasing trend (8.5 × 10⁻³ g C kg−1 H2O per year) of annual WUE found in this study which may be due to the increased atmospheric CO2 concentration [17,55,56]. However, the WUE trend was much higher than Sun et al. (2018) (7.32 × 10⁻⁴ g C kg−1 H2O per year) [30] which may induced by their different data sources. The significant increasing WUE in some regions of North China, Northeast China, Northwest China and Inner Mongolia may, to some extent, be owing to the implementation of ecological restoration projects (e.g., the ‘Three North’ Shelterbelt Development Program, the Grain-for-Green Project and the Beijing—Tianjin Sand Source Control Program) [57,58,59,60].
The relationship between WUE and SPEI in our study was positive in semi-arid which was consistent with Yang et al. (2016) [26]. The WUE in the Northeast China responded negatively with an increase in SPEI but Yang et al. (2016) showed positive correlations between WUE and drought in this region [26]. Moreover, our findings indicated that the relationship between WUE and SPEI in DBF was negative whereas was positive in Yang et al. (2016) [26] and Huang et al. (2017) [20]. These divergences could be due to differences in drought index, study areas and data sources. The different sensitivities of GPP and ET to droughts controlled the WUE-drought relationships across various sub-regions and biomasses [23,26]. For example, water supply played an important role for vegetation productivity [61] in arid and semi-arid regions (e.g., most parts in Inner Mongolia and Tibetan Plateau, Northwest China) with sparse vegetation (e.g., grasslands and croplands), and increase in precipitation (wetter) would mitigate water limitations and thus improve plant productivity in these regions [21,62], precipitation maybe was also consumed by soil evaporation, leading to an increase in ET [26,63]. However, the increased GPP was higher than ET, resulting in an increase in WUE. On the other hand, decrease in precipitation (drier) would trigger plants’ water-saving adaptive strategy (partly close their stomata) and further reduce photosynthesis. The ecosystem resilience would thus decrease under drought stresses due to decreased WUE induced by reduced GPP and almost unchanged ET in such regions [11,64]. The croplands in humid and semi-humid regions (e.g., Dongbei Plains, Huabei Plains, Yangtze River basin and some regions of South China) also showed relatively lower resilience to drought (the WUE for this region showed positive response to drought) due to their vulnerability to water stresses. The crops would wilt or even die under water deficiency conditions, thus the WUE will decrease with increased ET and declined ecosystem GPP [65,66]. In some humid and semi-humid regions (Northeast China, the west of Inner Mongolia and some many areas of southern China) with abundant vegetation (i.e., DBF and DNF), energy was the main factor affecting vegetation growth. The incoming shortwave solar radiation was reduced when SPEI increased, hindering the absorption of carbon [23]. And soil evaporation and vegetation transpiration enhanced owing to additional water input, so the WUE decreased. When drought event happened, the ecosystems of those regions could absorb the disturbances from drought and sustain its GPP by increasing WUE because of their strong ecosystem resilience [26]. The above findings are generally consistent with Liu et al. (2015) except for the central region of Inner Mongolia, which may be induced by the differences of data sources and time periods used [23]. Moreover, the anthropogenic factors (e.g., afforestation and deforestation) could also affect the ecosystem resilience in the west parts of in North China and Northwest China, the central of Inner Mongolia as well as some regions of Tibetan Plateau.
In our study, different vegetation types showed different WUE and their WUE showed different responses to drought. It may because GPP and ET in different vegetation types showed different sensitivities to climate change leading to the difference in carbon uptake and water consumption [65,66]. For example, grassland showed lowest WUE (Figure 2c), but its positive correlation between SPEI and WUE was the highest (Figure 4b). The growth and activity of grassland was highly dependent on water supply [67] and ecosystem productivity in grassland was closely related to precipitation [19,67]. Therefore, grassland had lowest GPP and lower ET [65,66] resulting in lowest WUE due to water limitations in arid and semi-arid regions. The growth rate and activity of grassland would decline when SPEI decreased (drought) [68] and the decreased GPP was higher than ET since GPP was more sensitive to drought than ET [26], leading to a decreased in WUE in the dry years. Moreover, DNF showed high WUE (Figure 2c), but its negative correlation between SPEI and WUE was the highest (Figure 4b). DNF was mainly distributed in humid and semi-humid regions, where energy supply was the main driver affecting vegetation functions [23,69]. Drought usually resulted in more incoming solar radiation (less precipitation and less cloud cover) and therefore in these radiation-limited, humid regions, drier, but also sunnier, conditions would imply a larger increase in GPP compared to ET, resulting in higher WUE [26,69].
Climate factors such as precipitation and temperature usually have lagging effects on vegetation growth [70,71]. In this study, we found that droughts also had lagging effects on ecosystem WUE in some regions (e.g., the east of Inner Mongolia and Northeast China, the west and east regions in North China and central parts in Tibetan Plateau). Yang et al. (2016) suggested that the relationship between WUE and SPEI in different years (previous-year and current-year) were in the opposite direction in all vegetation types over the world [26]. However, Huang et al. (2017) found that the impacts of drought in current-year and previous-year on WUE were in the same direction [20]. Their findings were generally not common in our investigation, which may be induced by the differences of data sources, methods and time periods used.
The main limitation of our study was the uncertainty of GPP and ET datasets. The ET data used in this study probably showed higher uncertainty in grasslands because few grassland flux-tower sites were applied in gridded ET estimation, which may result in slight underestimation of WUE [32]. Moreover, the interpolation of datasets with different spatial resolutions (e.g., the original spatial resolutions of ET, GPP and SPEI were 0.1°, 0.05° and 0.5°) may also cause uncertainties. Especially, high resolution drought monitoring datasets would undoubtedly be helpful to improve the robustness of related studies. Nevertheless, our findings revealed that the non-resilient ecosystems would encounter more challenges in ecological protection, agricultural production and carbon sequestration in the future due to increasing drought disturbances [29,72]. Policy makers could make reasonable water use strategies and efficient ecosystem management pathways to minimize the effects of drought under the warming climate.

5. Conclusions

In this study, we analyzed spatiotemporal variations in WUE and its response to droughts over China from 1982 to 2015. The ecosystem resilience to drought was then estimated using a dimensionless index at each grid cell. The multiyear-averaged WUE was 1.55 g C kg−1 H2O in China with relatively higher values in Northeast China and for deciduous broadleaf forests. The annual WUE increased (significantly increased) over 77.1% (56.2%) of Chinese territory. The annual WUE showed negative response to SPEI in forest regions in the northeast of Inner Mongolia, Northeast China and some regions of southern China as well as in deciduous broadleaf forests, deciduous needle leaf forests and shrub lands biomasses. An apparent lagging effect of drought on annual WUE was found in east parts in Northeast China, Inner Mongolia, west and east parts in North China and central parts in Tibetan Plateau. The terrestrial ecosystems showed resilience to drought in approximately 36.0% of Chinese territory mainly including several sub-regions (e.g., Central China, Northeast China, Southwest China) and vegetation types (e.g., deciduous needle-leaf forests, deciduous broadleaf forests, evergreen broadleaf forests and evergreen needle leaf forests). The results obtained in this study can improve our understanding on how ecosystem WUE responds to drought stresses and can inform local governments to take appropriate measures and strategies for sustainable water resources and ecosystem management in China.

Author Contributions

L.G. and W.L. designed and constructed this study framework; L.G. undertook data analysis and drafted the manuscript; W.L., Y.Z., F.S. and H.W. (Hong Wang). contributed to the manuscript; W.L., J.Z., H.C., B.D. and H.W. (Hongquan Wang). contributed significantly to our results section and helped to process the dataset.

Funding

This study was financially supported by the Strategic Priority Research Program of the Chinese Academy of Sciences (XDA23100401 and XDA23040504), the National Key Research and Development Program of China (2016YFC0401401 and 2016YFA0602402) and the National Science Foundation of China (41601035).

Acknowledgments

Thanks to the National Earth System Science Data Sharing Infrastructure, National Science and Technology Infrastructure of China. (http://www.geodata.cn) for offering the GPP dataset. The authors also thank Xangyi Li for producing ET datasets.

Conflicts of Interest

The authors declare no conflict of interest.

References

  1. Breshears, D.D.; Cobb, N.S.; Rich, P.M.; Price, K.P.; Allen, C.D.; Balice, R.G.; Romme, W.H.; Kastens, J.H.; Floyd, M.L.; Belnap, J.; et al. Regional Vegetation Die-off in Response to Global-Change-Type Drought. Proc. Natl. Acad. Sci. USA 2005, 102, 15144–15148. [Google Scholar] [CrossRef] [PubMed]
  2. Zhao, M.S.; Running, S.W. Drought-induced reduction in global terrestrial net primary production from 2000 through 2009. Science 2010, 329, 936–940. [Google Scholar] [CrossRef] [PubMed]
  3. Sheffield, J.; Wood, E.F.; Roderick, M.L. Little change in global drought over the past 60 years. Nature 2012, 491, 435–439. [Google Scholar] [CrossRef] [PubMed]
  4. Yu, G.; Chen, Z.; Piao, S.; Peng, C.; Ciais, P.; Wang, Q.; Li, X.; Zhu, X. High carbon dioxide uptake by subtropical forest ecosystems in the East Asian monsoon region. Proc. Natl. Acad. Sci. USA 2014, 111, 4910–4915. [Google Scholar] [CrossRef] [PubMed] [Green Version]
  5. Ciais, P.; Reichstein, M.; Viovy, N.; Granier, A.; Ogée, J.; Allard, V.; Aubinet, M.; Buchmann, N.; Bernhofer, C.; Carrara, A.; et al. Europe-wide reduction in primary productivity caused by the heat and drought in 2003. Nature 2005, 437, 529–533. [Google Scholar] [CrossRef] [PubMed]
  6. Song, L.; Zhu, J.; Zhang, J.; Zhang, T.; Wang, K.; Wang, G.; Liu, J. Effect of Drought and Topographic Position on Depth of Soil Water Extraction of Pinus sylvestris L. var. mongolica Litv. Trees in a Semiarid Sandy Region, Northeast China. Forests 2019, 10, 370. [Google Scholar] [CrossRef]
  7. Vicente-Serrano, S.M.; Gouveia, C.; Camarero, J.J.; Begueria, S.; Trigo, R.; Lopez-Moreno, J.I.; Azorin-Molina, C.; Pasho, E.; Lorenzo-Lacruz, J.; Revuelto, J.; et al. Response of vegetation to drought time-scales across global land biomes. Proc. Natl. Acad. Sci. USA 2013, 110, 52–57. [Google Scholar] [CrossRef] [PubMed]
  8. Liu, W.; Sun, F.; Lim, W.H.; Zhang, J.; Wang, H.; Shiogama, H.; Zhang, Y. Global drought and severe drought-affected populations in 1.5 and 2 °C warmer worlds. Earth Syst. Dynam. 2018, 9, 267–283. [Google Scholar] [CrossRef]
  9. Liu, W.; Sun, F. Increased adversely-affected population from water shortage below normal conditions in China with anthropogenic warming. Sci. Bull. 2019, 64, 567–569. [Google Scholar] [CrossRef] [Green Version]
  10. Ponton, S.; Flanagan, L.B.; Alstard, K.; Johnson, B.G.; Morgenstern, K.; Kljun, N.; Black, T.A.; Barr, A.G. Comparison of ecosystem water-use efficiency among Douglas-fir forest, aspen forest and grassland using eddy covariance and carbon isotope techniques. Glob. Chang. Biol. 2006, 12, 294–310. [Google Scholar] [CrossRef]
  11. Niu, S.; Xing, X.; Zhang, Z.; Xia, J.; Zhou, X.; Song, B.; Li, L.; Wan, S. Water-use efficiency in response to climate change: From leaf to ecosystem in a temperate steppe. Glob. Chang. Biol. 2011, 17, 1073–1082. [Google Scholar] [CrossRef]
  12. Ito, A.; Inatomi, M. Water-use efficiency of the terrestrial biosphere: A model analysis focusing on interactions between the global carbon and water cycles. J. Hydrometeorol. 2012, 13, 681–694. [Google Scholar] [CrossRef]
  13. Aguilos, M.; Stahl, C.; Burban, B.; Hérault, B.; Courtois, E.; Coste, S.; Wagner, F.; Ziegler, C.; Takagi, K.; Bonal, D. Interannual and Seasonal Variations in Ecosystem Transpiration and Water Use Efficiency in a Tropical Rainforest. Forests 2019, 10, 14. [Google Scholar] [CrossRef]
  14. Lawrence, D.M.; Thornton, P.E.; Oleson, K.W.; Bonan, G.B. The partitioning of evapotranspiration into transpiration, soil evaporation, and canopy evaporation in a GCM: impacts on land atmosphere interaction. J. Hydrometeorol. 2007, 8, 862. [Google Scholar] [CrossRef]
  15. Zhang, L.; Tian, J.; He, H.; Ren, X.; Sun, X.; Yu, G.; Lu, Q.; Lv, L. Evaluation of Water Use Efficiency Derived from MODIS Products against Eddy Variance Measurements in China. Remote Sens. 2015, 7, 11183–11201. [Google Scholar] [CrossRef] [Green Version]
  16. Tang, X.; Ma, M.; Ding, Z.; Xu, X.; Yao, L.; Huang, X.; Gu, Q.; Song, L. Remotely Monitoring Ecosystem Water Use Efficiency of Grassland and Cropland in China’s Arid and Semi-Arid Regions with MODIS Data. Remote Sens. 2017, 9, 616. [Google Scholar] [CrossRef]
  17. Zhou, S.; Yu, B.; Schwalm, C.R.; Ciais, P.; Zhang, Y.; Fisher, J.B.; Michalak, A.M.; Wang, W.; Poulter, B.; Huntzinger, D.N.; et al. Response of Water Use Efficiency to Global Environmental Change Based on Output from Terrestrial Biosphere Models. Glob. Biogeochem. Cycles 2017, 31, 1639–1655. [Google Scholar] [CrossRef]
  18. Tang, X.; Li, H.; Desai, A.R.; Nagy, Z.; Luo, J.; Kolb, T.E.; Olioso, A.; Xu, X.; Yao, L.; Kutsch, W.; et al. How is water-use efficiency of terrestrial ecosystems distributed and changing on Earth? Sci. Rep. 2015, 4, 7483. [Google Scholar] [CrossRef] [PubMed]
  19. Ponce-Campos, G.E.; Moran, M.S.; Huete, A.; Zhang, Y.; Bresloff, C.; Huxman, T.E.; Eamus, D.; Bosch, D.D.; Buda, A.R.; Gunter, S.A.; et al. Ecosystem resilience despite large-scale altered hydroclimatic conditions. Nature 2013, 494, 349–352. [Google Scholar] [CrossRef]
  20. Huang, L.; He, B.; Han, L.; Liu, J.; Wang, H.; Chen, Z. A global examination of the response of ecosystem water-use efficiency to drought based on MODIS data. Sci. Total Environ. 2017, 601–602, 1097–1107. [Google Scholar] [CrossRef]
  21. Sun, Y.; Piao, S.; Huang, M.; Ciais, P.; Zeng, Z.; Cheng, L.; Li, X.; Zhang, X.; Mao, J.; Peng, S.; et al. Global patterns and climate drivers of water-use efficiency in terrestrial ecosystems deduced from satellite-based datasets and carbon cycle models. Glob. Ecol. Biogeogr. 2016, 25, 311–323. [Google Scholar] [CrossRef]
  22. Teuling, A.J.; van Loon, A.F.; Seneviratne, S.I.; Lehner, I.; Aubinet, M.; Heinesch, B.; Bernhofer, C.; Grünwald, T.; Prasse, H.; Spank, U. Evapotranspiration amplifies European summer drought. Geophys. Res. Lett. 2013, 40, 2071–2075. [Google Scholar] [CrossRef]
  23. Liu, Y.; Xiao, J.; Ju, W.; Zhou, Y.; Wang, S.; Wu, X. Water use efficiency of China’s terrestrial ecosystems and responses to drought. Sci. Rep. 2015, 5, 13799. [Google Scholar] [CrossRef] [PubMed]
  24. Hu, Z.; Yu, G.; Fu, Y.; Sun, X.; Li, Y.; Shi, P.; Wang, Y.; Zheng, Z. Effects of vegetation control on ecosystem water use efficiency within and among four grassland ecosystems in China. Glob. Chang. Biol. 2008, 14, 1609–1619. [Google Scholar] [CrossRef]
  25. Yu, G.; Song, X.; Wang, Q.; Liu, Y.; Guan, D.; Yan, J.; Sun, X.; Zhang, L.; Wen, X. Water-use efficiency of forest ecosystems in eastern China and its relations to climatic variables. New Phytol. 2008, 177, 927–937. [Google Scholar] [CrossRef] [PubMed]
  26. Yang, Y.; Guan, H.; Batelaan, O.; McVicar, T.R.; Long, D.; Piao, S.; Liang, W.; Liu, B.; Jin, Z.; Simmons, C.T. Contrasting responses of water use efficiency to drought across global terrestrial ecosystems. Sci. Rep. 2016, 6, 23284. [Google Scholar] [CrossRef] [PubMed] [Green Version]
  27. Holling, C.S. Resilience and Stability of Ecological Systems. Annu. Rev. Ecol. Syst. 1973, 4, 1–23. [Google Scholar] [CrossRef] [Green Version]
  28. Walker, B.; Salt, D. A Crash Course in the Science of Resilience. In The Community Resilience Reader: Essential Resources for an Era of Upheaval; Lerch, D., Ed.; Island Press: Washington, DC, USA, 2013; pp. 163–178. [Google Scholar]
  29. Sharma, A.; Goyal, M.K. Assessment of ecosystem resilience to hydroclimatic disturbances in India. Glob. Change. Biol. 2017, 24, e432–e441. [Google Scholar] [CrossRef]
  30. Sun, S.B.; Song, Z.L.; Wu, X.C.; Wang, T.J.; Wu, Y.T.; Du, W.L.; Che, T.; Huang, C.L.; Zhang, X.J.; Ping, B.; et al. Spatial-temporal variations in water use efficiency and its drivers in China over the last three decades. Ecol. Indic. 2018, 94, 292–304. [Google Scholar] [CrossRef]
  31. Liu, W.; Sun, F.; Sun, S.; Guo, L.; Wang, H.; Cui, H. Multi-scale assessment of eco-hydrological resilience to drought in China over the last three decades. Sci. Total Environ. 2019, 672, 201–211. [Google Scholar] [CrossRef]
  32. Li, X.; He, Y.; Zeng, Z.; Lian, X.; Wang, X.; Du, M.; Jia, G.; Li, Y.; Ma, Y.; Tang, Y.; et al. Spatiotemporal pattern of terrestrial evapotranspiration in China during the past thirty years. Agric. For. Meteorol. 2018, 259, 131–140. [Google Scholar] [CrossRef]
  33. Jung, M.; Reichstein, M.; Bondeau, A. Towards global empirical upscaling of FLUXNET eddy covariance observations: validation of a model tree ensemble approach using a biosphere model. Biogeosci. Discuss. 2009, 6, 5271–5304. [Google Scholar] [CrossRef]
  34. Liu, W.; Wang, L.; Zhou, J.; Li, Y.; Sun, F.; Fu, G.; Li, X.; Sang, Y. A worldwide evaluation of basin-scale evapotranspiration estimates against the water balance method. J. Hydrol. 2016, 538, 82–95. [Google Scholar] [CrossRef] [Green Version]
  35. Zeng, Z.; Wang, T.; Zhou, F.; Ciais, P.; Mao, J.; Shi, X.; Piao, S. A worldwide analysis of spatiotemporal changes in water balance-based evapotranspiration from 1982 to 2009. J. Geophys. Res.-Atmos. 2014, 119, 1186–1202. [Google Scholar] [CrossRef]
  36. Yuan, W.P.; Liu, S.G.; Yu, G.R.; Bonnefond, J.M.; Chen, J.Q.; Davis, K.; Desai, A.R.; Goldstein, A.H.; Gianelle, D.; Rossi, F.; et al. Global estimates of evapotranspiration and gross primary production based on MODIS and global meteorology data. Remote Sens. Environ. 2010, 114, 1416–1431. [Google Scholar] [CrossRef] [Green Version]
  37. Liu, Z.J.; Shao, Q.Q.; Liu, J.Y. The performances of MODIS GPP and ET products in China and their sensitivity to input data (FPAR/LAI). Remote Sens. 2015, 7, 135–152. [Google Scholar] [CrossRef]
  38. Vicente-Serrano, S.M.; Beguería, S.; López-Moreno, J.I. A multiscale drought index sensitive to global warming: the standardized precipitation evapotranspiration index. J. Clim. 2010, 23, 1696–1718. [Google Scholar] [CrossRef]
  39. Guttman, N.B. Comparing the palmer drought index and the standardized precipitation index. JAWRA J. Am. Water Resour. Assoc. 1998, 34, 113–121. [Google Scholar] [CrossRef]
  40. Vicente-Serrano, S.M.; Beguería, S.; Lorenzo-Lacruz, J.; Camarero, J.J.; López-Moreno, J.I.; Azorin-Molina, C.; Revuelto, J.; Morán-Tejeda, E.; Sanchez-Lorenzo, A. Performance of Drought Indices for Ecological, Agricultural, and Hydrological Applications. Earth Interact. 2012, 16, 1–27. [Google Scholar] [CrossRef] [Green Version]
  41. Bontemps, S.; Defourny, P.; Radoux, J.; van Bogaert, E.; Lamarche, C.; Achard, F.; Mayaux, P.; Boettcher, M.; Brockmann, C.; Kirches, G.; et al. Consistent global land cover maps for climate modelling communities: Current achievements of the ESA’ Land cover CCI. Presented at the ESA Living Planet Symposium 2013, Edinburgh, UK, 9–13 September 2013. [Google Scholar]
  42. Jin, J.X.; Wang, Y.; Jiang, H.; Kong, Y.; Lu, X.H.; Zhang, X.Y. Improvement of ecological geographic regionalization based on remote sensing and canonical correspondence analysis: A case study in China. Sci. China Earth Sci. 2016, 59, 1745–1753. [Google Scholar] [CrossRef]
  43. Zheng, J.Y.; Bian, J.J.; Ge, Q.S.; Hao, Z.X.; Yin, Y.H.; Liao, Y.M. The climate regionalization in China for 1981–2010. Chin. Sci. Bull. 2012, 58, 3088–3099. [Google Scholar]
  44. Cai, B.F.; Yu, R. Advance and evaluation in the long time series vegetation trends research based on remote sensing. Chin. J. Remote Sens. 2009, 6, 1170–1186. [Google Scholar]
  45. Zhang, X.; Susan Moran, M.; Zhao, X.; Liu, S.; Zhou, T.; Ponce-Campos, G.E.; Liu, F. Impact of prolonged drought on rainfall use efficiency using MODIS data across China in the early 21st century. Remote Sens. Environ. 2014, 150, 188–197. [Google Scholar] [CrossRef]
  46. Akaike, H. Information theory and an extension of the maximum likelihood principle. In Hirotugu Akaike; Springer: Berlin/Heidelberg, Germany, 1998; pp. 199–213. [Google Scholar]
  47. Tu, J. Spatially varying relationships between land use and water quality across an urbanization gradient explored by geographically weighted regression. Appl. Geogr. 2011, 31, 376–392. [Google Scholar] [CrossRef]
  48. Tu, J.; Xia, Z.G. Examining spatially varying relationships between land use and water quality using geographically weighted regression I: Model design and evaluation. Sci. Total Environ. 2008, 407, 358–378. [Google Scholar] [CrossRef] [PubMed]
  49. Walker, B.; Hollin, C.S.; Carpenter, S.; Kinzig, A. Resilience, Adaptability and Transformability in Social-Ecological Systems. Ecol. Soc. 2004, 9, 5. [Google Scholar] [CrossRef]
  50. Sharma, A.; Goyal, M.K. District-level assessment of the ecohydrological resilience to hydroclimatic disturbances and its controlling factors in India. J. Hydrol. 2018, 564, 1048–1057. [Google Scholar] [CrossRef]
  51. Tong, X.; Li, J.; Yu, Q.; Qin, Z. Ecosystem water use efficiency in an irrigated cropland in the North China Plain. J. Hydrol. 2009, 374, 329–337. [Google Scholar] [CrossRef]
  52. Zhao, F.; Yu, G.; Li, S.; Ren, C.; Sun, X.; Mi, N.; Li, J.; Ouyang, Z. Canopy water use efficiency of winter wheat in the North China Plain. Agric. Water Manag. 2007, 93, 99–108. [Google Scholar] [CrossRef]
  53. Zhu, X.; Yu, G.; Wang, Q.; Hu, Z.; Zheng, H.; Li, S.; Sun, X.; Zhang, Y.; Yan, J.; Wang, H.; et al. Spatial variability of water use efficiency in China’s terrestrial ecosystems. Glob. Planet. Chang. 2015, 129, 37–44. [Google Scholar] [CrossRef]
  54. Xiao, J.; Sun, G.; Chen, J.; Chen, H.; Chen, S.; Dong, G.; Gao, S.; Guo, H.; Guo, J.; Han, S.; et al. Carbon fluxes, evapotranspiration, and water use efficiency of terrestrial ecosystems in China. Agric. For. Meteorol. 2013, 182–183, 76–90. [Google Scholar] [CrossRef]
  55. Zhu, Q.; Jiang, H.; Peng, C.; Liu, J.; Wei, X.; Fang, X.; Liu, S.; Zhou, G.; Yu, S. Evaluating the effects of future climate change and elevated CO2 on the water use efficiency in terrestrial ecosystems of China. Ecol. Model. 2011, 222, 2414–2429. [Google Scholar] [CrossRef]
  56. Keenan, T.F.; Hollinger, D.Y.; Bohrer, G.; Dragoni, D.; Munger, J.W.; Schmid, H.P.; Richardson, A.D. Increase in forest water-use efficiency as atmospheric carbon dioxide concentrations rise. Nature 2013, 499, 324–327. [Google Scholar] [CrossRef] [PubMed]
  57. Liu, X.F.; Hu, B.Y.; Ren, Z.Y. Spatiotemporal variation of water use efficiency and its driving forces on the Loess Plateau during 2000–2014. Chin. Sci. Agric. Sin. 2018, 51, 302–314. [Google Scholar]
  58. Wu, Z.; Wu, J.; He, B.; Liu, J.; Wang, Q.; Zhang, H.; Liu, Y. Drought off-set ecological restoration program-induced increase in vegetation activity in the Beijing–Tianjin sand source region, China. Environ. Sci. Technol. 2014, 48, 12108–12117. [Google Scholar] [CrossRef]
  59. Xiao, J. Satellite evidence for significant biophysical consequences of the “Grain for Green” Program on the Loess Plateau in China. J. Geophys. Res.-Biogeosci. 2014, 119, 2261–2275. [Google Scholar] [CrossRef]
  60. Zhang, Y.; Peng, C.; Li, W.; Tian, L.; Zhu, Q.; Chen, H.; Fang, X.; Zhang, G.; Liu, G.; Mu, X.; et al. Multiple afforestation programs accelerate the greenness in the ‘Three North’ region of China from 1982 to 2013. Ecol. Indic. 2016, 61, 404–412. [Google Scholar] [CrossRef]
  61. Bai, Y.; Wu, J.; Xing, Q.; Pan, Q.; Huang, J.; Yang, D.; Han, X. Primary production and rain use efficiency across a precipitation gradient on the Mongolia Plateau. Ecology 2008, 89, 2140–2153. [Google Scholar] [CrossRef]
  62. Khalifa, M.; Elagib, N.A.; Ribbe, L.; Schneider, K. Spatio-temporal variations in climate, primary productivity and efficiency of water and carbon use of the land cover types in Sudan and Ethiopia. Sci. Total. Environ. 2018, 624, 790–806. [Google Scholar] [CrossRef]
  63. Zhang, Y.; Peña-Arancibia, J.L.; McVicar, T.R.; Chiew, F.H.S.; Vaze, J.; Liu, C.; Lu, X.; Zheng, H.; Wang, Y.; Liu, Y.Y.; et al. Multi-decadal trends in global terrestrial evapotranspiration and its components. Sci. Rep. 2016, 6, 19124. [Google Scholar] [CrossRef] [Green Version]
  64. Niu, S.; Wu, M.; Han, Y.; Xia, J.; Li, L.; Wan, S. Water-mediated responses of ecosystem C fluxes to climatic change in a temperate steppe. New Phytol. 2008, 177, 209–219. [Google Scholar] [CrossRef] [PubMed]
  65. Liu, Y.; Ju, W.; He, H.; Wang, S.; Sun, R.; Zhang, Y. Changes of net primary productivity in China during recent 11 years detected using an ecological model driven by MODIS data. Front. Earth Sci. 2013, 7, 112–127. [Google Scholar] [CrossRef]
  66. Liu, Y.; Zhou, Y.; Ju, W.; Chen, J.; Wang, S.; He, H.; Wang, H.; Guan, D.; Zhao, F.; Li, Y.; et al. Evapotranspiration and water yield over China’s landmass from 2000 to 2010. Hydrol. Earth Syst. Sci. 2013, 17, 4957–4980. [Google Scholar] [CrossRef]
  67. Knapp, A.K.; Smith, M.D. Variation among biomes in temporal dynamics of aboveground primary production. Science 2001, 291, 481–484. [Google Scholar] [CrossRef] [PubMed]
  68. Chaves, M.M.; Maroco, J.P.; Pereira, J.S. Understanding plant responses to drought-from genes to the whole plant. Funct. Plant Biol. 2003, 30, 239–264. [Google Scholar] [CrossRef]
  69. Yang, Y.T.; Donohue, R.J.; McVicar, T.R.; Roderick, M.L. An analytical model for relating global terrestrial carbon assimilation with climate and surface conditions using a rate limitation framework. Geophys. Res. Lett. 2015, 42, 9825–9835. [Google Scholar] [CrossRef] [Green Version]
  70. Mu, S.; Li, J.; Chen, Y.; Gang, C.; Zhou, W.; Ju, W. Spatial differences of variations of vegetation coverage in Inner Mongolia during 2001–2010. Acta Geogr. Sin. 2012, 67, 1255–1268. [Google Scholar]
  71. Wu, D.; Zhao, X.; Liang, S.; Zhou, T.; Huang, K.; Tang, B.; Zhao, W. Time-lag effects of global vegetation responses to climate change. Global. Change. Biol. 2015, 21, 3520–3531. [Google Scholar] [CrossRef]
  72. Netzer, M.S.; Sidman, G.; Pearson, T.R.H.; Walker, S.M.; Srinivasan, R. Combining Global Remote Sensing Products with Hydrological Modeling to Measure the Impact of Tropical Forest Loss on Water-Based Ecosystem Services. Forests 2019, 10, 413. [Google Scholar] [CrossRef]
Figure 1. Spatial distribution of (a) vegetation types (EBF: evergreen broadleaf forests, DBF: deciduous broadleaf forests, ENF: evergreen needle-leaf forests, DNF: deciduous needle-leaf forests, MF: mixed forests and NOV: non-vegetation regions), (b) eco-climatic zones (Semi-arid, Sub-humid, Arid and Humid) and sub-regions (1: Northeast China, 2: Inner Mongolia, 3: Northwest China, 4: North China, 5: Central China, 6: Southeast China, 7: South China, 8: Southwest China and 9: Tibetan Plateau) over China.
Forests 10 00598 g001
Figure 2. The spatial distribution of mean annual water use efficiency (WUE) (a) in China (the white color indicates non-vegetated areas, and the black and red lines showed the boundaries of sub-regions and eco-climatic zones). The regional mean annual WUEs for each sub-region and vegetation type (DBF: deciduous broadleaf forests, DNF: deciduous needle-leaf forests, EBF: evergreen broadleaf forests, CRO: croplands, SHR: shrub lands, ENF: evergreen needle-leaf forests, MF: mixed forests and GRA: grasslands) are exhibited in (b,c). The error bars in (b,c) were standard deviation of WUE in each sub-region and vegetation type.
Forests 10 00598 g002
Figure 3. Temporal (a) and spatial (b) trends in annual WUE over China from 1982 to 2015. The white color in (b) indicates non-vegetated areas, and the black and red lines show the boundaries of sub-regions and eco-climatic zones. The light gray and dark gray colors in (b) indicate that trends in annual WUE were not significantly increased and decreased at the 0.05 level.
Forests 10 00598 g003
Figure 4. The spatial distribution of Pearson correlation coefficient between WUE and Standardized Precipitation-Evapotranspiration Index (SPEI) (a) in China during the period 1982–2015 (the white color indicates non-vegetated areas, and the black and red lines showed the boundaries of sub-regions and eco-climatic zones). The regional mean correlation coefficients for different vegetation types (CRO: croplands, EBF: evergreen broadleaf forests, DBF: deciduous broadleaf forests, ENF: evergreen needle-leaf forests, DNF: deciduous needle-leaf forests, MF: mixed forests, SHR: shrub lands and GRA: grasslands) are exhibited in (b). The error bars in (b) were standard deviation of Pearson correlation coefficient in each vegetation type.
Forests 10 00598 g004
Figure 5. The spatial distributions of correlation coefficient between WUE and previous-year SPEI (a) and of difference in Akaike Information Criterion value (ΔAIC) between Equations (1) and (2) (c) in China during the period 1982–2015 (white color indicates non-vegetated regions, and the black and red lines show the boundaries of sub-regions and eco-climatic zones). The regional mean correlation coefficients for different vegetation types (CRO: croplands, EBF: evergreen broadleaf forests, DBF: deciduous broadleaf forests, ENF: evergreen needle-leaf forests, DNF: deciduous needle-leaf forests, MF: mixed forests, SHR: shrub lands and GRA: grasslands) between WUE and current-year (previous-year) SPEI are exhibited in (b). The error bars in (b) were standard deviation of Pearson correlation coefficient in each vegetation type.
Forests 10 00598 g005
Figure 6. The spatial distribution of ecosystem resilience to drought in China (a) during the period 1982–2015 (the white color indicates non-vegetated areas, and the black and red lines show the boundaries of sub-regions and eco-climatic zones). The regional mean Rd for different sub-regions and vegetation types (CRO: croplands, EBF: evergreen broadleaf forests, DBF: deciduous broadleaf forests, ENF: evergreen needle-leaf forests, DNF: deciduous needle-leaf forests, MF: mixed forests, SHR: shrub lands and GRA: grasslands) are exhibited in (b,c).
Forests 10 00598 g006

