
Ecological Gradient Analysis and Environmental Interpretation of Cyclocarya paliurus Communities


1
College of Forestry, Nanjing Forestry University, Nanjing 210037, China
2
Co-Innovation Center for Sustainable Forestry in Southern China, Nanjing Forestry University, Nanjing 210037, China
*
Author to whom correspondence should be addressed.
Forests 2021, 12(2), 146; https://doi.org/10.3390/f12020146
Submission received: 11 January 2021
/
Revised: 22 January 2021
/
Accepted: 22 January 2021
/
Published: 27 January 2021
(This article belongs to the Section Forest Ecology and Management)
Abstract
:Cyclocarya paliurus (Batal.) Iljinsk. is mainly distributed in the subtropical areas of China. The leaves of this species are rich in beneficial secondary metabolites exhibiting bioactivity against human diseases, including hyperlipemia, diabetes, and hypertension. To explore the adaptability and distribution characteristics along the environmental gradient of this species, investigation of the characteristics of C. paliurus communities is necessary. In this study, we established 31 sample plots, each 20 m × 20 m, and comparatively analyzed the species composition, species importance value, and tree species diversity of different C. paliurus communities in 2 years. Canonical correspondence analyses were carried out: the first between tree-species importance value and 12 environmental factors, and the second between C. paliurus population-related indices and the 12 environmental factors. On the basis of these analyses, we identified tree species varying markedly in abundance in the studied C. paliurus communities. Several tree species showed adaptive characteristics similar to those of C. paliurus. We also observed that the C. paliurus importance value varied along elevational, longitudinal, and temperature gradients. Our findings should be valuable for prediction of C. paliurus adaptive areas and mixed forest afforestation in different distribution areas.
1. Introduction
Cyclocarya paliurus distributed in the subtropical areas of China, is the only extant species in a genus formerly present in North America and Europe [1,2]. This species grew at middle elevations in mountainous areas [2]. The leaves of C. paliurus have long been consumed as a tea and contain abundant active compounds, including phenolics, triterpenoids, and polysaccharides, all of which are beneficial to human health [3,4,5,6]. Considerable efforts are currently being focused on the genetic and environmental interaction of C. paliurus. Previous studies have analyzed the genetic diversity and structure of C. paliurus populations [2], the responses of individual secondary metabolites to abiotic factors [7,8,9], and phenotypic variations in secondary metabolite accumulation among populations [10,11]. Genotyping of C. paliurus germplasm at the population level has revealed that different genotypes respond differently to abiotic factors, including shading [12], light regime [13], and other environmental aspects [8,9].
Despite the above research progress, spatial distribution characteristics of C. paliurus communities are still lacking. C. paliurus is distributed in the valleys of the Dabie, Wuyi, Nanling, Wu, and Xuefeng mountains in the subtropical regions of China [2]. Trees of this species are always scattered in small populations of five to 20 individuals. A molecular marker analysis of a C. paliurus population from Muchuan, Sichuan Province, uncovered high-level genetic diversity in this only extant member of the genus [2]. This indicates that the center of origin of C. paliurus was near present-day Sichuan Province and that this species is a Quaternary relic. The species is intolerant of flooding [2] and thus has adapted to low elevations of mountainous habitats with suitable light conditions. Previous research has revealed that C. paliurus is always sporadically distributed, which implies limited adaption and poor regeneration ability in forest communities [2,14,15]. C. paliurus seeds exhibit both exogenous and endogenous dormancy and remain deeply dormant for 2 years in natural environments [3]. Xiong et al. [16] reported that C. paliurus recruitment has a strong positive response to forest gaps. Additionally, a resource conservation strategy for this species is urgently needed because of its limited regeneration, narrow water requirements and scattered distribution. Research on the adaptive characteristics of C. paliurus, including the responses of C. paliurus communities and populations to a wide range of environmental variations, is thus critically needed. In this study, we subjected data from multiple C. paliurus communities to canonical correspondence analysis (CCA) to investigate their living patterns. Our objective was to identify the C. paliurus communites distribution characteristics along environmental gradient in forests.
2. Materials and Methods
2.1. Data Collection
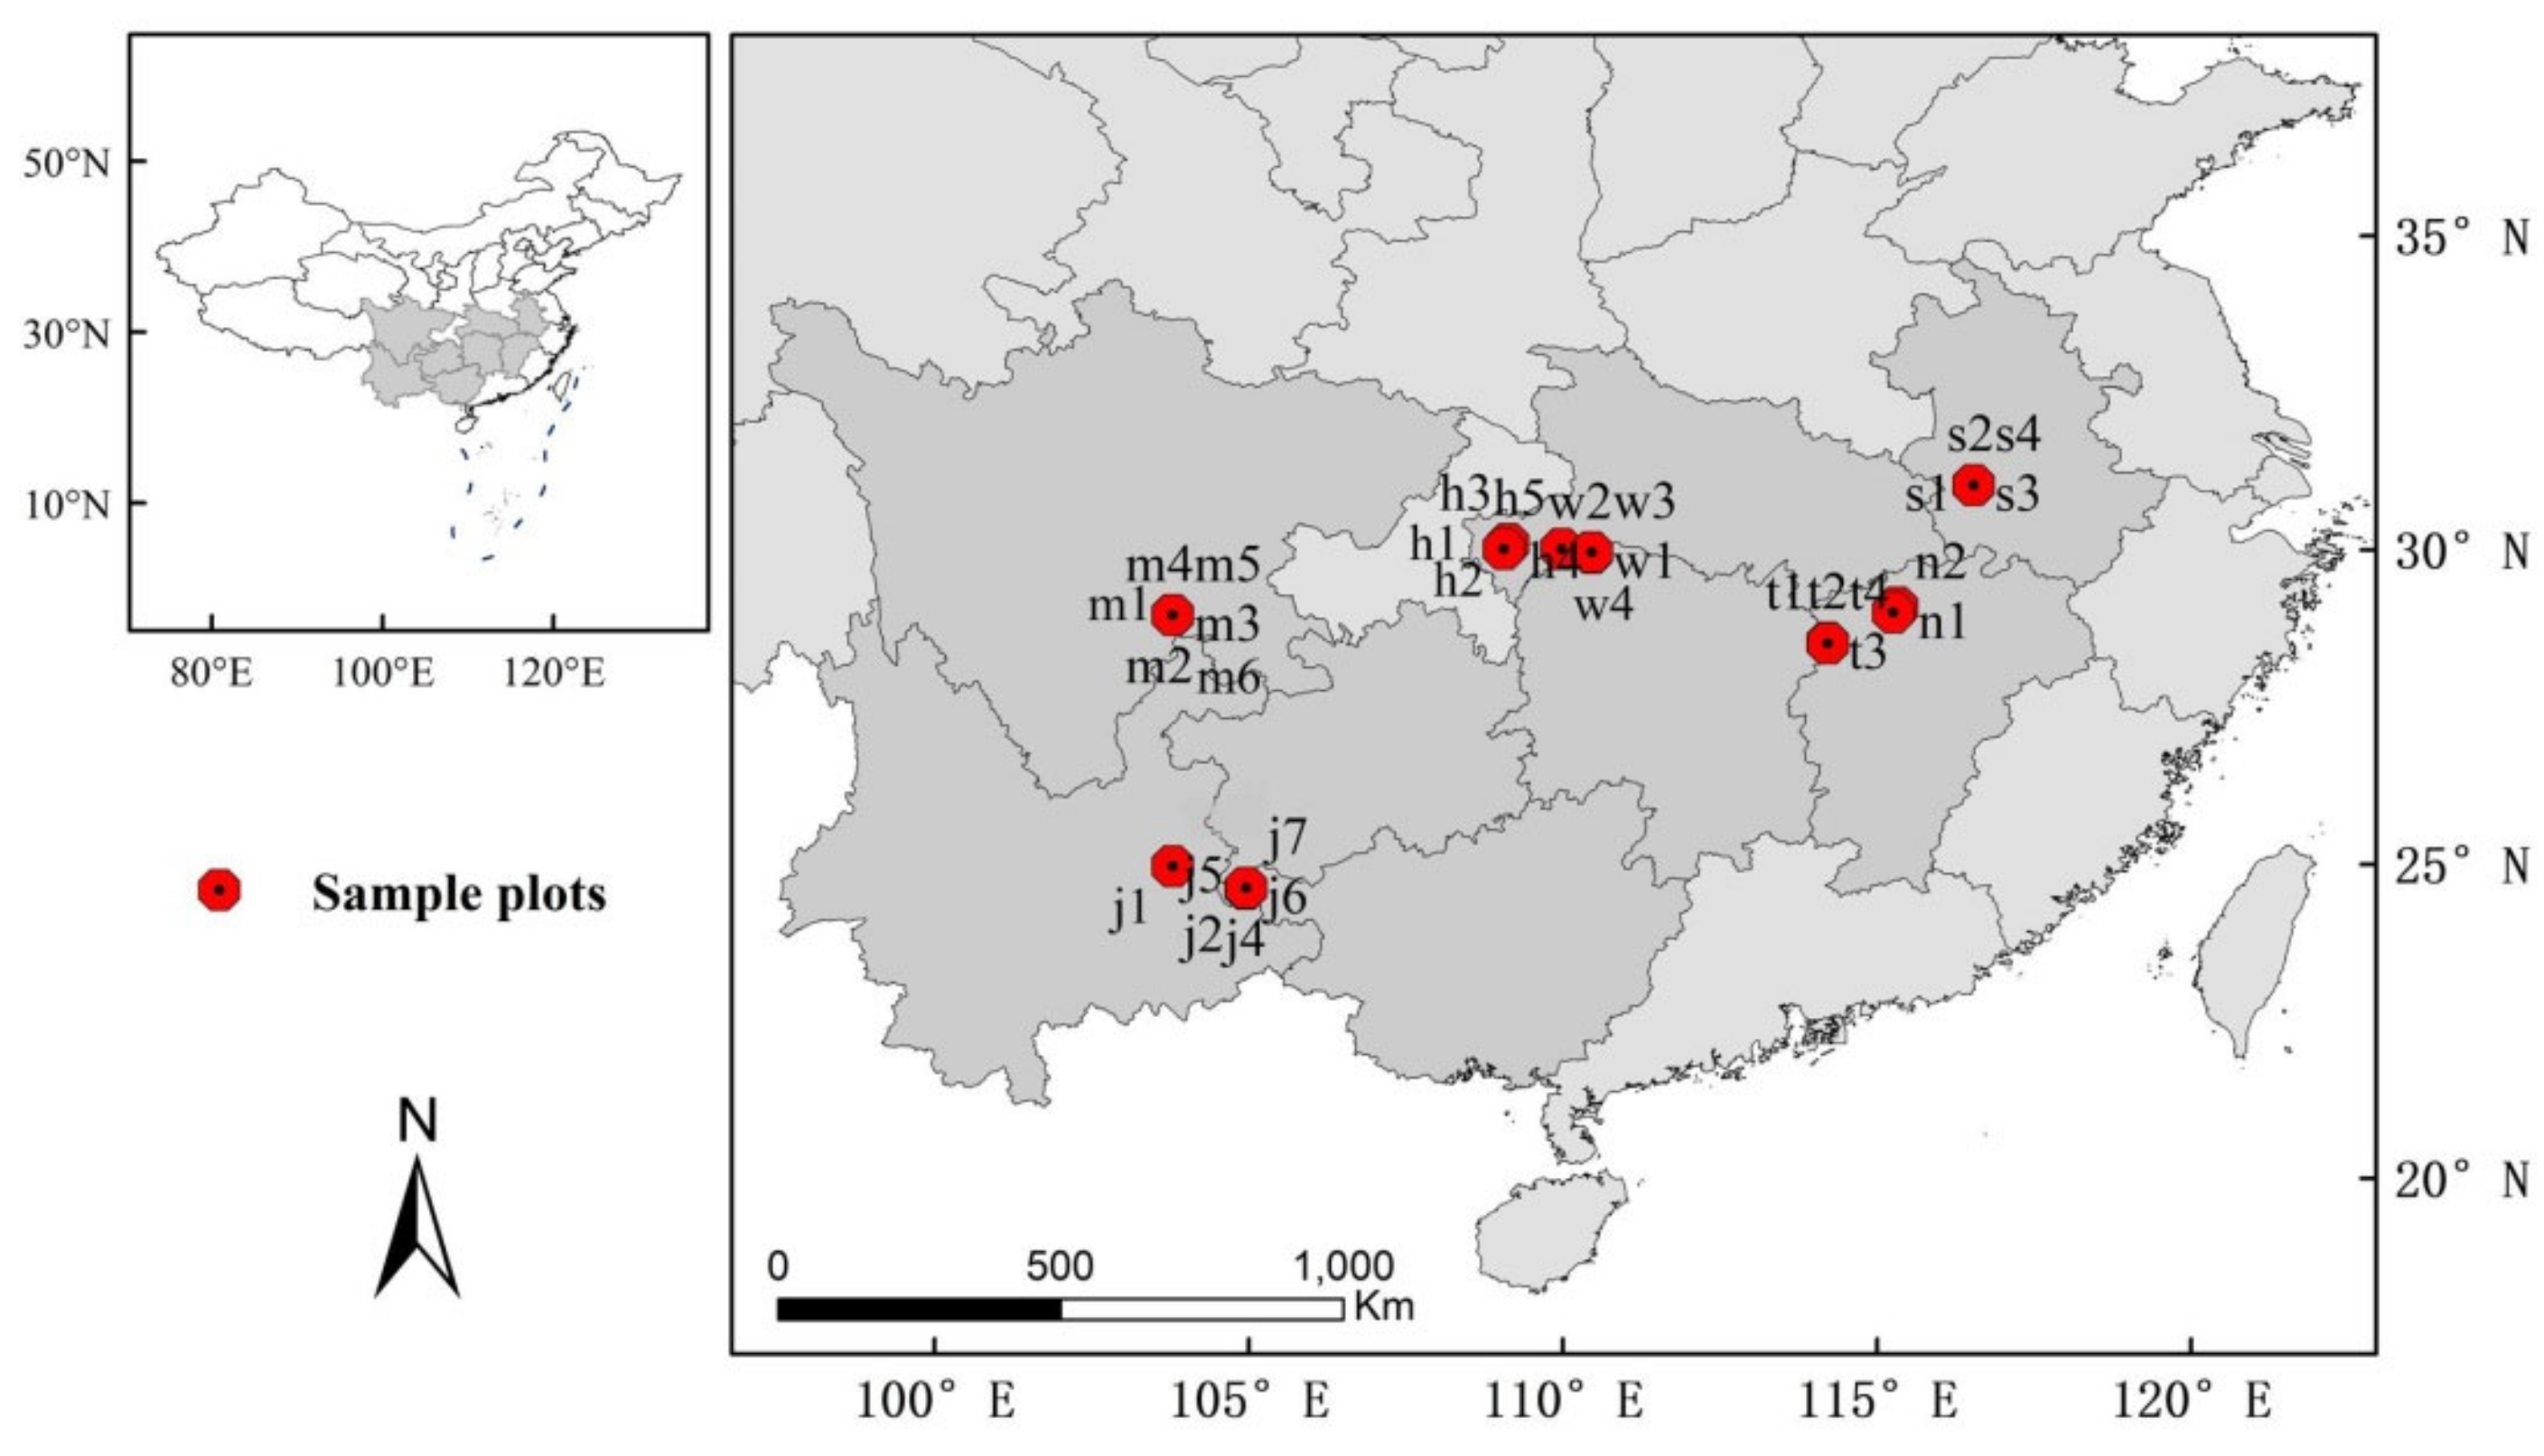
We investigated C. paliurus communities situated at different longitudes, latitudes, and elevations in their main distribution areas. Except for small communities could only set less sample plots, we established four or five 20 m × 20 m sample plots in each community. In total, 31 sample plots were set up in seven regions from Sichuan Provnice, Jiangxi Province, Hubei province, Guangxi Zhuang Autonomous Region and Anhui Province (Figure 1). In each sample plot, we recorded the species, diameter at breast height (DBH), tree height, and crown diameter of each living tree having a DBH ≥ 1 cm and height ≥ 1.3 m. Latitude, longitude, and elevation were measured by GPS, and aspect and slope were measured with a hand-held compass (DQL-5, Harbin Optical Instrument Factory, Harbin, China) in 2 years. Aspect was also recorded in terms of numerical grades in segments of 45°, starting from the north: 1 for a north slope (247.5°–292.5°), 2 for a northeast slope (292.5°–337.5°), 3 for a northwest slope (202.5°–247.5°), 4 for an east slope (337.5°–22.5°), 5 for a west slope (157.5°–202.5°), 6 for a southeast slope (22.5°–67.5°), 7 for a southwest slope (112.5°–157.5°), and 8 for a south slope (67.5°–112.5°). In this system, a larger aspect value thus corresponds to a more southward-facing slope receiving more light [17].
Three soil-sampling locations were randomly selected in each 20 m × 20 m sample plot. After removing surface litter, 300 g of soil was collected from 0–20 cm and 20–40 cm depths with a soil auger, with three replicates. Soil samples from the two layers were combined, air dried, cleaned of debris, and passed twice through a 100-mesh sieve. The pH was then measured with a pH meter. To obtain a soil profile of each plot, soil was sampled with a circular soil cutter and dried at 105 °C to a constant weight, and soil bulk density was measured.
Climate data were obtained from the National Meteorological Data Service Center of China to serve as the closest approximate values for annual mean temperature, maximum temperature, minimum temperature, and annual mean rainfall in each region.
2.2. Data Analysis
As a comprehensive quantity index, we calculated the importance value (IV) of each tree species as follows:
We calculated values of various diversity indices, including species richness and Simpson diversity, Shannon–Wiener diversity and Pielou uniformity indices. In these equations, 𝑅𝑂 represents the number of species, and 𝑃𝑖 is the relative frequency of species i in the community.
- Species richness:
- Simpson diversity:
- Shannon–Wiener diversity:
- Pielou uniformity:
Canonical correspondence analysis (CCA) is used to describe the spatial distribution characteristics of communities, including herbaceous plants, forests, animals, and microbes [18,19,20,21,22,23]. This method combines species variables with complicated environmental ones to facilitate extraction of correlations to the maximum extent objectively possible. In addition, a CCA plot can be used to visualize how factors influence one another. To analyze the tree species distribution characteristics in C. paliurus communities, the first CCA was carried out using species IV as the response variable and 12 environmental factors as the explanatory variables. The following matrices were established: factor matrix 1 (31 sample plots × 30 major tree species IV) and factor matrix 2 (31 sample plots × 12 environmental factors). To analyze C. paliurus spatial distribution characteristics along with environment variation, the second CCA was carried out using ecological indices of C. paliurus communities (C. paliurus IV, abundance, relative abundance, and relative cover degree; species richness; Simpson diversity, Shannon–Wiener diversity, and Pielou uniformity indices) as response variables and environmental factors as explanatory variables. We constructed the following matrices: factor matrix 1 (31 sample plots × 8 ecological indices of C. paliurus communities) and factor matrix 2 (31 sample plots × 12 environmental factors). All CCAs were conducted using the vegan v1.8-5 package [24] in the R v3.4.4 statistical environment (R Development Core Team 2018) with the package vegan v. 1.8–5 [25]. Scatter plot construction and correlation analyses were conducted using SPSS statistics software (Version 19.0, Chicago, IL, USA)
3. Results
We analyzed C. paliurus communities represented by 31 sample plots in the seven major distribution areas shown in Figure 1 (Muchuan, Sichuan Provnice; Tonggu and Wuning counties, Jiangxi Province; Wufeng and Hefeng counties, Hubei province; Yongfu County, Guangxi Zhuang Autonomous Region; Shucheng County, Anhui Province). The sample plots were located along an environmental gradient suitable for in-depth analysis and were overall a good representation of C. paliurus community distribution characteristics (Table 1). The sampling design covered a wide latitudinal and longitudinal range, spanning form 103.79° N to 116.54° N and from 24.61° E to 31.04° E and across an altitudinal gradient of approximately 1100 m, between 744 and 1829 m. The climate was also very variable with annual temperature ranging from 12.99 to 24.62 °C, minimum temperature ranging from 3.54 to 8.12 °C and maximum temperature ranging from 28.5 to 33.1 °C. Besides, precipitation gradient reached nearly 800 mm (from 1326 to 2100 mm). The sample plots distributed in all directions of aspect varying from 10 to 50° slope. The soil pH (3.18 to 5.92 acidic), 0–20 cm soil bulk density (0.55 to 1.62 g/cm−3) and 20–40 cm soil bulk density (0.54 to 1.48 g/cm−3) were recorded and also showed large difference.
As shown in Table 2, we identified 190 tree species in the 31 sample plots. We calculated the IV of each species, which summed to a total IV of 22.96. Among the identified species, the IV of C. paliurus summed across the 31 sample plots was 7.42, corresponding to 32% of total IV. The sum of the IV of the top 30 tree species, which included C. paliurus, was 15.51, which represented 68% of the total IV of the 190 tree species. On the basis of these results, we accordingly used the IVs of the first 30 tree species in subsequent analyses.
In addition to C. paliurus, several tree species had a broad distribution range. The most widespread species after C. paliurus was Acer davidii, which was distributed in five regions: Hefeng County, Hubei Province; Yongfu County, Guangxi Zhuang Autonomous Region; Muchuan County, Sichuan Province; Wuning County, Jiangxi Province; and Shucheng County, Anhui Province. Acer elegantulum and Liquidambar formosana were each present in four regions. In contrast, several tree species showed limited adaption, being distributed in only one region, including Cryptomeria fortunei and Castanea henryi (both only in Hefeng County, Hubei Province, China), Ilex centrochinensis (Muchuan County, Sichuan Province, China), Taxus chinensis (Tonggu County, Jiangxi Province, China), Dendrobenthamia capitata (Wufeng County, Hubei Province, China), Lithocarpus glaber (Yongfu County, Guangxi Zhuang Autonomous Region, China), and Tapiscia sinensis (Shucheng County, Anhui Province, China).
With regard to species presence in plots, A. davidii was distributed in 11 sample plots, the most of any species except C. paliurus. Acer elegantulum, Cinnamomum wilsonii, and Lithocarpus harlandii each appeared in nine sample plots, while Dendropanax dentiger and Eurya japonica were both found in eight. Liquidambar formosana occupied seven sample plots. Finally, Cryptomeria fortunei and Castanea henryi were only distributed in two sample plots.
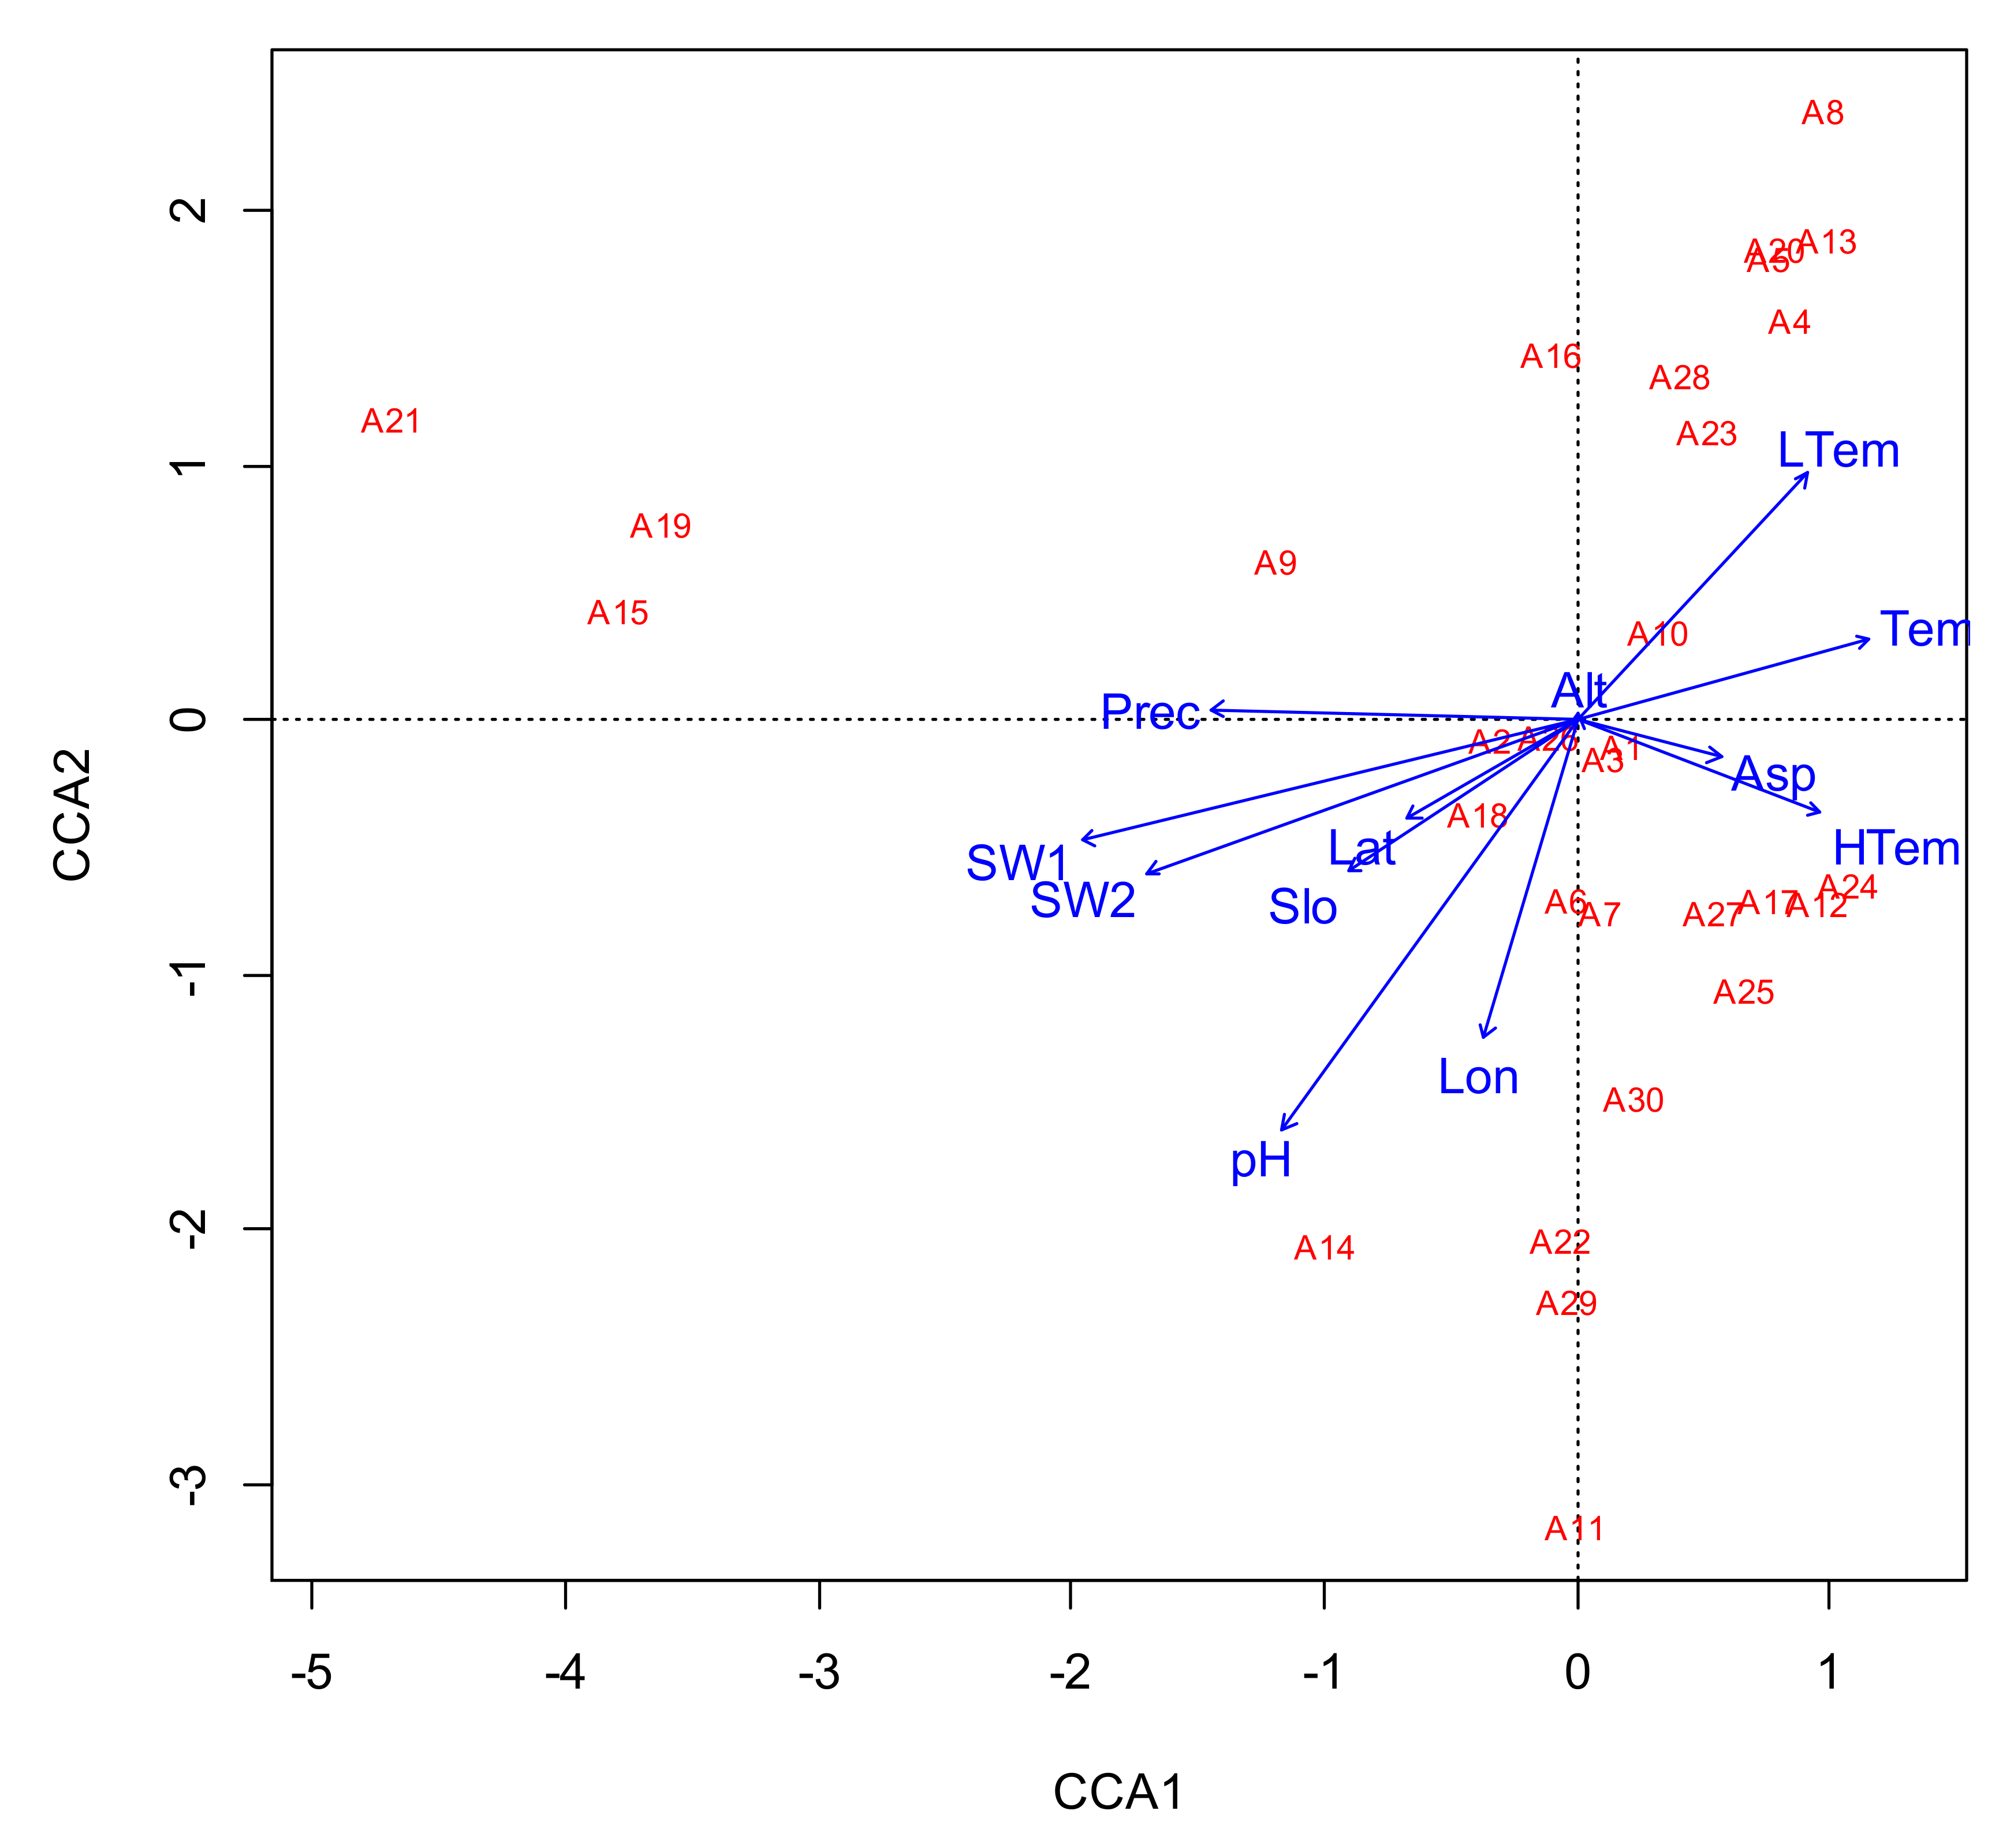
A CCA between the 30 major tree species in the C. paliurus communities and 12 environmental factors was conducted (Table 3). The results obtained using the CCA model were significant at the p = 0.001 level and effectively revealed that most of the tested environmental factors contribute to species distributions in C. paliurus communities. According to the model, the 12 environmental factors were responsible for 61.2% of the variation in tree species total IV, with the first four and two principal components explaining 37.1 and 21.2% of the variation, respectively.
As shown in Figure 2 and Figure 3, the 31 sample plots were distributed along various environmental gradients. The most extreme gradients were those of precipitation (1326 to 2100 mm), annual mean temperature (12.99 to 24.62 °C), annual minimum temperature (3.54 to 8.12 °C), and longitude (31.04° E to 24.61° E), which were the environmental factors with the greatest influence on tree species distribution. We found that tree species distribution markedly varied along the environment gradients. Unlike most species, the distribution of C. paliurus was relatively unaffected by the environment of its communities. Swida macrophylla, Clerodendrum japonicum, and Castanea henryi preferentially inhabited areas with higher precipitation (nearly 2000 mm), while I. ficoidea Hemsl., Cinnamomum wilsonii, Castanopsis fargesii Franch., I. centrochinensis, and Diplospora dubia were more likely to be distributed in areas with higher annual minimum temperatures (nearly 3 °C). In addition, Dendrobenthamia capitata, Bothrocaryum controversum, A. palmatum Thunb, and Carpinus viminea tended to occupy higher longitudes (nearly 30° E). Cunninghamia lanceolata, Liquidambar formosana, and Dendropanax dentiger were adapted to habitats similar to C. paliurus, with IVs of 0.45, 0.42, and 0.21, respectively. The IVs of all recorded species, however, were much lower than that of C. paliurus (7.42).
The tree species distributional characteristics of C. paliurus communities were described according to the above CCA model. To further analyze C. paliurus population distribution, another CCA model was applied. The following data from the 31 sample plots were used as the response variables (Table 4): species richness; Shannon–Wiener, Pielou, and Simpson indices; and C. paliurus IV, abundance, relative abundance, and relative coverage. As explanatory variables, we used the 12 environmental factors described above.
The results of the second CCA are shown in Table 5. As indicated by the table, the 12 environmental factors explained 65.2% of the variation in the distributional characteristics of C. paliurus populations. The first four principal components were the main contributors, with 62.5% of the variation explained by the first two principal components, namely, 35.6% by CCA1 and 26.9% by CCA2. The CCA plot of the first two principal components was therefore able to describe most of the distributional characteristics of C. paliurus populations.
As shown in Figure 4, the 31 sample plots were distributed along broad environmental gradients. According to the results of the CCA, the environmental factors with the closest relationship with the distributional characteristics of C. paliurus populations were annual maximum temperature, elevation, longitude, slope, aspect, and annual mean temperature.
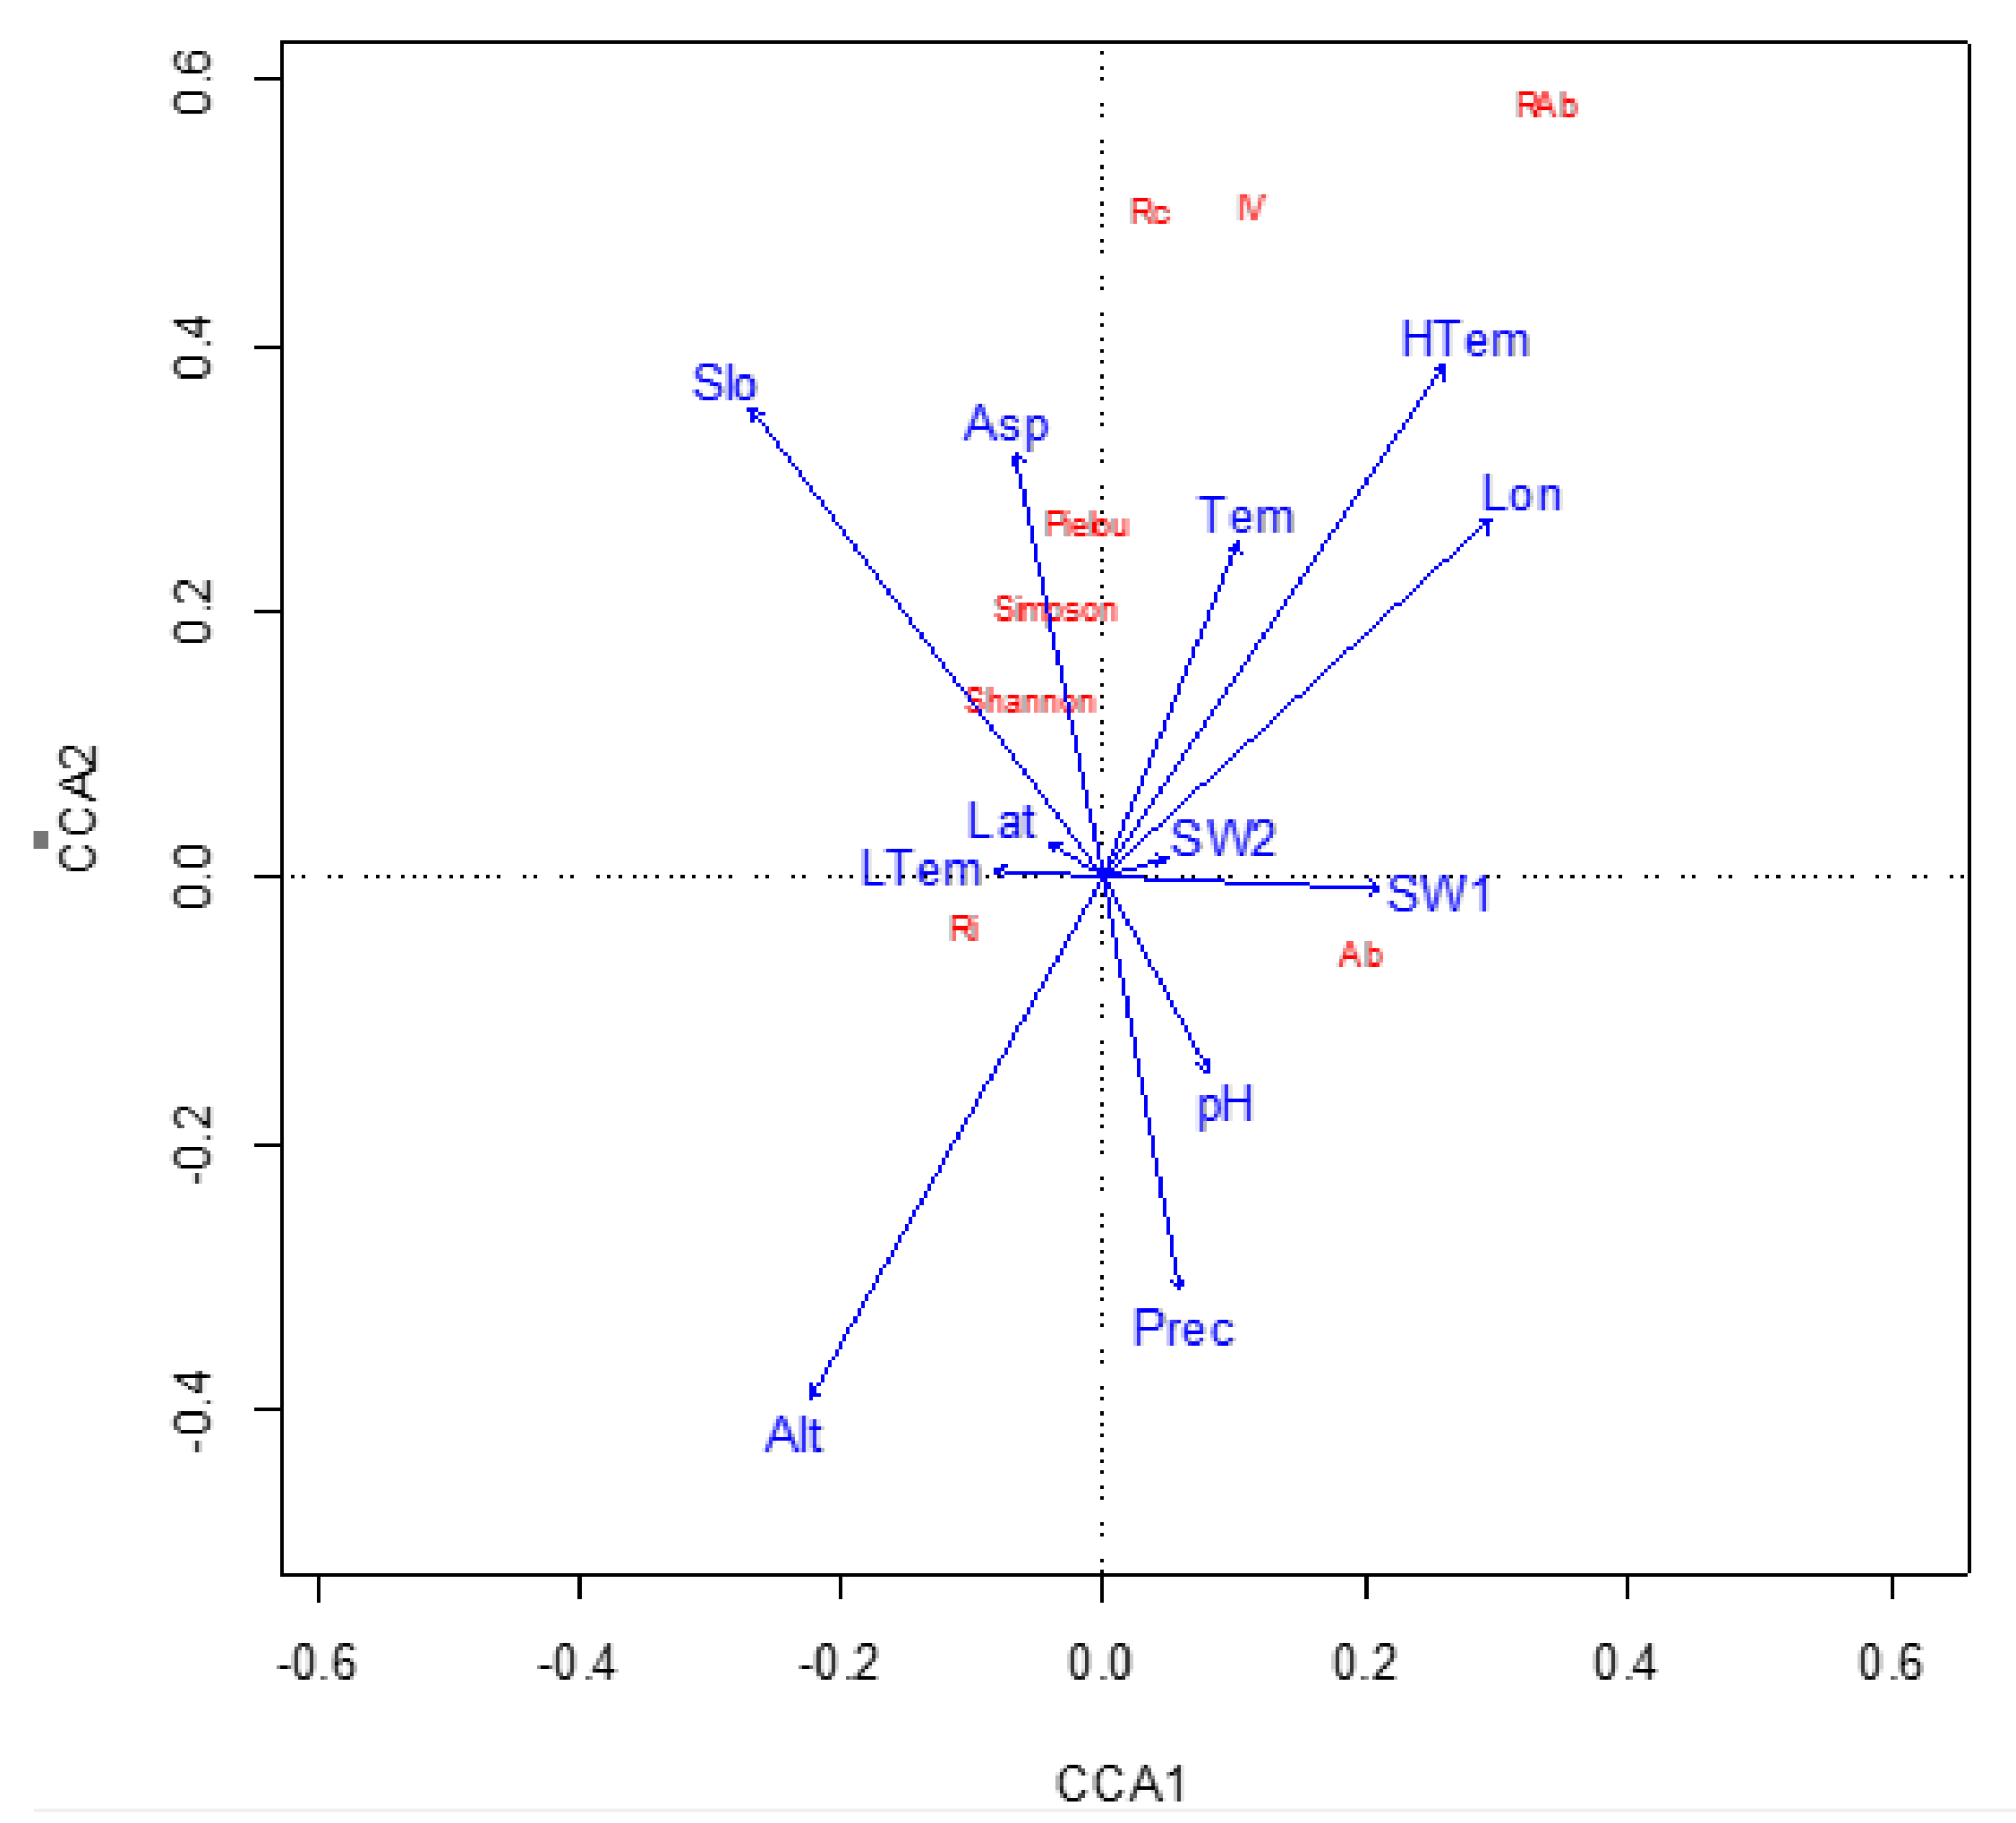
Our analysis indicated that the IV of C. paliurus populations was influenced by elevation and temperature (Figure 5). We found that the C. paliurus populations with the highest IVs tended to occur in places with lower elevations and higher temperatures. The IV of C. paliurus in these sample plots was higher than 0.3, whereas values in other plots ranged from 0.26 to 0.08. The relative abundance and relative coverage of C. paliurus had variation patterns similar to that of IV, with relative abundance the most sensitive. Conversely, C. paliurus abundance and tree species richness were relatively unaffected by the environment. The three ecological diversity indices (Shannon–Wiener, Pielou, and Simpson) were sensitive to aspect, which indicates that light conditions influenced, albeit weakly, the distribution of C. paliurus stands.
On the basis of the second CCA, the most correlated variables were selected (Figure 6). The IV of C. paliurus varied along an elevational gradient (R = −0.54, p < 0.01), while C. paliurus abundance similarly varied with longitude (R = 0.695, p < 0.01). Even though the sample plots were broadly distributed, the variation in C. paliurus IV and relative abundance still followed environmental gradients. As the elevation increased from 750 to 1900 m, the IV of C. paliurus declined from 0.4 to 0.1, at the same time, C. paliurus relative abundance increased from 0.05 to 0.4 as longitude increased from 100° E to 120° E. As shown in Figure 5, the IV, relative abundance, and relative coverage of C. paliurus exhibited identical patterns of variation. In particular, their values were positively correlated with increasing longitude, annual maximum temperature, and annual mean temperature and were negatively correlated with elevation.
4. Discussion
In this study, we investigated various communities of C. paliurus to identify the factors shaping its distribution. We found that the tree species composition of the studied C. paliurus communities varied markedly along environment gradients. Community structure is affected by many abiotic environmental factors [26]. Among the 12 environmental factors examined in this study, precipitation, longitude, and temperature gradients had the greatest effect on community structure, and longitude was the most representative indicators. Swida macrophylla, Clerodendrum japonicum, and Castanea henryi tended to be distributed in C. paliurus communities experiencing higher precipitation. These tree species were almost exclusively distributed in Hefeng and Wufeng counties of Hubei Province, where the annual precipitation is above 1700 mm. Similarly, Shen et al. [27] have reported the presence of a C. paliurus forest in Yichang City, Hubei Province. Wong et al. [28] have also described a Castanea henryi–C. paliurus forest community in a high-precipitation area of southeastern China. In our study, we found that I. ficoidea, I. centrochinensis, Cinnamomum wilsonii, Castanopsis fargesii, and Diplospora dubia were more likely to occur in C. paliurus communities with the highest annual minimum temperatures. These five species were mostly limited to the six sample plots in Muchuan County, Sichuan Province, where the annual minimum temperature is 1.38 °C. The highest IVs of Dendrobenthamia capitata, B. controversum, A. palmatum, and Carpinus viminea were recorded in the easternmost C. paliurus communities in the study area, mainly in sample plots in Wufeng County, Hubei Province, at longitudes of 29° E to 30° E. In a previous study, Wang et al. [29] identified C. paliurus, Dendrobenthamia capitata, and B. controversum scattered throughout a forest community dominated by Platycarya strobilacea in another far-eastern location, Yuexi County, Anhui Province.
Despite the pronounced environmental gradients, the IV of Cunninghamia lanceolata, Liquidambar formosana, and Dendropanax dentiger, like C. paliurus, remained relatively constant. Of these three species, the distribution of Liquidambar formosana (found in seven sample plots from four regions) was more stable than that of Cunninghamia lanceolata (five sample plots from two regions) and Dendropanax dentiger (eight sample plots from three regions). In previous work, Ren et al. [30] found Liquidambar formosana and C. paliurus in the Cenwanglaoshan Natural Reserve and reported that both of these species had high IVs despite their low relative abundances. This result implies that both species had entered the community early, with consequently larger individuals. Similarly, Dong et al. [14] discovered an ancient C. paliurus–Liquidambar formosana community in Anhui Province. Finally, Yi et al. [31] located forest communities including C. paliurus, Liquidambar formosana, and Cunninghamia lanceolata on Huangshan Mountain in Anhui Province. Liquidambar formosana may thus be inferred to be an important tree species associated with C. paliurus. As a drought-tolerant tree species distributed in subtropical regions in China, Liquidambar formosana readily adapts to poor soil and has soil improvement capabilities [32]. A previous study investigated the application of mixed Liquidambar formosana–Pinus massoniana plantations to improve soil [33]. C. paliurus communities may thus benefit from the soil improvement activities of Liquidambar formosana. In addition to this species, Cunninghamia lanceolata is always associated with C. paliurus [28,34]. Another associated species, Dendropanax dentiger, is a shade-tolerant, understory shrub widely distributed in southern China [35]. The fourth close associate of C. paliurus, A. davidii, was identified in 11 sample plots from five regions and was the most broadly ranging tree species other than C. paliurus. This tree species is endemic to central and southwestern China, where it often occurs in thin forests at an elevation of 500 to 1500 m and is strongly resistant to cold and drought [24,36]. Jin et al. [25] reported the presence of A. davidii and C. paliurus in a forest community in Zhejiang Province.
Aside from the variation in tree species in C. paliurus communities, the IV of C. paliurus increased along with increasing temperature and longitude and decreasing elevation, while the elevation was the most relevant. This variation along these environmental gradients suggests that southeastern China is more suitable as a habitat for C. paliurus because of its higher temperature and longitude and lower elevation. Dong et al. [14] and Chen et al. [15] have asserted that C. paliurus has a narrow ecological niche, with Dong et al. [14] further considering C. paliurus and Phyllostachys pubescens to have overlapping niches. The changing climate at the end of the Quaternary ice age promoted the expansion and gene flow of C. paliurus into other areas [2]; the most suitable of which, according to our research, being Jiangxi and Anhui provinces. This trajectory is similar to that of another Quaternary relic, Camellia sinensis, which originated in southwestern Yunnan Province, China, and then colonized more suitable habitats in the southeast [37,38]. Liu et al. [39] used a MaxEnt model to analyze potential C. paliurus cultivation regions; he found that most regions highly suitable for planting C. paliurus are in southeastern China. In that study, temperature was considered to be the most important environmental factor, a finding confirmed by our research. Furthermore, Jin et al. [40] found C. paliurus growing on a hillside near a ravine with high humidity and fertile soil in Zhejiang Province in southeastern China. Similarly, Sun et al. [12] found that leaves of C. paliurus in Jiangxi Province have a higher triterpenoid content than those of other provinces. As a fast-growing species, C. paliurus requires sufficient light and water supply, but its intolerance to flooding may limit its growth in flood plains. Taking this into consideration, the low hills of southeastern China may be beneficial in terms of drainage while, at the same time, providing the higher temperature and precipitation that promote C. paliurus growth and regeneration.
In this study, both the relative abundance and relative coverage of C. paliurus increased in the same way as IV, with relative abundance increasing even more. Other than tree growth, southeastern areas are thus more suitable for C. paliurus regeneration. Previous research has revealed that natural recruitment of C. paliurus is always difficult in forest communities [3,18,36]. Areas in the distribution range of C. paliurus that experience more heat and precipitation should thus promote C. paliurus regeneration and increase its relative abundance. Furthermore, the characteristic fast growth of C. paliurus when provided with sufficient light and water promotes this species’ successful competition for dominance, thereby leading to a high relative coverage value.
Finally, the values of species diversity indices of C. paliurus communities (Shannon–Wiener, Pielou, and Simpson) increased as light conditions improved due to aspect. This trend reflects the fact that C. paliurus communities contain a high number of light-intolerant tree species. According to our results, in addition, little correlation seems to exist between species richness and environment. Overall, tree species composition varied along environmental gradients; however, species richness did not appear to follow any pattern in C. paliurus communities because of the wide range of sample plots covered. Although several tree species exhibited the same distributional pattern as C. paliurus, their IVs remained lower than 0.3 (compared with more than 7 for C. paliurus). To better understand the specificity of C. paliurus communities to different environments, future research should thus focus on small-scale investigation of C. paliurus communities.
5. Conclusions
Our analysis of C. paliurus communities and population distribution characteristics based on the above two CCA models revealed that the IV of many tree species in C. paliurus communities indeed varied according to the environment. Only three tree species in these communities, namely, Cunninghamia lanceolata, Liquidambar formosana, and Dendropanax dentiger, had abundances that were relatively steady across different environments, similar to C. paliurus. At the same time, however, the distribution of C. paliurus itself changed along environmental gradients. The IV, relative abundance, and relative coverage of C. paliurus were highest in warm, low-elevation areas at high longitudes, thus suggesting that C. paliurus is best adapted to these locations. Our findings should be valuable in future investigations of C. paliurus adaptive areas and mixed forest afforestation in different distribution areas. Further research should be carried out on a smaller scale to better understand the specificity of C. paliurus communities to different environments.
Author Contributions
Methodology and experimental design, S.F. and C.S.; data curation, C.S., Y.Z. and X.S.; data analysis, C.S.; writing—original draft preparation, C.S.; writing—review and editing, S.F. and X.S.; funding acquisition, S.F. and X.S. All authors have read and agreed to the published version of the manuscript.
Funding
This work was supported by the Key Research and Development Program of Jiangsu Province (BE2019388), the National Natural Science Foundation of China (31971642, 32001305), the Priority Academic Program Development of Jiangsu Higher Education Institutions (PAPD) and the Doctorate Fellowship Foundation of Nanjing Forestry University. The funders had no role in study design, data collection and analysis, decision to publish, or preparation of the manuscript.
Institutional Review Board Statement
Not applicable.
Informed Consent Statement
Informed consent was obtained from all subjects involved in the study.
Data Availability Statement
Data sharing not applicable.
Conflicts of Interest
The authors declare no conflict of interest.
References
- Manchester, S.R.; Chen, Z.D.; Lu, A.M.; Uemura, K. Eastern Asian endemic seed plant genera and their paleogeographic history throughout the Northern Hemisphere. J. Syst. Evol. 2009, 47, 1–42. [Google Scholar] [CrossRef]
- Li, X.C.; Fu, X.X.; Shang, X.L.; Yang, W.X.; Fang, S.Z. Natural population structure and genetic differentiation for heterodicogamous plant: Cyclocarya paliurus, (Batal.) Iljinskaja (Juglandaceae). Tree. Genet. Genomes. 2017, 13, 80–89. [Google Scholar] [CrossRef]
- Fang, S.Z.; Wang, J.Y.; Wei, Z.Y.; Zhu, Z.X. Methods to break seed dormancy in Cyclocarya paliurus (Batal) Iljinskaja. Sci. Hortic-Amsterdam. 2006, 110, 305–309. [Google Scholar] [CrossRef]
- Kakar, M.U.; Naveed, M.; Saeed, M.; Zhao, S.C.; Rasheed, M.; Firdoos, S.; Manzoor, R.; Deng, Y.L.; Dai, R.J. A review on structure, extraction, and biological activities of polysaccharides isolated from Cyclocarya paliurus (Batalin) Iljinskaja. Int. J. Biol. Macromol. 2020, 156, 420–429. [Google Scholar] [CrossRef] [PubMed]
- Xie, J.H.; Dong, C.J.; Nie, S.P.; Li, F.; Wang, Z.J.; Shen, M.Y.; Xie, M.Y. Extraction, chemical composition and antioxidant activity of favonoids from Cyclocarya paliurus (Batal.) Iljinskaja leaves. Food Chem. 2015, 186, 97–105. [Google Scholar] [CrossRef] [PubMed]
- Wright, M.; Byrd, J.; Gao, Y.; Stubblefeld, J.; Park, H.; Dunlap, N. Isolation and structural clarifcation of triterpenes from Cyclocarya paliurus: Cyclocaric acid A and B. Planta. Med. 2014, 80, 139–143. [Google Scholar] [CrossRef]
- Liu, Y.; Cao, Y.N.; Fang, S.Z.; Wang, T.L.; Yin, Z.Q.; Shang, X.L.; Yang, W.X.; Fu, X.X. Antidiabetic effect of Cyclocarya paliurus leaves depends on the contents of antihyperglycemic flavonoids and antihyperlipidemic triterpenoids. Molecules 2018, 23, 1042. [Google Scholar] [CrossRef] [PubMed] [Green Version]
- Deng, B.; Cao, Y.N.; Fang, S.Z.; Shang, X.L.; Yang, W.X.; Qian, C.Y. Variation and stability of growth and leaf flavonoid content in Cyclocarya paliurus across environments. Ind. Crop Prod. 2015, 76, 386–393. [Google Scholar] [CrossRef]
- Deng, B.; Fang, S.; Shang, X.; Fu, X.; Yang, W. Influence of genotypes and environmental factors on leaf triterpenoid content and growth of Cyclocarya paliurus. J. For. Res. 2018, 4, 1–10. [Google Scholar] [CrossRef]
- Fang, S.Z.; Yang, W.X.; Chu, X.L.; Shang, X.L.; She, C.Q.; Fu, X.X. Provenance and temporal variations in selected flavonoids in leaves of Cyclocarya paliurus. Food Chem. 2011, 124, 1382–1386. [Google Scholar] [CrossRef]
- Cao, Y.N.; Fang, S.Z.; Yin, Z.Q.; Fu, X.X.; Shang, X.L.; Yang, W.X.; Yang, H.M. Chemical fingerprint and multicomponent quantitative analysis for the quality evaluation of Cyclocarya paliurus leaves by HPLC-Q-TQF-MS. Molecules 2017, 22, 1927. [Google Scholar] [CrossRef] [PubMed] [Green Version]
- Deng, B.; Fang, S.; Shang, X.; Fu, X.; Li, Y. Influence of provenance and shade on biomass production and triterpenoid accumulation in Cyclocarya paliurus. Agroforest Syst. 2017, 1, 1–10. [Google Scholar] [CrossRef]
- Liu, Y.; Qian, C.Y.; Ding, S.H.; Shang, X.L.; Yang, W.X.; Fang, S.Z. Effect of light regime and provenance on leaf characteristics, growth and flavonoid accumulation in Cyclocarya paliurus (Batal) Iljinskaja coppices. Bot. Stud. 2016, 57, 28. [Google Scholar] [CrossRef] [PubMed] [Green Version]
- Dong, D.; Xu, X.; Zhou, Z.X.; He, Y.H.; Wang, C.Z.; Shi, F.K.; Gao, L.L. Niche dynamics of main populations of old-tree communities in Jiuhua Mountain Scenic Area of Anhui Province. Chinese J. Ecol. 2019, 38, 1292–1304. [Google Scholar] [CrossRef]
- Chen, Y.F.; Yu, Z.P.; Chen, L.; Song, S.L.; Wen, R.Q.; Song, Q.N.; Yang, Q.P. Population dynamics and niche interpretation of Torreya grandis community in Guanshan National Nature Reserve of Jiangxi Province. South China For. Sci. 2019, 47, 7–11. [Google Scholar] [CrossRef]
- Xiong, X.G.; Xiong, G.; Xie, Z.Q. The Regeneration of Tree Species in the Mixed Evergreen-deciduous Broad-leaved Forests in the Shennongjia Mountains, Hubei Province. Acta Ecol. Sinica 2002, 22, 2001–2005. [Google Scholar]
- Shao, F.L.; Yu, X.X.; Zheng, J.K.; Wang, H.N. Relationships between dominant arbor species distribution and environmental factors of shelter forests in the Beijing mountain area. Acta Ecol. Sinica 2012, 32, 6092–6099. [Google Scholar] [CrossRef] [Green Version]
- Sun, C.W.; Shang, X.L.; Ding, H.F.; Cao, Y.N.; Fang, S.Z. Natural variations in flavonoids and triterpenoids of Cyclocarya paliurus leaves. J. For. Res. 2020. [Google Scholar] [CrossRef]
- Liu, J.; Yin, M.L.; Zhang, W.L.; Tsang, D.C.W.; Wei, X.D.; Zhou, Y.T.; Xiao, T.F.; Wang, J.; Dong, X.J.; Sun, Y.B.; et al. Response of microbial communities and interactions to thallium in contaminated sediments near a pyrite mining area. Environ. Pollut. 2019, 248, 916–928. [Google Scholar] [CrossRef]
- Khatiwada, J.R.; Zhao, T.; Chen, Y.H.; Wang, B.; Xie, F.; Cannatella, D.C.; Jiang, J.P. Amphibian community structure along elevation gradients in eastern Nepal Himalaya. BMC Ecol. 2019, 19. [Google Scholar] [CrossRef] [Green Version]
- Fattahi, B.; Arzani, K.; Souri, M.K.; Barzegar, M. Effects of cadmium and lead on seed germination, morphological traits, and essential oil composition of sweet basil (Ocimum basilicum L.). Ind. Cr. Prod. 2019, 138. [Google Scholar] [CrossRef]
- Oksanen, J.; Kindt, R.; Legendre, P.; O’Hara, B. Vegan: Community Ecology Package; R Foundation for Statistical Computing: Vienna, Austria, 2007. [Google Scholar]
- Sun, C.; Jia, L.; Xi, B.; Wang, L.; Weng, X. Natural variation in fatty acid composition of Sapindus spp. Seed Oils. Ind. Cr. Prod. 2017, 102, 97–104. [Google Scholar] [CrossRef]
- He, Y.L.; He, Y.; Gong, L.L.; Fang, M.F.; Li, Z.H. Population genetic structure and interspecific differentiation between Acer davidii Franchi. and A-morrisonense Hayata (Aceraceae) based on SSR markers. Biochem. Syst. Ecol. 2017, 71, 42–49. [Google Scholar] [CrossRef]
- Jin, Z.X. A study of deciduous broad-l eaved forest feature in the Tiantai Mountain of Zhejiang. Guihaia 2000, 20, 107–116. [Google Scholar] [CrossRef]
- Kneitel, J.M.; Chase, J.M. Trade-offs in community ecology: Linking spatial scales and species coexistence. Ecol Lett. 2004, 7, 69–80. [Google Scholar] [CrossRef] [Green Version]
- Shen, Z.H.; Jin, Y.X.; Zhao, Z.E.; Wu, J.Q.; Huang, H.D. The structure and dynamics of the rareplant communities in subtropical mountian of China. Acta Ecolog. Sinica 2000, 20, 800–807. [Google Scholar] [CrossRef]
- Wong, D.M.; Guo, R.; Zhang, H.W.; Cheng, Z.F.; Tian, Y.; Yu, J.J.; Wang, Y.X.; Liu, J.L. Species composition and 425 community structure of deciduous broad-leaved forests in National Nature Reserves of Zhejiang Province. J. Zhejiang Univ. 2014, 41, 600–610. [Google Scholar]
- Wang, Z.G.; Zhang, Z.X.; Wang, W.G.; Chu, J. Preliminary analysis of forest community structure of Yaoluoping National Nature Reserve in Yuexi County, Anhui Province, China. Chinese J. Plant Ecol. 2016, 40, 615–619. [Google Scholar] [CrossRef] [Green Version]
- Ren, L.; Luo, Y.H.; Wang, L.; Meng, Y.Y.; Liang, J.J.; Luo, L.J. Community Structure of Forest at Different Elevations in Cenwanglaoshan Natural Reserve. Guangxi For. Sci. 2018, 47, 139–144. [Google Scholar] [CrossRef]
- Yi, X.G.; Ding, H.; Fang, Y.M.; Ye, Y.Q.; Chen, S.F.; Wang, X.; Cong, R.; Zhang, K.W.; Li, Y.; Wang, X.R. Species diversity of forest communities at different altitudes based on fixed plot in Huangshan Mountains. J. Nanjing For. Univ. 2018, 42, 149–155. [Google Scholar] [CrossRef]
- Zhang, L.; Wang, S.F.; Chen, Y.T.; Duan, H.P. Response of Architecture and Functions of Roots in Three Kinds of Sweet Gums Under Drought Stress. Soils 2013, 45, 1119–1126. [Google Scholar] [CrossRef]
- Qin, J.; Tang, X.H.; Yang, X.M. Effects of soil physical and chemical properties on different forest types of Pinus massoniana. Ecol. Environ. Sci. 2013, 22, 598–604. [Google Scholar]
- Fan, Y.; Lou, Y.K.; Ku, W.P.; Dai, Q.L.; Wang, Z.Y.; Zhao, M.S.; Yu, S.Q. Age structure and spatial point pattern of Phoebe sheareri population in Mount Tianmu. J. Zhejiang A F Univ. 2020, 37, 1027–1035. [Google Scholar] [CrossRef]
- Wu, X.Y.; Zhou, Z.H.; Wu, Y.Q.; Yao, F.P.; Ni, R.X.; Wang, P.; Yao, J. Structure Characteristics and Species Association of Dendropanax dentiger in Communities. J Zhejiang For. Sci. Technol. 2020, 40, 24–29. [Google Scholar] [CrossRef]
- Jia, Y.; Yang, J.; He, Y.L.; He, Y.; Niu, C.; Gong, L.L.; Li, Z.H. Characterization of the whole chloroplast genome sequence of Acer davidii Franch (Aceraceae). Conserv. Genet. Resour. 2016, 8, 141–143. [Google Scholar] [CrossRef]
- Zhang, L.; Pan, J.R.; Zhu, C. Determination of the geographical origin of Chinese teas based on stable carbon and nitrogen isotope ratios. J Zhejiang Univ. 2012, 13, 824–830. [Google Scholar] [CrossRef] [Green Version]
- Zhou, Q.Q.; Li, H.; Hoang, T.X.; Ruan, X.; Zhang, Y.; Arkorful, E.; Chen, X.; Sun, K.; Li, X.H. Genetic Diversity And Relationship Of Dongting Biluochun Tea Germplasm In Suzhou Revealed By Ssr Markers. Pak J Bot. 2019, 51, 895–902. [Google Scholar] [CrossRef] [Green Version]
- Liu, Q.; Li, Y.; Fang, S.Z. MaxEnt model-based identification of potential Cyclocarya paliurus cultivation regions. J. Nanjing For. Univ. 2017, 41, 25–29. [Google Scholar] [CrossRef]
- Jin, Z.X. Species Diversity of Yukeng Forest Communities in Xianju of Zhejiang. J. Wuhan Bot. Res. 2001, 19, 225–232. [Google Scholar] [CrossRef]
Figure 1.
Sampling plots of C. paliurus communities. h1–h5: Hefeng county of Hubei province, j1–j7: Yongfu county of Guangxi Zhuang Autonomous Region, m1–m6: Muchuan county of Sichuan Province, n1–n2: Wuning county of Jiangxi Province, s1–s4: Shucheng county of Anhui Province, t1–t4: Tonggu county of Jiangxi Province, w1–w4: Wufeng county of Hubei province.

Figure 2.
CCA ordination diagram of C. paliurus communites sample plots and environmental. con1~31: sample plots 1 to 31, Lat: latitude, Lon: longitude, Slo: slope, Asp: aspect, Prec: precipita Table 1. 0–20 cm soil bulk density, SW2: 20–40 cm soil bulk density.
Figure 2.
CCA ordination diagram of C. paliurus communites sample plots and environmental. con1~31: sample plots 1 to 31, Lat: latitude, Lon: longitude, Slo: slope, Asp: aspect, Prec: precipita Table 1. 0–20 cm soil bulk density, SW2: 20–40 cm soil bulk density.

Figure 3.
CCA ordination diagram of tree species in C. paliurus communites and environmental factors. Abbreviations: A1: C. paliurus, A2: Cunninghamia lanceolata, A3: Liquidambar formosana Hance, A4: Ilex ficoidea Hemsl. A5: Cinnamomum wilsonii Gamble, A6: Litsea elongate, A7: Taxus chinensis, A8: Ilex centrochinensis, A9: Cryptomeria fortune, A10: Acer davidii Franch. A11: Dendrobenthamia capitata, A12: Lithocarpus glaber, A13: Castanopsis fargesii Franch. A14: Bothrocaryum controversum, A15: Swida macrophylla, A16: Lithocarpus harlandii, A17: Lindera communis Hemsl. A18: Platycarya strobilacea. A19: Clerodendrum japonicum. A20: Diplospora dubia, A21: Castanea henryi, A22: Acer palmatum Thunb. A23: Acer elegantulum, A24: Camellia cuspidate, A25: Pinus massoniana Lamb. A26: Dendropanax dentiger, A27: Tapiscia sinensis, A28: Eurya japonica Thunb. A29: Carpinus viminea, A30: Picrasma quassioides Picrasma quassioides, Lat: latitude, Lon: longitude, Slo: slope, Asp: aspect, Prec: precipitation, Tem: annual temperature, LTem: lowest temperature, HTem: highest temperature, Prec: precipitation, pH: pH, SW1: 0–20 cm soil bulk density, SW2: 20–40 cm soil bulk density.

Figure 4.
CCA ordination diagram of C. paliurus sample plots and environmental factors. Abbreviations: con1~31: sample plots 1 to 31, Lat: latitude, Lon: longitude, Slo: slope, Asp: aspect, Prec: precipitation, Tem: annual temperature, LTem: lowest temperature, HTem: highest temperature, Prec: precipitation, pH: pH, SW1: 0–20 cm soil bulk density, SW2: 20–40 cm soil bulk density.

Figure 5.
CCA ordination diagram of C. paliurus population related index and environmental factors. Abbreviations: Ri: Tree species richness, Shanon: Shannon index, Pielou: Pielou index, Simpson: Simpson index, RAb: C. paliurus relative abundance, Rc: C. paliurus relative coverage, Rf: C. paliurus relative frequency, IV: C. paliurus important value, Lat: latitude, Lon: longitude, Slo: slope, Asp: aspect, Prec: precipitation, Tem: annual temperature, LTem: lowest temperature, HTem: highest temperature, Prec: precipitation, pH: pH, SW1: 0–20 cm soil bulk density, SW2: 20–40 cm soil bulk density.

Figure 6.
Environment characteristics of C. paliurus important value and relative abundance. (a), C. paliurus important value response to altitude. R = −0.54. (b), C. paliurus relative abundace response to longitude. R = 0.695.
Figure 6.
Environment characteristics of C. paliurus important value and relative abundance. (a), C. paliurus important value response to altitude. R = −0.54. (b), C. paliurus relative abundace response to longitude. R = 0.695.


Table 1.
Environmental factors of C. paliurus communinties sample plots.
| Sample Plots | Lat | Lon | Slo | Asp | Alt | Tem | LTem | HTem | Prec | pH | SW1 | SW2 |
|---|---|---|---|---|---|---|---|---|---|---|---|---|
| (°N) | (°E) | (°) | (mm) | (°C) | (°C) | (°C) | (mm) | (g/cm3) | (g/cm3) | |||
| h1 h2 h3 h4 h5 | 109.13–109.98 | 30.1–30.02 | 12–48 | 1–5 | 1106–1283 | 12.99 | –5.28 | 28.5 | 2100 | 4.54–5.7 | 1.04–1.62 | 0.97–1.48 |
| j1 j2 j4 j5 j6 j7 | 104.95–104.96 | 24.61–24.63 | 10–40 | 2–5 | 1539–1829 | 18.91 | 3.54 | 33 | 1326 | 3.83–4.49 | 0.55–0.85 | 0.54–0.9 |
| m1 m2 m3 m4 m5 m6 | 103.79 | 28.97 | 19–32 | 1–8 | 1192–1230 | 15.85 | 1.38 | 29.71 | 1589 | 3.18–3.39 | 0.57–0.73 | 0.68–0.89 |
| n1 n2 | 115.26–115.32 | 29.01–29.09 | 22 | 8 | 771–780 | 16.75 | –1.83 | 33.1 | 1862 | 4.59–4.64 | 0.92–0.97 | 0.96–1 |
| s1 s2 s3 s4 | 116.54 | 31.04 | 24–45 | 3–7 | 764–831 | 14.45 | –8.12 | 31.32 | 1603 | 4.88–5.28 | 0.99–1.11 | 1.07–1.18 |
| t1 t2 t3 t4 | 114.21–114.22 | 28.52–28.53 | 38–50 | 5–7 | 790–860 | 16.82 | –1.85 | 32.7 | 1487 | 4.55–4.69 | 0.76–0.83 | 0.85–0.97 |
| w1 w2 w3 w4 | 110.43–110.46 | 29.86–29.97 | 18–38 | 2–6 | 1340–1536 | 13.12 | –5.49 | 28.65 | 1704 | 5.29–5.92 | 0.85–1.04 | 1.06–1.19 |
Lat: latitude, Lon: longitude, Slo: slope, Asp: aspect, Prec: precipitation, Tem: annual temperature, LTem: lowest temperature, HTem: highest temperature, Prec: precipitation, pH: pH, SW1: 0–20 cm soil bulk density, SW2: 20–40 cm soil bulk density. h1–h5: Hefeng county of Hubei province, j1–j7: Yongfu county of Guangxi Zhuang Autonomous Region, m1–m6: Muchuan county of Sichuan Province, n1–n2: Wuning county of Jiangxi Province, s1–s4: Shucheng county of Anhui Province, t1–t4: Tonggu county of Jiangxi Province, w1–w4: Wufeng county of Hubei province.
Table 2.
Important values of the top 30 trees in the community of C. paliurus.
| Tree Species | IV | Sample Plots | No of Sample Plots | Crossing Regions |
|---|---|---|---|---|
| Cyclocarya paliurus (Batal.) Iljinsk. | 7.42 | all | 31 | 7 |
| Cunninghamia lanceolata (Lamb.) Hook. | 0.45 | h3, h5, t1, t2, t3 | 5 | 2 |
| Liquidambar formosana Hance | 0.42 | j1, j5, j6, s3, n1, h3, h4 | 7 | 4 |
| Ilex ficoidea Hemsl. | 0.42 | m3, m4, m5, m6, t3 | 5 | 2 |
| Cinnamomum wilsonii Gamble | 0.4 | h3, h5, j5, m1, m2, m3, m4, m5, m6 | 9 | 3 |
| Litsea elongata (Wall. ex Nees) Benth. et Hook. f. | 0.38 | h3, h4, n1, n2, t1, t4 | 6 | 3 |
| Taxus chinensis (Pilger) Rehd. | 0.36 | t1, t2, t3, t4 | 4 | 1 |
| Ilex centrochinensis S. Y. Hu | 0.33 | m1, m2, m3, m4, m5, m6 | 6 | 1 |
| Cryptomeria fortunei Hooibrenk ex Otto et Dietr. | 0.32 | h1, h5 | 2 | 1 |
| Acer davidii Franch. | 0.32 | h1, h4, h5, j1, j5, j7, m1, m3, m5, n2, s2 | 11 | 5 |
| Dendrobenthamia capitata (Wall.) Hutch. | 0.31 | w1, w2, w3, w4 | 4 | 1 |
| Lithocarpus glaber (Thunb.) Nakai | 0.3 | j1, j2, j4, j5 | 4 | 1 |
| Castanopsis fargesii Franch. | 0.3 | m2, m3, m4, m6, j5, j7 | 6 | 2 |
| Bothrocaryum controversum (Hemsl.) Pojark | 0.28 | w1 w2 w3 h1, h2, n1 | 6 | 3 |
| Swida macrophylla (Wall.) Sojak | 0.28 | w2 w4 h2, h4, | 4 | 2 |
| Lithocarpus harlandii (Seem.) Rehd. et Wils. | 0.27 | h1, h2, h3, h4, h5, m3, m4, m5, m6 | 9 | 2 |
| Lindera communis Hemsl. | 0.27 | h1, j2, s3, s4 | 4 | 3 |
| Platycarya strobilacea Sieb. Et Zucc. | 0.26 | n2, t1, h3, h4, h5 | 5 | 3 |
| Clerodendrum japonicum (Thunb.) Sweet | 0.24 | j2, j4, h2 | 3 | 2 |
| Diplospora dubia (Lindl.) Masam. | 0.23 | j4, m1, m2, m4, m5, w3, | 6 | 3 |
| Castanea henryi (Skan) Rehd. et Wils. | 0.23 | h2, h5, | 2 | 1 |
| Acer palmatum Thunb. | 0.23 | w1 w2 w3 w4 t1, t2, | 6 | 2 |
| Acer elegantulum Fang et P. L. Chiu | 0.23 | h1, h3, j1, j2, j7, m4, m5, m6, w3 | 9 | 4 |
| Camellia cuspidata (Kochs) Wright ex Gard. | 0.23 | j1, j2, j4, m5 | 4 | 2 |
| Pinus massoniana Lamb. | 0.22 | h5, n2, s4 | 3 | 3 |
| Dendropanax dentiger (Harms) Merr. | 0.21 | h3, h4, m3, m5, m6, t1, t3, t4 | 8 | 3 |
| Tapiscia sinensis Oliv. | 0.2 | s1, s2, s3 | 3 | 1 |
| Eurya japonica Thunb. | 0.19 | h3, h5, m2, m4, m5, m6, n1, n2 | 8 | 3 |
| Carpinus viminea Lindley | 0.19 | n2, s1, w1, w3, w4 | 5 | 3 |
| Picrasma quassioides (D. Don) Benn. | 0.18 | s4, t2, t4, w1, w3 | 5 | 3 |
| Sum of the top 30 trees | 15.51 | |||
| Sum of all 190 tree species | 22.96 |
h1–h5: Hefeng county of Hubei province, j1–j7: Yongfu county of Guangxi Zhuang Autonomous Region, m1–m6: Muchuan county of Sichuan Province, n1–n2: Wuning county of Jiangxi Province, s1–s4: Shucheng county of Anhui Province, t1–t4: Tonggu county of Jiangxi Province, w1–w4: Wufeng county of Hubei province. IV: importance value.
Table 3.
Canonical correspondence analysis (CCA) results for tree species of C. paliurus communities with environmental factors.
Table 3.
Canonical correspondence analysis (CCA) results for tree species of C. paliurus communities with environmental factors.
| CCA1 | CCA2 | CCA3 | CCA4 | Total | |
|---|---|---|---|---|---|
| Eigenvalue | 0.500 | 0.407 | 0.381 | 0.303 | |
| Proportion Explained | 0.117 | 0.095 | 0.089 | 0.071 | |
| Cumulative Proportion | 0.117 | 0.212 | 0.300 | 0.371 | 0.612 |
| Longitude | −0.158 | −0.601 | −0.090 | 0.499 | |
| Latitude | −0.293 | −0.184 | 0.353 | 0.403 | |
| Slope | −0.393 | −0.283 | −0.217 | 0.147 | |
| Aspect | 0.247 | −0.071 | −0.023 | 0.301 | |
| Altitude | 0.000 | 0.010 | −0.105 | −0.717 | |
| Annual mean temperature | 0.503 | 0.153 | −0.401 | −0.147 | |
| Annual lowest temperature | 0.397 | 0.464 | −0.137 | −0.318 | |
| Annual highest temperature | 0.419 | −0.175 | −0.496 | 0.119 | |
| Precipitaion | −0.626 | 0.021 | 0.087 | 0.328 | |
| pH | −0.506 | −0.771 | −0.060 | 0.197 | |
| 0–20 cm soil bulk density | −0.849 | −0.228 | −0.048 | 0.285 | |
| 20–40 cm soil bulk density | −0.740 | −0.287 | 0.127 | 0.400 | |
| Model Pr(>F) | 0.001 *** | ||||
***: significant in 0.001 level.
Table 4.
Sample plots ecology diversity index related to C. paliurus population.
| Sample | Ri | Shanon | Pielou | Simpson | RAb | Rc | Rf | IV |
|---|---|---|---|---|---|---|---|---|
| h1 h2 h3 h4 h5 | 11–32 | 2.04–2.90 | 0.77–0.87 | 0.82–0.90 | 0.09–0.28 | 0.32–0.44 | 0.06 | 0.17–0.24 |
| j1 j2 j4 j5 j6 j7 | 7–23 | 1.76–2.56 | 0.76–0.91 | 0.78–0.90 | 0.06–0.32 | 0.17–0.62 | 0.06 | 0.11–0.31 |
| m1 m2 m3 m4 m5 m6 | 10–23 | 1.82–2.81 | 0.74–0.90 | 0.77–0.93 | 0.06–0.12 | 0.09–0.74 | 0.06 | 0.08–0.31 |
| n1 n2 | 17–18 | 2.34–2.38 | 0.82–0.83 | 0.84–0.87 | 0.23–0.24 | 0.25–0.47 | 0.06 | 0.18–0.26 |
| s1 s2 s3 s4 | 6–14 | 1.36–2.09 | 0.73–0.79 | 0.66–0.79 | 0.29–0.4 | 0.54–0.69 | 0.06 | 0.30–0.36 |
| t1 t2 t3 t4 | 7–16 | 1.69–1.96 | 0.71–0.89 | 0.48–0.80 | 0.24–0.39 | 0.43–0.80 | 0.06 | 0.26–0.37 |
| w1 w2 w3 w4 | 21–36 | 2.392–3.148 | 0.79–0.88 | 0.84–0.93 | 0.07–0.23 | 0.19–0.49 | 0.06 | 0.11–0.26 |
Ri: Tree species richness, Shanon: Shannon index, Pielou: Pielou index, Simpson: Simpson index, RAb: C. paliurus relative abundance, Rc: C. paliurus relative coverage, Rf: C. paliurus relative frequency, IV: C. paliurus important value.
Table 5.
CCA results for ecological index of C. paliurus population with environmental factors.
| CCA1 | CCA2 | CCA3 | CCA4 | Total | |
|---|---|---|---|---|---|
| Eigenvalue | 0.019 | 0.014 | 0.001 | 0.000 | |
| Proportion Explained | 0.356 | 0.269 | 0.020 | 0.007 | |
| Cumulative Proportion | 0.356 | 0.625 | 0.645 | 0.652 | 0.652 |
| C. paliurus relative Abundance | 0.340 | 0.585 | 0.019 | −0.204 | |
| C. paliurus relative coverage | 0.035 | 0.504 | 0.158 | 0.065 | |
| C. paliurus important value | 0.114 | 0.507 | 0.104 | −0.012 | |
| C. paliurus Abundance | 0.198 | −0.057 | 0.000 | 0.004 | |
| Tree species richness | −0.104 | −0.038 | 0.009 | −0.004 | |
| Shannon index | −0.054 | 0.137 | −0.057 | 0.008 | |
| Pielou index | −0.009 | 0.269 | −0.079 | 0.013 | |
| Simpson index | −0.036 | 0.202 | −0.071 | 0.022 | |
| Model | 0.001 *** | ||||
***: significant in 0.001 level.
Publisher’s Note: MDPI stays neutral with regard to jurisdictional claims in published maps and institutional affiliations. |
© 2021 by the authors. Licensee MDPI, Basel, Switzerland. This article is an open access article distributed under the terms and conditions of the Creative Commons Attribution (CC BY) license (http://creativecommons.org/licenses/by/4.0/).
Share and Cite
MDPI and ACS Style
Sun, C.; Zhou, Y.; Fang, S.; Shang, X. Ecological Gradient Analysis and Environmental Interpretation of Cyclocarya paliurus Communities. Forests 2021, 12, 146. https://doi.org/10.3390/f12020146
AMA Style
Sun C, Zhou Y, Fang S, Shang X. Ecological Gradient Analysis and Environmental Interpretation of Cyclocarya paliurus Communities. Forests. 2021; 12(2):146. https://doi.org/10.3390/f12020146
Chicago/Turabian StyleSun, Caowen, Yongsheng Zhou, Shengzuo Fang, and Xulan Shang. 2021. "Ecological Gradient Analysis and Environmental Interpretation of Cyclocarya paliurus Communities" Forests 12, no. 2: 146. https://doi.org/10.3390/f12020146
Note that from the first issue of 2016, this journal uses article numbers instead of page numbers. See further details here.