
Changes in Potentially Suitable Areas for Fruit Utilization of Acer truncatum in China under Climate Change


1
Beijing Jiulong Mountain Warm Temperate Forest National Long-Term Research Base, Experimental Centre of Forestry in North China, Chinese Academy of Forestry, Beijing 102300, China
2
Institute of Agricultural Resources and Environment, Ningxia Academy of Agriculture and Forestry Sciences, Yinchuan 750002, China
*
Author to whom correspondence should be addressed.
Forests 2024, 15(4), 713; https://doi.org/10.3390/f15040713
Submission received: 18 March 2024
/
Revised: 12 April 2024
/
Accepted: 15 April 2024
/
Published: 18 April 2024
(This article belongs to the Special Issue Impacts of Extreme Climate Events on Forests)
Abstract
:Acer truncatum is a unique multipurpose woody oil species in China. It is crucial to study the geographical distribution patterns of fruit utilization of A. truncatum under climate change scenarios to ensure the rational site selection and germplasm resource protection of this tree. In this study, the Maxent model and Geographic Information System (GIS) spatial analysis technology were used to construct a suitable area model for the plant under current climate conditions by selecting 138 sample points and 15 ecological factors, and to predict the potentially suitable areas under four climate scenarios in 2050 and 2070. The results showed that under current conditions, the main suitable areas were concentrated in China, such as Inner Mongolia, Shaanxi and Hebei, with an area of 1.64 × 10⁶ km2. Under future conditions, the suitable area in 2050 and 2070 showed an expanding trend compared with that in the current period, and the expansion ratios were as high as 36.52% and 45.80% under the RCP2.6-2050 and RCP8.5-2070 scenarios, respectively. The expansion area is concentrated in the middle latitudes of China (38° N~52° N), basically covering the middle and northeast of Inner Mongolia and the middle and north of Heilongjiang, while the loss area is mainly located in northern Sichuan, northern Hubei and eastern Henan. The center of the suitable area is expected to migrate to the northeast in 2050 and 2070, with a maximum migration distance of 355.46 km. Under future conditions, the suitable area shrinks in low-latitude regions and expands in high-latitude regions, and the expanded area becomes larger than the contracted area. This conclusion provides important guidelines for the directional cultivation of A. truncatum for utilization of its fruit.
1. Introduction
The habitat zone, also called the habitat or distribution zone, is determined by the growth habits of a species. Many conditions, such as climate, biology and geology, affect the distribution of suitable habitat areas for a species. As a key factor that changes global biodiversity, climate has a profound impact on the structure and function of ecosystems, the composition of communities and the distribution of suitable areas for species [1,2,3]. Studies have shown that climate factors are more critical than geographic and soil factors in determining the potential distribution of species [4] and are the dominant factors affecting their distribution and reproduction [5]. In the coming decades, the greatest threat to global biodiversity will no longer be habitat destruction but rather global warming [6]. At present, climate warming is affecting the distribution pattern of species worldwide and has changed global biodiversity [7,8]. Therefore, it is very important to accurately predict the distribution pattern of suitable areas for species under current and future conditions to formulate policies and select plans for the introduction and cultivation of species in response to future climate warming.
A species distribution model can save manpower and material resources to a great extent through the use of specific algorithms, especially when many samples are available for investigation and analysis. With the development of species distribution models, GIS spatial analysis technology has been widely used in the study of simulated species geographical distributions in recent years [9,10]. The simulation accuracy of a species distribution model is also affected by the sample size of the target species. Some researchers have used six different sample sizes to predict the potential distribution of the same species via the Maxent model, Genetic Algorithm for Ruleset Production (GARP) model, Domain model and Bioclim model. The results showed that when the sample size was 5, 10 or 25, the prediction accuracy of the Maxent model was the highest and most reliable among the four modeling methods, followed by the GARP and Domain models, and then the Bioclim model, which had the lowest accuracy [11]. The simulation results of the Maxent model were closest to the real spatial distribution pattern of species. In 2010, Elith et al. [12] studied the potential geographical distribution of 226 plants and animals distributed in six different regions of the world, and the results showed that the Maxent model had the highest reliability and applicability. At present, the Maxent model has been widely used in predicting the introduction and settlement area of fine species and the potential distribution area of invasive species, pests and diseases. Han Yangyang et al. [13] used the Maxent model to study the suitable range of the grape Xylella fastidiosa in China, and Zhang Weihao [14] used the Maxent model and ArcGIS to predict the potentially suitable areas for Acacia melanoxylon in China. Dai Minjun [15] used the Maxent model to predict potentially suitable areas for Cryptomeria japonica var. sinensis and the effects of climate change on its distribution.
Acer truncatum is a deciduous tree belonging to the genus Acer in the Aceraceae family. It received this name because its pterocarpus is shaped like an ancient Chinese “gold ingot”. It is an important tree species with multiple uses, such as for edible, medicinal, material, ecological and ornamental functions. It is a tree with very high economic value worldwide [16,17,18,19,20]. In recent years, the application of species distribution models in the planting regionalization of cash crops has achieved rich research results [21,22,23], but there are still few studies on the potential distribution of the utilization of A. truncatum fruit in China and its suitable planting regionalization under future conditions. Using the Maxent model, Wu et al. [24] studied the potential changes in the distribution of A. truncatum in East Asia under different scenarios, providing a theoretical basis for the protection and utilization of A. truncatum. However, the model ignores the impact of topographic factors on species distributions, which results in uncertainty in Chinese efforts to develop the industry of A. truncatum. In addition, the introduction and cultivation of cash crops often results in a decline in yield or quality due to adaptability [25]. Therefore, it is important to understand their suitable areas for the cultivation of cash crops.
At present, artificial cultivation of Acer truncatum is extremely extensive. It is also distributed in Guizhou Province in the south and the southern mountains of the Greater Hinggan Mountains in the north, and in the Tibetan Plateau. The area of artificial afforestation has exceeded 31,300 hectares [26]. However, there are many problems such as non-flowering, non-fruiting, low fruiting amount, serious diseases and pests, and low yield of maple oil. Therefore, this study uses the spatial distribution data of the utilization of A. truncatum fruit in China and environmental factors with a spatial resolution of 30″ through the Maxent model and GIS to understand the suitable zoning of the plant in China under current and future climate conditions to reveal the changes in potential geographical distribution patterns and the suitable areas in 2050 and 2070 under the future scenarios of low, medium, high and extremely high CO2 emissions. A theoretical basis and scientific and technological support for the reasonable location of artificial cultivation, the investigation and protection of germplasm resources, and the selection and breeding of excellent varieties of A. truncatum for fruit utilization are provided.
2. Materials and Methods
2.1. Sample Point Data Collection and Processing
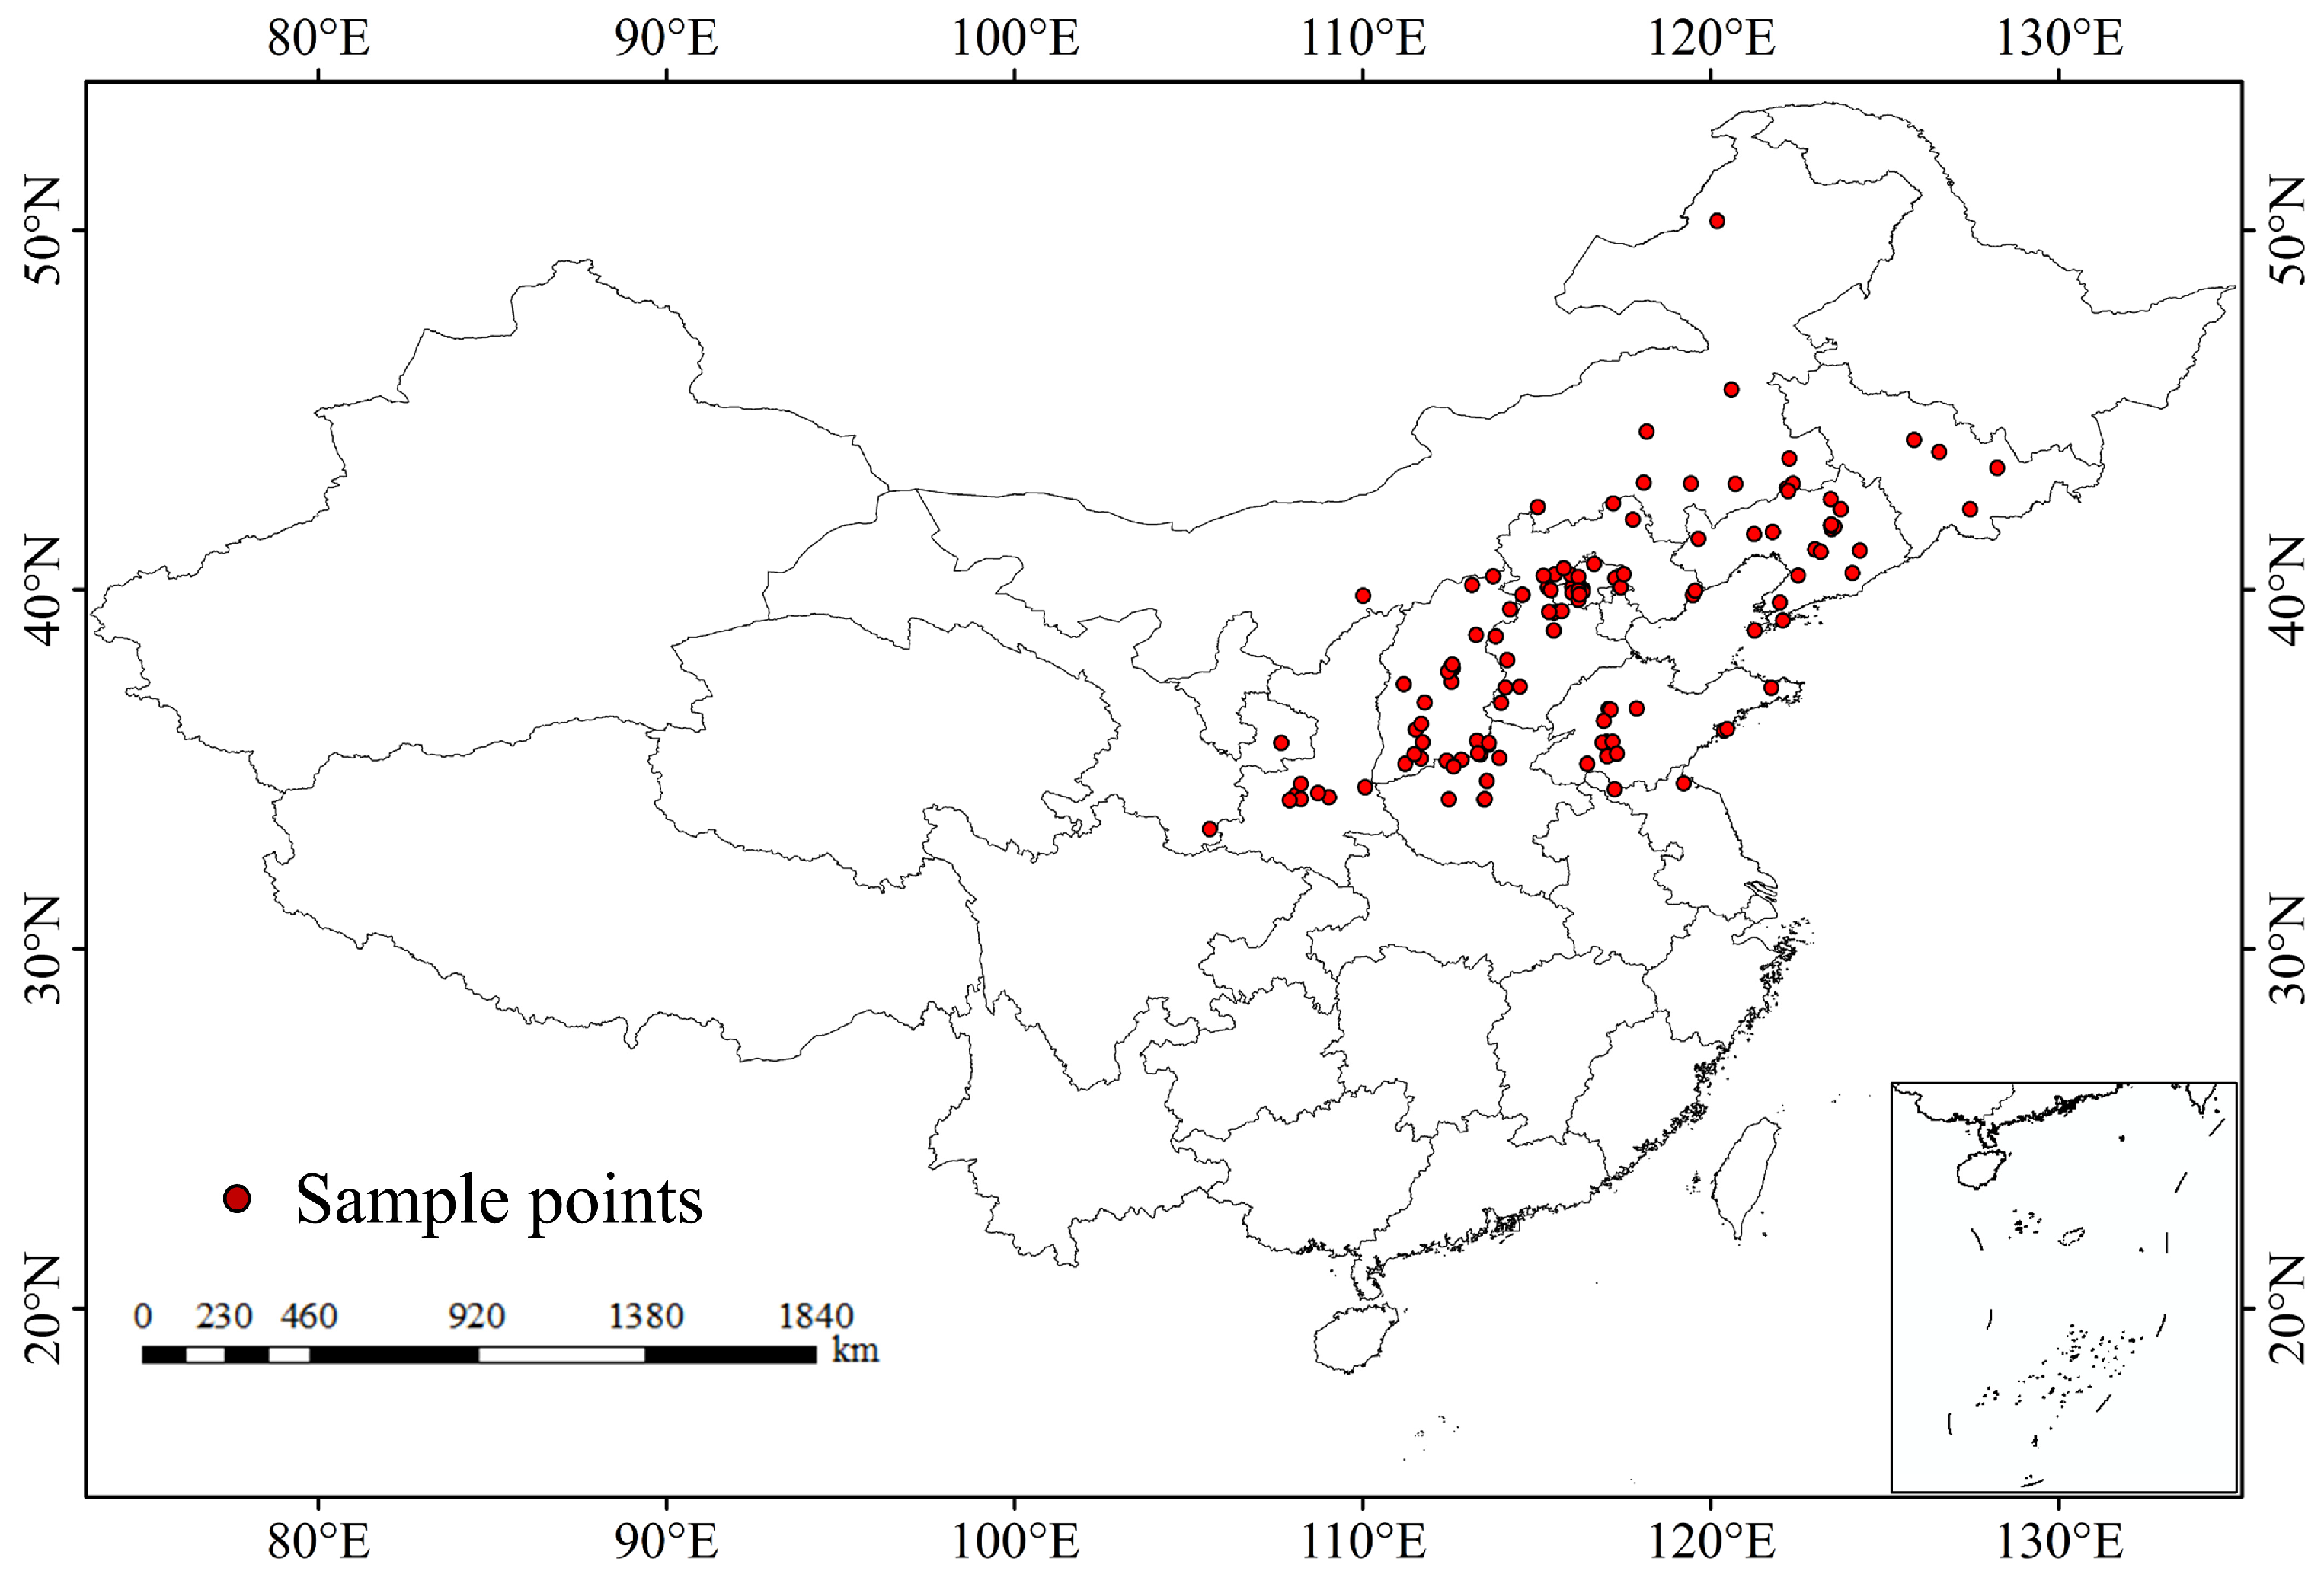
The sample points of A. truncatum fruit utilization were obtained from data collected from the (1) Global Biodiversity Information Network Platform (GBIF, https://www.gbif.org/); (2) China Digital Herbarium (CVH, https://www.cvh.ac.cn/); (3) National Specimen Resources Platform of China (NSII, NSII; http://nsii.org.cn/); (4) the literature, including on the flora of China, flora of Desert of China, vegetation of Hebei, flora of Liaoning and trees of North China; and (5) a field investigation (direct observation combined with Global Position System (GPS) technology) of A. truncatum fruit utilization, including in Hebei, Beijing, Liaoning, Inner Mongolia and Ningxia from 2019 to 2022, that covered various topographies, such as mountains, low hills, hills and basins. Data with identification errors, no accurate coordinates and duplicate records were eliminated. In order to reduce the spatial autocorrelation of sample point data [26] and avoid overfitting, the prescreened distributed data were analyzed with a diameter of 1 km as the buffer, and only one piece of distributed data was retained in each buffer on the premise of ensuring uniform data distribution [27,28]. Finally, 138 sample points were obtained and used to construct the model through processing (Figure 1).
2.2. Source and Processing of Ecological Factor Data
The ecological factors included 19 bioclimatic factors, 3 topographic factors and 9 soil factors. Bioclimatic factor data and elevation factor data are derived from the World Climate Database (WorldClim, http://www.worldclim.org/) [29], in which the modern bioclimatic data are the 1970–2000 average values. Future bioclimatic data include 2050 (average for 2041–2060) and 2070 (average for 2061–2080) with a spatial resolution of 30” (1 km × 1 km). The CCSM4 model developed by the Center for Atmospheric Research (NCAR) of the United States was selected for future bioclimatic data [30], which included four emission scenarios (Representative Concentration Pathway (RCP)2.6, RCP4.5, RCP6.0 and RCP8.5) from the fifth IPCC emission report [31,32]. The slope and aspect factor data were extracted from the digital elevation model (DEM) data of the Resources and Environmental Sciences and Data Center, Chinese Academy of Sciences (http://www.resdc.cn/). The soil factor data are from the Food and Agriculture Organization (FAO) of the United Nations World Soil Database (HWSD, https://www.fao.org/soils-portal/, accessed on 15 May 2023). All the ecological factor data were in ASCII format using the unified CGS_WGS_1984 geographical coordinate system.
Due to the possible correlation between ecological factors, multicollinearity was likely to occur, which may distort the simulation results. Therefore, in this study, SPSS v22.0 software was used to conduct correlation analysis and significance tests for 19 modern bioclimatic factors, 3 topographic factors and 9 soil factors. When there was a significant correlation at the p < 0.01 level and the correlation coefficient was ∣r∣ ≥ 0.8, only one factor was reserved for building the model in combination with the biological characteristics of A. truncatum fruit utilization [9]. Finally, 15 ecological factors were selected (Table 1).
2.3. Species Distribution Model
In the Java environment, the 138 selected sample points and 15 ecological factors were imported into Maxent 3.4.1. Bootstrap was used to repeat the operation 10 times, with the maximum number of iterations set to 2000 and default values used for the other parameters. The accuracy of the model was verified by the area under the curve (AUC) of the receiver operating characteristic (ROC) curve [33]. The AUC is not affected by the incidence of distribution points or the decision threshold, and its value ranges from 0 to 1. The larger the AUC is, the better the prediction effect of the model. When the AUC value is less than 0.6, the model prediction fails; when the value is between 0.6 and 0.8, the model prediction accuracy is average; when it is between 0.8 and 0.9, prediction accuracy is good; and when it is greater than 0.9, prediction accuracy is high [34]. Overall, 80% of the sample point data were used for model construction (training data), and 20% were used for model verification (test data). The method of the repeated operation model was adopted in this study until the AUC values of both the training data and test data were greater than 0.9.
2.4. Classification of Suitable Areas
According to the distribution probability of fruit utilization A. truncatum, the suitable areas for the tree were divided into four suitability levels according to the natural disinterval grading method: highly suitable areas (0.46~0.89), moderately suitable areas (0.24~0.46), lowly suitable areas (0.08~0.24) and unsuitable areas (0~0.08). Due to the irregular distribution range of the suitable areas, it is impossible to accurately judge the dynamic migration changes in the suitable areas in the southeast, northwest and four directions. In this study, the migration direction and distance of the suitable areas in different periods were determined according to the centroid location of the suitable areas in different periods. The center of mass position was calculated using the SDM toolkit in ArcMap v10.2 software.
3. Results and Analysis
3.1. Spatial Distribution of Suitable Areas for A. truncatum Fruit Utilization under Current Climate Conditions
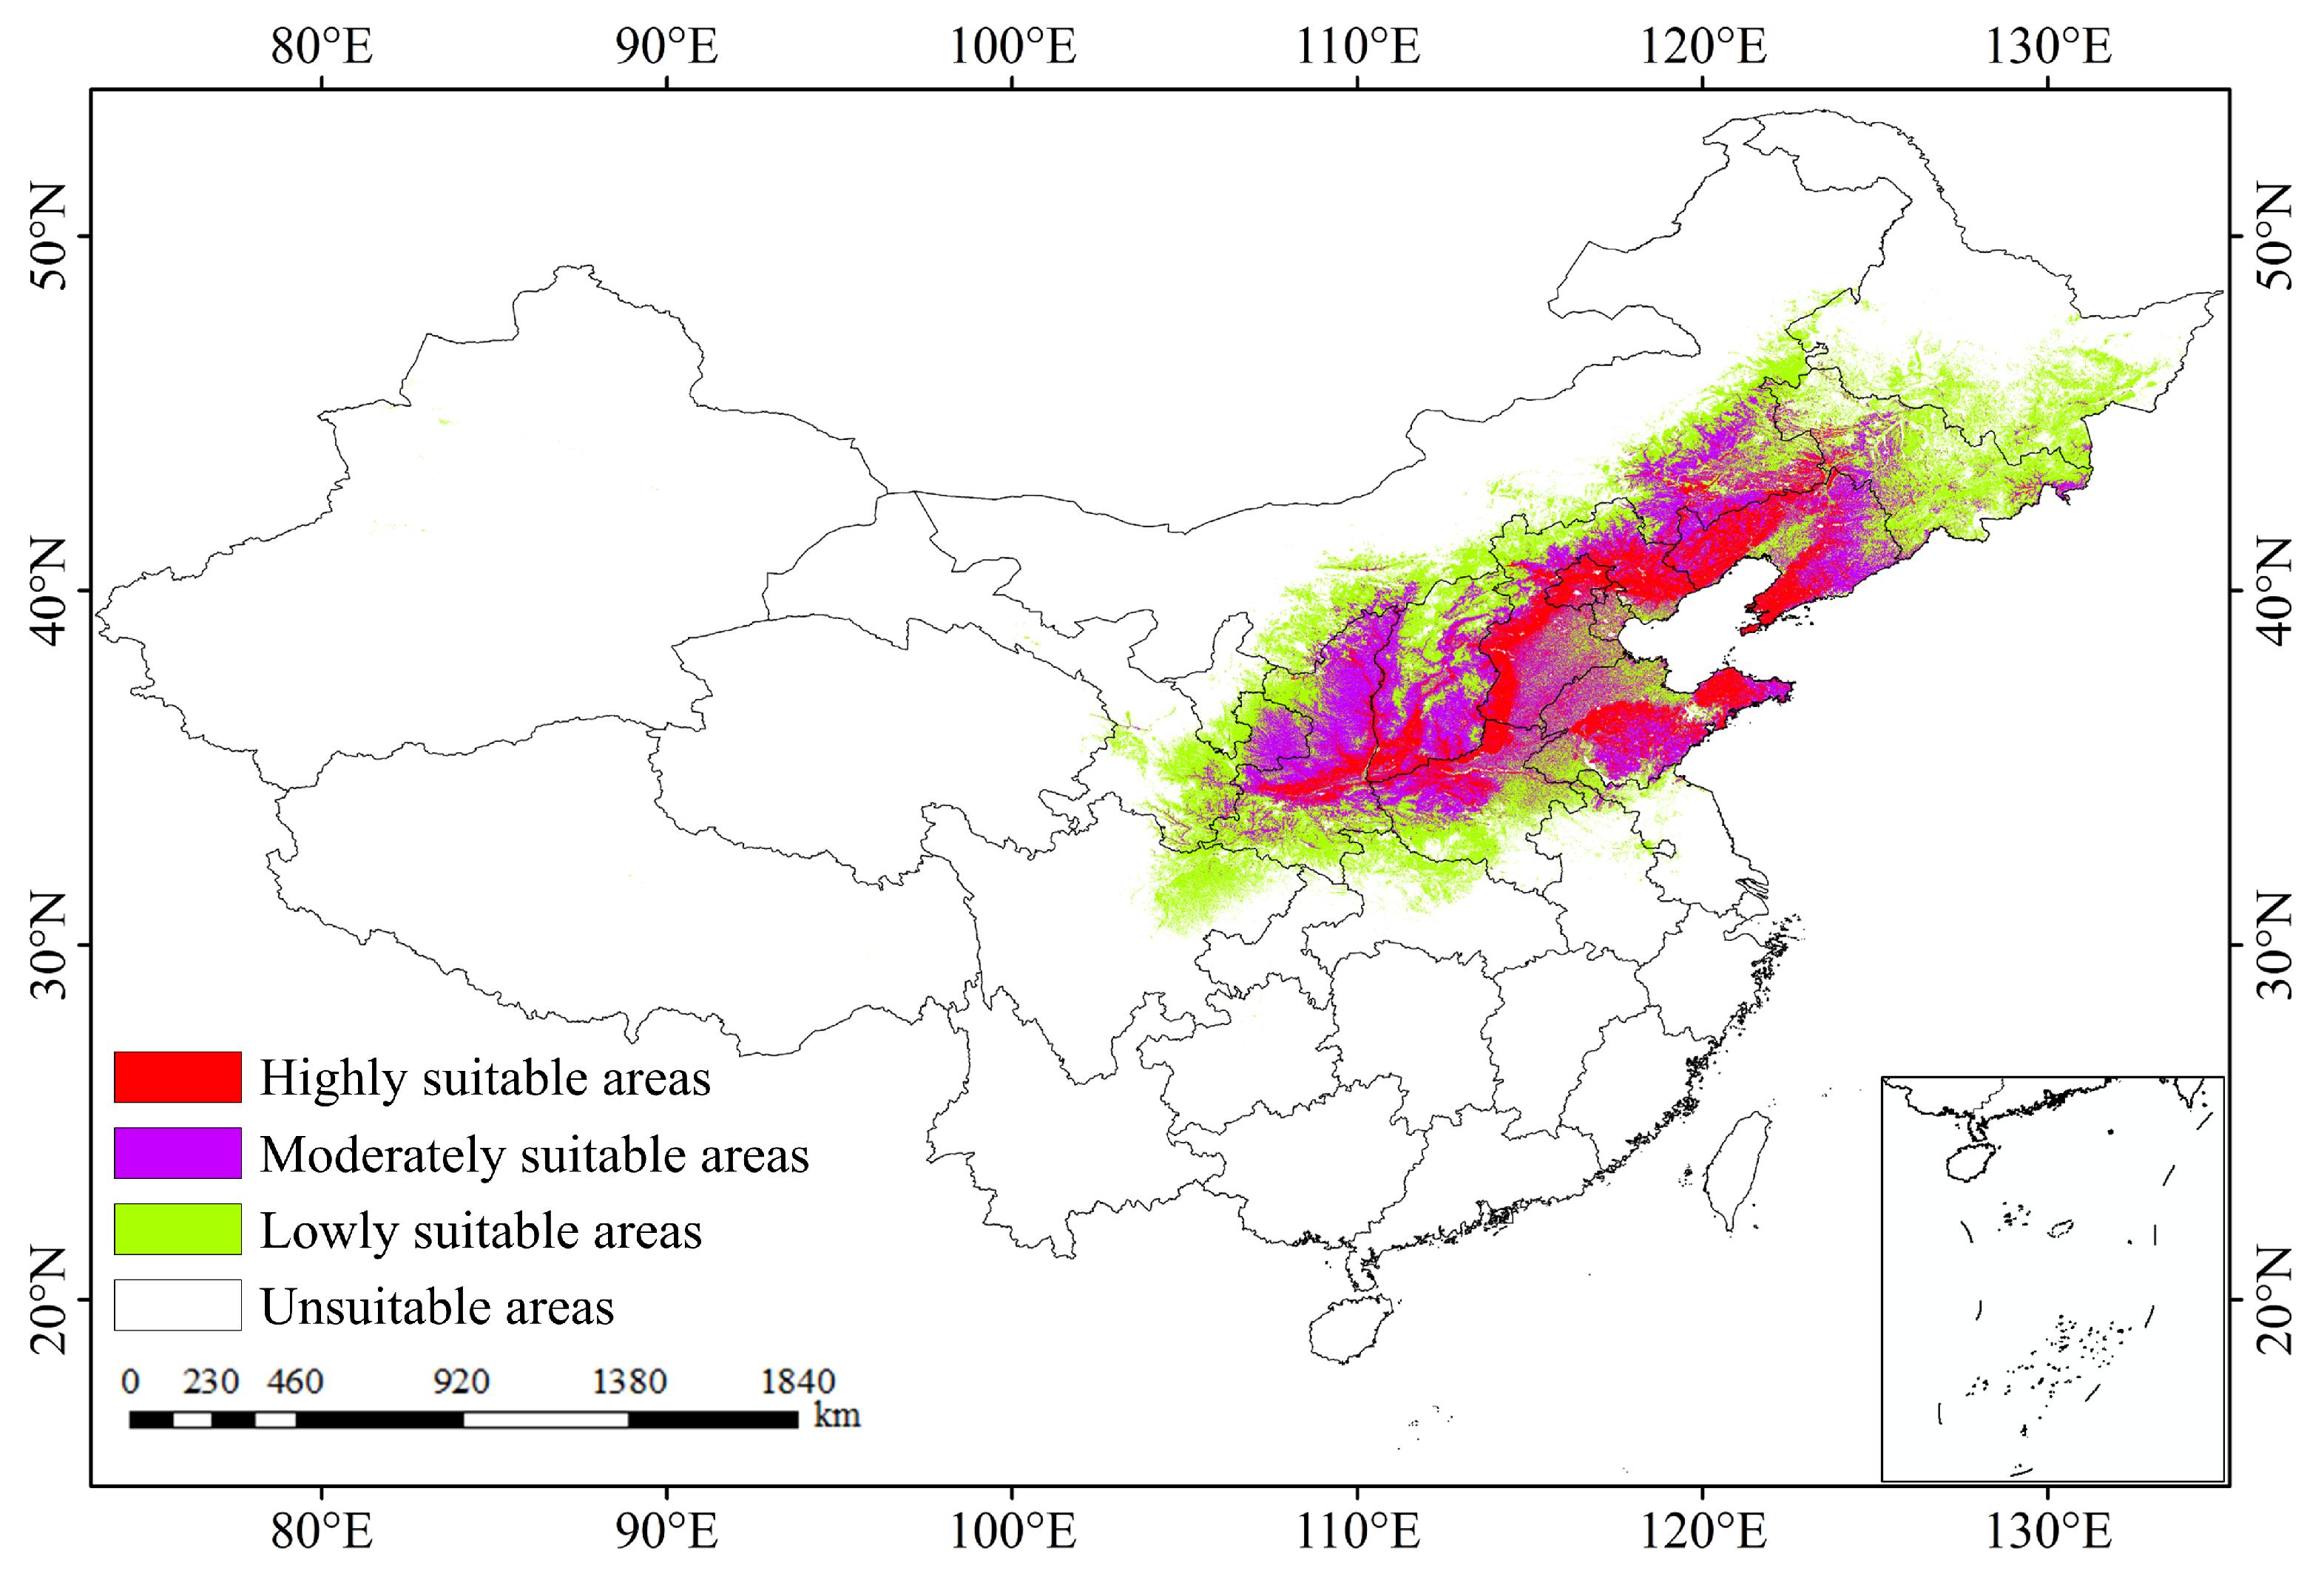
The main areas where A. truncatum is cultivated for fruit production are concentrated in northern China, such as Inner Mongolia, Shaanxi, Hebei, Jilin, Shanxi, Liaoning, Shandong, Henan and Gansu, with an area of 1.64 × 10⁶ km2, accounting for 17.11% of the total land area of China, spanning 34° N~46° N, 108° E~126° E (Figure 2). The highly suitable area covers 2.78 × 10⁵ km2, which is mainly located in Hebei, Liaoning and Shandong, accounting for 16.92% of the national suitable area.
3.2. Spatial Distribution of Suitable Areas for A. truncatum Fruit Utilization under Future Climate Change Scenarios
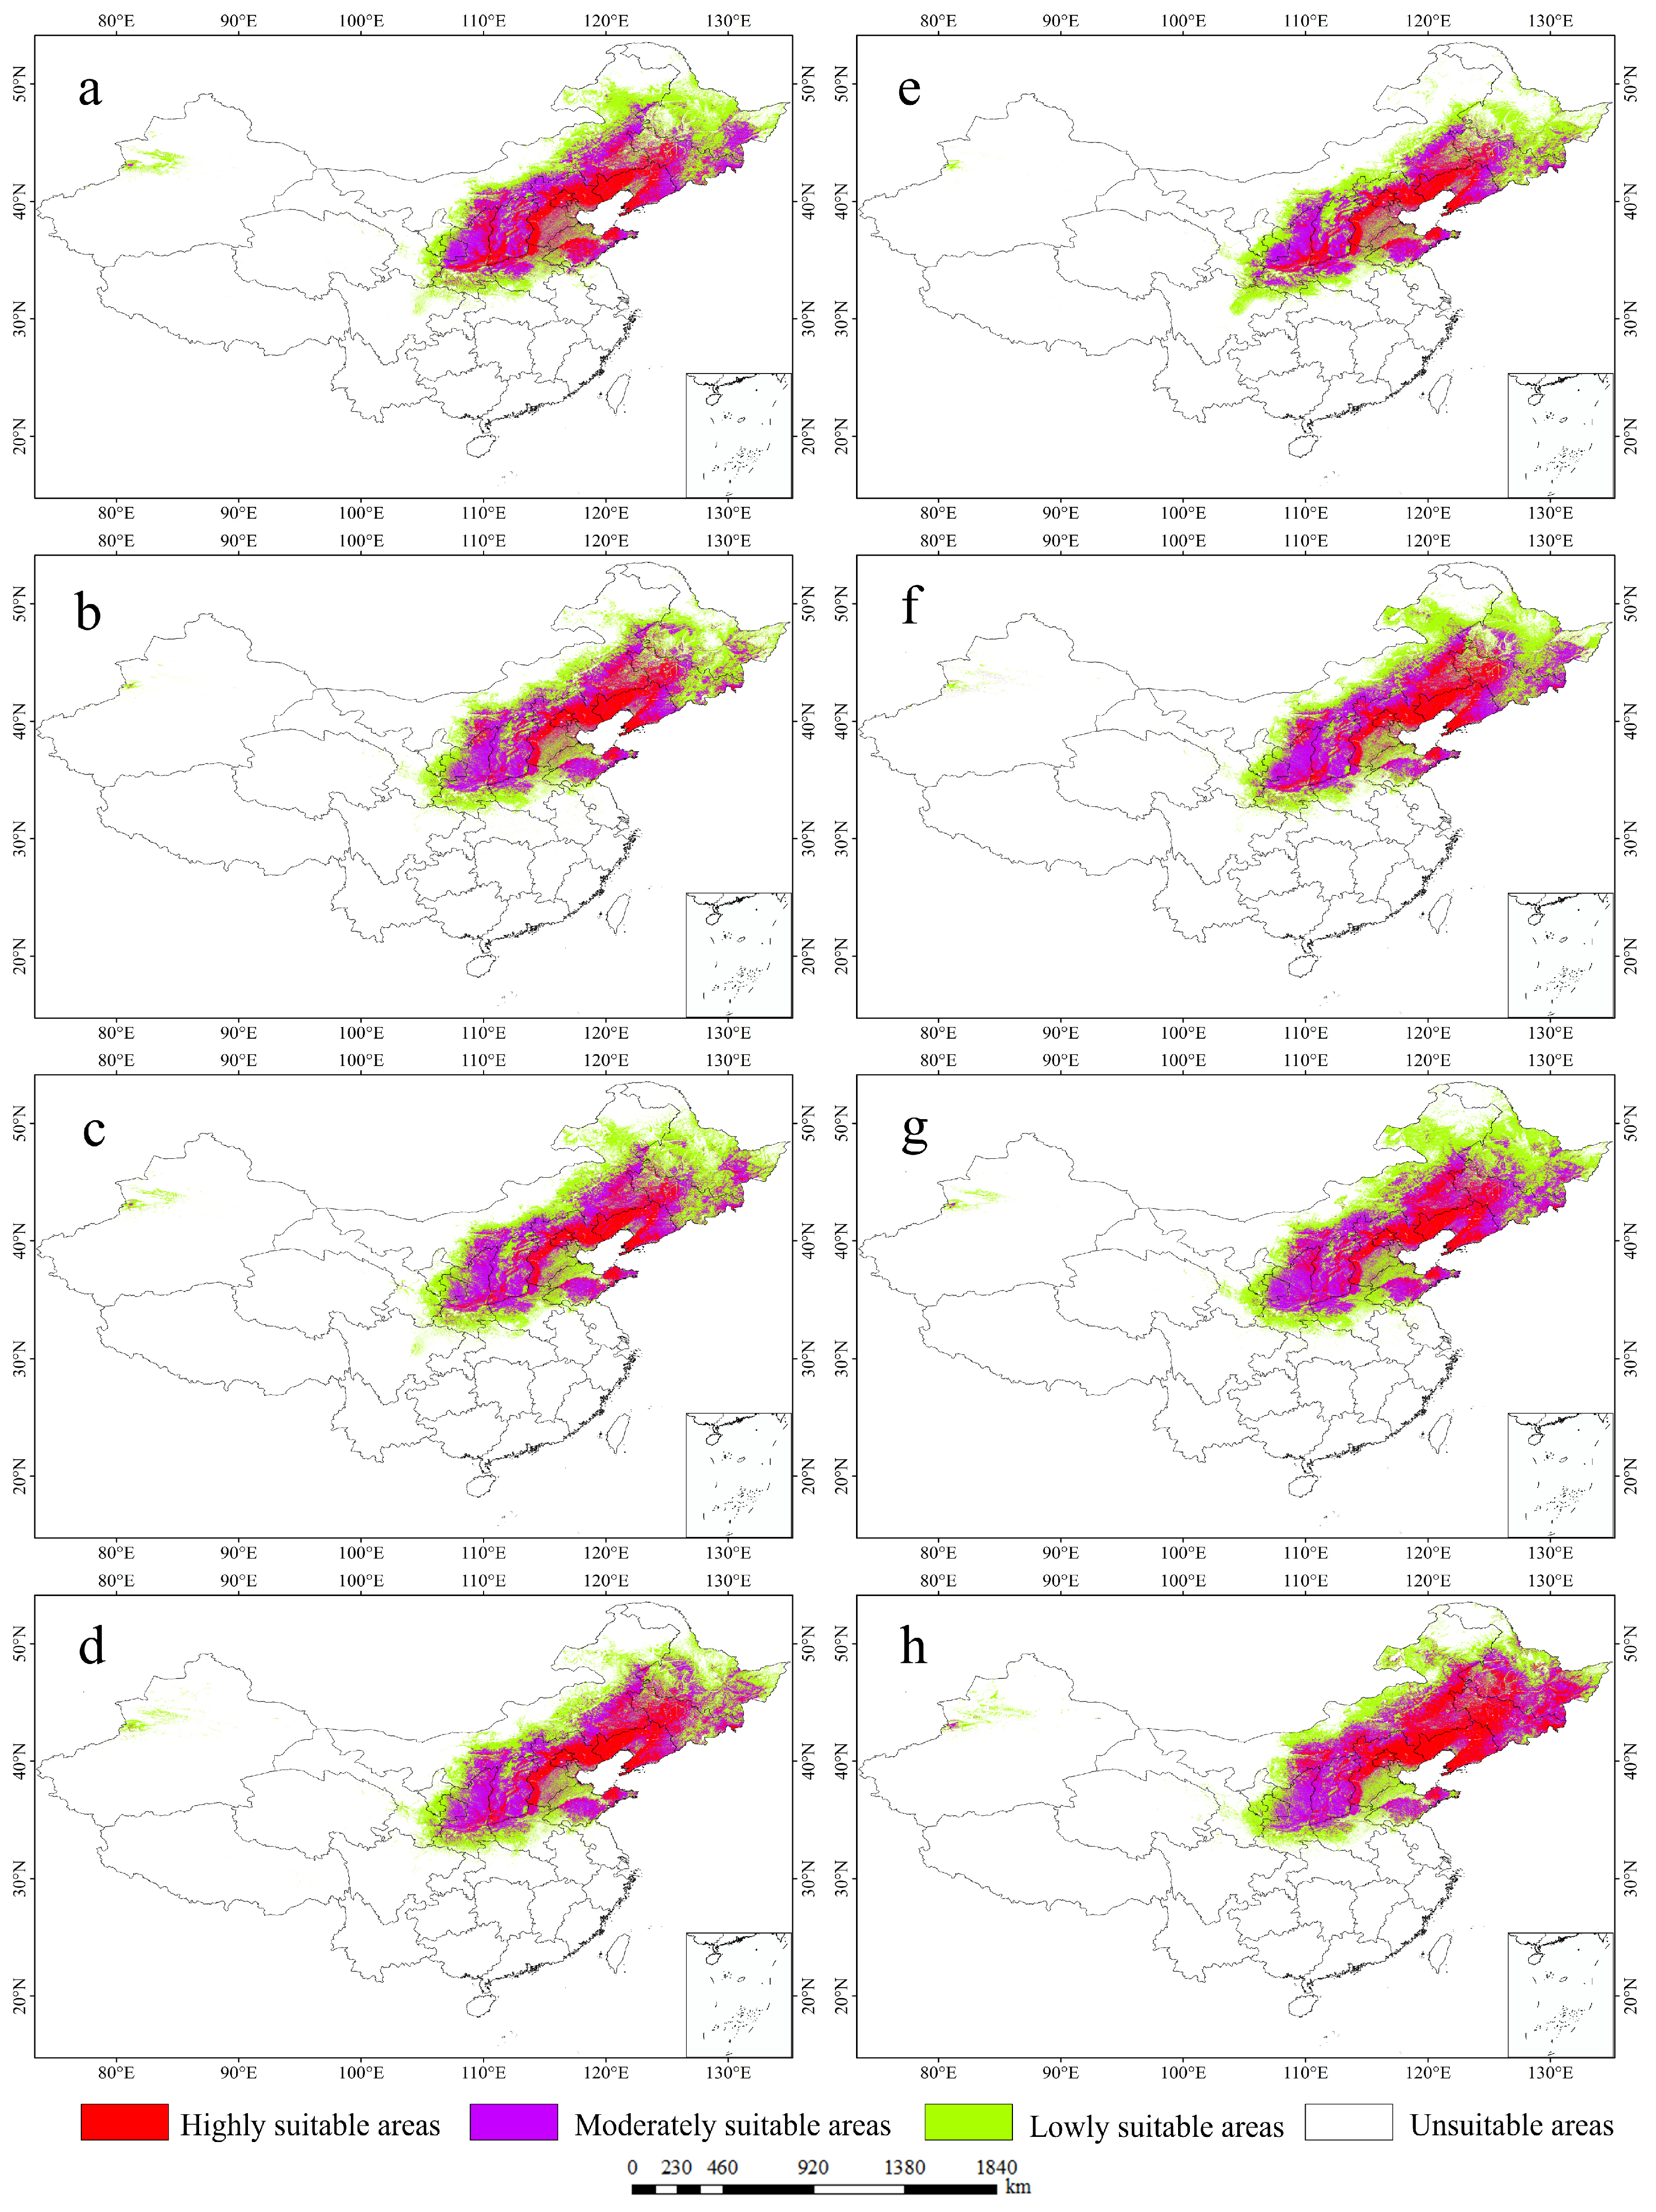
Under future conditions, the area that was suitable for fruit trees showed an expanding trend, and increased the most under the RCP2.6-2050 and RCP8.5-2070 scenarios (Table 2). In 2050, under the RCP2.6, RCP4.5, RCP6.5 and RCP8.5 scenarios, the expansion rates of the suitable area for Acer truncatum fruit utilization were 36.52%, 23.43%, 32.47% and 32.12%, respectively. In 2070, compared with that in 2050, the suitable area increased by 9.18%, 8.95% and 10.36% under the RCP4.5, RCP6.5 and RCP8.5 scenarios, respectively, but decreased by 14.17% and 3.18 × 10⁵ km2 under the RCP2.6 scenario. There were differences in the response of A. truncatum fruit utilization to climate change, with different trends (Figure 3). Under the RCP8.5 scenario, the highly suitable area exhibited the greatest change, reaching 4.21 × 10⁵ km2 in 2050, which is an increase of 51.44%, and reached 6.59 × 10⁵ km2 by 2070, an increase of 137.08% compared with the current area. Under the RCP6.0 scenario, the highly suitable area increased the least, by 18.50%, by 2050.
3.3. Temporal and Spatial Changes in Suitable Areas for A. truncatum Fruit Utilization under Climate Change Scenarios
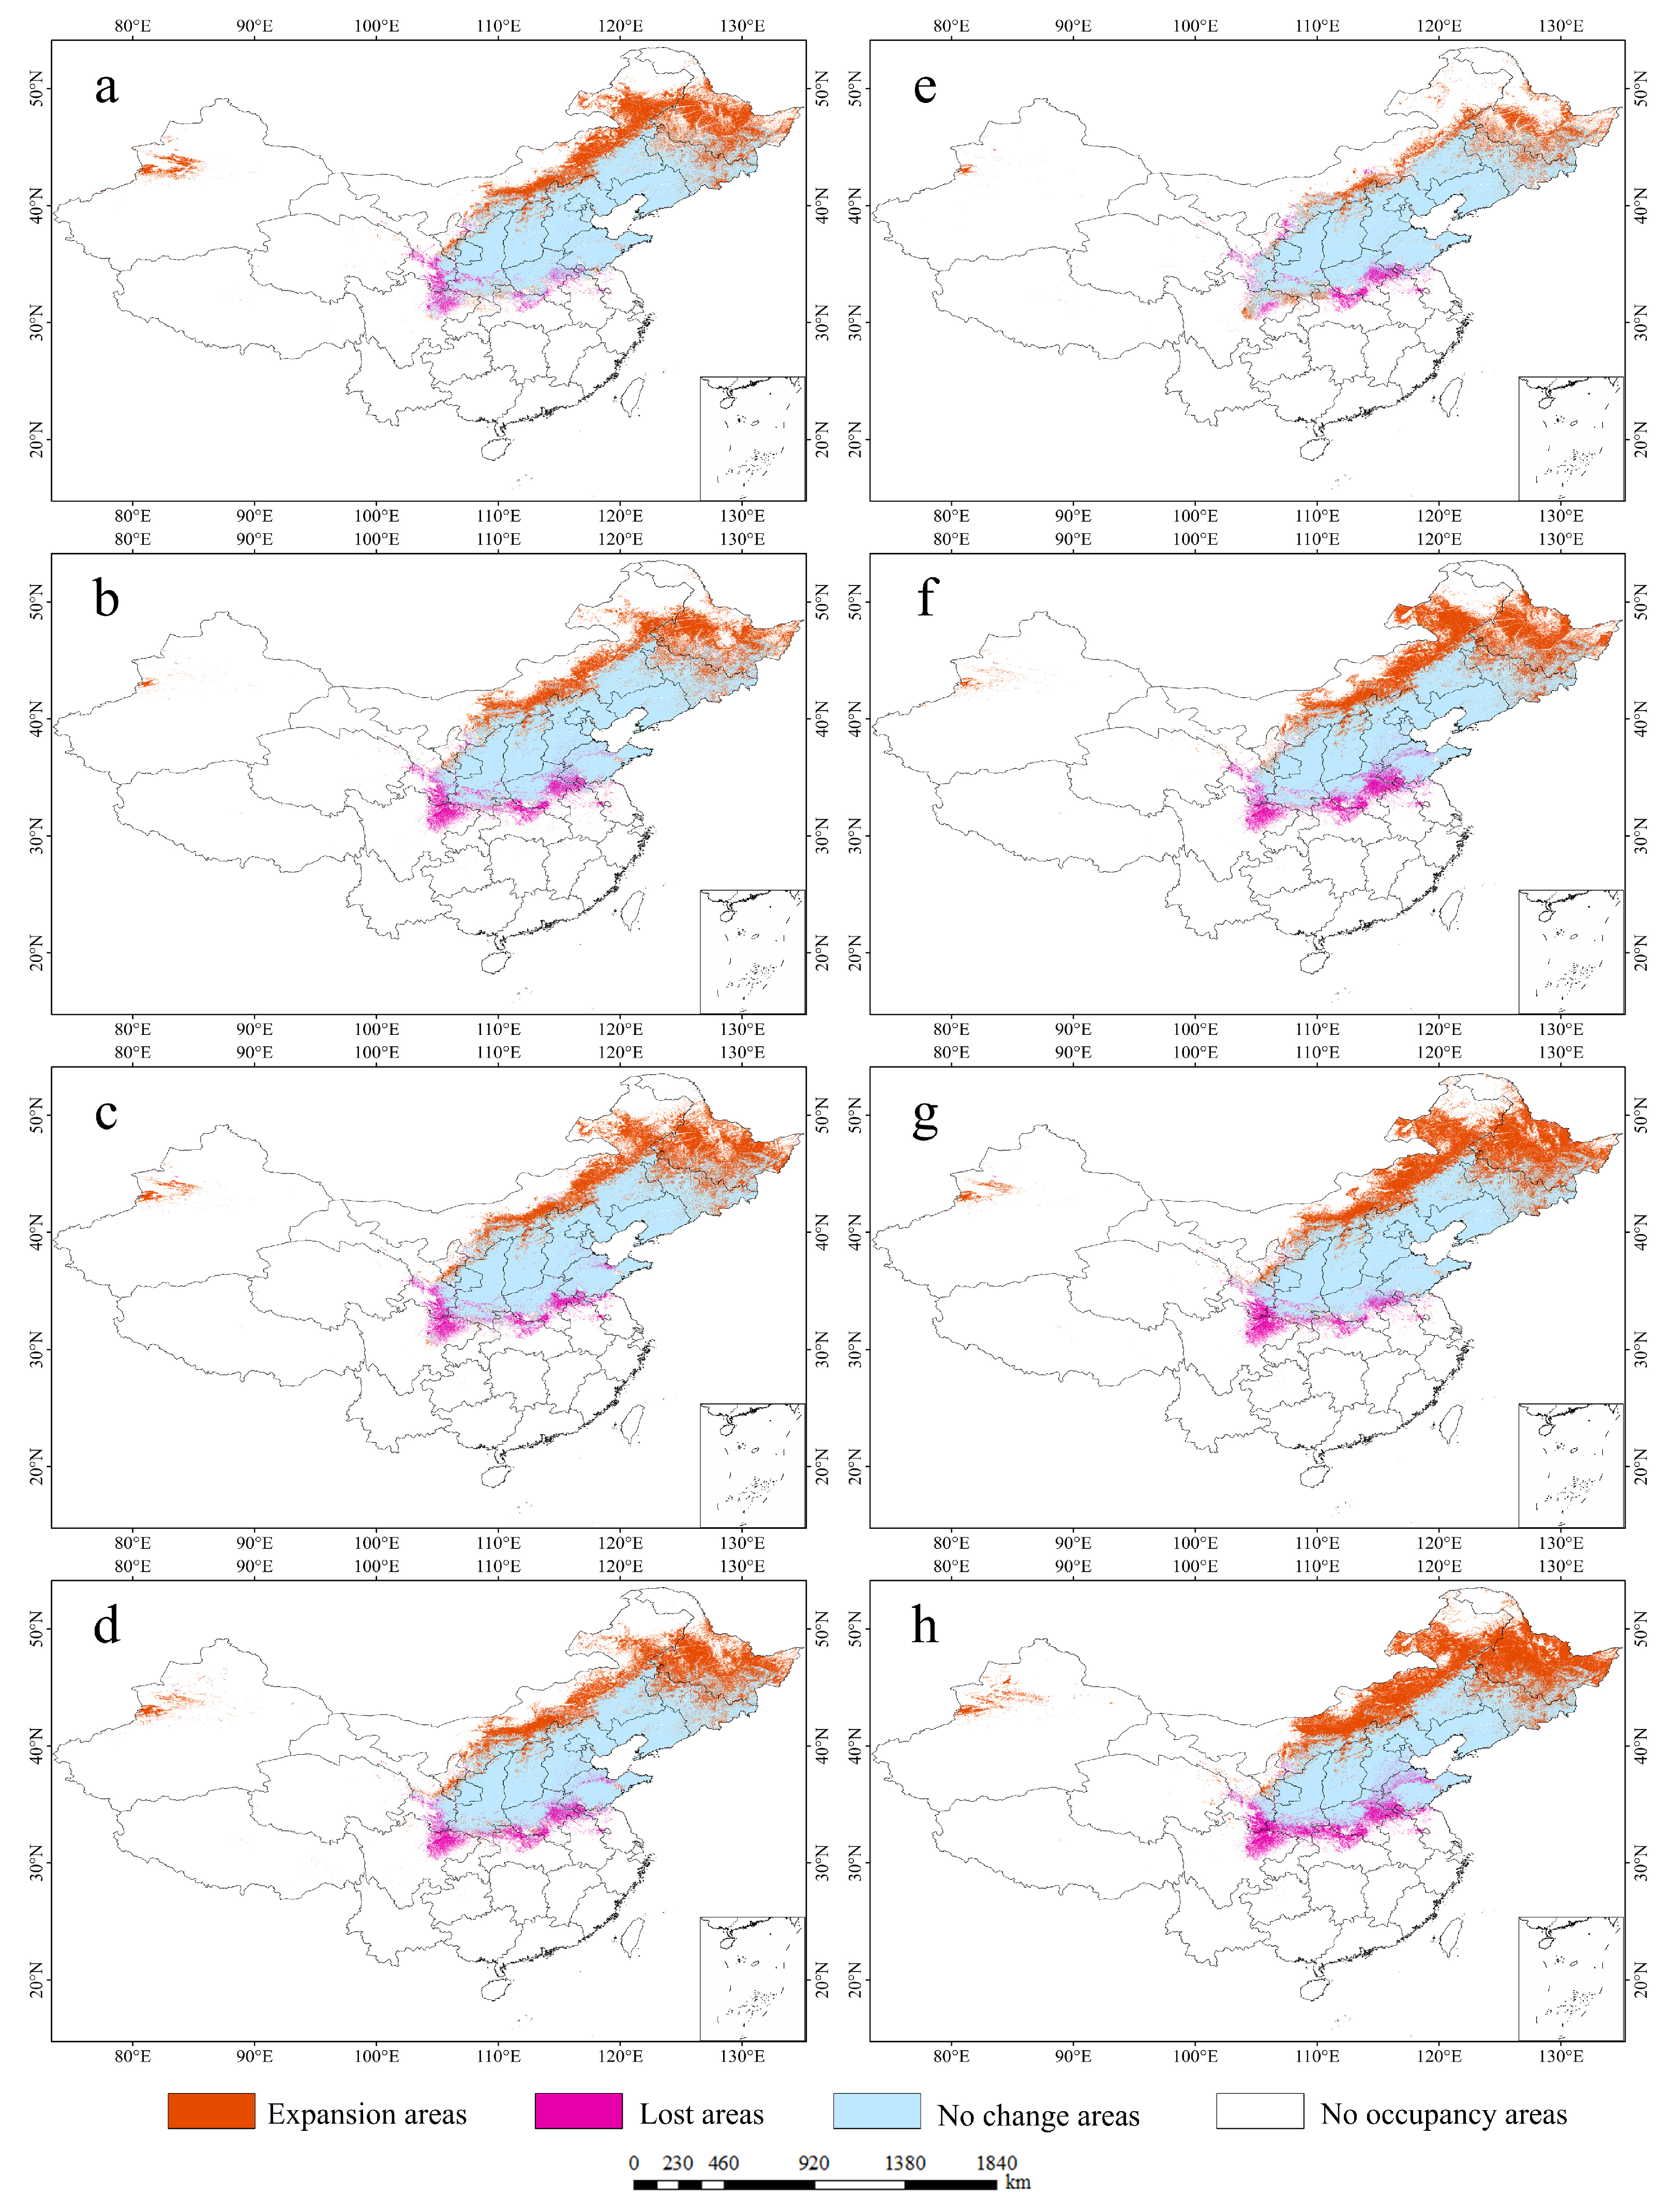
In the future, the distribution of suitable areas for A. truncatum fruit utilization will increase to different degrees compared with that in the current scenario (Table 2). Under the RCP2.6 scenario, the suitable area will fluctuate to 2.05 × 10⁶ km2 and 1.78 × 10⁶ km2 in 2050 and 2070, respectively, increasing by 35.45% and 19.46% and decreasing by 5.09% and 5.26%, respectively. According to the predictions, the expansion will mainly occur in central and northeastern Inner Mongolia, northwestern Heilongjiang and central Ningxia, and be scattered throughout western Xinjiang. The loss of area will mainly occur in southern Gansu, northern Sichuan, northern Hubei and southeastern Henan. Under the RCP4.5 scenario, the area suitable for it will continue to increase compared with the current scenario, and the suitable area will reach 1.86 × 10⁶ km2 and 2.01 × 10⁶ km2 in 2050 and 2070, respectively, with expansions of 27.81% and 37.97%, respectively, and losses of 9.14% and 10.11%, respectively. According to the predictions, the expansion will mainly occur in central and northeastern Inner Mongolia and all of Heilongjiang Province, while the loss of area will mainly occur in southern Gansu, northeastern Sichuan, northern Hubei, southern and eastern Henan and southwestern Shandong Province. Under the RCP6.0 scenario, the area suitable for it also showed a continuous increase compared with the current scenario. In 2050 and 2070, the suitable area will reach 1.98 × 10⁶ km2 and 2.16 × 10⁶ km2, respectively, with expansions of 34.11% and 44.22% and losses of 7.73% and 7.36%, respectively. The expansion will mainly occur in central and northeastern Inner Mongolia and all of Heilongjiang Province, while the loss of area will mainly occur in southern Gansu, northeastern Sichuan and northern Hubei and Henan Provinces. Under the RCP8.5 scenario, the suitable area it will continue to increase compared with that under the current scenario. In 2050 and 2070, the suitable area will reach 1.98 × 10⁶ km2 and 2.16 × 10⁶ km2, respectively, with expansions of 34.58% and 49.42% and losses of 8.30% and 12.59%, respectively. The expansion will mainly occur in central and northeastern Inner Mongolia and all of Heilongjiang Province, while the loss of area will mainly occur in southern Gansu, northeastern Sichuan, northern Hubei, southern and eastern Henan and southwestern Shandong Province. In conclusion, under the four future emission scenarios, RCP2.6, RCP4.5, RCP6.0 and RCP8.5, compared with the current scenario, the expansion of the suitable areas for A. truncatum fruit utilization in 2050 and 2070 will mainly be distributed in the middle latitudes of China (38° N~52° N). This distribution basically covers central and northeastern Inner Mongolia and central and northern Heilongjiang. The loss of suitable areas will be concentrated at 30° N~36° N, mainly in northern Sichuan, northern Hubei and eastern Henan (Figure 4).
3.4. Centroid Migration in the Suitable Area for A. truncatum Fruit Utilization under Climate Change Scenarios
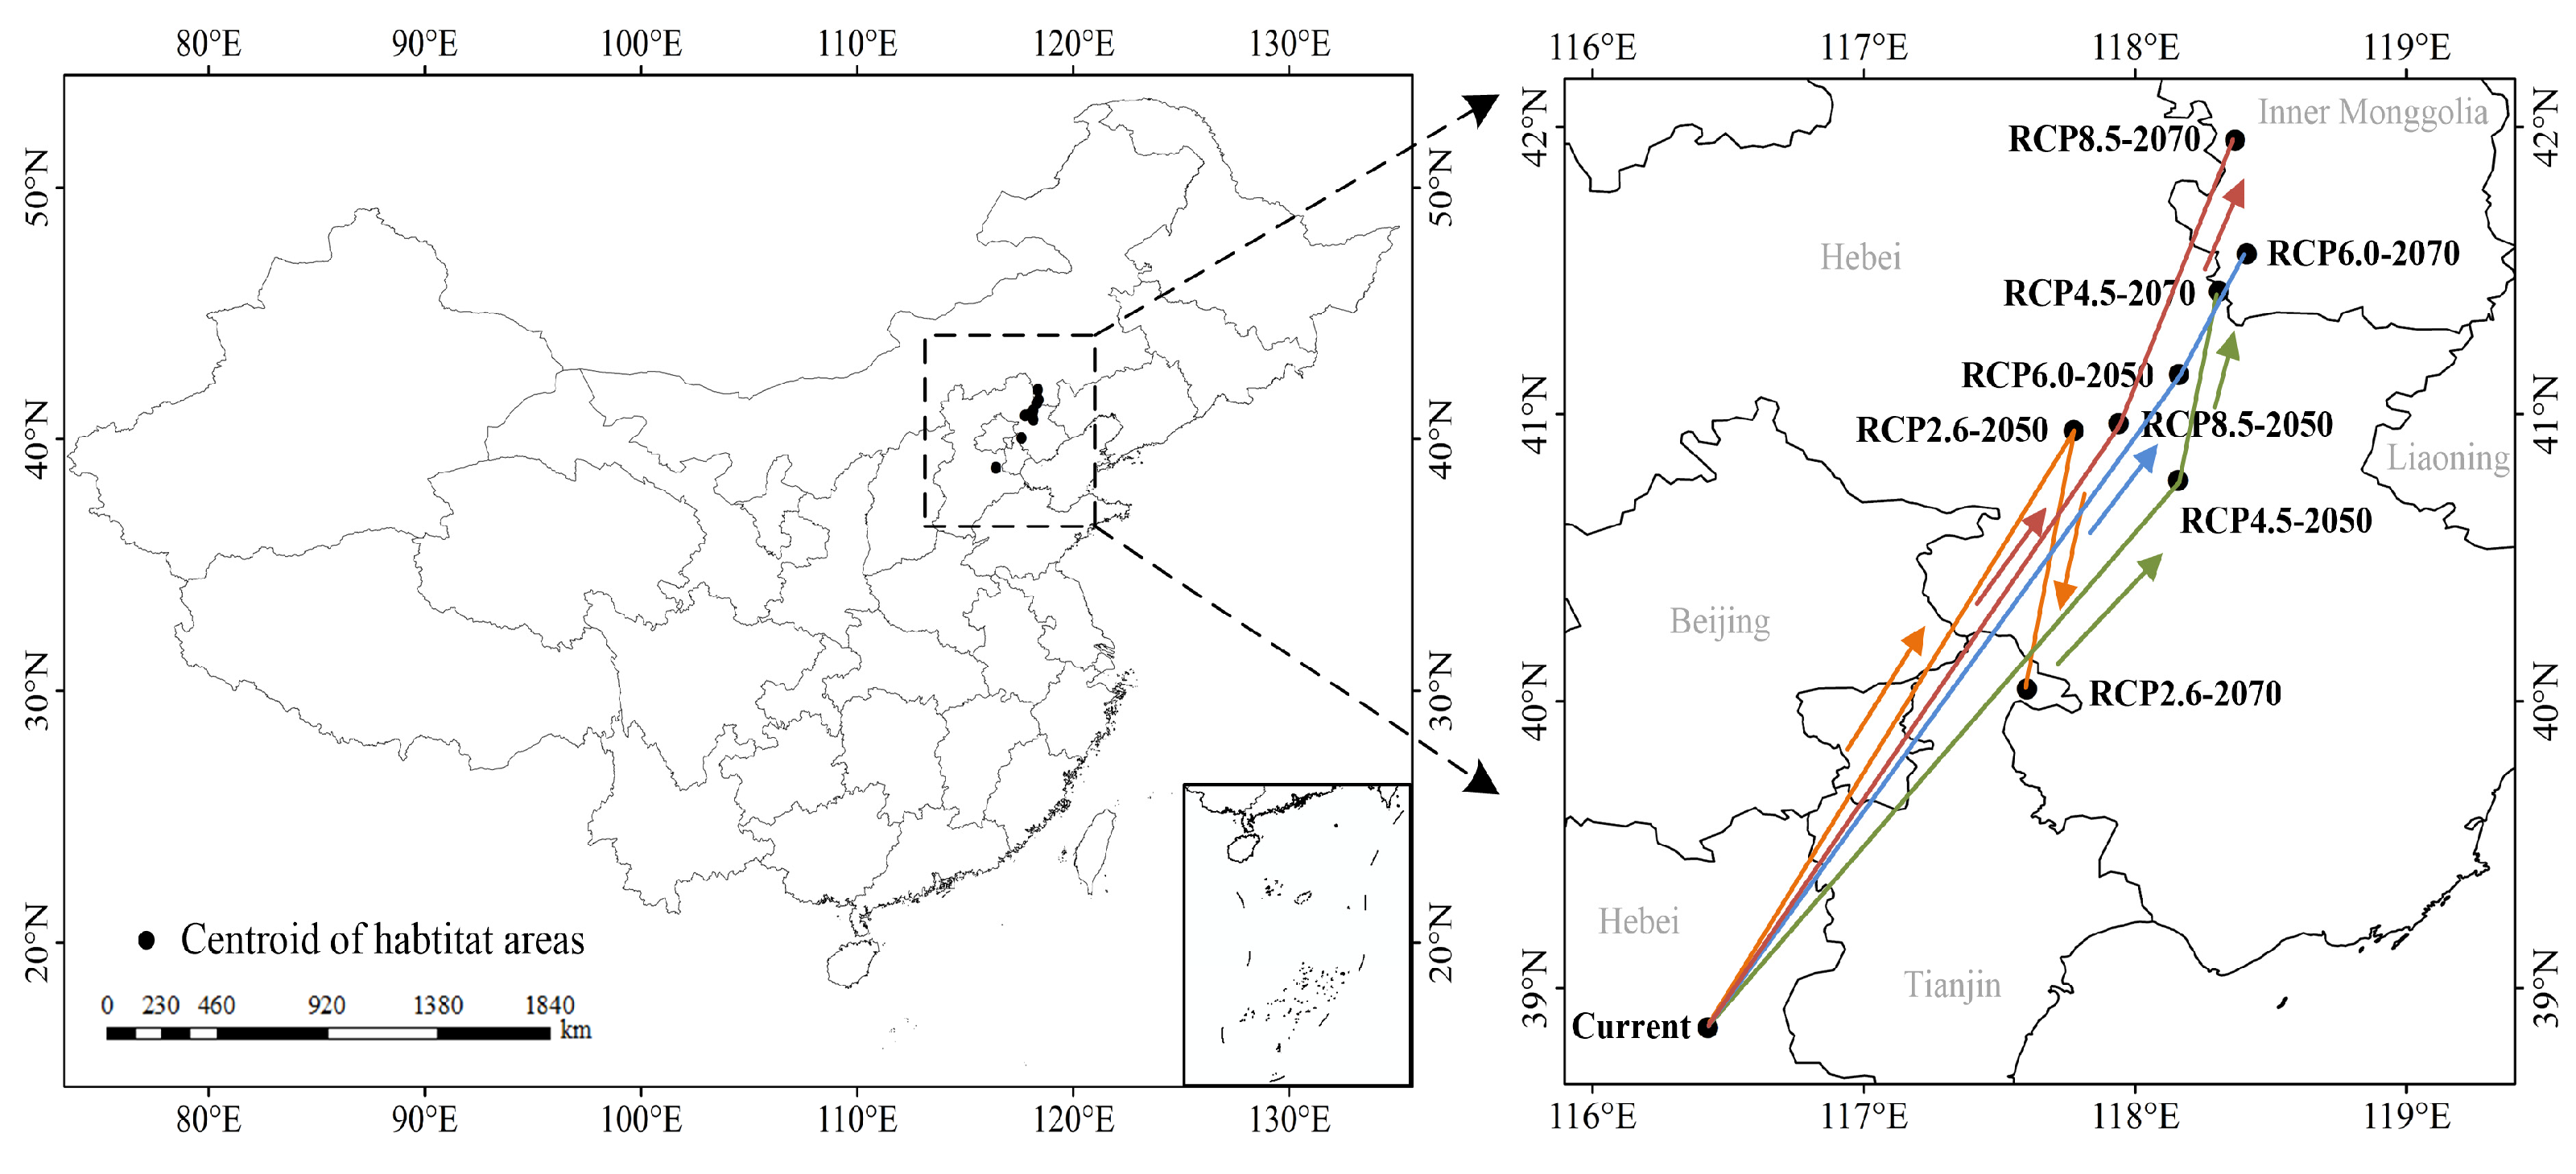
At present, the distribution center of the suitable area for fruit utilization Acer truncatum is located in Wen′an County, Langfang City, Hebei Province (38.86° N, 116.43° E) (Figure 5). In the RCP2.6 scenario, the distribution center of the suitable area will move to Shuangluan District, Chengde City, Hebei Province (40.94° N, 117.77° E) in 2050, which is 242.48 km farther northeast of the current migration trend. By 2070, compared with 2050, the distribution center will move 89.23 km south to Jizhou District of Tianjin (40.04° N, 117.60° E), showing a return trend. In the RCP8.5 emission scenario, the distribution center of the suitable area will move to Shuangqiao District, Chengde City, Hebei Province (40.97° N, 117.94° E) in 2050, which is 253.40 km northeast of the current direction. By 2070, compared with 2050, the distribution center will continue to move 103.55 km to the northeast and will be located in Harqin Banner, Chifeng City, Inner Mongolia (41.95° N, 118.37° E), showing a continuous northeast migration trend. Under the four different future climate scenarios, the center of the suitable area will migrate to the northeast in 2050 and 2070, with a maximum migration distance of 355.46 km, spanning Hebei, Tianjin and Inner Mongolia. The distribution probability of the centroid of the potentially suitable area in Hebei will reach 62.50%, followed by that in Inner Mongolia at 25.00%.
4. Discussion
Future climate change will change the conditions that are important for plant growth, such as climate factors which affect the survival and reproduction of species, and topographic features which determine the range and habitat selection of species, which can lead to changes in the suitable area for plants [35,36,37,38]. Overall, under future climate change conditions, the spatial patterns of the potentially suitable areas for A. truncatum fruit utilization in response to climate change are consistent; that is, with the intensification of climate warming, the overall expansion of suitable area in 2050 and 2070 will be mainly focused on middle and high latitudes, such as 38° N~52° N. The loss of suitable areas will be concentrated at low latitudes such as 30° N~36° N, and the spatial position of the potentially suitable areas will migrate to the northeast. The predicted migration trend of potentially suitable areas is consistent with conclusions drawn from related studies indicating that global warming will cause the migration of this species to higher latitudes [39,40,41]. For example, Leng et al. used the random forest model to study the impact of three emission scenarios in the IPCC Fourth Assessment Report on the potential geographic distribution of three larch species in Northeast China, showing that as climate change intensifies, the potential geographical distribution of the three larch species will significantly migrate to higher latitudes by the end of the 21st century [42]. Flower et al. analyzed the potential geographical distribution changes of three spruce species and one yellow spruce species in Canada under three different emission scenarios in IPCC AR4 based on the Bioclimatic Envelope model, and indicated that under future conditions, the potential geographic distribution of three species of spruce and one species of yellow spruce in Canada shifted significantly to higher latitudes and elevations [43].
Under the scenario of future climate change, the potentially suitable area for A. truncatum fruit utilization showed an overall increasing trend compared with that in the present, but the change process of each suitable area differed. This finding is similar to the prediction results of Zhang Mei et al. [44]’s study on the change in the suitable area of Xinjiang jujube under future climate conditions; that is, under the RCP4.5 and RCP8.5 scenarios in the future (2050 and 2070), the entire potentially suitable area for Xinjiang jujube will increase, but it will not increase homogeneously. The potential expansion areas, unchanged areas and loss of suitable areas for A. truncatum fruit utilization are sensitive areas for potential biotrophic distribution under future conditions. Among them, the suitable areas with potential to remain unchanged are mainly located in the central part of North China and the coastal and eastern northwest regions. Because future land use types may change, which will have an impact on species habitat, some areas currently suitable for the survival of A. truncatum may be lost due to their transformation into other land use types in the future with economic development and urbanization [45,46], but the unchanging areas are safe and can act as a refuge for A. truncatum to cope with climate change.
In the future, attention should be given to the protection and management of these areas, and the efficiency of in situ protection should be strengthened. Suitable areas for potential expansion are mainly located in Northeast China and central Inner Mongolia, and reasonable and sustainable land use planning should be developed in these areas to minimize human disturbance activities and retain enough space for the migration of A. truncatum fruit utilization. The potential loss of suitable areas showed a strong trend of concentrated loss in the boundaries of suitable areas, which were mainly located in southeastern Ningxia, southern Henan, northern Hubei, northeastern Sichuan and southeastern Gansu. Ex situ conservation measures should be actively adopted in this area, a population quantity that can maintain genetic diversity should be established at the protection points, and the protection base should implement a policy of concurrent conservation and development. The introduction of science for profit will be one of the future trends. It should be made clear that modeling technology has been widely used in predicting the potential distribution range of species, assessing the impact of species distribution under different management strategies, and improving the conservation efficiency of key species under limited resources. However, this technology has uncertainties in terms of data quality reliability and simplified model accuracy, which may affect the simulation results.
5. Conclusions
In this study, three types of factors (bioclimatic factors, topographic factors and soil factors) were used for the first time to simulate the distribution of potential suitable areas of A. truncatum fruit utilization under the background of climate change in China. As a woody oil plant that is key in the future development of China, the study of changes in the geographical distribution pattern of suitable areas for A. truncatum fruit utilization under climate change has great theoretical importance for its directional cultivation. The following conclusions can be drawn from this study. (1) Under current conditions, the main areas where the plant is cultivated are Inner Mongolia, Shaanxi, Hebei, Jilin, Shanxi, Liaoning, Shandong, Henan and Gansu in northern China. (2) Under future conditions, the suitable area in 2050 and 2070 showed an expanding trend compared with that in the current period. (3) The area of expansion is concentrated in central and northeastern Inner Mongolia and central and northern Heilongjiang, while the loss of area is concentrated in northern Sichuan, northern Hubei and eastern Henan. (4) Under future conditions, the suitable area will decrease in low-latitude areas and increase in high-latitude areas, and the expansion will be greater than the loss of area; therefore, the suitable area will have a wide range of growth adaptability to future climate change. A theoretical basis and scientific and technological support for the cultivation and industrial development of fruit utilization A. truncatum were provided.
Author Contributions
Investigation, Y.L., S.P. and X.X.; methodology, Y.L. and Y.W.; formal analysis, Y.L. and H.G.; data curation, Y.L. and Y.W.; writing—original draft preparation, Y.L. and Y.W.; writing—review and editing, H.G., D.W., S.W., X.X. and S.P.; supervision, X.X. and S.P.; project administration, S.P.; funding acquisition, Y.L. and S.P. All authors have read and agreed to the published version of the manuscript.
Funding
This research was supported by the Key Fund Project of Central Public Welfare Research Institute of Chinese Academy of Forestry (CAFYBB2020ZB005) and the Basic Resources Survey Project of the Ministry of Science and Technology (2019FY100802_02).
Data Availability Statement
The data was downloaded from and is freely available at World Climate Database and the United Nations World Soil Database.
Acknowledgments
The authors would like to thank Xiaodeng Shi and Shunxiang Pei for their helpful discussion of research methods and article writing. We would like to thank the reviewers for all their helpful comments.
Conflicts of Interest
The authors declare that they have no conflicts of interest.
References
- Chen, I.C.; Jane, K.H.; Ralf, O.; David, B.R.; Chris, D.T. Rapid range shifts of species associated with high levels of climate warming. Science 2011, 333, 1024–1026. [Google Scholar] [CrossRef] [PubMed]
- Ruiz, L.; Nogues, B.; Ollero, H.S.; Schmitz, M.F.; Pineda, F.D. Forest composition in Mediterranean mountains is projected to shift along the entire elevational gradient under climate change. J. Biogeog. 2012, 39, 162–176. [Google Scholar] [CrossRef]
- Catherine, M.D.; Brian, A.B.; James, W.M.; Zoë, L. Climate change drives a shift in peatland ecosystem plant community: Implications for ecosystem function and stability. Glob. Chang. Biol. 2015, 21, 388–395. [Google Scholar]
- Toledo, M.; Poorter, L.; Peña-Claros, M.; Alarcón, A.; Balcázar, J.; Leaño, C.; Licona, J.C.; Llanque, O.; Vroomans, V.; Zuidema, P.; et al. Climate is a stronger driver of tree and forest growth rates than soil and disturbance RID C-8951-2009. J. Ecol. 2011, 99, 254–264. [Google Scholar] [CrossRef]
- Guisan, A.; Tingley, R.; Baumgartner, J.B.; Naujokaitis, I.L.; Sutcliffe, P.R.; Tulloch, A.; Regan, T.J.; Brotons, L.; Mcdonald, E.M.; Mantyka, C.P. Predicting species distributions for conservation decisions. Ecol. Lett. 2013, 16, 1424–1435. [Google Scholar] [CrossRef]
- Ghasemi, S.; Malekian, M.; Tarkesh, M. Climate change pushes an economic insect to the brink of extinction: A case study for Cyamophila astragalicola in Iran. J. Zool. Sys. Evol. Res. 2021, 59, 1632–1641. [Google Scholar] [CrossRef]
- Hughes, L. Biological consequences of global warming: Is the signal already apparent? Trends. Ecol. Evol. 2000, 15, 56–61. [Google Scholar] [CrossRef] [PubMed]
- Walther, G.R.; Post, E.; Convey, P.; Menzel, A.; Parmesan, C.; Beebee, T.J.C.; Fromentin, J.M.; Hoegh, O.G.; Bairlein, F. Ecological responses to recent climate change. Nature 2002, 416, 389–395. [Google Scholar] [CrossRef]
- Yang, X.Q.; Kushwaha, S.P.S.; Saran, S.; Xu, J.C.; Roy, P.S. Maxent modeling for predicting the potential distribution of medicinal plant, Justicia adhatoda L. in Lesser Himalayan foothills. Ecol. Eng. 2013, 22, 83–87. [Google Scholar] [CrossRef]
- Valjarević, A.; Djekić, T.; Stevanović, V.; Ivanović, R.; Jandziković, B. GIS-numerical and remote sensing analyses of forest changes in the Toplica region for the period of 1953–2013. Appl. Geogr. 2018, 92, 131–139. [Google Scholar] [CrossRef]
- Pilar, A.H.; Catherine, H.G.; Lawrence, L.M.; Deborah, L.A. The effect of sample size and species characteristics on performance of different species distribution modeling methods. Ecography 2006, 29, 773–785. [Google Scholar]
- Elith, J.; Graham, C.H.; Anderson, R.P.; Dudík, M.; Ferrier, S.; Guisan, A.; Hijmans, R.J.; Huettmann, F.; Leathwick, J.R.; Lehmann, A.; et al. Novel methods improve prediction of species’ distributions from occurrence data. Ecography 2006, 29, 129–151. [Google Scholar] [CrossRef]
- Han, Y.; Wang, Y.; Ye, J.R.; Li, Y.X.; Lin, S.X. Prediction of potential distribution of Xylella fastidiosa based on Maxent model in China. J. For. Eng. 2015, 29, 144–148. [Google Scholar]
- Zhang, W.H.; Ye, L.Q.; Chen, Q.H.; Ruan, S.N. Introduction and Cultivation Zoning of Acacia melanoxylon Based on Optimized MaxEnt Model. J. Northwest For. Univ. 2023, 38, 88–94+107. [Google Scholar]
- Dai, M.J.; Li, X.Y.; Wang, M.Q.; Wen, Y.F. Potentially Suitable Area of Cryptomeria japonica var. Sinensis and the Influence of Climate Changes on Its Distribution. J. Northwest For. Univ. 2022, 37, 26–33+128. [Google Scholar]
- Wang, X.Y.; Wang, S.Q. New resource food—Acer truncatum seed oil. China Oils Fats 2011, 36, 56–59. [Google Scholar]
- Ren, H.J.; Wang, C.X.; Du, X.Q.; Qiao, Q.; An, K.; Song, Z.K.; Feng, Z. Study on 3 Flavonoids in Acer truncatum Flowers. Chin. Agric. Sci. Bull. 2017, 33, 43–47. [Google Scholar]
- Jia, Z.M. Application of Acer truncatum products in industry. For. Shanxi 2015, 239, 28–29. [Google Scholar]
- Dang, Y.; Wang, W.; Yu, X.X.; Jia, G.D.; Fan, G.X. Eco-hydrological effects of litter layer in typical artificial forest stands in Xishan Mountain of Beijing. J. Beijing For. Univ. 2022, 44, 72–87. [Google Scholar]
- Wei, Y.; Yan, W.; Yang, R. Physiological characteristics of leaf color change during color change in four autumn leaf species. Contempo. Horti. 2014, 261, 17–19. [Google Scholar]
- Wang, L.J.; Jiang, P.; Xu, D.J. Analysis of Geographic Distribution Patterns of Lycium barbarum in the Context of Climate Oscillations. Acta Bot. Boreali-Occident. Sin. 2022, 42, 2133–2142. [Google Scholar]
- Gong, L.; Li, X.; Wu, S.; Jiang, L. Prediction of potential distribution of soybean in the frigid region in China with MaxEnt modeling. Ecol. Inform. 2022, 72, 101834. [Google Scholar] [CrossRef]
- Yu, X.; Tao, X.; Liao, J.; Liu, S.C.; Xu, L.; Yuan, S.; Zhang, Z.L.; Wang, F.; Deng, N.Y.; Huang, J.L.; et al. Predicting potential cultivation region and paddy area for ratoon rice production in China using Maxent model. Field Crops Res. 2022, 275, 108372. [Google Scholar] [CrossRef]
- Wu, Y.X.; YANG, Y.; Liu, C.; Hou, Y.X.; Yang, S.Z.; Wang, L.S.; Zhang, X.Q. Potential suitable habitat of two economically important forest trees (Acer truncatum and Xanthoceras sorbifolium) in east Asia under current and future climate scenarios. Forests 2021, 12, 1263. [Google Scholar] [CrossRef]
- Qian, Y.Y.; Mao, J.F.; Nie, J.L.; Pei, Y.; Lang, Y.J. Performance of Growth, Yield, Composition of an introduced Lycium ruthenicum Murr. under different Soil Conditions in Tianjin. Bull. Bot. Res. 2021, 41, 1023–1028. [Google Scholar]
- Wang, X.Y. Acer truncatum of China; Northwest A & F University Press: Xianyang, China, 2013; pp. 97–104. [Google Scholar]
- Eric, W.; Robert, J.H.; Peterson, A.T.; Árpád, S.N.; Susan, L.P.; Robert, P.G. Locating pleistocene refugia: Comparing phylogeographic and ecological niche model predictions. PLoS ONE 2007, 29, e563. [Google Scholar]
- Kong, W.Y.; Li, X.H.; Zou, H.F. Optimizing MaxEnt model in the prediction of species distribution. Chin. J. Appl. Ecol. 2019, 30, 2116–2128. [Google Scholar]
- Hijmans, R.J.; Cameron, S.E.; Parra, J.L.; Jones, P.G.; Jarvis, A. Very high resolution interpolated climate surfaces for global land areas. Int. J. Climatol. 2010, 25, 1965–1978. [Google Scholar] [CrossRef]
- Otto-bliesner, B.; Marshall, S.J.; Overpeck, J.; Miller, G.; Hu, A. Simulating arctic climate warmth and icefield retreat in the last interglaciation. Science 2006, 311, 1751–1753. [Google Scholar] [CrossRef]
- Shen, Y.P.; Wang, G.Y. Key Findings and assessment results of IPCC WGI fifth assessment report. J. Glaciol. Geocryol. 2013, 35, 1068–1076. [Google Scholar]
- Li, W.Q.; Xu, Z.F.; Shi, M.M.; Chen, J.H. Prediction of potential geographical distribution patterns of Salix tetrasperma Roxb. in Asia under different climate scenarios. Acta Ecol. Sin. 2019, 39, 3224–3234. [Google Scholar]
- Van, D.P.; Edmonds, J.; Kainuma, M.; Riahi, K.; Thomson, A.; Hibbard, K.; Hurtt, G.C.; Kram, T.; Krey, V.; Lamarque, J.F.; et al. The representative concentration pathways: An overview. Clim. Chang. 2011, 109, 5–31. [Google Scholar]
- Tu, Y. Based on Species Distribution Model Analysis suitable Distribution Area of Stipa and the Correlation with Climate Factors in China; Beijing Forestry University: Beijing, China, 2020. [Google Scholar]
- Hanley, J.A.; Mcnil, B.J. The meaning and use of the area under a receiver operating characteristic (ROC) curve. Radiology 1982, 143, 29–36. [Google Scholar] [CrossRef] [PubMed]
- Zhao, Z.F.; Guo, Y.L.; Zhu, F.X.; Jiang, Y. Prediction of the impact of climate change on fast-growing timber trees in China. For. Ecol. Manag. 2021, 501, 119653. [Google Scholar] [CrossRef]
- Wang, Y.C.; Mao, J.Y.; Chen, X.J.; Zhang, Z.Q.; Yang, X.Y. Predicting Potential Distribution of Pistacia chinensis in China Using MaxEnt Model. J. Northeast For. Univ. 2021, 49, 61–65. [Google Scholar]
- Zhang, L.; Sun, P.S.; Huettmann, F.; Liu, S.R. Where should China practice forestry in a warming world? Glob. Chang. Biol. 2021, 7, 28. [Google Scholar] [CrossRef] [PubMed]
- Qiu, H.J.; Song, J.J.; Xu, D.; Shen, A.H.; Jiang, B.; Yuan, W.G.; Li, S. MaxEnt model-based prediction of potential distribution of Liriodendron chinense in China. J. Zhejiang A F Univ. 2020, 37, 1–8. [Google Scholar]
- Pan, L.B.; Duan, W.; Huang, Y.J. Prediction on the potential planting area of Carya illinoinensis in China based on MaxEnt model. J. Zhejiang A F Univ. 2022, 39, 76–83. [Google Scholar]
- Wilson, R.J.; Gutiérrez, D.; Gutiérrez, J.; Monserrat, V. An elevational shift in butterfly species richness and composition accompanying recent climate change. Glob. Chang. Biol. 2007, 13, 1873–1887. [Google Scholar] [CrossRef]
- Leng, W.F.; He, H.S.; Bu, R.C.; Dai, L.M.; Hu, Y.M.; Wang, X.G. Predicting the distributions of suitable habitat for three larch species under climate warming in Northeastern China. For. Ecol. Manag. 2008, 254, 420–428. [Google Scholar] [CrossRef]
- Flower, A.; Murdock, T.Q.; Taylor, S.W.; Zwiers, F.W. Using an ensemble of downscaled climate model projections to assess impacts of climate change on the potential distribution of spruce and Douglas-fir forests in British Columbia. Environ. Sci. Policy 2013, 26, 63–74. [Google Scholar] [CrossRef]
- Zhang, M.; Lu, C.L.; Wei, X.X.; Ma, S.; Liu, W.F.; Song, J.; Pen, R.; Li, J.G. Potential suitable area forecast of jujube in Xinjiang based on MaxEnt model. Non-Wood For. Res. 2020, 38, 152–161. [Google Scholar]
- Midgley, G.F.; Hannah, L.; Millar, D.; Thuiller, W.; Booth, A. Developing regional and species-level assessments of climate change impacts on biodiversity in the Cape Floristic Region. Biol. Conserv. 2003, 112, 87–97. [Google Scholar] [CrossRef]
- Seto, K.C.; Güneralp, B.; Hutyra, L.R. Global forecasts of urban expansion to 2030 and direct impacts on biodiversity and carbon pools. Proc. Natl. Acad. Sci. USA 2012, 109, 16083–16088. [Google Scholar] [CrossRef] [PubMed]
Figure 1.
Sample points of A. truncatum fruit utilization in China.

Figure 2.
Suitable areas for A. truncatum fruit utilization in China under current climate.

Figure 3.
Suitable areas for A. truncatum fruit utilization in China under future climate scenarios (a–d) 2050s: RCP2.6, RCP4.5, RCP6.0 and RCP8.5; (e–h) 2070s: RCP2.6, RCP4.5, RCP6.0 and RCP8.5).
Figure 3.
Suitable areas for A. truncatum fruit utilization in China under future climate scenarios (a–d) 2050s: RCP2.6, RCP4.5, RCP6.0 and RCP8.5; (e–h) 2070s: RCP2.6, RCP4.5, RCP6.0 and RCP8.5).

Figure 4.
Potential suitable distribution pattern for fruit utilization A. truncatum under future climate scenarios compared with current conditions (a–d) 2050s: RCP2.6, RCP4.5, RCP6.0 and RCP8.5; (e–h) 2070s: RCP2.6, RCP4.5, RCP6.0 and RCP8.5).
Figure 4.
Potential suitable distribution pattern for fruit utilization A. truncatum under future climate scenarios compared with current conditions (a–d) 2050s: RCP2.6, RCP4.5, RCP6.0 and RCP8.5; (e–h) 2070s: RCP2.6, RCP4.5, RCP6.0 and RCP8.5).

Figure 5.
Changes in geographical distribution of centroids in potential suitable areas for A. truncatum fruit utilization under different climate scenarios.
Figure 5.
Changes in geographical distribution of centroids in potential suitable areas for A. truncatum fruit utilization under different climate scenarios.


Table 1.
Ecological factor types and detailed information for constructing species distribution models.
Table 1.
Ecological factor types and detailed information for constructing species distribution models.
| Factor Type | Ecological Factor | Unit | Code |
|---|---|---|---|
| Climate factor | Mean annual air temperature | °C | bio1 |
| Monthly mean of temperature difference between day and night | °C | bio2 | |
| Max temperature of the warmest month | °C | bio5 | |
| Mean temperature of the driest quarter | °C | bio9 | |
| Mean temperature of the warmest quarter | °C | bio10 | |
| Precipitation of the wettest quarter | mm | bio16 | |
| Precipitation of the driest quarter | mm | bio17 | |
| Terrain factor | Elevation | m | elev |
| Slope | ° | slope | |
| Aspect | - | aspect | |
| Soil factor | Topsoil sand fraction | % | t_sand |
| Topsoil organic carbon content | % | t_oc | |
| Topsoil cation exchange capacity | cmol/kg | t_cec | |
| Topsoil pH value | - | t_ph | |
| Topsoil available water content | % | t_awc |
Notes: The depth of “topsoil” in the table is 0–30 cm.
Table 2.
Dynamic changes of areas of fruit utilization A. truncatum in various suitable areas under different climate scenarios.
Table 2.
Dynamic changes of areas of fruit utilization A. truncatum in various suitable areas under different climate scenarios.
| Climate Scenarios | Highly Suitable Areas | Moderately Suitable Areas | Lowly Suitable Areas | Unsuitable Areas | ||||
|---|---|---|---|---|---|---|---|---|
| Area (105 km2) | Increase Rate (%) | Area (105 km2) | Increase Rate (%) | Area (105 km2) | Increase Rate (%) | Area (105 km2) | Increase Rate (%) | |
| Current | 2.78 | - | 5.35 | - | 8.29 | - | 16.42 | - |
| RCP2.6—2050 | 44.99 | 61.95 | 7.91 | 47.78 | 10.02 | 20.75 | 22.42 | 36.52 |
| RCP4.5—2050 | 3.4.8 | 25.23 | 7.25 | 35.57 | 9.54 | 15.00 | 20.27 | 23.43 |
| RCP6.0—2050 | 3.29 | 18.50 | 7.74 | 44.65 | 10.72 | 29.29 | 21.75 | 32.47 |
| RCP8.5—2050 | 4.21 | 51.44 | 7.93 | 48.15 | 9.56 | 15.30 | 21.70 | 32.12 |
| RCP2.6—2070 | 3.39 | 22.17 | 6.56 | 22.60 | 9.29 | 12.02 | 19.24 | 17.18 |
| RCP4.5—2070 | 4.17 | 50.04 | 7.98 | 49.21 | 9.98 | 20.33 | 22.13 | 34.76 |
| RCP6.0—2070 | 4.08 | 46.87 | 8.60 | 60.71 | 11.12 | 34.06 | 23.80 | 44.91 |
| RCP8.5—2070 | 6.59 | 137.08 | 8.32 | 55.44 | 9.04 | 9.02 | 23.94 | 45.80 |
Disclaimer/Publisher’s Note: The statements, opinions and data contained in all publications are solely those of the individual author(s) and contributor(s) and not of MDPI and/or the editor(s). MDPI and/or the editor(s) disclaim responsibility for any injury to people or property resulting from any ideas, methods, instructions or products referred to in the content. |
© 2024 by the authors. Licensee MDPI, Basel, Switzerland. This article is an open access article distributed under the terms and conditions of the Creative Commons Attribution (CC BY) license (https://creativecommons.org/licenses/by/4.0/).
Share and Cite
MDPI and ACS Style
Liu, Y.; Wang, Y.; Guo, H.; Wu, D.; Wu, S.; Xin, X.; Pei, S. Changes in Potentially Suitable Areas for Fruit Utilization of Acer truncatum in China under Climate Change. Forests 2024, 15, 713. https://doi.org/10.3390/f15040713
AMA Style
Liu Y, Wang Y, Guo H, Wu D, Wu S, Xin X, Pei S. Changes in Potentially Suitable Areas for Fruit Utilization of Acer truncatum in China under Climate Change. Forests. 2024; 15(4):713. https://doi.org/10.3390/f15040713
Chicago/Turabian StyleLiu, Yitong, Yuqing Wang, Hui Guo, Di Wu, Sha Wu, Xuebin Xin, and Shunxiang Pei. 2024. "Changes in Potentially Suitable Areas for Fruit Utilization of Acer truncatum in China under Climate Change" Forests 15, no. 4: 713. https://doi.org/10.3390/f15040713
Note that from the first issue of 2016, this journal uses article numbers instead of page numbers. See further details here.