Article

Mixed Chinese Fir Plantations Alter the C, N, and P Resource Limitations Influencing Microbial Metabolism in Soil Aggregates

1
College of Forestry, Guangxi University, Nanning 530004, China
2
Guangxi Key Laboratory of Forest Ecology and Conservation, College of Forestry, Guangxi University, Nanning 530004, China
*
Author to whom correspondence should be addressed.
These authors contributed equally to this work.
Forests 2024, 15(4), 724; https://doi.org/10.3390/f15040724
Submission received: 8 March 2024 / Revised: 13 April 2024 / Accepted: 17 April 2024 / Published: 21 April 2024
(This article belongs to the Special Issue Soil Carbon, Nitrogen and Phosphorus Changes in Forests)

Abstract

:
Assessing the limitations of microbial metabolic resources is crucial for understanding plantation soil quality and enhancing fertility management. However, the variation of microbial resource limitations at the aggregate level in response to changes in stands remains unclear. This research explores carbon (C), nitrogen (N), and phosphorus (P) limitations affecting microbial metabolism in bulk soils and aggregates in two mixed and one pure Chinese fir stands in subtropical China, analyzing resource limitations concerning soil carbon, nutrients, and microbial indicators. The results revealed that microbes in all aggregates of the pure stands and in the micro aggregates (<0.25 mm) of the three stands were relatively limited by C and P. In contrast, microbial metabolism was more N-limited in macroaggregates (>2 mm) and small aggregates (2–0.25 mm) in the mixed stands. Additionally, in the mixed stands the proportion of soil macroaggregates increased, and that of micro aggregates decreased, resulting in a shift from C and P limitation to N limitation for bulk soil microbial metabolism. Redundancy analysis identified soil aggregate organic carbon and nutrient content as the main factors affecting microbial resource limitation, rather than their stoichiometric ratios. Pathway analysis further confirmed that soil nutrients and their stoichiometric ratios indirectly influenced soil microbe resource limitation by regulating microbial biomass, microbial respiration, and extracellular enzyme activities. Thus, the impact of mixed plantations on soil nutrients and microbial activity at the aggregate level may be crucial for maintaining land fertility and achieving sustainability.

1. Introduction

Soil serves as the primary medium for plant anchorage and nutrient provision and undergoes the direct influence of changes in vegetation, triggering a cascade of physical alterations, chemical reactions, and responses from soil microorganisms [1,2]. Consequently, soil quality serves as a sensitive indicator of the ecological sustainability of above-ground vegetation, particularly in plantation settings. Chinese fir [Cunninghamia lanceolata (Lamb.) Hook] stands as a prominent timber species cultivated across China [3]. However, the sustainability of Chinese fir plantations faces challenges due to the diminishing yields [4] and soil degradation [5] in monoculture settings. In response, mixed plantations have garnered increasing research attention due to their advantages in leaf photosynthetic capacity, stress tolerance, productivity, and diversity of understory species [6,7]. In recent years, mixed stands combining Chinese fir with native species (e.g., Magnolia macclurei (Dandy) Figlar and Mytilaria laosensis Lecomte) have emerged as a focal point of interest, owing to their enhanced adaptability and the ecological services provided by native species [8,9]. However, despite the growing focus on above-ground aspects, research on the soil ecology of mixed plantations, particularly regarding changes in soil microbes, remains insufficient. Given the pivotal role of soil microorganisms in driving nutrient cycles, their response to changes in stand composition warrants thorough investigation.
In forestry ecosystems, changes in the habitat, including alterations in soil nutrients and forest stands, exert influence over soil microbial biomass (MB), respiration, and metabolic activity [10,11]. Studies demonstrated that microbes modulate the dynamic equilibrium of extracellular enzymes (EEs) and microbial growth to enhance their adaptation to environmental conditions [12,13]. EEs, in particular, play pivotal roles in microbial metabolism as directly decompose soil organic matter, releasing nutrients for cellular absorption and assimilation [14]. For instance, β-glucosidase facilitates glucose release during the carbon cycle [15], urease hydrolyzes urea into ammonium in the nitrogen cycle [16], and acid phosphatases catalyze the hydrolysis of organophosphorus, promoting phosphate group release [17]. Consequently, extracellular enzyme activities (EEAs), associated with energy and nutrient acquisition, serve as critical indicators of microbial resource conditions [18]. Currently, stoichiometric analysis has emerged as a common approach to analyzing ecological resource constraints. Extracellular enzyme stoichiometry determines soil microbial resource limitations [13,19]. Most studies suggest that carbon (C) and phosphorus (P) limitations affecting soil microbes are widespread in low-latitude forest ecosystems [20,21]. Soil microorganisms are typically constrained by C resources due to the limited availability of soil organic matter, a low C/N ratio, and physicochemical conservation in the soil mineral substrate [22]. The scarcity of phosphorus resources is attributed to intense weathering and the binding of soluble phosphorus to alkali cations, forming insoluble compounds that are challenging to utilize [23]. However, microbial resource limitations in secondary soil structures remain unclear, but their identification is essential for understanding soil microbial dynamics.
Soil aggregates constitute the essential components and functional units of soil, playing a crucial role in ensuring soil sustainability and development [24]. Generally, micro aggregates are categorized as composite soil structures smaller than 250 μm, while larger aggregates are formed through the amalgamation of micro aggregates [25]. A study highlighted the sensitivity of large aggregates (>2 mm) to transitions from pure to mixed plantations, revealing increased levels of C and N and od EEAs in mixed Chinese fir stands compared to pure stands [26]. Moreover, aggregates serve as sites for soil microbial attachment and metabolic activities, with changes in aggregate C, N, and P resources potentially regulating the metabolism and reproduction of soil microbes [27].
To explore the microbial response to stand transformation, we investigated soils from mixed Chinese fir plantations, including those with Michelia macclurei stands and those with Mytilaria laosensis stands, alongside soils from pure Chinese fir plantations. The stoichiometric characterization of microbial EEAs was utilized to describe the differential acquisition mode of soil carbon and nutrients by microbes in these three types of plantations. We hypothesized that the relative limiting elements of soil organisms may differ between mixed stands and pure stands, with this difference being regulated by soil physical and chemical properties such as aggregate structure or soil C, N, and P content. Based on the above, the specific objectives of this investigation were to elucidate (1) the effects of two mixed stands on the composition and stability of soil aggregates, as well as on their elemental distribution; (2) the impact of altered soil aggregate structure resulting from stand changes on microbial resource acquisition; (3) potential pathways of soil nutrient-regulated microbial resource limitation in different plantations. This research offers valuable insights for the sustainable management of subtropical plantation forests.

2. Materials and Methods

2.1. Research Site and Sampling

The exploration took place at the Subtropical Forestry Experimental Center within the Chinese Academy of Forestry, situated in Southwest China (coordinates 106°41′~106°59′ E, 21°57′~22°16′ N) (Figure 1A). The area experiences a subtropical monsoon climate characterized by high temperatures and rainfall in summer, with relatively less rainfall in winter. Its annual sunshine duration is from 1200 to 1600 h, with a mean annual temperature falling within the range from 19.5 to 21.5 °C. Annual rainfall is typically within the range from 1200 to 1550 mm, with an average relative humidity of 82%. In the area, Chinese fir and Masson pine (Pinus massoniana Lamb.) are the principal silvicultural species. The soil is strongly acidic red soil, characterized by a pH ranging from 4.8 to 5.5. Its parent material consists mainly of mottled granite.
In this study, two mixed plantations of Cunninghamia lanceolata and Michelia macclurei (SH) and Cunninghamia lanceolata and Mytilaria laosensis (SM), and a pure Cunninghamia lanceolata plantation (SS) were selected as research subjects in July 2019. Prior to afforestation, these sites were logging areas of pure Cunninghamia lanceolata plantations, and intensive artificial disturbances (harvesting) had severely damaged the vegetation [28]. In 1992, mixed and pure Cunninghamia lanceolata stands were established with a row spacing of 2 m × 3 m. The mixed stands had a ratio of 3:1 of Cunninghamia lanceolata to the mixed species, resulting in a density of approximately 1700 plants per hectare. To prevent the site conditions from influencing the test results, the parent soil, slope angle, and slope aspect of the three types of stands were kept consistent (Table 1). A thoroughly randomized grouping design with three stand types and five plots was employed in this study, resulting in the selection of 15 plots (3 stand types × 5 replicates). Each plot’s area was approximately 1×10⁴ m2, and the plots were spaced more than 800 m apart to prevent pseudo-replication and minimize spatial autocorrelation [9]. One standard quadrat (400 m2) was placed within every sample plot, resulting in 15 sample quadrats (Figure 1B,C).
The 5-point approach was employed to acquire soil samples from every standard quadrat. Specifically, after removing soil surface litter, non-rhizosphere soil from different soil layers (0~10 cm and 10~20 cm) was harvested using a spade. The soils from five points were then blended fairly to create mixed samples for each plot (Figure 1C). Thirty mixed soil samples (3 stands × 2 soil layers × 5 replicates) were gently dispersed into natural aggregates and filtered using a 5 mm mesh to eliminate soil animals, plant impurities, and stones. Subsequently, the soil samples underwent aggregate separation. Additionally, soil samples were prepared utilizing a cutting sample ring to analyze soil physicochemical properties. During soil extraction, the cutting sample ring was inserted vertically into the soil, ensuring that it did not disturb the soil structure. Afterwards, the cutting sample ring was gently removed, and a blade was used to eliminate excess soil from the top of the cutting sample ring. The mass and volume of the soil samples thus obtained were used to compute the soil bulk density (BD); after the soil was dehydrated at 65°C until reaching a constant weight, the soil water content (SWC) was ascertained.

2.2. Soil Aggregate Fractionation

Due to the significant effects of wet sieving methods on soil aggregate structure and microbial distribution, soil aggregate classification was conducted using a suitable moisture classification method [29]. The soil samples were cold-dried at 4 °C to reach a suitable soil moisture ratio (approximately 60 g kg−1). Subsequently, the soil samples were classified utilizing screens with diameters of 2.00 and 0.25 mm. Large-aggregates (>2 mm), small aggregates (2~0.25 mm), and micro aggregates (<0.25 mm) were separated by vertical shaking at a frequency of 1 s−1 for 20 min. Among them, clay and chalk particles were present in large aggregates and micro aggregates [30]. Therefore, in this study, micro aggregates are defined as fractions <0.25 mm, without considering clay and silt in the soil. Portions of the samples designated for determining soil properties, OC, and nutrients were air-dried at ambient conditions, while portions intended for assessing soil microbial indicators were stored at −20 °C until use.
The mean weight diameter (MWD) and geometric mean diameter (GMD) of the soil aggregates were calculated using the following equations [9]:
MWD = ( X i   ×   W i )
GMD = exp [ ( X i   ×   W i ) / W i ]
where Xi represents the average value of the corresponding aggregate diameter, and Wi represents the mass percentage of the respective aggregate size.

2.3. Soil Chemical Analyses

The soil OC content was determined using potassium dichromate oxidation spectrophotometry [31]. The micro-Kjeldahl method was utilized to estimate the total nitrogen (TN) content [32]. Total phosphorus (TP) was estimated by digestion and the molybdenum–antimony anti-colorimetric method using H2SO4 and HClO4 [33]. The readily available carbon (ROC) content was identified using the KMnO4 oxidation method [34]. The alkaline diffusion method was applied to analyze hydrolyzable nitrogen (HN) [35]. The available phosphorus (AP) content was assayed by leaching with NaHCO3 and employing the molybdenum–antimony anti-colorimetric method [36].

2.4. Soil Microbial Indicators

Soil microbial biomass carbon (MBC) and microbial biomass nitrogen (MBN) were assessed through chloroform fumigation extraction. Soil MBC was calculated using the equation developed by Vance, Brggek, and Jenkinson [37]:
MBC = Ec / Kc
where Ec represents the variation in leached OC before and after fumigation, and Kc is 0.45.
Soil MBN was derived based on the equation proposed by Brookes et al. [38]:
MBN = En / Kn
where En represents the difference in leached mineral nitrogen before and after fumigation, and Kn is 0.54.
Microbial respiration (MR) was quantified using the alkali absorption titration approach, which quantifies the intensity of soil microbial respiration by employing an alkali solution to absorb the CO2 produced during soil microbial respiration [39].
Soil β-glucosidase (BG) activity was analyzed based on the release of p-nitrophenol [40]. Urease (URE) activity was determined using the hypochlorite–alkaline phenol method [41]. Acid phosphatase (ACP) activity was determined using umbelliferone as a substrate [42].

2.5. Quantification of Microbial Metabolic Limitations

The chemical stoichiometry ratio (C/N/P = 1:1:1) of global habitats serves as a partitioning criterion [18,43]. A scatter plot of URE/ACP and BG/URE was employed to reflect the resource limitations affecting microbial metabolism. The resource limits of the soil and aggregates in different stands were categorized into four components: C and P restrictions, C and N restrictions, N restriction, and P restriction. Additionally, vector length (VL) and vector angle (VA) were calculated based on the relative proportions of EEAs to quantify the elemental limitations in microbial metabolism. A stronger C limitation is expressed as a longer VL, with VA < 45°, and VA > 45°, representing the restrictions of N and P, respectively [44]. The corresponding formulas are outlined below:
V L = ln BG / ln URE 2 + ln BG / ln ACP 2 1 / 2
V A = atan 2 ln BG / ln ACP , ln BG / ln URE 180 / π
where atan2 is a mathematical function to compute the arctangent of a given point (x, y).

2.6. Statistics and Analysis

Data were statistically analyzed using SPSS 19.0 software (SPSS Inc., Chicago, IL, USA). One-way analysis of variance (ANOVA) with a significance level set at p < 0.05 was utilized to investigate the responses to different stands and aggregates. The influences of interactions between stands and aggregates on indicators were analyzed by two-way ANOVA. Redundancy analyses predicted links between microbial resource constraints and nutrients. Additionally, the association between VL and VA was analyzed using linear regression analysis. The association between aggregates and bulk soil resource constraints was investigated using Pearson correlation analysis.
To explore potential cascading relationships of soil nutrient and microbial indicators regulating microbial resource limitation based on small sample sizes, a formative indicator pathway model was constructed using Smart PLS 3.0 (SmartPLS GmbH Inc., Oststeinbek, Germany). A path weighting scheme was chosen along with a maximum number of 500 iterations. The impact indicators were screened to optimize the overall structure and predictive performance of the model. The weights for each factor were required to be higher than 0.1 and considered significant at the 0.05 level, preferably greater than 0.2 [45], as this determines the extent to which the indicator variable contributes to the latent variable. Additionally, the variance inflation factor (VIF) was assessed to ensure that the VIF of each indicator was less than 3.3, following Diamantopoulos and Siguaw [46]. We also evaluated whether the paths between each latent variable reached a significant level by conducting a significance test and adjusting for nonsignificant paths. Finally, the structural model was evaluated using the coefficient of determination (R2), effect size (f2), and cross-validated redundancy (Q2) [45,47,48].

3. Results

3.1. Variations in Soil Aggregates and Nutrients

The soil aggregate structure was clearly influenced by the stand type. In the mixed plantations, a significantly increased proportion of large aggregates and a significantly decreased proportion of micro aggregates were found compared to the pure plantations (Table 2). The proportion of large aggregates was the highest in the SH stand soils, reaching 51.9% and 49.2% in the two soil layers examined. Conversely, the proportions of micro aggregates were the lowest, corresponding only to 14.8% (0~10 cm) and 19.3% (10~20 cm) of the bulk soil in the SH stand. The proportion of micro aggregates was the highest in the pure plantation soils, corresponding to 35.8% and 45.5% in the two soil layers, followed by those of large aggregates and small aggregates. Additionally, the aggregate composition of the SM stand soils was strongly influenced by soil depth.
The OC, TN, TP, ROC, HN, and AP contents in the 0~20 cm bulk soil of the SH stand and in the 0~10 cm bulk soil of the SM stand were markedly higher than those in the pure stand. Additionally, the OC, TN, ROC, HN, and AP levels were statistically higher in the SH stand compared to the SS stand across all aggregates. In the 0~10 cm soil layer, the OC, TN, TP, ROC, HN, and AP contents were consistently higher in the SM stands compared to the SS stands across almost all aggregate sizes. However, in the soil of the 10–20 cm layer, there was no significant difference in OC and nutrient levels between the SM stands and the SS stands. In the 0–20 cm soil layer, the C/P ratio was higher in the SH stands compared to the pure stands, as was the N/P ratio in the 0–10 cm soil layer. Additionally, the C/N ratio in the 10–20 cm soil layer in both mixed stands exceeded that in the pure stands, while the N/P ratio was comparatively lower (Figure 2G–I). Stand variations mainly led to significant differences in large aggregates and micro aggregates across different soil layers. Specifically, the C/N and C/P ratios in large aggregates in the 0–20 cm soil layer of the SH stands and the 0–10 cm soil layer of the SM stands exceeded those in the corresponding layers of the SS stands (Figure 2G,H). Furthermore, the C/N and N/P ratios in micro aggregates in the SH stands exhibited significant differences compared to those in the SS stand (Figure 2G,I). It is concerning that the OC content increased significantly as the aggregate particle size decreased. Moreover, the contents of TN, ROC, HN, and AP and the C/N ratio were overall lower in the large aggregates than in the micro aggregates across the three stand types (Figure 2).

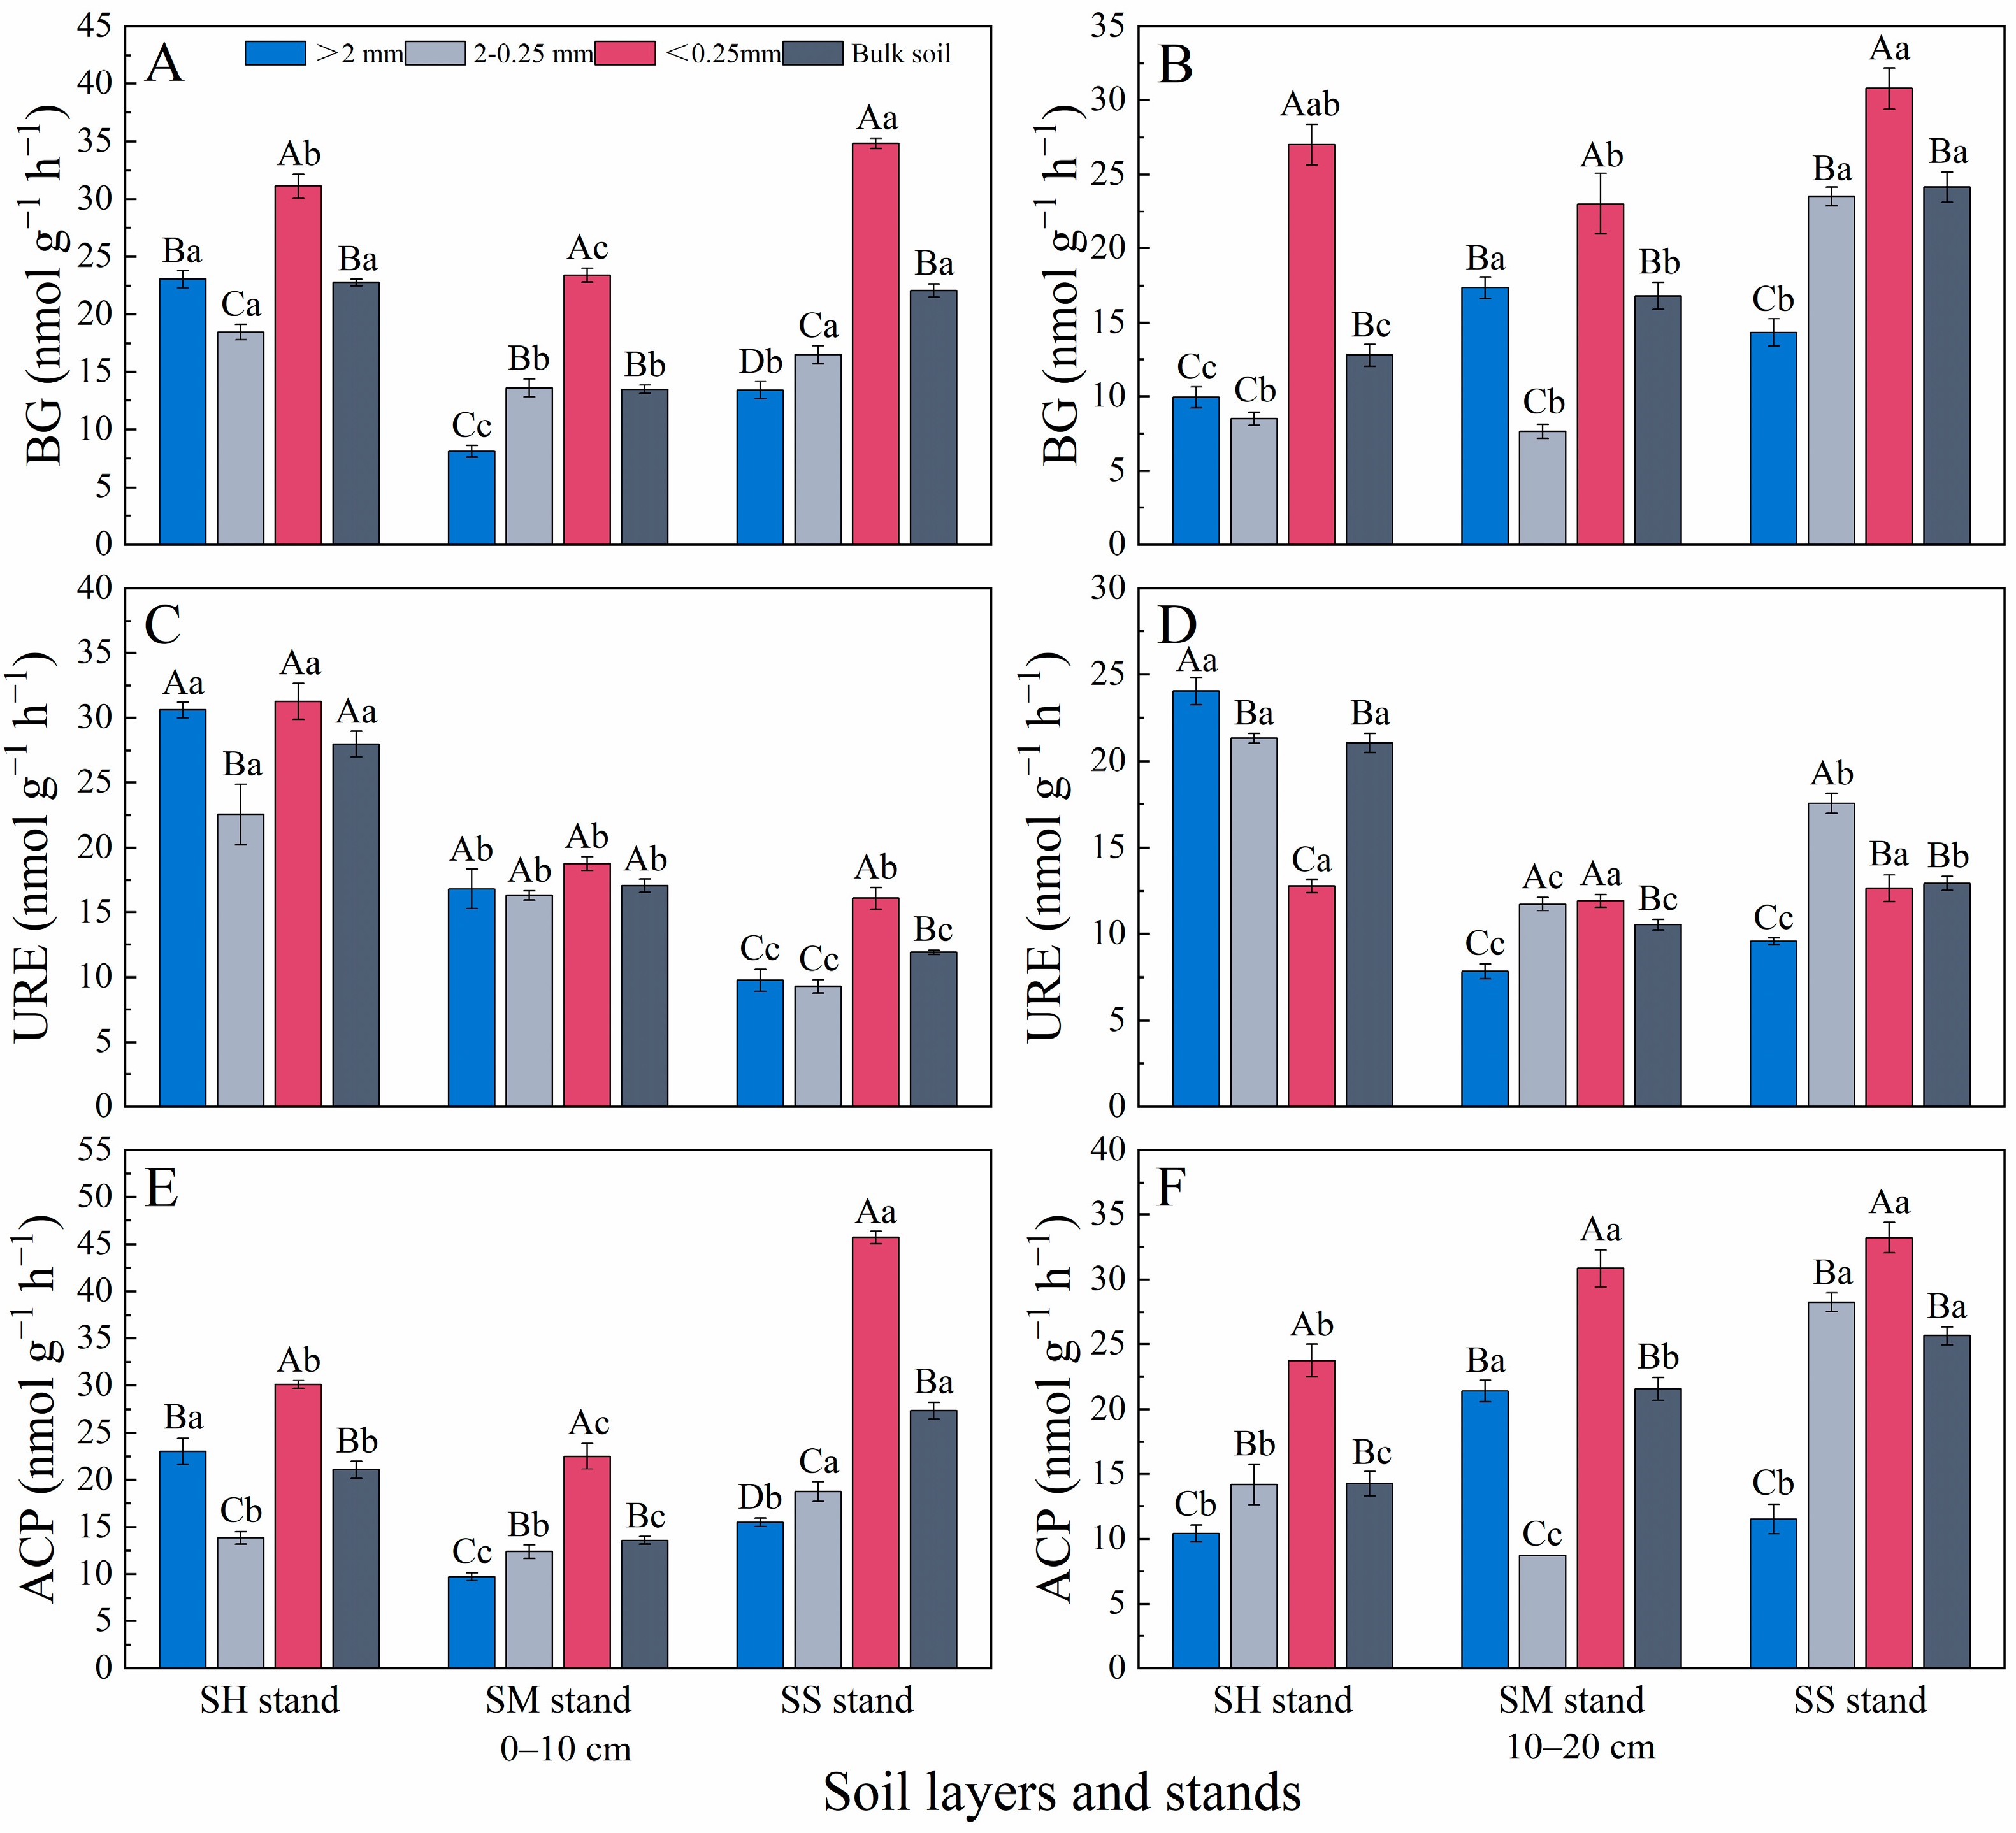
3.2. Soil Microbial Activity and Extracellular Enzymes

Stand types, aggregates, and their interactions significantly affected soil MB and MR (Figure 3). From the bulk soil perspective, soil MBN and MR exhibited significantly higher levels in the SH and SM stands compared to the SS stands within the 0–10 cm soil layer. MBC was also markedly higher in the SM stand compared to the SS stand (10~20 cm soil). Regarding the aggregates, the MBC, MBN, and MR in all three stands increased with the decreasing aggregate size, with micro aggregates generally exhibiting higher MB and respiration intensities. In aggregates of all sizes in the 0~10 cm soil, MBN and MR were increased visibly in both SH and SM stands compared with the pure stands. Furthermore, MBC and MR in the large aggregates in the 10~20 cm soil differed markedly in mixed and pure stands (Figure 3). Additionally, BG and ACP activities were greater in pure stand soils compared with mixed stand soils (Figure 4). Conversely, URE activity in the pure stands was generally lower than in the two mixed stands. The highest EEA was present in micro aggregates, except for URE activity in the 10~20 cm soil layer (Figure 4).

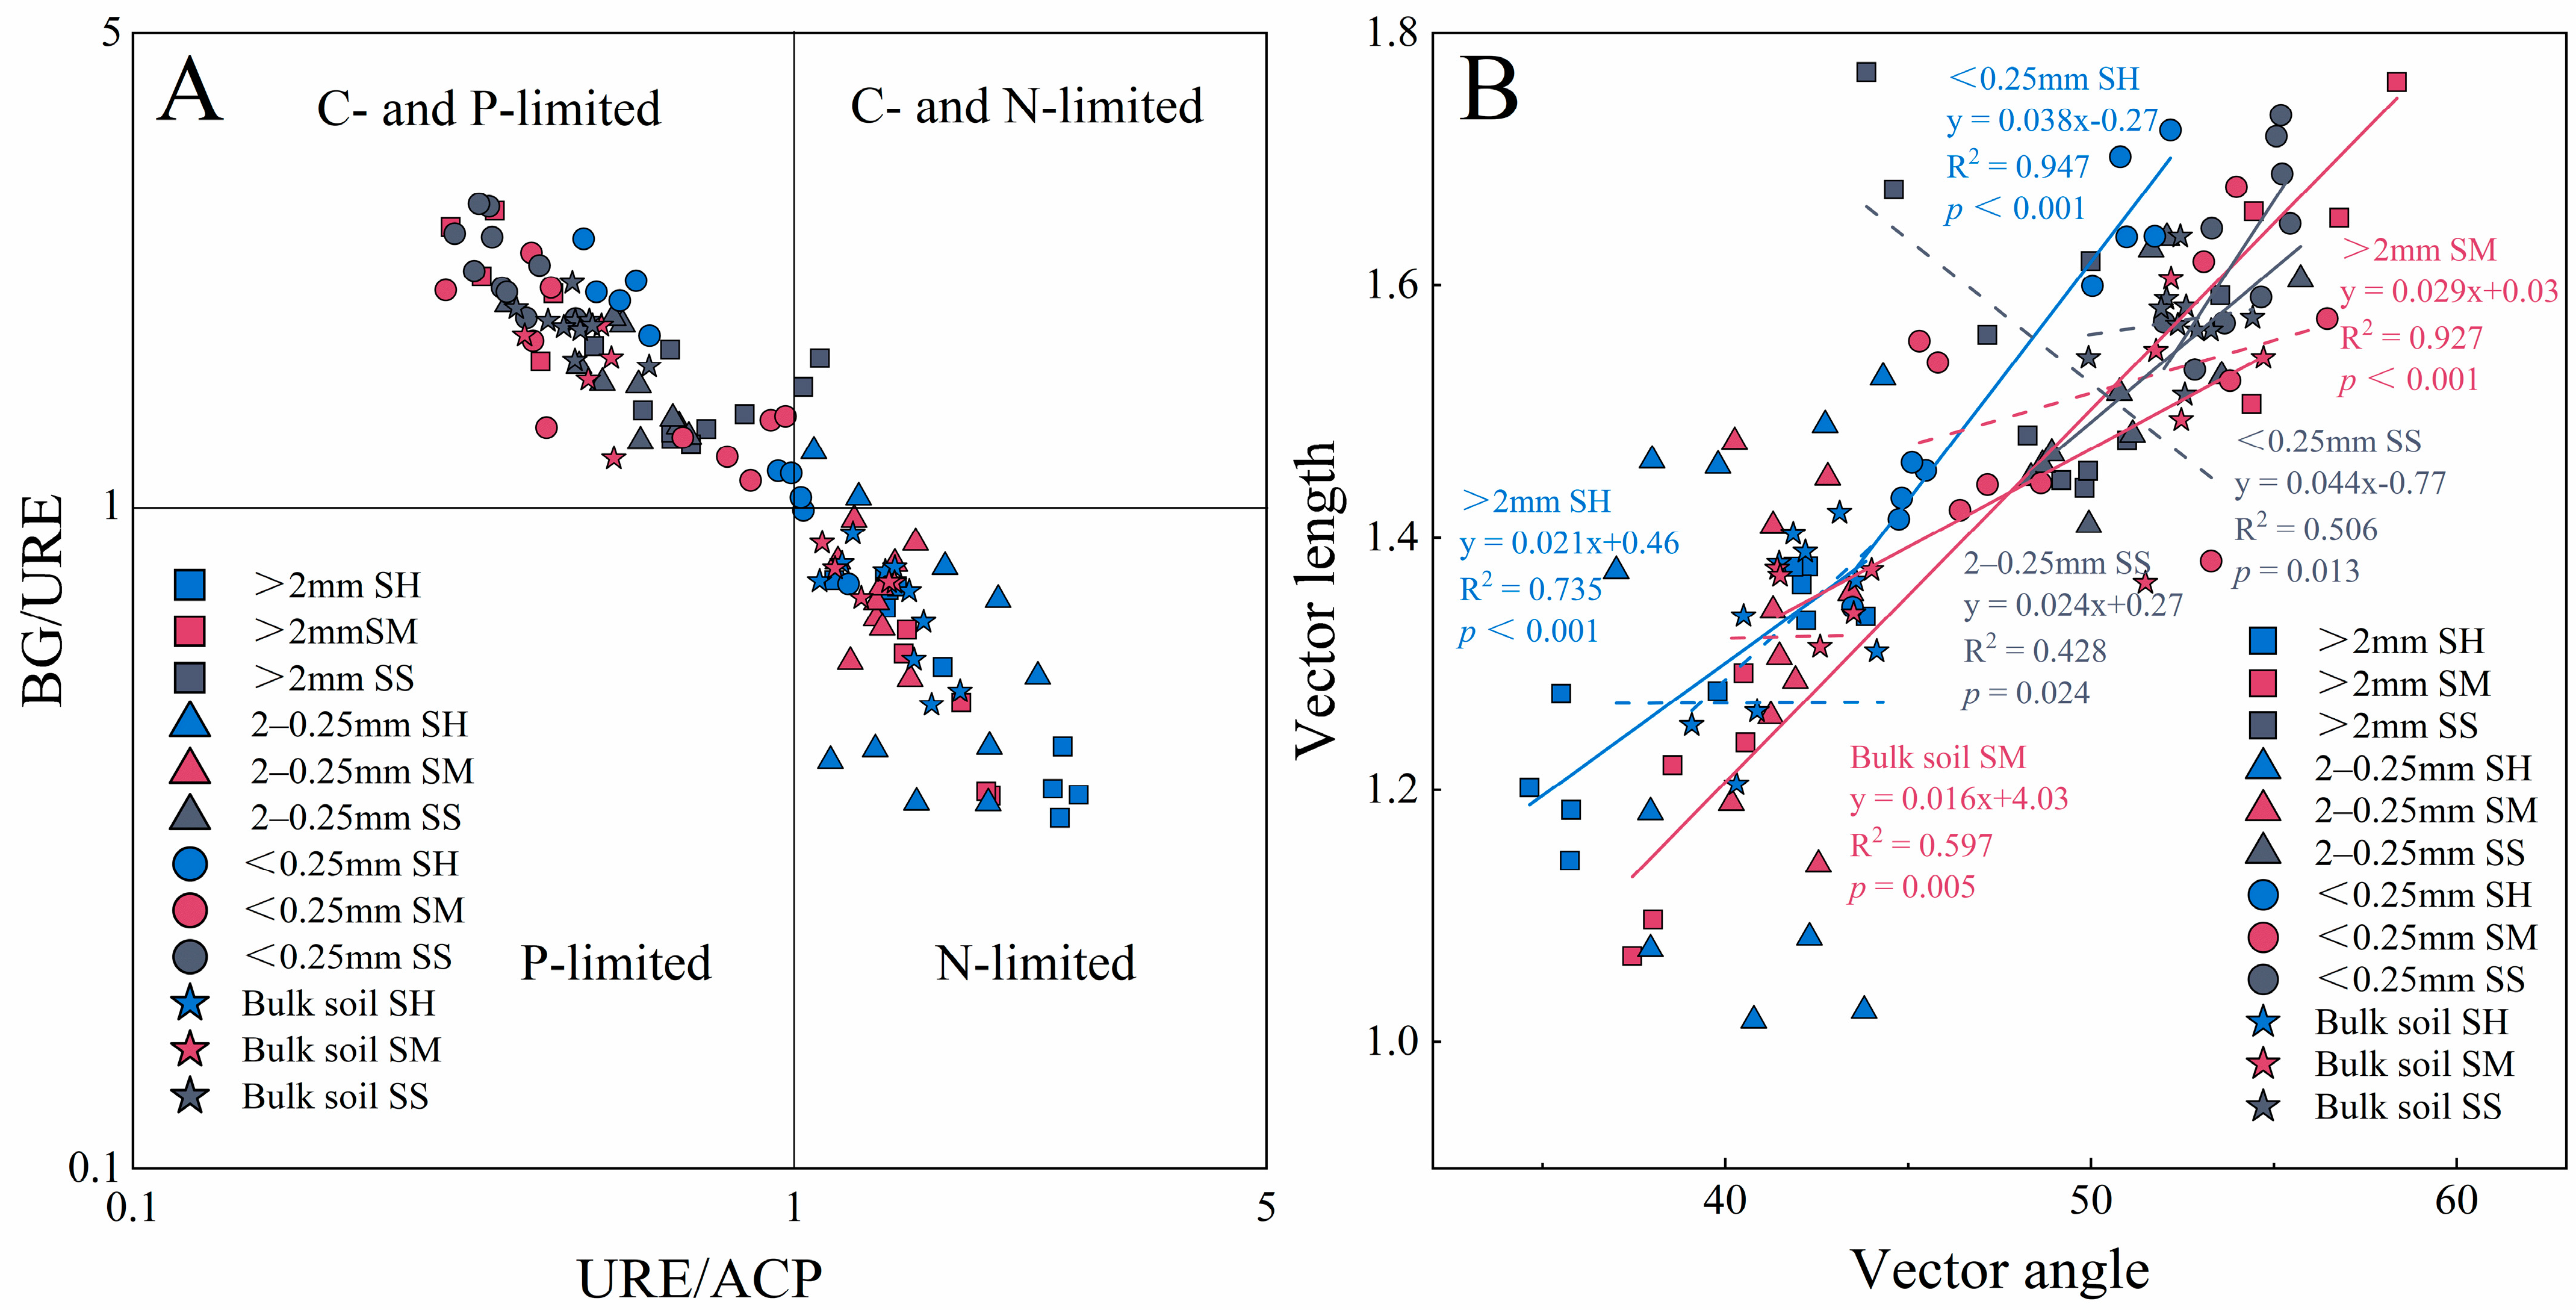
3.3. Enzyme Stoichiometric Characteristics

In the bulk soil, BG/URE > 1 and greater VL indicated a significant carbon limitation for soil microorganisms in the pure stands. In contrast, the SH stands did not show such constrains in carbon, while in the SM stands, these parameters were influenced by soil depth (Figure 5A,B). Moreover, the URE/ACP and VA values suggested that the microbes in the pure stand soil were P-restricted, while those in the SH mixed stands were N-limited, and those in the SM mixed stands were limited by both N and P in the two soil layers (Figure 5A and Figure S1B). The microbial metabolism in all soil aggregates in the pure stands was C- and P-limited. Furthermore, practically all micro aggregates in the three stands showed strong microbial C and P constraints. In addition, almost all large and small aggregates in the SH and SM mixed plantation soils were affected by N limitation (Figure 5). The results suggest a roughly positive relationship between VA and VL across both bulk soil and aggregates in all three stands (Figure 5B). Additionally, both VL and VA in the aggregates were generally positively correlated with those in the bulk soil (Figure S1C,D).

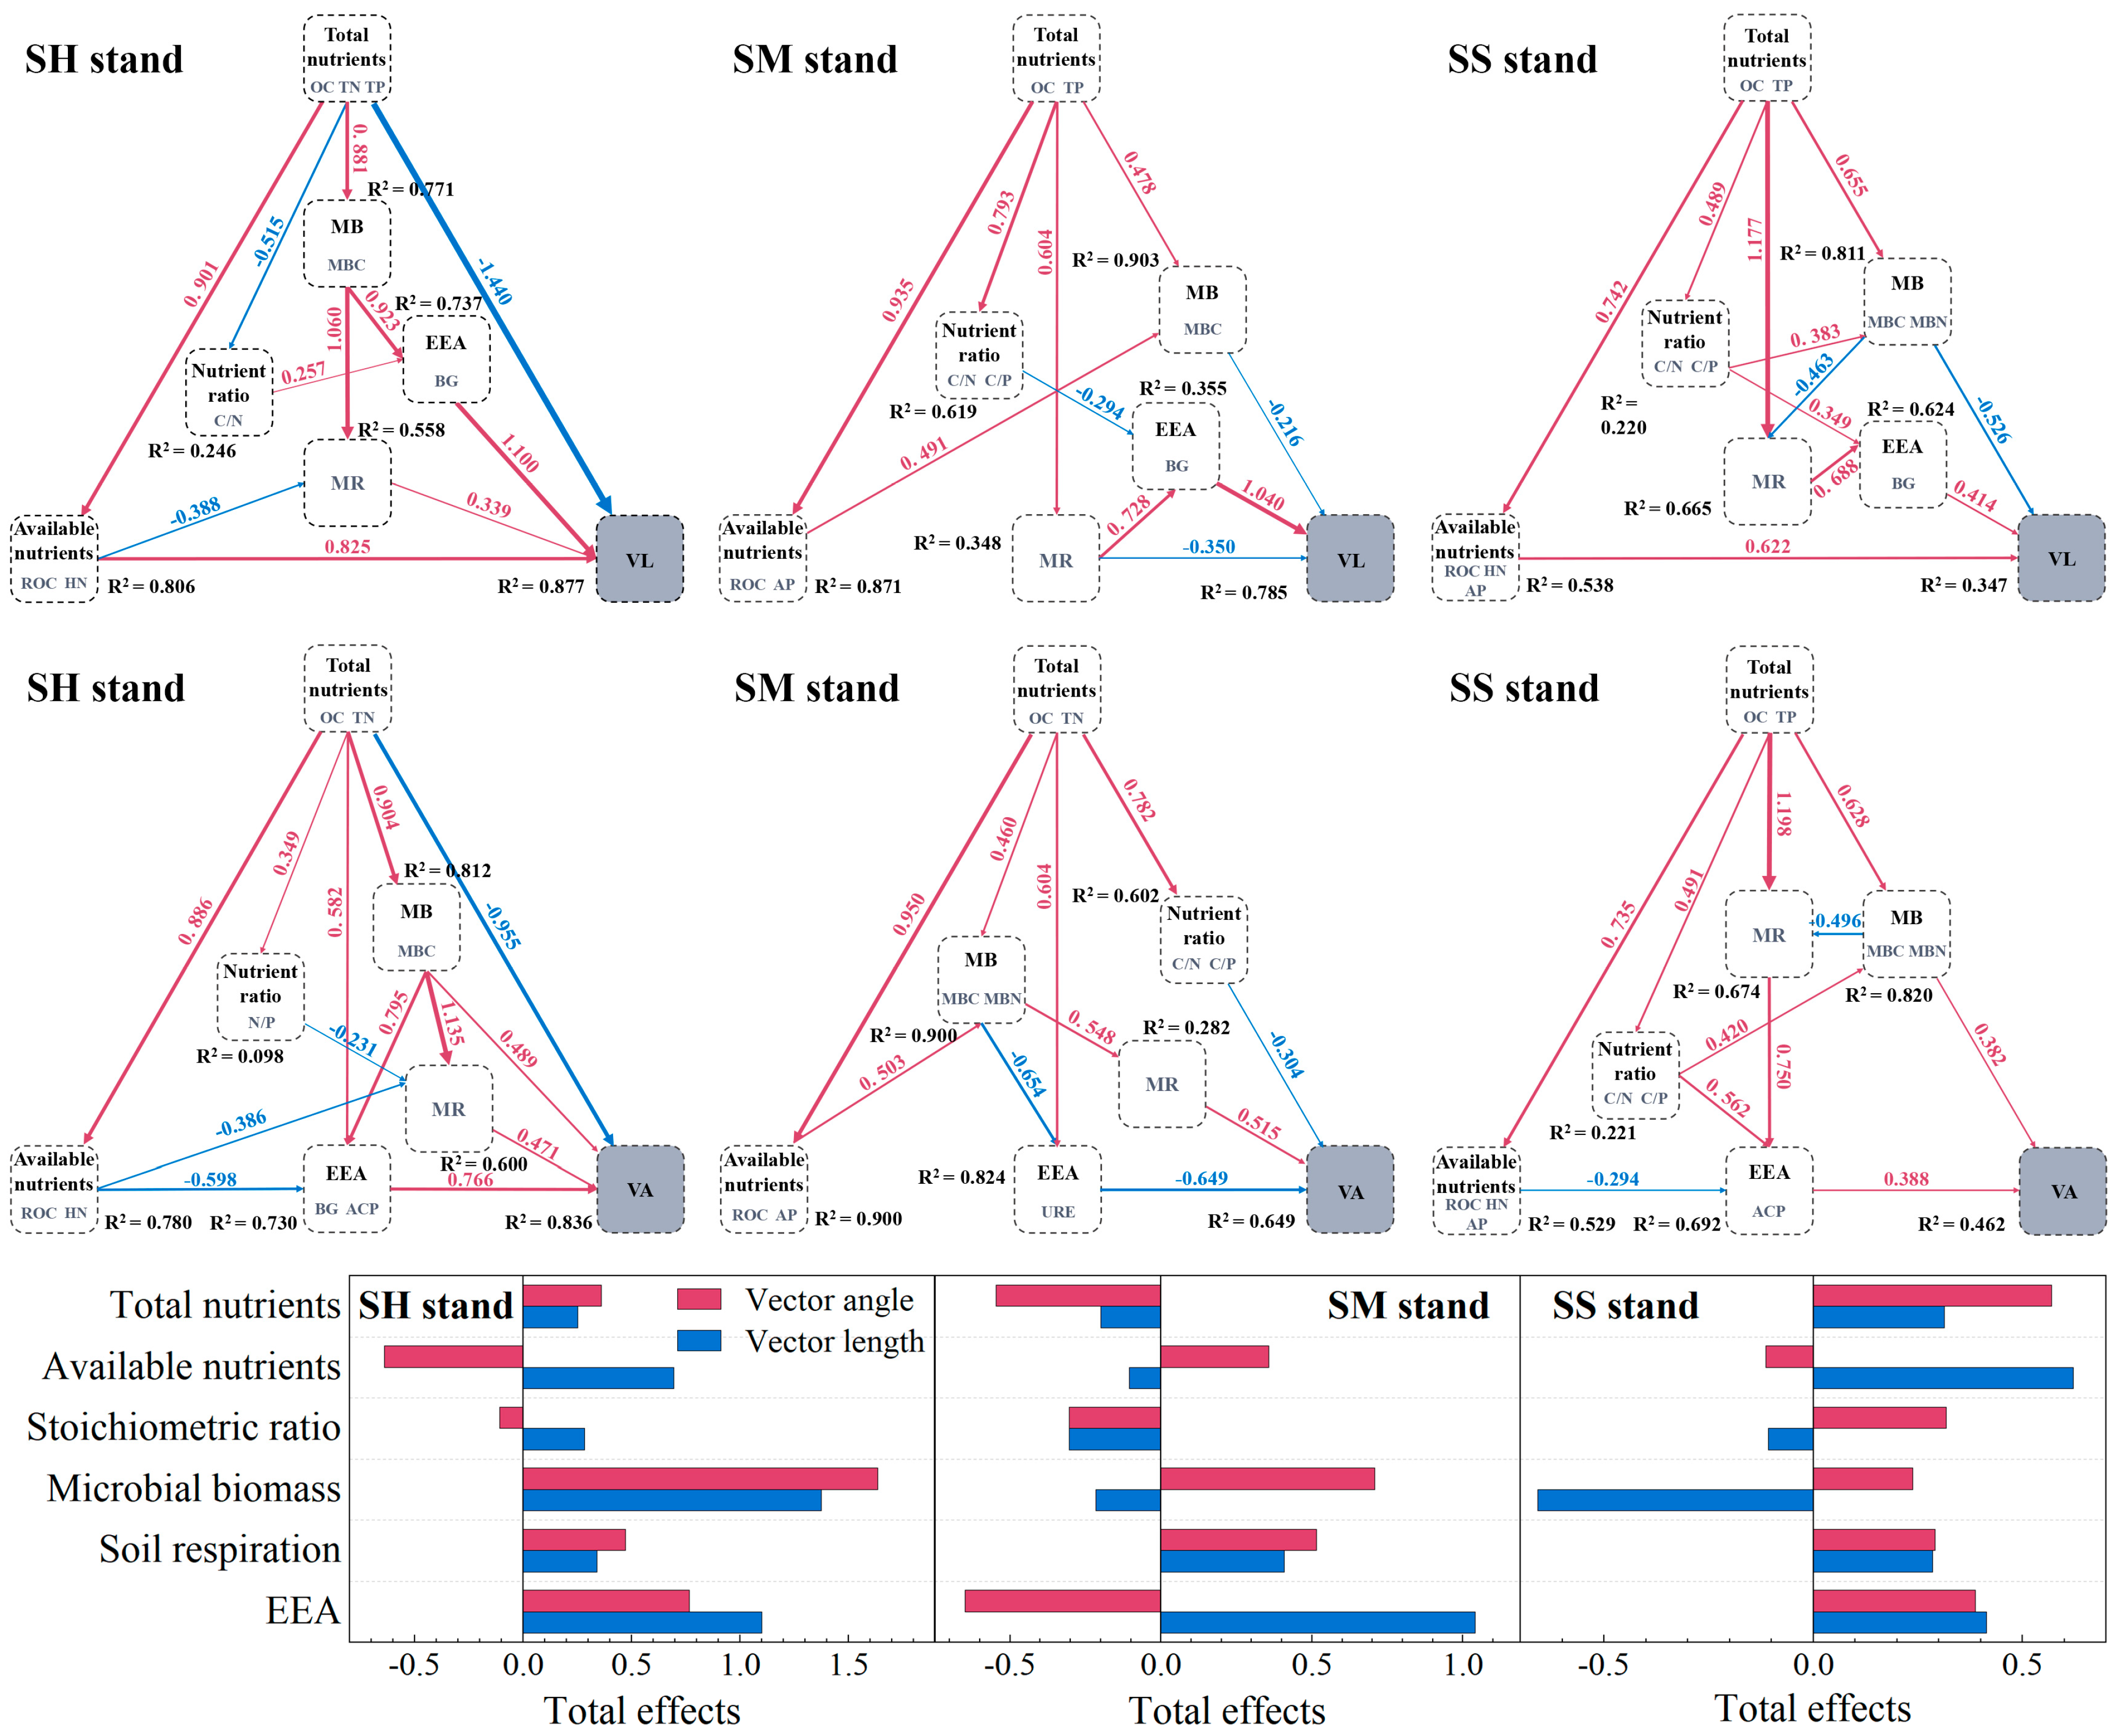
3.4. Resource Limitations and Influencing Factors of Microbial Metabolism

In the pure stands, the combined effects of the two preceding axes in the redundancy analysis accounted for 60.38% of the total variance related to microbial resource limitation, with values of 63.28% and 46.89% in the SH and SM stands, respectively (Figure 6). Soil OC in the SS stands was 37.20% and was the most influential factor (Figure 6C). The available soil nutrients ROC, HN, and AP in the SH stands collectively explained 34.90% of the microbial metabolic limitation and were the most influential factors, followed by OC and TP, which together accounted for 24.20% (Figure 6A). In the SM stands, ROC, TP, and TN significantly influenced the nutrient limitation of soil microbial metabolism and explained 45.20% of the variation (Figure 6B).
According to the PLS-SEM results, the soil microbial metabolic carbon limitation (VL) and the nitrogen and phosphorus limitation (VA) in all three plantation stands were jointly regulated by multiple factors (Figure 7). The microbial resource limitation was directly influenced by MB, MR, and EEAs in almost every stand. Among the influencing factors, the indicators that had the highest effect on C limitation in the SH, SM, and SS stands were MB, EEAs, and available elemental content, respectively. In contrast, the factors with the highest impact on N and P elemental deficiency were MB and total soil elements, respectively (Figure 7). In addition, the soil elements and their stoichiometric ratios in different stands indirectly influenced microbial resource limitation through the differential regulation of MB, MR, and EEAs. Among the three stands, soil carbon, nutrients, and microbial factors explained much more of the microbial metabolic carbon limitation in the SH (R2 = 0.877) and SM (R2 = 0.785) stands than in the SS stands (R2 = 0.347). The explained variance for the N and P limitation in the SH (R2 = 0.836) and SM (R2 = 0.649) stands was also markedly larger compared to that calculated for the pure plantation stands (R2 = 0.462).

4. Discussion

4.1. Mixed Plantations Improve Soil Aggregate Structure and Stability as Well as Soil Nutrient Content

This research demonstrates that the establishment of mixed stands has positive influences on soil physico-chemical traits. Soil aggregate structure and stability are vital indices reflecting soil quality. In general, large aggregates provide greater resistance to damage and a larger pore structure to the soil, while micro aggregates exhibit more transportable characteristics [49,50]. This means that a higher proportion of micro aggregates contributes to soil instability, thereby escalating the risk of water erosion [51], which is extremely detrimental to the ecological protection of subtropical plantation forests. One study demonstrated that the transformation of soil micro aggregates (<0.25 mm) to large and small aggregates during ecological restoration improves soil stability [52]. This study suggests that mixed plantations clearly promote the formation of large aggregates, while reducing the proportion of micro aggregates, thus improving the MWD and GMD (Table 2). Aggregate establishment is strongly linked to soil organic matter content. Because soil OC serves as an essential cementing factor for soil aggregates, alkenes C, alkanes C, aromatic C can drive the establishment of organic–mineral compounds and enhance the hydrophobicity of aggregates during the formation of >0.25 mm aggregates [53]. We found that both OC and ROC components of the mixed stand soils were significantly larger compared to those of the pure stand soils. This may have expedited the aggregation of soil particles and enhanced the large aggregate proportions. In this study, the surface soil BD was significantly reduced in mixed stands (Table 1). This was attributed to the rise in the soil large-aggregate percentage, which led to an increase in porosity, water holding capacity, and permeability of the soil, thereby decreasing the erosive effects of surface runoff [54,55]. This was evidenced by the significantly higher SWC in the mixed stands compared to the pure stands (Table 2).
Mixed planting was shown to significantly benefit soil OC, TN, TP, and the content of available nutrients [6,56]. Our study confirmed these results, showing an overall enhancement in OC and nutrients in all classes of aggregates in the mixed stands (Figure 2). In mixed stands, soil nutrient content is improved through several mechanisms. It was found that mixed coniferous and broadleaf tree plantations improved the litter mass [57]. Meanwhile, the intermingling of leaf litter from various tree species facilitates the decomposition of litter and the release of nutrients [58]. Moreover, root litter and secretions [59] and the transport of soil animals [60] have a noteworthy impact on soil OC and nutrients. In this study, the significant increase in litter biomass may be an important factor explaining the enhancement in soil OC and nutrients in the two mixed stands (Table 1). In addition, elemental stoichiometric ratios reflect the relative dynamics of soil nutrients. The increase in the C/N ratio in the 10–20 cm bulk soil in the SH and SM stands was due to a significant increase in soil OC (Figure 2G). Although in the SH stands there was a significantly increase in both soil OC and TP, the substantial increase in soil C/P demonstrated that in the SH stands, soil carbon sequestration was promoted (Figure 2H). Related surveys displayed that mixed species considerably alter the soil carbon mineralization rates by changing soil microbial communities and structures [61]. Moreover, Zhang et al. found that mixed cultivation significantly enhanced soil microbial metabolic activity, and an increase in microbial carbon use efficiency was a critical factor in promoting SOC accumulation [62]. The N/P ratio is examined an index of soil N and P nutrient limitation. The impact of mixed stands on soil N and P mineralization was shown to be species-dependent and strongly regulated by nutrient release from leaf and root litter and input from root secretions [63,64]. This explains the variations in the soil N/P ratios among the different forest stands in this study. However, this study indicates that the effect of mixed forests on the N/P ratio is regulated by the soil layers (Figure 2I). Therefore, further studies on the chemical elements in different soil layers may improve our understanding of organic carbon and nutrient cycling.

4.2. Soil Aggregates Drive Changes in Microbial Resource Limitations in Mixed Stands

Soil microorganisms respond differently to changes in soil resources due to changes in vegetation variety and the quality of organic matter. When a particular soil nutrient is scarce, microorganisms prefer to produce extracellular enzymes associated with that nutrient for resource acquisition [13]. Enzymatic catalysis facilitates the breakdown of complex organic compounds in the soil, transforming them into smaller molecular compounds that are more readily assimilated [12]. In this study, C and P were the joint restriction elements for soil microorganisms in pure plantations, as manifested by the higher BG and ACP activities (Figure 4) and their stoichiometric ratio (Figure 5A), great vector length (Figure S1A), and a vector angle greater than 45° (Figure S1B). These results are consistent with those showing that overall carbon and phosphorus deficiencies affect soil microbes in subtropical forests [21,65]. Notably, the SH and SM mixed stands exhibited relative N deficiencies affecting soil microbe metabolism, as evidenced by the high URE/ACP ratio and low vector angle (<45°) (Figure S1). This finding supports our hypothesis that mixed stands alter nutrient limitations influencing soil microbial metabolism. This phenomenon may stem from the fact that broadleaf species in mixed stands are associated with increased N competition between plants and microorganisms, as broadleaf species require more N for photosynthesis [66]. This supports the sustainability and ecological function of Chinese fir plantations, especially in the current environment of global N deposition, where increased microbial access to N may mitigate the adverse ecological impacts caused by soil N saturation [67,68].
In this study, soil aggregates were shown to contribute to the microbial resource limitation determined in the different stands. In fact, a smaller size and a larger specific surface area of micro aggregates support the immobilization and activity of more microbes [69]. This explains the higher MBC, MBN, MR, and EEAs in micro aggregates in our study (Figure 3 and Figure 4). We found that mixed stands significantly altered the resource limitation of microbial metabolism in large and small aggregates from C- and P-limited to N-limited, compared to pure stands (Figure 5A and Figure S1A,B). One legitimate reason is that the compartmentalizing effect of different aggregates on disparate species of microbial communities leads to variations in the metabolic functions of microorganisms in different aggregates [70,71]. It is reported in the literature that large soil aggregates (>0.25 mm) support the survival of copiotrophic ureolytic microbes, which produce urease [72]. A study found that the enzyme activity related to carbon decomposition increases with a decreasing aggregate size [73]. It was also shown that phosphatase activity was higher in micro aggregates because micro aggregates facilitate the aggregation of bacteria associated with phosphorus-enriched soil [74]. Our research indicated that the mixed forests with Chinese fir and broadleaf species promoted aggregate binding, which may have led to an increase in microbial functional units biased toward N acquisition, thereby causing the bulk soil to exhibit nitrogen resource limitation for microbial metabolism. Conversely, the proportion of soil micro aggregates in the pure stands was as high as 45.5%, which led to the phenomenon that microbial metabolism of the bulk soil was constrained by C and P (Table 2, Figure 5). This research also confirmed the significant correlation of bulk soil VL and VA with large aggregates and micro aggregates in mixed stands. In contrast, soil micro aggregates and large aggregates significantly affected whole-soil VL and VA, respectively, in pure stands (Figure S1C,D). Additionally, there may be a general positive correlation between VL and VA, which explains why microbial metabolism was always coregulated by C and P (Figure S1D). On the other hand, the biomass and enzyme production of soil microbes are largely driven by resource distribution in aggregates [75]. In this research, a redundancy analysis revealed that the OC and nutrient distribution in soil micro aggregates in all three stands tended to increase in the direction of VL and VA, suggesting that the OC and nutrient distribution in micro aggregates may promote a microbial C and P restriction; in contrast, the OC and nutrient distribution showed an opposite trend in large and small aggregates (Figure 6). In essence, the resource limitation for soil microbes is mainly determined by the amount of the resources to which the microbes have access [13]. However, in complex soil environments, microbial communities attached to soil aggregates depend not only on the resources in the aggregates for their survival but also on other factors, such as precipitation [76], plant root litter and secretions [59], and soil animal activity [60], which may lead to the circulation of resources between aggregates of different sizes and consequently affect the metabolic activities of microorganisms. Therefore, the influence of various complex ecological elements on soil microorganisms should be extensively considered in future research.

4.3. Differences and Similarities in Regulatory Pathways of Microbial Resource Limitation in Different Plantations

Generally, soil microbial nutrient restriction is regulated by soil OC, nutrient contents, their availability, and element stoichiometric ratios [20,21]. This was verified in our study. Specifically, the total amount and availability of soil elements explain most of the variation in microbial resource limitations. Among them, OC, TP, and ROC significantly affected the soil microbial resource limitations in all three stands, while TN had a significant impact on limiting soil microbial resources only in the SM stands (Figure 6). It was shown that the elemental stoichiometry ratio is an essential factor in regulating soil microbial resource limitation [77]. However, the elemental stoichiometric ratios explained only a small part of the microbial resource limitation, much less than the content of C, N, and P elements and their availability (Figure 6). Furthermore, there are few studies on how soil resources specifically affect microbial nutrient limitations. Therefore, we attempted to explain this by conducting PLS-SEM. The results showed that soil carbon, soil nutrients, and their stoichiometric ratios are, mostly indirectly, regulated by MB, MR, and EEAs, rather than directly influencing microbial carbon, nitrogen, and phosphorus limitations (Figure 7). MB, MR, and EEAs together explained the maximum changes in microbial C, N, and P constraints in the mixed stands and pure stands, directly controlling the nutrient limit for soil microbes. According to the total effects, MB was the primary index that determined the limitation of microbial resources (Figure 7). This supports the view of Qiu et al., who indicated that extracellular ecological enzyme stoichiometry is primarily influenced by MBC and MBN [78]. This study found that the total content of soil nutrients was consistently and significantly positively correlated with microbial biomass, indicating that increased soil organic carbon and nutrients promoted increased microbial biomass (Figure 7). Cui et al. asserted that nutrient stoichiometric ratios and availability mediate soil microbial C and P constraints [79]. This supports the result that both C/N and C/P ratios directly influenced extracellular enzyme production mediating microbial carbon limitation (Figure 7). Additionally, PLS-SEM showed that MR played a pivotal part in reconciling the soil C, N, and P resources with MB or EEAs (Figure 7). MR is a crucial index of accompanying microbial decomposition activity, corresponding to the degree of microbial activity [80]. Our results indicate that MR was positively regulated by total soil elements and that a higher MR intensity enhanced microbial resource limitations (Figure 7). Moreover, soil C, N, and P and their stoichiometric ratios, combined with MB, MR, and EEAs, explained most changes (R2 > 0.6) in soil microbial nutrient limitation in the mixed plantations. In contrast, they explained less of these variations in the pure stands (R2 < 0.5). This suggests that the microbial metabolic resource limitation in the pure stands was likely influenced by other parameters, such as soil pH, water content, or temperature.

5. Conclusions

In light of the sensitivity and functionality of microbial metabolism in reflecting ecosystem changes, this study explored the effect of elemental restriction on microbial responsiveness to changes in stand type and its associated soil elemental content. The mixing of the broadleaf species Michelia macclurei with Mytilaria laosensis drove a transition in microbial metabolic resource limitation from C and P to N in both large and small soil aggregates. In contrast, the soil micro aggregates were relatively deficient in C and P for microbial metabolism across the three stands. The findings of this study indicate that mixed plantations primarily influence the resource-limiting elements involved in microbial metabolism by altering the percentage of several aggregates and the distribution of resources. Specifically, mixed forests comprising Chinese fir and Michelia macclurei increased the levels of soil nutrients and facilitated the conversion of micro aggregates to large aggregates, thereby exerting a positive effect on microbial growth and metabolism. Additionally, further characterization of the constitution and function of soil microbial communities is necessary to elucidate the mechanisms by which mixed plantations influence soil ecology. In conclusion, our study suggests that multi-species, mixed planting represents a rational measure to mitigate soil nutrient degradation and promote the ecological sustainability of plantations in the future.

Supplementary Materials

The following supporting information can be downloaded at: https://www.mdpi.com/article/10.3390/f15040724/s1, Table S1: Effects of stand and aggregates and their interactions on soil organic C, N, and P and their stoichiometric ratios. Figure S1: Effect of different stands on vector length (A), vector angle (B) and their correlation. Pearson’s correlation analysis for aggregates and total soil with respect to vector length (C) and vector angle (D). Different lowercase letters indicate significant differences among different stand types for the same aggregate size and soil layer (p < 0.05). Different capital letters indicate significant differences among different aggregates in the same stand type and soil layer (p < 0.05). Solid and dashed lines represent the significant and nonsignificant linear relationship between VA and VL (p < 0.05), respectively. The symbols *, ** and *** indicate significance at the 0.05, 0.01 and 0.001 levels, respectively.

Author Contributions

Conceptualization, H.Z.; methodology, H.Z. and S.W.; software, Y.H. (Yongzhen Huang); validation, H.Z. and Y.H. (Yongzhen Huang); formal analysis, S.Y.; investigation, Y.L.; resources, S.Y.; data curation, Y.H. (Yongzhen Huang), C.J., Y.C. and R.F.; writing—original draft preparation, H.Z.; writing—review and editing, S.W. and S.Y.; visualization, H.Z.; supervision, Y.H. (Yaqin He); project administration, S.Y.; funding acquisition, S.Y. All authors have read and agreed to the published version of the manuscript.

Funding

This research was funded by the National Natural Science Foundation of China, grant numbers 32260382 and 31460196.

Data Availability Statement

The original contributions presented in the study are included in the article/Supplementary Materials; further inquiries can be directed to the corresponding author.

Acknowledgments

The authors appreciate the editor and reviewers for providing helpful feedback to improve this paper.

Conflicts of Interest

The authors declare no conflicts of interest.

References

  1. Paul, E.A. The nature and dynamics of soil organic matter: Plant inputs, microbial transformations, and organic matter stabilization. Soil Biol. Biochem. 2016, 98, 109–126. [Google Scholar] [CrossRef]
  2. Rabot, E.; Wiesmeier, M.; Schluter, S.; Vogel, H.J. Soil structure as an indicator of soil functions: A review. Geoderma 2018, 314, 122–137. [Google Scholar] [CrossRef]
  3. Zhou, B.; Peng, D.; Zhao, Q.X.; Yangnan, S.Y.; Yang, S.Q.; Yang, F.; Qu, G.Y.; Tang, W.W.; Ou, J.P.; Xiang, W.H.; et al. Improvements in timber production of Chinese fir (Cunninghamia lanceolata) per unit forest area in China via tree breeding: Status and challenges. Dendrobiology 2020, 83, 43–51. [Google Scholar] [CrossRef]
  4. Farooq, T.H.; Yan, W.; Rashid, M.H.U.; Tigabu, M.; Gilani, M.M.; Zou, X.H.; Wu, P.F. Chinese fir (Cunninghamia Lanceolata) a green gold of China with continues decline in its productivity over the successive rotations: A review. Appl. Ecol. Environ. Res. 2019, 17, 11055–11067. [Google Scholar] [CrossRef]
  5. Guan, F.Y.; Tang, X.L.; Fan, S.H.; Zhao, J.C.; Peng, C. Changes in soil carbon and nitrogen stocks followed the conversion from secondary forest to Chinese fir and Moso bamboo plantations. Catena 2015, 133, 455–460. [Google Scholar] [CrossRef]
  6. Zhou, L.; Sun, Y.J.; Saeed, S.; Zhang, B.; Luo, M. The difference of soil properties between pure and mixed Chinese fir (Cunninghamia lanceolata) plantations depends on tree species. Glob. Ecol. Conserv. 2020, 22, e01009. [Google Scholar] [CrossRef]
  7. Feng, Y.; Schmid, B.; Loreau, M.; Forrester, D.I.; Fei, S.; Zhu, J.; Tang, Z.; Zhu, J.; Hong, P.; Ji, C.; et al. Multispecies forest plantations outyield monocultures across a broad range of conditions. Science 2022, 376, 865–868. [Google Scholar] [CrossRef] [PubMed]
  8. Wang, S.Q.; Huang, Y.Z.; Ye, S.M. Distribution of organic carbon and nutrients in soil aggregates under different stand types of Cunninghamia lanceolata in southern Guangxi of China. Soil Sci. Plant Nutr. 2021, 67, 427–438. [Google Scholar] [CrossRef]
  9. He, Y.Q.; Zhang, Q.C.; Wang, S.Q.; Jiang, C.Y.; Lan, Y.H.; Zhang, H.; Ye, S.M. Mixed plantations induce more soil macroaggregate formation and facilitate soil nitrogen accumulation. Forests 2023, 14, 735. [Google Scholar] [CrossRef]
  10. Holden, S.R.; Treseder, K.K. A meta-analysis of soil microbial biomass responses to forest disturbances. Front. Microbiol. 2013, 4, 163. [Google Scholar] [CrossRef]
  11. Prescott, C.E.; Grayston, S.J. Tree species influence on microbial communities in litter and soil: Current knowledge and research needs. For. Ecol. Manag. 2013, 309, 19–27. [Google Scholar] [CrossRef]
  12. Calabrese, S.; Mohanty, B.P.; Malik, A.A. Soil microorganisms regulate extracellular enzyme production to maximize their growth rate. Biogeochemistry 2022, 158, 303–312. [Google Scholar] [CrossRef]
  13. Zheng, H.F.; Vesterdal, L.; Schmidt, I.K.; Rousk, J. Ecoenzymatic stoichiometry can reflect microbial resource limitation, substrate quality, or both in forest soils. Soil Biol. Biochem. 2022, 167, 108613. [Google Scholar] [CrossRef]
  14. Sinsabaugh, R.L.; Belnap, J.; Findlay, S.G.; Shah, J.J.F.; Hill, B.H.; Kuehn, K.A.; Kuske, C.R.; Litvak, M.E.; Martinez, N.G.; Moorhead, D.L.; et al. Extracellular enzyme kinetics scale with resource availability. Biogeochemistry 2014, 121, 287–304. [Google Scholar] [CrossRef]
  15. Wang, S.Q.; Li, T.X.; Zheng, Z.C. Effects of tea plantation age on soil aggregate-associated C- and N-cycling enzyme activities in the hilly areas of Western Sichuan, China. Catena 2018, 171, 145–153. [Google Scholar] [CrossRef]
  16. Xue, L.; Sun, B.; Yang, Y.; Jin, B.; Zhuang, G.; Bai, Z.; Zhuang, X. Efficiency and mechanism of reducing ammonia volatilization in alkaline farmland soil using Bacillus amyloliquefaciens biofertilizer. Environ. Res. 2021, 202, 111672. [Google Scholar] [CrossRef] [PubMed]
  17. Darch, T.; Blackwell, M.S.; Chadwick, D.; Haygarth, P.M.; Hawkins, J.M.; Turner, B.L. Assessment of bioavailable organic phosphorus in tropical forest soils by organic acid extraction and phosphatase hydrolysis. Geoderma 2016, 284, 93–102. [Google Scholar] [CrossRef] [PubMed]
  18. Sinsabaugh, R.L.; Lauber, C.L.; Weintraub, M.N.; Ahmed, B.; Allison, S.D.; Crenshaw, C.; Contosta, A.R.; Cusack, D.; Frey, S.; Gallo, M.E.; et al. Stoichiometry of soil enzyme activity at global scale. Ecol. Lett. 2008, 11, 1252–1264. [Google Scholar] [CrossRef] [PubMed]
  19. Xu, Z.W.; Yu, G.R.; Zhang, X.Y.; He, N.P.; Wang, Q.F.; Wang, S.Z.; Wang, R.L.; Zhao, N.; Jia, Y.L.; Wang, C.Y. Soil enzyme activity and stoichiometry in forest ecosystems along the North-South Transect in eastern China (NSTEC). Soil Biol. Biochem. 2017, 104, 152–163. [Google Scholar] [CrossRef]
  20. Waring, B.G.; Weintraub, S.R.; Sinsabaugh, R.L. Ecoenzymatic stoichiometry of microbial nutrient acquisition in tropical soils. Biogeochemistry 2013, 117, 101–113. [Google Scholar] [CrossRef]
  21. Chen, X.; Feng, J.; Ding, Z.; Tang, M.; Zhu, B. Changes in soil total, microbial and enzymatic C-N-P contents and stoichiometry with depth and latitude in forest ecosystems. Sci. Total Environ. 2022, 816, 151583. [Google Scholar] [CrossRef] [PubMed]
  22. Soong, J.L.; Fuchslueger, L.; Maranon-Jimenez, S.; Torn, M.S.; Janssens, I.A.; Penuelas, J.; Richter, A. Microbial carbon limitation: The need for integrating microorganisms into our understanding of ecosystem carbon cycling. Glob. Chang. Biol. 2019, 26, 1953–1961. [Google Scholar] [CrossRef] [PubMed]
  23. Cleveland, C.C.; Townsend, A.R.; Schmidt, S.K. Phosphorus limitation of microbial processes in moist tropical forests: Evidence from short-term laboratory incubations and field studies. Ecosystems 2002, 5, 680–691. [Google Scholar] [CrossRef]
  24. Amézketa, E. Soil aggregate stability: A review. J. Sustain. Agric. 1999, 14, 83–151. [Google Scholar] [CrossRef]
  25. Totsche, K.U.; Amelung, W.; Gerzabek, M.H.; Guggenberger, G.; Klumpp, E.; Knief, C.; Lehndorff, E.; Mikutta, R.; Peth, S.; Prechtel, A.; et al. Microaggregates in soils. J. Plant Nutr. Soil Sci. 2017, 181, 104–136. [Google Scholar] [CrossRef]
  26. Xu, H.D.; Yuan, H.J.; Yu, M.K.; Cheng, X.R. Large macroaggregate properties are sensitive to the conversion of pure plantation to uneven-aged mixed plantations. Catena 2020, 194, 104724. [Google Scholar] [CrossRef]
  27. Han, S.; Delgado-Baquerizo, M.; Luo, X.S.; Liu, Y.R.; Van Nostrand, J.D.; Chen, W.L.; Zhou, J.Z.; Huang, Q.Y. Soil aggregate size-dependent relationships between microbial functional diversity and multifunctionality. Soil Biol. Biochem. 2021, 154, 108143. [Google Scholar] [CrossRef]
  28. Zhang, H.; Li, X.; Wang, S.Q.; Jiang, C.Y.; Cui, Y.H.; Fan, R.Y.; Lan, Y.H.; Zhang, Q.C.; Ye, S.M. Tree-litter-soil system C:N:P stoichiometry and tree organ homeostasis in mixed and pure Chinese fir stands in south subtropical China. Front. For. Glob. Chang. 2024, 7, 1293439. [Google Scholar] [CrossRef]
  29. Bach, E.M.; Hofmockel, K.S. Soil aggregate isolation method affects measures of intra-aggregate extracellular enzyme activity. Soil Biol. Biochem. 2014, 69, 54–62. [Google Scholar] [CrossRef]
  30. John, B.; Yamashita, T.; Ludwig, B.; Flessa, H. Storage of organic carbon in aggregate and density fractions of silty soils under different types of land use. Geoderma 2005, 128, 63–79. [Google Scholar] [CrossRef]
  31. Nelson, D.W.; Sommers, L.E. Total carbon, organic carbon, and organic matter. Methods Soil Anal. Part 3 Chem. Methods 1996, 5, 961–1010. [Google Scholar]
  32. Bremner, J.M. Nitrogen-total. Methods Soil Anal. Part. 3 Chem. Methods 1996, 5, 1085–1121. [Google Scholar]
  33. Bo, F.J.; Zhang, Y.X.; Chen, H.Y.H.; Wang, P.G.; Ren, X.M.; Guo, J.P. The C:N:P stoichiometry of planted and natural larix principis-rupprechtii stands along altitudinal gradients on the Loess Plateau, China. Forests 2020, 11, 363. [Google Scholar] [CrossRef]
  34. Tirol-Padre, A.; Ladha, J.K. Assessing the reliability of permanganate-oxidizable carbon as an index of soil labile carbon. Soil Sci. Soc. Am. J. 2004, 68, 969–978. [Google Scholar] [CrossRef]
  35. Roberts, T.L.; Ross, W.J.; Norman, R.J.; Slaton, N.A.; Wilson, C.E. Predicting nitrogen fertilizer needs for rice in Arkansas using alkaline hydrolyzable- nitrogen. Soil Sci. Soc. Am. J. 2011, 75, 1161–1171. [Google Scholar] [CrossRef]
  36. Bao, S. Soil Agrochemical Analysis; China Agricultural Press: Beijing, China, 2000. [Google Scholar]
  37. Vance, E.D.; Brggek, P.C.; Jenkinson, D.S. An extraction method for measuring soil microbial biomass C. Soil Biol. Biochem. 1987, 19, 703–707. [Google Scholar] [CrossRef]
  38. Brookes, P.C.; Landman, A.; Pruden, G.; Jenkinson, D.S. Chloroform fumigation and the release of soil nitrogen: A rapid direct extraction method to measure microbial biomass nitrogen in soil. Soil Biol. Biochem. 1985, 17, 837–842. [Google Scholar] [CrossRef]
  39. Dahlin, S.; Witter, E.; Martensson, A.; Turner, A.; Baath, E. Where’s the limit? Changes in the microbiological properties of agricultural soils at low levels of metal contamination. Soil Biol. Biochem. 1997, 29, 1405–1415. [Google Scholar] [CrossRef]
  40. Tabatabai, M.; Weaver, R. Methods of Soil: Analysis Microbiological and Biochemical Properties; Part 2; Soil Science Society of America: Madison, WI, USA, 1994. [Google Scholar]
  41. Gianfreda, L.; Sannino, F.; Ortega, N.; Nannipieri, P. Activity of free and immobilized urease in soil: Effects of pesticides. Soil Biol. Biochem. 1994, 26, 777–784. [Google Scholar] [CrossRef]
  42. Georgea, T.S.; Gregorya, P.J.; Wooda, M.; Reada, D.; Bureshb, R.J. Phosphatase activity and organic acids in the rhizosphere of potential agroforestry species and maize. Soil Biol. Biochem. 2002, 34, 1487–1494. [Google Scholar] [CrossRef]
  43. Zhou, L.H.; Liu, S.S.; Shen, H.H.; Zhao, M.Y.; Xu, L.C.; Xing, A.J.; Fang, J.Y. Soil extracellular enzyme activity and stoichiometry in China’s forests. Funct. Ecol. 2020, 34, 1461–1471. [Google Scholar] [CrossRef]
  44. Liu, M.; Gan, B.; Li, Q.; Xiao, W.; Song, X. Effects of nitrogen and phosphorus addition on soil extracellular enzyme activity and stoichiometry in Chinese fir (Cunninghamia lanceolata) forests. Front. Plant Sci. 2022, 13, 834184. [Google Scholar] [CrossRef]
  45. Urbach, N.; Ahlemann, F. Structural equation modeling in information systems research using partial least squares. J. Inf. Technol. Theory Appl. 2010, 11, 5–40. [Google Scholar]
  46. Diamantopoulos, A.; Siguaw, J.A. Formative versus reflective indicators in organizational measure development: A comparison and empirical illustration. Br. J. Manag. 2006, 17, 263–282. [Google Scholar]
  47. Chin, W.W. The Partial Least Squares Approach to Structural Equation Modeling; Lawrence Erlbaum Associates: Mahwah, NJ, USA, 1998; pp. 1295–1336. [Google Scholar]
  48. Hair, J.F.; Risher, J.J.; Sarstedt, M.; Ringle, C.M. When to use and how to report the results of PLS-SEM. Eur. Bus. Rev. 2019, 31, 2–24. [Google Scholar] [CrossRef]
  49. Zhang, Z.; Wei, C.F.; Xie, D.T.; Gao, M.; Zeng, X.B. Effects of land use patterns on soil aggregate stability in Sichuan Basin, China. Particuology 2008, 6, 157–166. [Google Scholar] [CrossRef]
  50. Regelink, I.C.; Stoof, C.R.; Rousseva, S.; Weng, L.; Lair, G.J.; Kram, P.; Nikolaidis, N.P.; Kercheva, M.; Banwart, S.; Comans, R.N.J. Linkages between aggregate formation, porosity and soil chemical properties. Geoderma 2015, 247–248, 24–37. [Google Scholar] [CrossRef]
  51. Wang, J.; Deng, Y.; Li, D.; Liu, Z.; Wen, L.; Huang, Z.; Jiang, D.; Lu, Y. Soil aggregate stability and its response to overland flow in successive Eucalyptus plantations in subtropical China. Sci. Total Environ. 2022, 807, 151000. [Google Scholar] [CrossRef]
  52. Zhang, W.Z.; Zhou, H.C.; Sheng, R.; Qin, H.L.; Hou, H.J.; Liu, Y.; Chen, A.L.; Chen, C.L.; Wei, W.X. Differences in the nitrous oxide emission and the nitrifier and denitrifier communities among varying aggregate sizes of an arable soil in China. Geoderma 2021, 389, 114970. [Google Scholar] [CrossRef]
  53. Xue, B.; Huang, L.; Huang, Y.A.; Yin, Z.Y.; Li, X.K.; Lu, J.W. Effects of organic carbon and iron oxides on soil aggregate stability under different tillage systems in a rice-rape cropping system. Catena 2019, 177, 1–12. [Google Scholar] [CrossRef]
  54. Ouyang, W.; Wu, Y.Y.; Hao, Z.C.; Zhang, Q.; Bu, Q.W.; Gao, X. Combined impacts of land use and soil property changes on soil erosion in a mollisol area under long-term agricultural development. Sci. Total Environ. 2018, 613, 798–809. [Google Scholar] [CrossRef] [PubMed]
  55. Li, H.Q.; Zhu, H.S.; Wei, X.R.; Liu, B.Y.; Shao, M.G. Soil erosion leads to degradation of hydraulic properties in the agricultural region of Northeast China. Agr. Ecosyst. Environ. 2021, 314, 107388. [Google Scholar] [CrossRef]
  56. Guo, J.H.; Feng, H.L.; McNie, P.; Liu, Q.Y.; Xu, X.; Pan, C.; Yan, K.; Feng, L.; Goitom, E.A.; Yu, Y.C. Species mixing improves soil properties and enzymatic activities in Chinese fir plantations: A meta-analysis. Catena 2023, 220, 106723. [Google Scholar] [CrossRef]
  57. Wang, Q.; Wang, S.; Huang, Y. Comparisons of litterfall, litter decomposition and nutrient return in a monoculture Cunninghamia lanceolata and a mixed stand in southern China. For. Ecol. Manag. 2008, 255, 1210–1218. [Google Scholar] [CrossRef]
  58. Yang, K.; Zhu, J.J.; Zhang, W.W.; Zhang, Q.; Lu, D.L.; Zhang, Y.K.; Zheng, X.; Xu, S.; Wang, G.G. Litter decomposition and nutrient release from monospecific and mixed litters: Comparisons of litter quality, fauna and decomposition site effects. J. Ecol. 2022, 110, 1673–1686. [Google Scholar] [CrossRef]
  59. Pries, C.E.H.; Sulman, B.N.; West, C.; O’Neill, C.; Poppleton, E.; Porras, R.C.; Castanha, C.; Zhu, B.; Wiedemeier, D.B.; Torn, M.S. Root litter decomposition slows with soil depth. Soil Biol. Biochem. 2018, 125, 103–114. [Google Scholar] [CrossRef]
  60. Frouz, J.; Livecková, M.; Albrechtová, J.; Chronáková, A.; Cajthaml, T.; Pizl, V.; Hánel, L.; Stary, J.; Baldrian, P.; Lhotáková, Z.; et al. Is the effect of trees on soil properties mediated by soil fauna? A case study from post-mining sites. For. Ecol. Manag. 2013, 309, 87–95. [Google Scholar] [CrossRef]
  61. Zhang, X.; Liu, S.R.; Huang, Y.T.; Fu, S.L.; Wang, J.X.; Ming, A.G.; Li, X.Z.; Yao, M.J.; Li, H. Tree species mixture inhibits soil organic carbon mineralization accompanied by decreased r-selected bacteria. Plant Soil 2018, 431, 203–216. [Google Scholar] [CrossRef]
  62. Zhang, W.; You, Y.M.; Su, X.Y.; Yan, J.L.; Gao, G.; Ming, A.A.; Shen, W.J.; Huang, X.M. Introducing N2-fixing tree species into Eucalyptus plantations promotes soil organic carbon sequestration in aggregates by increasing microbial carbon use efficiency. Catena 2023, 231, 107321. [Google Scholar] [CrossRef]
  63. Pereira, E.L.; Santos, S.A.P.; Arrobas, M.; Patricio, M.S. Microbial biomass and N mineralization in mixed plantations of broadleaves and nitrogen-fixing species. For. Syst. 2011, 20, 516–524. [Google Scholar] [CrossRef]
  64. Bai, S.H.; Gallart, M.; Singh, K.; Hannet, G.; Komolong, B.; Yinil, D.; Field, D.J.; Muqaddas, B.; Wallace, H.M. Leaf litter species affects decomposition rate and nutrient release in a cocoa plantation. Agric. Ecosyst. Environ. 2022, 324, 107705. [Google Scholar] [CrossRef]
  65. Qi, D.; Feng, F.; Lu, C.; Fu, Y. C:N:P stoichiometry of different soil components after the transition of temperate primary coniferous and broad-leaved mixed forests to secondary forests. Soil Till Res. 2022, 216, 105260. [Google Scholar] [CrossRef]
  66. Schmidt, M.; Veldkamp, E.; Corre, M.D. Tree species diversity effects on productivity, soil nutrient availability and nutrient response efficiency in a temperate deciduous forest. For. Ecol. Manag. 2015, 338, 114–123. [Google Scholar] [CrossRef]
  67. Jing, X.; Chen, X.; Tang, M.; Ding, Z.; Jiang, L.; Li, P.; Ma, S.; Tian, D.; Xu, L.; Zhu, J.; et al. Nitrogen deposition has minor effect on soil extracellular enzyme activities in six Chinese forests. Sci. Total Environ. 2017, 607–608, 806–815. [Google Scholar] [CrossRef] [PubMed]
  68. Tian, D.; Du, E.; Jiang, L.; Ma, S.; Zeng, W.; Zou, A.; Feng, C.; Xu, L.; Xing, A.; Wang, W.; et al. Responses of forest ecosystems to increasing N deposition in China: A critical review. Environ. Pollut. 2018, 243, 75–86. [Google Scholar] [CrossRef] [PubMed]
  69. Bach, E.M.; Williams, R.J.; Hargreaves, S.K.; Yang, F.; Hofmockel, K.S. Greatest soil microbial diversity found in micro-habitats. Soil Biol. Biochem. 2018, 118, 217–226. [Google Scholar] [CrossRef]
  70. Ebrahimi, A.; Or, D. Hydration and diffusion processes shape microbial community organization and function in model soil aggregates. Water Resour. Res. 2015, 51, 9804–9827. [Google Scholar] [CrossRef]
  71. Zhang, Z.M.; Yan, J.; Han, X.Z.; Zou, W.X.; Chen, X.; Lu, X.C.; Feng, Y.T. Labile organic carbon fractions drive soil microbial communities after long-term fertilization. Glob. Ecol. Conserv. 2021, 32, e01867. [Google Scholar] [CrossRef]
  72. Wang, L.; Luo, X.; Xiong, X.; Chen, W.; Hao, X.; Huang, Q. Soil aggregate stratification of ureolytic microbiota affects urease activity in an inceptisol. J. Agric. Food Chem. 2019, 67, 11584–11590. [Google Scholar] [CrossRef]
  73. Trivedi, P.; Rochester, I.J.; Trivedi, C.; Van Nostrand, J.D.; Zhou, J.; Karunaratne, S.; Anderson, I.C.; Singh, B.K. Soil aggregate size mediates the impacts of cropping regimes on soil carbon and microbial communities. Soil Biol. Biochem. 2015, 91, 169–181. [Google Scholar] [CrossRef]
  74. Wan, W.J.; Li, X.; Han, S.; Wang, L.; Luo, X.S.; Chen, W.L.; Huang, Q.Y. Soil aggregate fractionation and phosphorus fraction driven by long-term fertilization regimes affect the abundance and composition of P-cycling-related bacteria. Soil Till Res. 2020, 196, 104475. [Google Scholar] [CrossRef]
  75. Moorhead, D.L.; Rinkes, Z.L.; Sinsabaugh, R.L.; Weintraub, M.N. Dynamic relationships between microbial biomass, respiration, inorganic nutrients and enzyme activities: Informing enzyme-based decomposition models. Front. Microbiol. 2013, 4, 223. [Google Scholar] [CrossRef] [PubMed]
  76. Zhao, Y.K.; Wang, H.; Chen, X.W.; Fu, Y. Effect of rainfall on soil aggregate breakdown and transportation on cultivated land in the black soil region of Northeast China. Sustainability 2022, 14, 11028. [Google Scholar] [CrossRef]
  77. Yang, T.; Zhang, H.; Zheng, C.; Wu, X.; Zhao, Y.; Li, X.; Liu, H.; Dong, L.; Lu, Z.; Zhou, J.; et al. Bacteria life-history strategies and the linkage of soil C-N-P stoichiometry to microbial resource limitation differed in karst and non-karst plantation forests in southwest China. Catena 2023, 231, 107341. [Google Scholar] [CrossRef]
  78. Qiu, X.C.; Peng, D.L.; Tian, H.X.; Wang, H.B.; Liu, X.; Cao, L.; Li, Z.; Cheng, S. Soil ecoenzymatic stoichiometry and microbial resource limitation driven by thinning practices and season types in Larix principis-rupprechtii plantations in North China. For. Ecol. Manag. 2021, 482, 118880. [Google Scholar] [CrossRef]
  79. Cui, Y.; Bing, H.; Fang, L.; Jiang, M.; Shen, G.; Yu, J.; Wang, X.; Zhu, H.; Wu, Y.; Zhang, X. Extracellular enzyme stoichiometry reveals the carbon and phosphorus limitations of microbial metabolisms in the rhizosphere and bulk soils in alpine ecosystems. Plant Soil 2019, 458, 7–20. [Google Scholar] [CrossRef]
  80. Zimmermann, S.; Frey, B. Soil respiration and microbial properties in an acid forest soil: Effects of wood ash. Soil Biol. Biochem. 2002, 34, 1727–1737. [Google Scholar] [CrossRef]
Figure 1. Research site (A), sample plot location (B), and diagram of the sample plot area (C).
Forests 15 00724 g001
Figure 2. Differences in soil nutrients and their stoichiometric ratios in different stands and aggregates. (A) Soil organic carbon (OC), (B) soil total nitrogen (TN), (C) soil total phosphorus (TP), (D) readily oxidizable carbon (ROC), (E) hydrolyzable nitrogen (HN), (F) available phosphorus (AP), (G) stoichiometric ratio of carbon to nitrogen (C/N), (H) stoichiometric ratio of carbon to phosphorus (C/P), and (I) stoichiometric ratio of nitrogen to phosphorus (N/P). The values are means ± SE. Distinct capital letters denote significant differences in values between aggregates (p < 0.05, n = 5), and distinct lowercase letters denote significant differences in values between stand types (p < 0.05, n = 5).
Forests 15 00724 g002
Figure 3. Microbial biomass and respiration in different stand types and aggregates. (A,B) microbial biomass carbon (MBC) in the various soil layers; (C,D) microbial biomass nitrogen (MBN) in the different soil layers; (E,F) microbial respiration (MR) in the different soil layers. The values are means ± SE. Distinct capital letters denote significant differences in values between aggregates (p < 0.05, n = 5), and distinct lowercase letters denote significant differences in values between stand types (p < 0.05, n = 5).
Forests 15 00724 g003
Figure 4. The extracellular enzyme activity of each enzyme synthesized by microorganisms in different stand types and aggregates. Activity of (A,B) β-1,4-glucosidase (BG) in the different soil layers, (C,D) urease (URE) in the various soil layers, (E,F) acid phosphatase (ACP) in the different soil layers. The values are means ± SE. Distinct capital letters denote significant differences in values between aggregates (p < 0.05, n = 5), and distinct lowercase letters denote significant differences in values between stand types (p < 0.05, n = 5).
Forests 15 00724 g004
Figure 5. Extracellular enzyme stoichiometry in different aggregates and stand types. (A) Stoichiometric scatter plots indicate resource constraints for microbes. (B) The relationship between VL and VA in different aggregates and bulk soils. Solid and dashed lines reflect significant and nonsignificant linear relationships between VA and VL (p < 0.05, n = 10), respectively.
Forests 15 00724 g005
Figure 6. Redundancy analysis of soil C, N, and P indicators and nutrient limitations in the SH (A), SM (B), and SS (C) stands. OC and ROC indicate organic carbon and readily oxidizable carbon, respectively; TN and HN represent total nitrogen and hydrolyzable nitrogen, respectively; TP and AP indicate total phosphorus and available phosphorus, respectively; C/N, C/P, and N/P indicate the stoichiometric ratios of C to N, C to P, as well as N to P, respectively. Aggregates are identified by their shape. The percentages of each factor indicate the percentage of total variance in microbial resource limitation explained by each factor. In addition, * and **signify significance at the 0.05 and 0.01 levels, respectively.
Forests 15 00724 g006
Figure 7. Pathway analysis of microbial resource limitation for soil nutrient regulation. The positive and negative causality flows are indicated by red and blue arrows (p < 0.05), respectively. The numbers on the paths show the standardized correlation coefficients, and R2 indicates the explained variance of the dependent variable. OC and ROC indicate organic carbon and readily oxidizable carbon, respectively; TN and HN represent total nitrogen and hydrolyzable nitrogen, respectively; TP and AP indicate total phosphorus and available phosphorus, respectively; C/N, C/P, and N/P indicate the stoichiometric ratios of C to N, C to P, as well as N to P, respectively; MBC, MBN, and MR represent microbial biomass carbon, microbial biomass nitrogen, and microbial respiration, respectively.
Forests 15 00724 g007
Table 1. Sample plot information.
Stand TypeAltitudeSlope
Aspect
SlopeCrown DensityDensityDBH (cm)Height (m)Litter Mass
(m) (°)(%)Tree ha−1Chinese FirMixed
Species
Chinese FirMixed
Species
(kg ha−1)
SH730Southeast27851215 ± 100.93 a17.22 ± 1.35 c24.06 ± 1.63 a13.84 ± 0.87 c13.58 ± 0.58 c4973.98 a
SM725Southeast 23851005 ± 222.49 a20.22 ± 2.10 b12.01 ± 2.56 d15.78 ± 1.35 ab14.49 ± 2.04 bc4527.88 a
SS728Southeast 32851095 ± 97.47 a21.00 ± 0.82 b-16.28 ± 0.53 a-2974.88 b
Values for density, DBH, and height are means ± SD. DBH indicates the diameter at breast height. Distinct lowercase letters denote significant value differences between stands (p < 0.05, n = 5).
Table 2. Differences in the soil properties and structure among different forest stands.
Soil LayerStand TypeSoil Aggregate Composition (%)MWD
(mm)
GMDBulk Density
(g cm−3)
SWC
(%)
>2 mm2–0.25 mm<0.25 mm(mm)
0–10 cmSH51.94 ± 2.98 Aa33.29 ± 4.35 Ba14.77 ± 4.53 Cc2.21 ± 0.10 a1.48 ± 0.17 a1.24 ± 0.01 b24.57 ± 1.48 a
SM45.01 ± 3.95 Ab31.17 ± 3.39 Ba23.82 ± 4.22 Cb1.96 ± 0.13 b1.12 ± 0.14 b1.26 ± 0.02 b20.66 ± 1.96 b
SS32.36 ± 3.04 Bc31.84 ± 2.00 Ca35.81 ± 5.00 Aa1.54 ± 0.12 c0.75 ± 0.11 c1.31 ± 0.02 a18.19 ± 1.53 c
10–20 cmSH49.18 ± 1.41 Aa31.50 ± 3.35 Ba19.32 ± 4.33 Cc2.10 ± 0.07 a1.29 ± 0.14 a1.26 ± 0.01 b24.03 ± 0.93 a
SM33.09 ± 2.66 Bb27.88 ± 1.92 Cab39.03 ± 2.75 Ab1.52 ± 0.09 b0.70 ± 0.06 b1.27 ± 0.01 b24.13 ± 0.54 a
SS29.73 ± 3.49 Bb24.81 ± 2.86 Bb45.46 ± 4.34 Aa1.38 ± 0.12 c0.58 ± 0.07 b1.33 ± 0.02 a21.98 ± 1.03 b
The values are means ± SD. SWC indicates soil water content. Distinct capital letters denote significant differences in values between aggregates (p < 0.05, n = 5), and distinct lowercase letters denote significant differences in values between stand types (p < 0.05, n = 5).
Disclaimer/Publisher’s Note: The statements, opinions and data contained in all publications are solely those of the individual author(s) and contributor(s) and not of MDPI and/or the editor(s). MDPI and/or the editor(s) disclaim responsibility for any injury to people or property resulting from any ideas, methods, instructions or products referred to in the content.

