Article

Wood Basic Density in Large Trees: Impacts on Biomass Estimates in the Southwestern Brazilian Amazon

by
Flora Magdaline Benitez Romero
1,2,3,
Thais de Nazaré Oliveira Novais
1,
Laércio Antônio Gonçalves Jacovine
2,
Eronildo Braga Bezerra
4,5,
Rosana Barbosa de Castro Lopes
3,
Juliana Sousa de Holanda
6,
Edi Flores Reyna
7 and
Philip Martin Fearnside
1,*
1
Instituto Nacional de Pesquisas da Amazônia (INPA), Av. André Araújo, 2936, Manaus 69067-375, AM, Brazil
2
Departamento de Engenharia Florestal, Universidade Federal de Viçosa (UFV), Viçosa 36570-900, MG, Brazil
3
Departamento de Ciências Florestais, Faculdade de Ciências Agrarias, Universidade Federal de Amazonas (UFAM), Manaus 69077-000, AM, Brazil
4
Centro de Ciências do Ambiente (CCA), Universidade Federal de Amazonas (UFAM), Manaus 69077-000, AM, Brazil
5
Departamento de Engenharia Agrícola e Solos, Faculdade de Ciências Agrarias, Universidade Federal de Amazonas (UFAM), Manaus 69077-000, AM, Brazil
6
Programa de Pós Graduação em Ciências Florestais e Ambientais, Faculdade de Ciências Agrarias, Universidade Federal de Amazonas (UFAM), Manaus 69077-000, AM, Brazil
7
Departamento de Economia Rural, Universidade Federal de Viçosa (UFV), Viçosa 36570-900, MG, Brazil
*
Author to whom correspondence should be addressed.
Forests 2024, 15(5), 734; https://doi.org/10.3390/f15050734
Submission received: 6 March 2024 / Revised: 1 April 2024 / Accepted: 10 April 2024 / Published: 23 April 2024
(This article belongs to the Section Forest Ecology and Management)

Abstract

:
Wood basic density (WD) plays a crucial role in estimating forest biomass; moreover, improving wood-density estimates is needed to reduce uncertainties in the estimates of tropical forest biomass and carbon stocks. Understanding variations in this density along the tree trunk and its impact on biomass estimates is underexplored in the literature. In this study, the vertical variability of WD was assessed along the stems of large trees that had a diameter at breast height (DBH) ≥ 50 cm from a dense ombrophilous forest on terra firme (unflooded uplands) in Acre, Brazil. A total of 224 trees were sampled, including 20 species, classified by wood type. The average WD along the stem was determined by the ratio of oven-dry mass to saturated volume. Five models were tested, including linear and nonlinear ones, to fit equations for WD, selecting the best model. The variation among species was notable, ranging from 0.288 g cm−3 (Ceiba pentandra, L., Gaertn) to 0.825 g cm−3 (Handroanthus serratifolius, Vahl., S. Grose), with an average of 0.560 g cm−3 (±0.164, standard deviation). Significant variation was observed among individuals, such as in Schizolobium parahyba var. amazonicum (H. ex D.), which ranged from 0.305 to 0.655 g cm−3. WD was classified as low (≤0.40 g cm−3), medium (0.41–0.60 g cm−3), and high (≥0.61 g cm−3). The variability in WD along the stem differs by wood type. In trees with low-density wood, density shows irregular variation but tends to increase along the stem, whereas it decreases in species with medium- and high-density wood. The variation in WD along the stem can lead to underestimations or overestimations, not only in individual trees and species but also in total stocks when estimating forest biomass. Not considering this systematic bias results in significant errors, especially in extrapolations to vast areas, such as the Amazon.

Graphical Abstract

1. Introduction

Large trees play a crucial role in forest conservation, contributing significantly to the hydrological and carbon cycles, as well as sustaining biodiversity and carbon storage [1]. Storage in large trees (≥50 cm diameter at breast height (DBH)) represents 40 to 60% of the forest’s dry aboveground biomass. Due to their specific architecture, these trees are particularly important for issues related to climate change, given their disproportionate contribution to the total forest biomass [1,2,3]. The lack of data on large trees can be attributed to the high cost of sampling and to legal restrictions, because extracting these trees from the forest in Brazil is only permitted with the approval of a forest management plan [4].
In the Brazilian Amazon, forest management plans are developed for the harvest of roundwood for sawn timber production. The true impact of this management on mitigating climate change is still debated, as it faces significant challenges in achieving effective sustainability [5] and has both positive and negative environmental effects [6]. The beneficial effects include the contribution of forest regeneration to carbon-stock recovery and the temporary storage of carbon in timber products. The negative aspects include the reduction of forest carbon stock due to the removal of large commercial trees, emissions from the decay of the crowns, stumps, and roots of harvested trees, and biomass loss due to collateral damage from things such as access roads, skid tracks, and log landings. Forest fires and degradation related to logging and illegal logging can turn the forest into a potential source of greenhouse gas emissions [7,8].
Quantifying greenhouse gas emissions from deforestation and forest degradation requires determining biomass, and for this it is essential to obtain values for wood basic density (WD), which varies according to species and spatial distribution. Wood basic density is a crucial variable in the allometric models used to estimate biomass in tropical forests [9,10,11,12,13,14]. These estimates are essential for assessing carbon stocks and flows, contributing to the understanding of the influence of these factors on global climate change [15,16].
Determining WD requires caution due to the influence of various factors, such as radial and vertical variations in relation to tree height [3,15,17], differences between species and taxonomic groups [10,18], and spatial variations in forest typologies [10,11,19,20,21]. Local environmental conditions, such as soil fertility and light conditions, also influence WD [11,22,23].
Vertical variation along the stem must be considered when estimating forest biomass because not considering this source of systematic bias results in significant errors in estimates for vast areas, such as the Amazon [3,17,24,25,26,27].
Equations have been developed to correct for vertical variations within trees [3,15,17] or to determine “ideal” sampling points for a single species [28] or a group of species [26]. However, these results, while satisfactory, cannot be generalized to all species, especially tropical ones, which have patterns of variation that differ from other regions [3].
There is a knowledge gap regarding vertical variation in WD in species in the southwest region of the Brazilian Amazon [
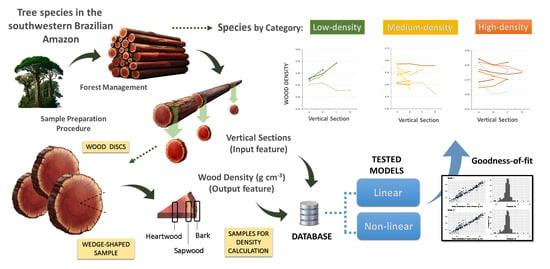
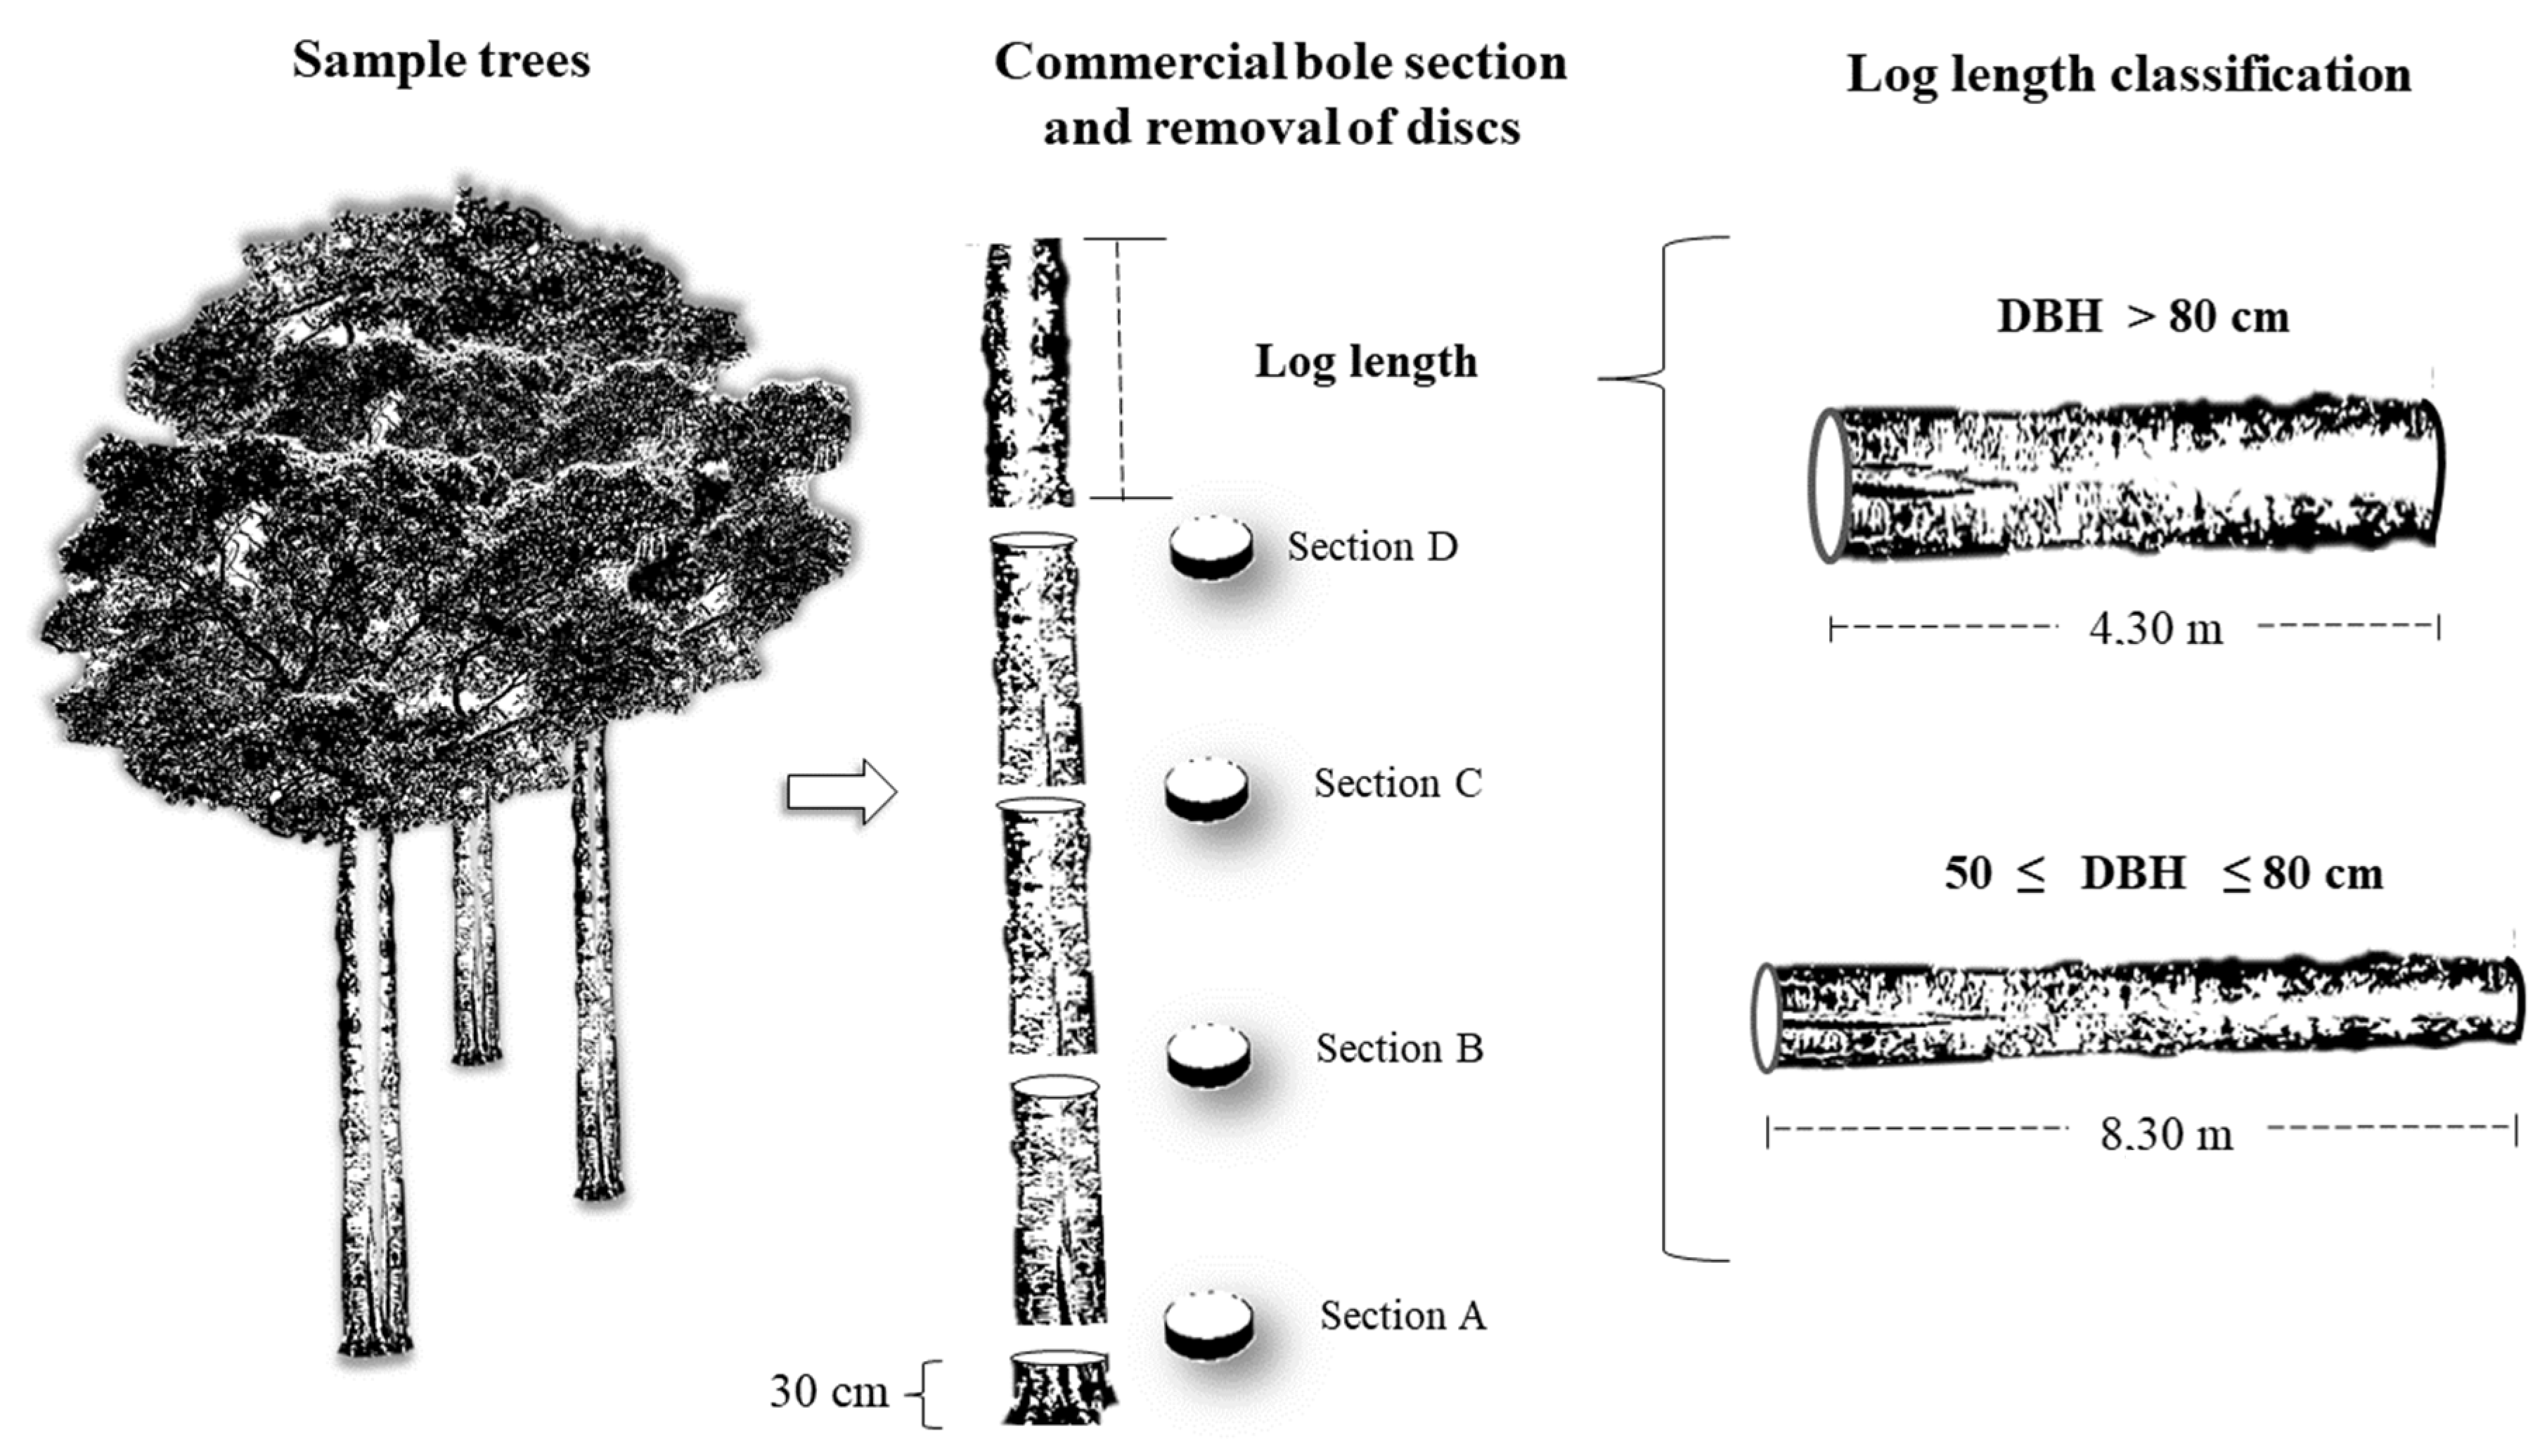
21], especially in studies that include large trees (with diameter at breast height (DBH) ≥ 50 cm). The present study aims to determine the vertical variation of WD in the stems of large trees, to propose allometric equations and corrections for this variation, and to discuss their influences on forest biomass estimates in the southwestern Brazilian Amazon.

2. Materials and Methods

2.1. Study Area

The study was conducted in the Antimary I and II ranches (9°23′43″ S latitude and 67°58′50″ W longitude), located in the municipality of Porto Acre, in the state of Acre in the southwestern Brazilian Amazon (Figure 1). The research area corresponds to an annual production unit of 1253.02 ha, designated as UPA 02, integrated into the Sustainable Forest Management Plan (PMFS) and governed by the Annual Operational Plan [28], both implemented by Fox Laminados Ltda (Porto Acre, AC, Brazil). A 100% forest inventory of commercial trees with DBH ≥ 50 cm was conducted in the area in May 2015, and the management project received approval from the Acre Environmental Institute (IMAC) in 2016 [29].
The vegetation in the southwestern Brazilian Amazon is classified as moist terra firme (unflooded upland) forest [12,30]. In the managed area, the predominant vegetation is dense ombrophilous forest, although open ombrophilous forest with bamboo is also present in smaller proportions [29]. The local climate is classified as “Am” (Köppen), characterized as a tropical monsoon climate with distinct dry and rainy seasons [31]. The annual average temperature is 24 to 26 °C, and the annual precipitation ranges from 1750 to 2500 mm [32]. The dry season extends from June to September, while the rainy season extends from October to April or May, with the first quarter of the year having the highest precipitation [33]. The predominant soils in the region are classified as ultisols, dystrophic ultisols, and typic dystrophic oxisols, with soil texture ranging from clayey to very clayey [28,34].

2.2. Species and Sampled Trees Selection

Species selection was based on the coverage value index, providing information on tree density (individuals ha−1) and basal area (m2 ha−1) derived from the 100% forest inventory conducted by the management company, where all commercially relevant trees with DBH ≥ 50 cm were measured [29]. Scientific names were verified in Brazil’s Flora 2020 database [35]. The twenty species with the highest coverage values (basal area per hectare) were selected [36]. The number of individuals sampled (224) was determined according to the sample size (n) for a population considered to be infinite using Equation (1). The variable used to determine sample size was volume (m3).
n = t 2 ( C V ) 2 ( E % ) 2
where n = number of individuals sampled; t = tabulated value of Student’s t-statistic at 5% significance with “n” degrees of freedom; CV = coefficient of variation; and E% = required accuracy (10%).

2.3. Collection of Wood Disks along the Commercial Bole

The sampled trees were all cut at 30 cm above the ground, including those with buttresses. The commercial stems were sectioned into logs, and wood disks of constant thickness (≈3 cm) were taken from the base of each log. For individuals with DBH ≥ 80 cm, the stem was sectioned every 4.30 m until the total length of the commercial stem was reached. In individuals with a DBH from 50 to 80 cm, the log length was 8.30 m. The first disk in all trees was taken at 30 cm above the ground (Figure 2). A total of 479 disks were collected and analyzed. The number of disks removed per tree varied according to the diameter and length of the tree (Figure 2). This methodology for disk sampling along the stem was adapted to the operational procedures of the company for practical activities in the management area, such as log length classification to facilitate the logging stage. The number of sampled wood disks per tree ranged from 2 to 5 and they were classified into sections named A, B, C, and D according to their positions along the stem. For all sampled individuals, Section A corresponded to the position of the base of the stem, i.e., 30 cm above the ground, while Sections B, C, and D varied in height depending on the stem section.

2.4. Determination of WD and Classification of Species by Wood Type

The wood discs collected in the field were brought to the laboratory and a wedge-shaped sample was extracted from each disc, including parts of the heartwood, sapwood, and bark, to adequately represent the disc. The wedges were immersed in water until saturation to obtain the saturated volume using the immersion method, which involves measuring the water displacement related to the saturated volume of the piece (cm3).
Subsequently, the samples were dried in a forced-air-circulation oven at a temperature of 100 ± 2 °C until reaching constant mass. WD was determined by using the ratio of dry mass (g—0% moisture) to saturated volume (Equation (2)) [37].
ρ = m s V s a t
where ρ = W D g   c m 3 , m s = D r y   m a s s   o f   t h e   w o o d g , V s a t = v o l u m e   o f   s a t u r a t e d   w o o d   ( c m 3 ).
The WD for each sampled species was obtained as the arithmetic mean of the densities of samples of the same species [12,38]. Additionally, deviations and a 95% confidence interval were calculated.
The 20 species were categorized by wood type based on the mean value of WD (Table 1). The designations used were adapted to “low-density wood”, “medium-density wood”, and “high-density wood” [39].

2.5. Models Tested to Estimate the WD of the Stem

Five regression models were fitted (Table 2) to estimate the WD throughout the stem ( ρ stem) using independent variables such as the WD at the base ( ρ base, g cm−3), diameter at breast height (DBH, cm), and commercial height (h, m). Regression models were applied to the WD of the 20 species in three phases. First, a general equation was fitted, considering all arboreal individuals of the 20 species evaluated in this study. In the second phase, the “low-density” and “medium-density” species were included in a single data set, as the number of samples for low-density-wood species was insufficient to fit an equation just for this category. In the last phase, only “high-density” species were considered when fitting the equation.
Evaluation of the goodness-of-fit was conducted based on indicators described by Campos and Leite [40]. These include the coefficient of determination (R2), representing the quality of regression line fitting; the square root of the mean squared error (RMSE), which amplifies and penalizes errors of greater magnitude more strongly; the coefficient of regression variation; and a graphical analysis of the distribution of residuals. Additionally, the mean absolute deviation (MAD) and the Akaike information criterion (AIC) were computed. Both MAD and AIC serve as valuable tools in the selection and evaluation of statistical models, providing crucial insights for choosing models that balance precision and simplicity.

3. Results

3.1. Aboveground Stocks in Commercial Trees

The stem WD ( ρ stem) of individual trees displayed considerable variation, ranging from 0.288 to 0.825 g cm−3 (Figure 3). The mean ± standard deviation (SD) was 0.560 ± 0.164 g cm−3 for the total of 224 individuals, encompassing 20 commercial species. Significantly divergent densities were noted among species (p < 0.000). Beyond inter-species differences, there was a noteworthy, albeit statistically non-significant (p = 0.368), variability among individuals of the same species, exemplified by Schizolobium parahyba var. amazonicum (Huber ex Ducke), whose individuals ranged in WD from 0.305 to 0.655 g cm−3.

3.2. Vertical Variability of WD along the Stem

There were variations in WD along the stem, and these values were significantly influenced by the wood type (p < 0.001, Kruskal–Wallis). The average WD for low-density-wood species was 0.346 ± 0.056 g cm−3, for medium-density-wood species it was 0.458 ± 0.068 g cm−3, and for high-density-wood species it was 0.738 ± 0.075 g cm−3 (Table 3).
Species with low-density wood tend to exhibit an increase in WD from the base to the top of the stem, with the exception of Ceiba pentandra (Figure 4).
In percentage terms, there were increases ranging from 14.18% to 35.08% in the mean WD of the last stem section for each species compared to the density at the base (Section A), with Sterculia apetala exhibiting the highest relative variation of 35.08% (Table 4). C. pentandra had the highest mean DBH (130.2 cm) among the species and, due to this, allowed a greater segmentation of the stem (Figure 4). This species did not show significant vertical variation in WD compared to other species in the same category. However, following a subtle trend of both decreasing and increasing WD along the stem, it ended up with a decrease of 16.24% from the base (Section A) to the uppermost section (Section D).
In the medium-density-wood species, there was no consistent pattern observed in terms of the vertical variation in WD (Figure 5).
Ceiba samauma and Cedrela odorata increased their basic densities by 3.13% and 6.18%, respectively, in the last stem section, represented by Section B for both species. In contrast, other species experienced a decrease ranging from −2.60% to −36.31% in WD from the base to the top of the stem (Table 5). Parkia paraensis and Schizolobium parahyba var. amazonicum had the highest vertical variations, with decreases of 36.31% and 34.79%, respectively.
The high-density-wood species exhibited decreases (Figure 6) in WD from the stem base to the top ranging from −2.71% to −7.96% (Table 6), with the exception of Eschweilera bracteosa and Terminalia tetraphylla, which experienced increases of 9.23% and 2.64%, respectively. It is noteworthy that although E. grandiflora and E. bracteosa belong to the same genus, they exhibit opposite behaviors in terms of the variation in WD along the stem. The vertical variations for each species are listed in Table 6 and range from −7.96% for Albizia niopoides to 9.23% for Eschweilera bracteosa.

3.3. Fitting the Equation for Stem WD for the Large Individuals of 20 Commercial Species

The three fitted models, as noted in Table 7, show that the independent variables explained more than 92% of the variation in the stem WD ( ρ stem). RMSE was consistent at 0.045 and the CV was approximately 5%, indicating relatively low variability and narrow dispersion around the mean. However, at a significance level of 10%, some of the coefficients estimated by Models 2 and 3 were not statistically significant, mainly those related to the diameter (d) and height (h) variables. Therefore, Model 1 is the most appropriate according to the AIC and MAD statistics (Table 7); this model uses only the WD at the base as a predictor variable.
It is noteworthy that the estimates with Model 1 had an average error of 0.69% ± 9.31% but with individual discrepancies in residuals; errors at the tree level ranged from −31.78% to 40.31% (Figure 7). These discrepant errors were mainly associated with trees with a wood density of 0.30 to 0.50 g cm−3, i.e., low- and medium-wood-density species.
Of the two nonlinear equations tested with the variables “d” and “h” to estimate the WD of the stems for the 20 commercial species (including species in all wood density categories (low, medium, and high), Model 2 had the better fit, as it had lower RMSE and AIC values (Table 8).
The residuals in Model 2 had a more uniform distribution than in Model 1. However, the presence of “residual” points was noted, in addition to under and overestimates of the mean WD of the stem (Figure 8).

3.3.1. Equation Fitting for Low-Density- and Medium-Density-Wood Species

The models for low- and medium-density-wood species proved less accurate than the models for high-density-wood species. However, Table 9 reports models that showed relatively acceptable results for estimating the WD of the stem in the low- and medium-density-wood categories. In all three models, independent variables explain more than 70% of the variation in stem WD ( ρ stem). The preferred estimates came from Model 1, because it has the lowest AIC and because the estimated coefficients were both statistically significant at the 1% level (Table 9).
Through graphical analysis, it is possible to confirm that Model 1 exhibited a more uniform distribution of residuals (Figure 9). However, the presence of points with residuals, as well as underestimations and overestimations of the mean WD of the stem, are still evident.

3.3.2. Equation Fitting for High-Density-Wood Species

Equations fitted to estimate the stem WD for high-density-wood species explained more than 85% of the variation in the dependent variable (Table 10). Among the three equations, Model 1 yielded the best fit and was the most parsimonious. Although both fitted equations showed very close statistics, the AIC and the significance levels of the coefficients indicated Model 1 as the best model (Table 10). As seen in the previous estimation, both diameter and height do not explain the variation in the dependent variable.
The graphical analysis shows that the models for high-density-wood species have good fits, although some discrepant residual data points are present (Figure 10).

4. Discussion

It is well documented that there is a real influence of vertical variability on the average WD along the stem, which can differ significantly from the WD of samples taken solely at breast height (1.30 m above the ground) or the stem base [15,17,25,26,41]. Due to this influence, some studies have suggested percentage values to correct the WD of samples only from the stem base or at breast height, such as the value of 4.3% for the central Amazon [15] and the value of 3.2% for the southwestern Amazon [21].
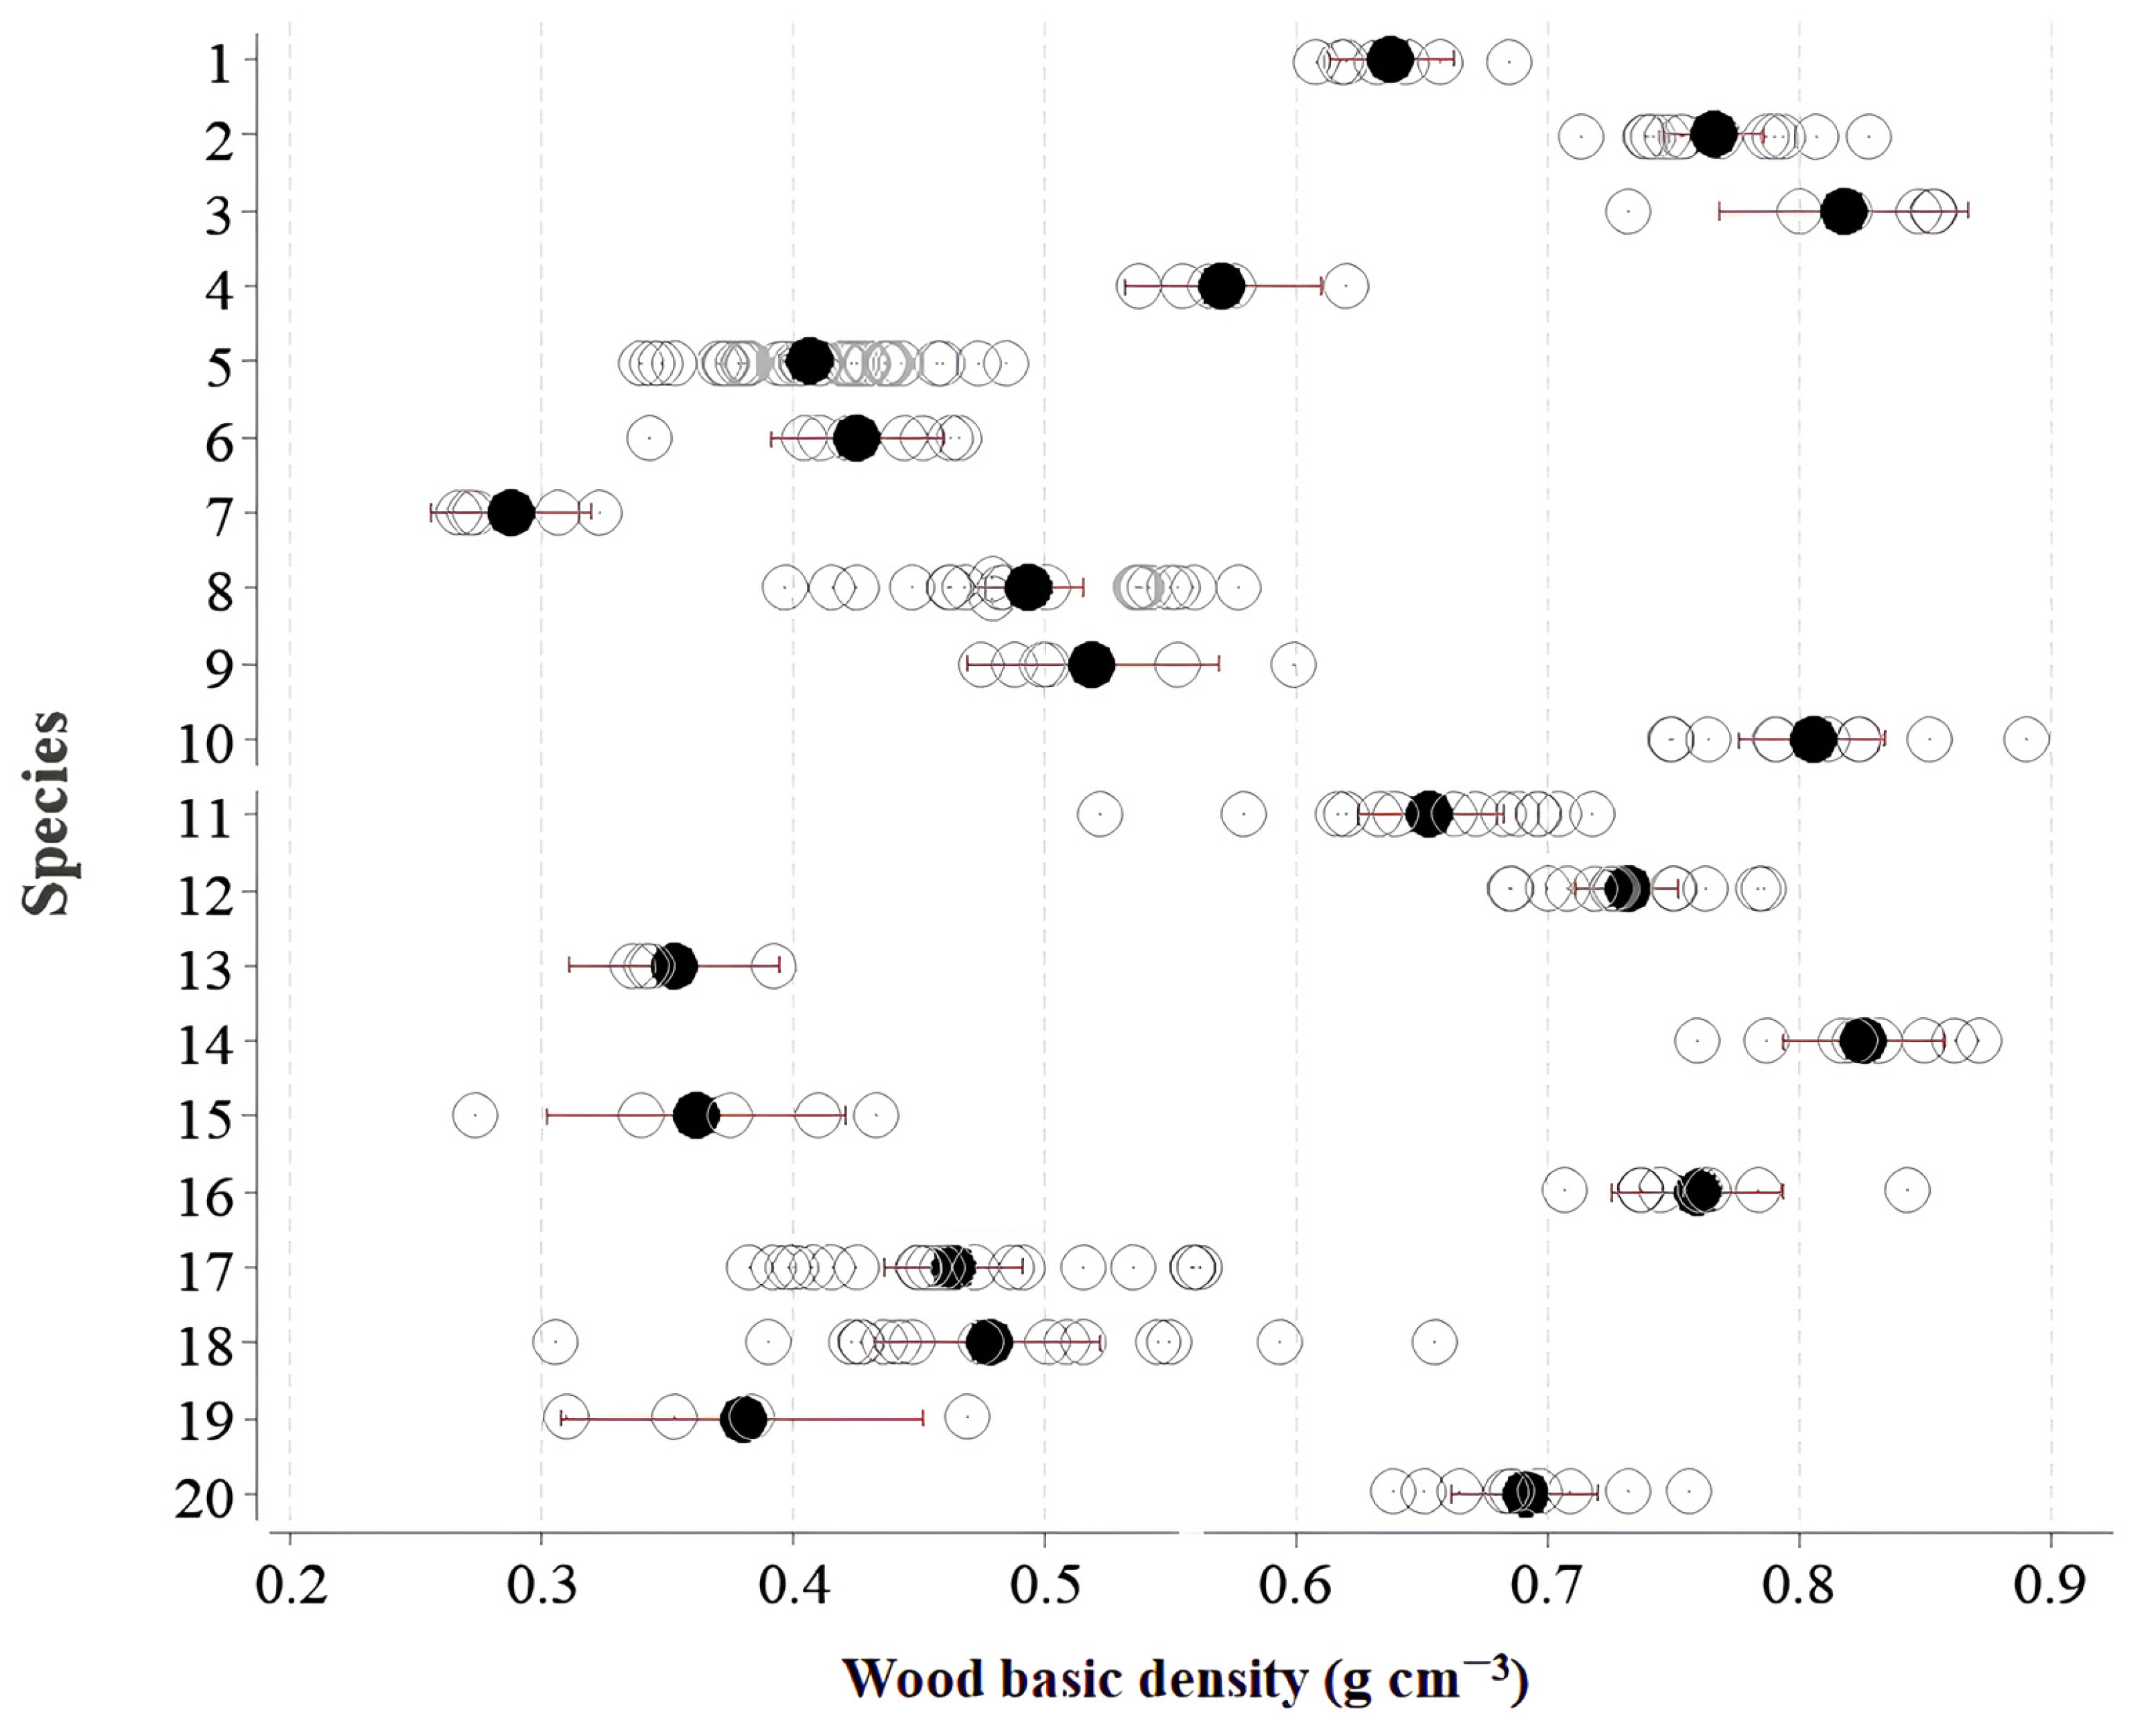
Based on the data from the current study, which was collected from 224 individuals in 20 species, there is a suggested reduction of 2.89% in the average WD value if samples are collected only at the stem base level. However, it is suggested that this correction be applied depending on the wood-type category, as the vertical variability behavior of density along the stem differs among low-, medium-, and high-density-wood categories. The use of samples from the stem bases of low-density-wood species was found to produce an underestimation of 2.89% for the WD of the stem as a whole, while the use of stem base samples from medium- and high-density-wood species caused overestimations of 4.12% and 2.46%, respectively.
This classification of wood type based on WD can contribute to better forest management by defining methodologies and management practices applicable to each group [42]. Grouping these species and attempting to explain the different patterns of vertical density variability along the stem aids in understanding how this variable is interconnected with the life history strategies of trees and their ecological functions in the forest [19,43,44,45,46]. Because WD is a determinant of biomass, it also affects the forest’s role in carbon storage and the global climate. Species with a high wood density have value for carbon sequestration. These species are also important for carbon in reforestation initiatives [47,48].
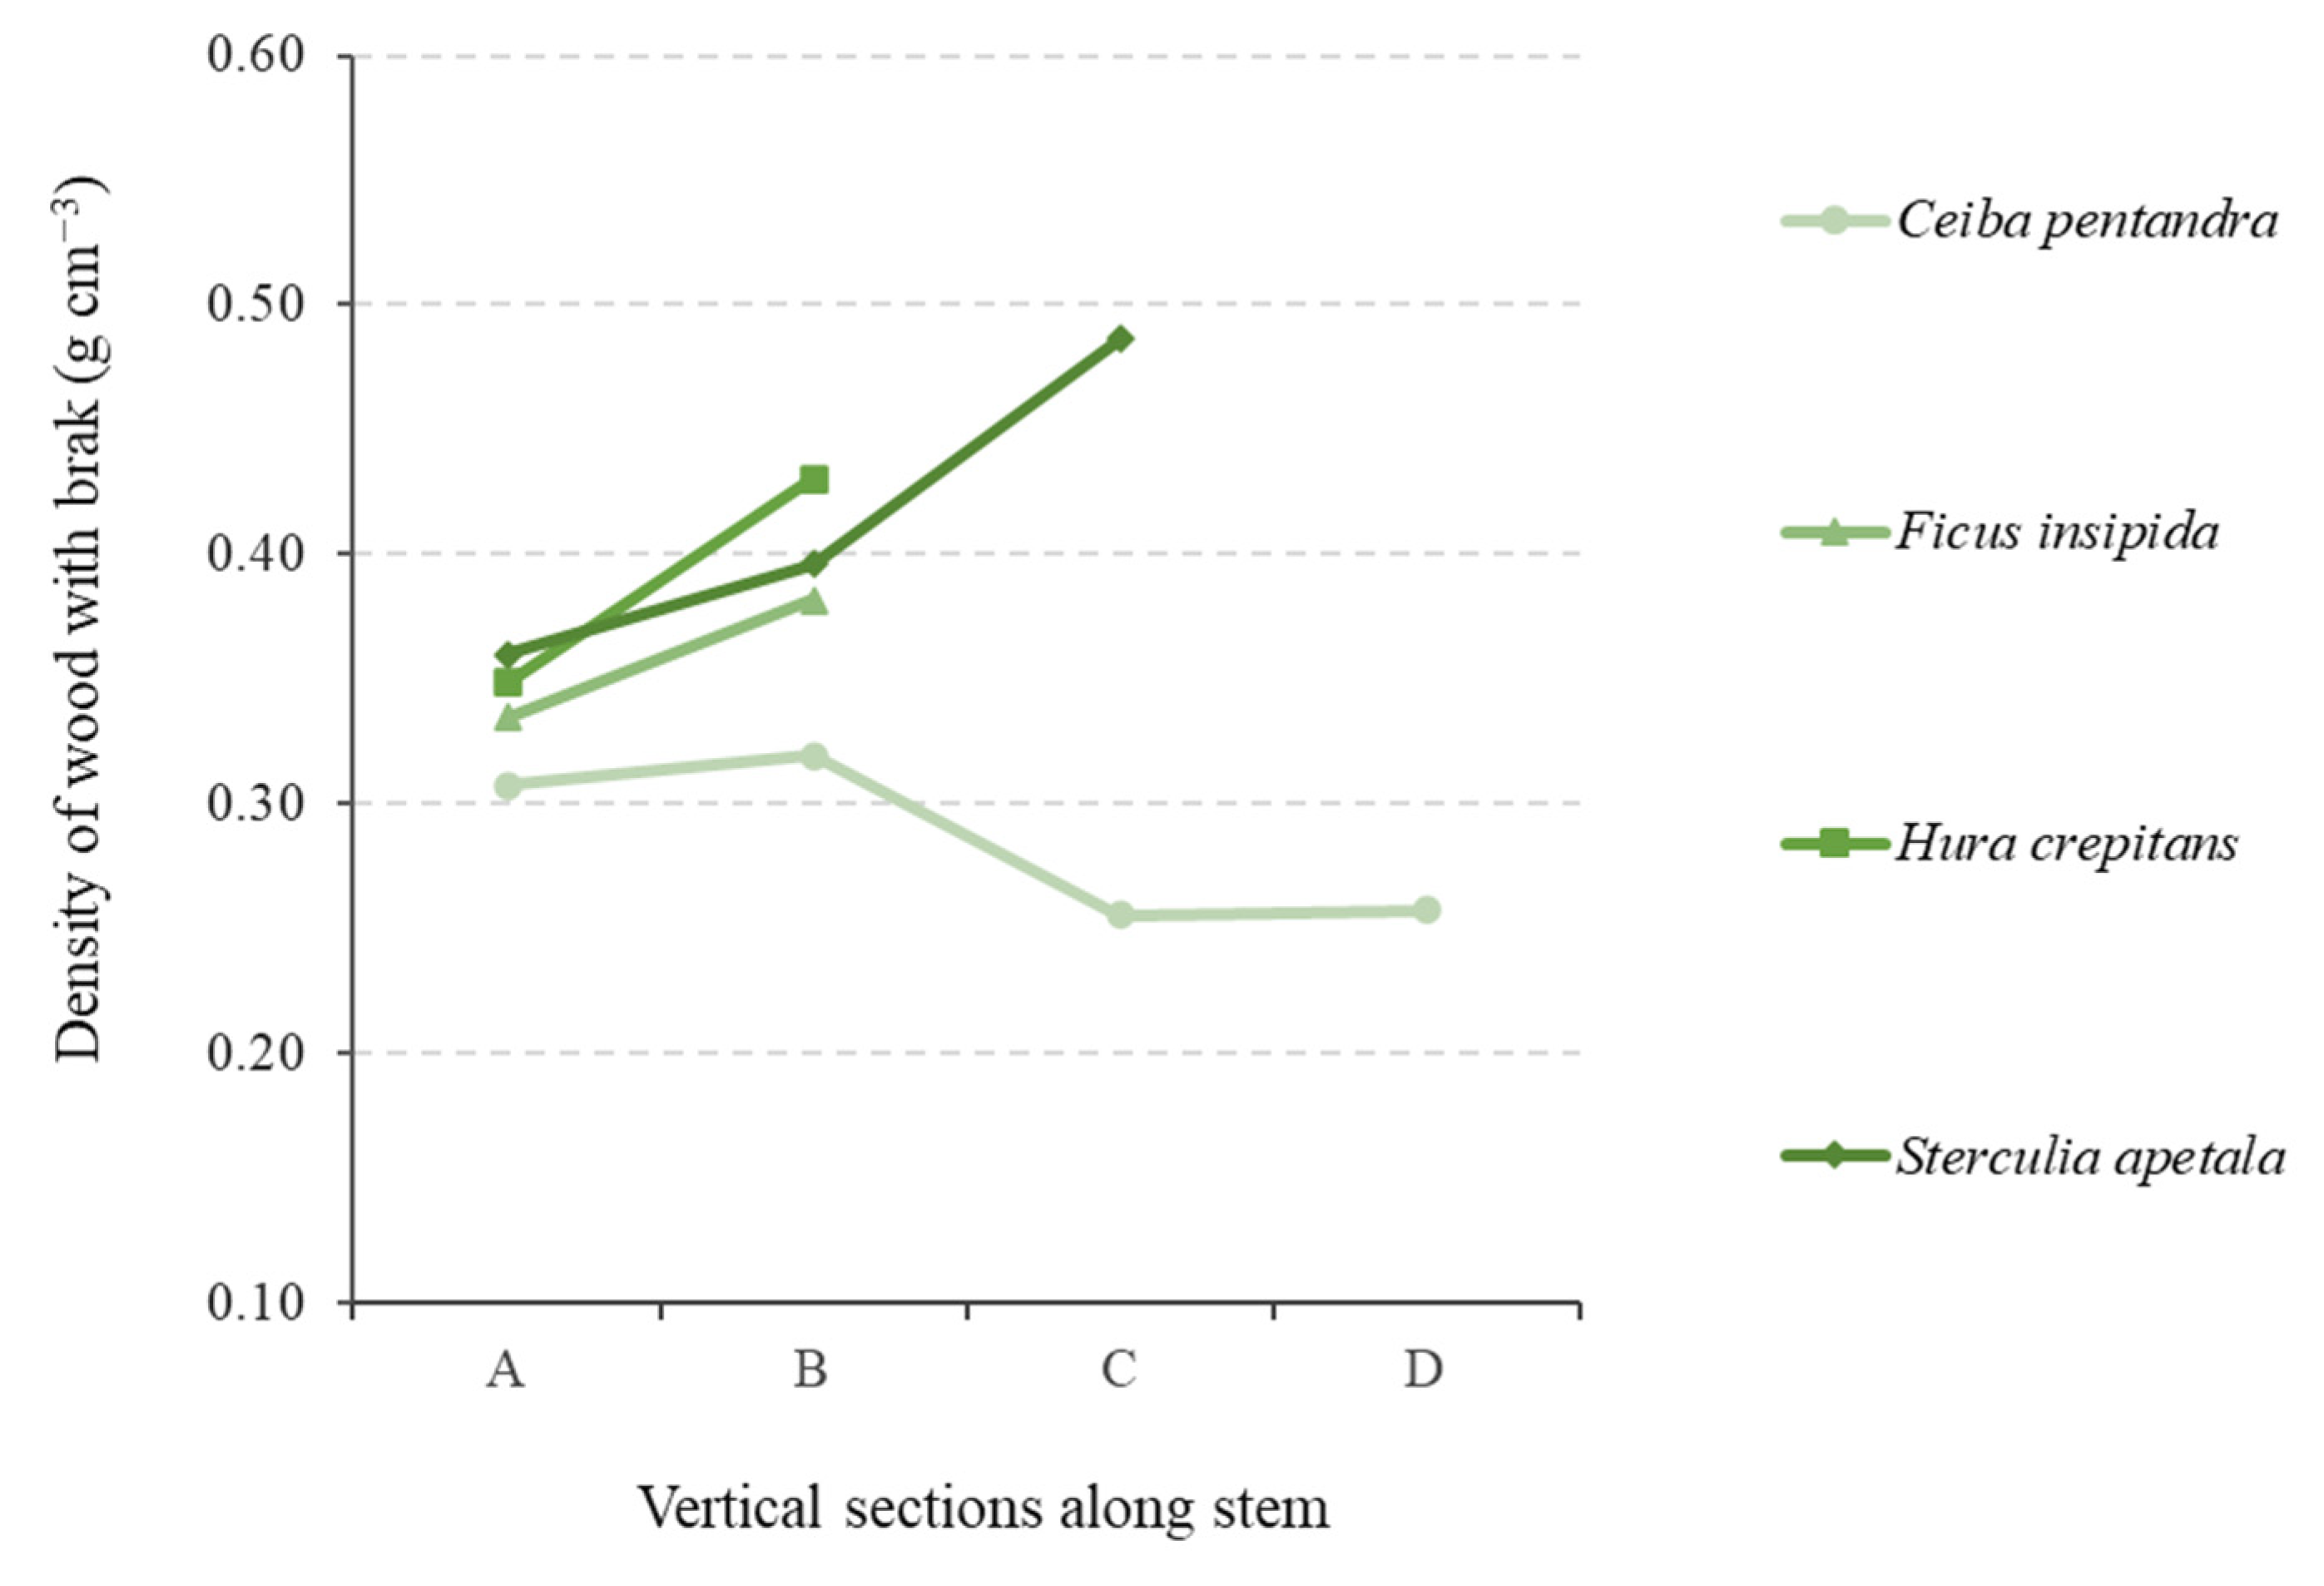
The patterns of vertical variability in the WD of the species evaluated in this study (Figure 4, Figure 5, and Figure 6) align with previous findings [3,41,44,45]. When grouped by wood type, low-density-wood species (typically pioneers or early secondary species) tend to increase their WD towards the tree canopy [3] These species have a short lifespan [49,50] and require high growth rates in their early growth stages [19,43,51], initially producing low-density wood but later producing denser wood as growth rates decrease to maintain structural stability [45,52]. In contrast, species in the high-density-wood category, represented by late-secondary and climax species, generally exhibit decreasing vertical variation profiles [6], where they initially produce a greater quantity of wood per unit volume and later this quantity decreases, contributing to a lower density at the top of the stem [45].
The two main sets of characteristics described above represent the extremes of a continuum of possibilities where the observed variations are complex and highly dependent on the functional and strategic characteristics of each species [41]. For example, species with intermediate characteristics, such as the medium-density-wood species in this study, exhibited vertical variations in WD that had increasing (Ceiba samauma), highly decreasing trends (Parkia paraensis), or even practically constant trends (Barnebydendron riedelii), making it challenging to obtain a typical pattern without considering an average.
Vertical variability may be related to radial variation in the stem, and when analyzed together, these types of variation can better explain the trends of many species [15,17,26,44]. It was not possible to analyze radial variations in the present study, but this does not bias the results on vertical variation because the samples were taken in the form of complete disks (heartwood, sapwood, and bark). Radial variations are also related to different life strategies [53] and can be explained by cambial age, growth-ring size, and the proportions of juvenile and mature wood, where these factors may change their proportions, increasing or decreasing with tree height [17,41,54,55] and thus also impacting vertical variation.
Vertical variation has been less studied than radial variation [17], especially for tropical forests. The current study of vertical variability in WD along the stem is therefore important both at the taxonomic level (species) and at the functional level (ecological groups) as it contributes to a better refinement of stem biomass estimates and of carbon accounting for tropical trees [3,17].
In this study, equations were developed to estimate the stem WD of trees with DBH ≥ 50 cm for 20 commercial species (Section 3.3). Regressions were run for each wood-type category, aiming to include the most significant variable ( ρ base) and the most practical variables for field measurement (d and h). For the three wood density categories evaluated (low, medium, and high), models with only the base WD ( ρ base) as a predictor variable provided the best fit for linear models to estimate the mean WD of the entire stem.
The findings show that ρ base explains more than 70% of the variations in all regressions (Table 7, Table 9 and Table 10, and Figure 7, Figure 9 and Figure 10). Diameter and height, although more convenient for field measurement, were not statistically significant to improve the model fit. Excluding this exception, the possible explanation for diameter and, especially, height not being significant variables is due to the lack of a consistent relationship between WD and tree size [56]. Some studies have found positive and negative correlations, but these correlations were weak [45,48,57,58], while others have found that these variables are largely independent [15,59,60]. Phillips et al. [56] stated that tree size is not a good indicator of WD, and therefore, tree dimensions (d and h) cannot be used to infer wood density. Therefore, for the equations developed in this study for the “all species” scenario, it is recommended to use those that had only ρ base as the predictor variable. These equations are valuable alternatives for normalizing basic stem wood density [3,50] since sampling entire trees to quantify WD along the stem, as performed in this study, is expensive and rarely conducted for practical applications [61], especially for large trees. Relying on approximate values for WD is often the only pragmatic way to obtain a more accurate estimate [62].
Nonlinear regressions were fitted with the variables d and h (Table 8 and Figure 8) to be used in the estimation of biomass and, consequently, carbon. These equations can be applied to extensive areas that have forest censuses. Equations that are based solely on WD at the base of the tree ( ρ base) as a predictor variable have greater utility for these censuses. The choice of equations provided in this study should be guided by the specific objectives of the researcher. Developing equations for different categories of the 20 species with similar characteristics and behaviors represents a significant advance in reducing uncertainties in forest biomass estimates.

5. Conclusions

The behavior of the vertical variation in basic wood density along the stem differs by wood type, where low-density-wood species increase in density with height, while medium- and high-density-wood species decrease. Considering only the WD at the stem base will therefore result in an underestimation of the basic stem density for low-density-wood species and overestimations for medium- and high-density-wood species. This vertical variation can be corrected by using the mentioned percentages or the equations developed in this study. The equations that best estimated the density of the stem were, for the most part, those that had only the base density as the predictor variable. Tree dimensions such as diameter and height are not good indicators for estimating wood density.
Correcting the vertical variability of wood density along the stem is necessary because even a small systematic bias, represented as a percentage, results in substantial errors in biomass and carbon stock estimates when applied on broad scales of forest resources at regional, national, or international levels, as is the case with the Amazon rainforest. Having wood density values closer to the actual (correct) values is crucial for more accurate estimates of carbon stocks, both in forests and in timber products.

Author Contributions

Conceptualization, F.M.B.R. and T.d.N.O.N.; formal analysis, F.M.B.R.; investigation, F.M.B.R., L.A.G.J., T.d.N.O.N. and P.M.F.; supervision, P.M.F.; writing—original draft, F.M.B.R.; writing—review and editing, L.A.G.J., E.B.B., R.B.d.C.L., J.S.d.H., E.F.R. and P.M.F. All authors have read and agreed to the published version of the manuscript.

Funding

This research was funded by Conselho Nacional de Desenvolvimento Científico e Tecnológico (CNPq312450/2021-4, 406941/2022-0), Rede Clima (FINEP/Rede Clima 01.13.0353-00), Coordenação de Aperfeiçoamento de Pessoal de Nível Superior ( CAPES) and INPA (PRJ15.125 & Programa PCI).

Data Availability Statement

The data presented in this study are available upon request to the corresponding author.

Acknowledgments

We thank Fox Laminados Ltda for allowing us to collect samples in their forest management area. F.M.B.R. thanks the Coordenação de Aperfeiçoamento de Pessoal de Nível Superior (CAPES) for a postdoctoral fellowship at the Federal University of Viçosa and INPA’s Programa de Capacitação Institucional (PCI) for a post-doctoral fellowship at INPA. T.d.N.O.N. thanks CAPES for a master’s fellowship at INPA in a program supported by the Conselho Nacional de Desenvolvimento Científico e Tecnológico (CNPq) and the Fundação de Amparo à pesquisa do Estado do Amazonas (FAPEAM).

Conflicts of Interest

The authors declare no conflicts of interest.

References

  1. de Lima, R.B.; Görgens, E.B.; da Silva, D.A.S.; de Oliveira, C.P.; Batista, A.P.B.; Ferreira, R.L.C.; Costa, F.R.C.; de Lima, R.A.F.; Aparício, P.d.S.; de Abreu, J.C.; et al. Giants of the Amazon: How does environmental variation drive the diversity patterns of large trees? Glob. Chang. Biol. 2023, 29, 4861–4879. [Google Scholar] [CrossRef] [PubMed]
  2. Nascimento, H.E.M.; Laurance, W.F. Total aboveground biomass in central Amazonian rainforests: A landscape-scale study. For. Ecol. Manag. 2002, 168, 311–321. [Google Scholar] [CrossRef]
  3. Lutz, J.A.; Furniss, T.J.; Johnson, D.J.; Davies, S.J.; Allen, D.; Alonso, A.; Anderson-Teixeira, K.J.; Andrade, A.; Baltzer, J.; Becker, K.M.L.; et al. Global importance of large-diameter trees. Glob. Ecol. Biogeogr. 2018, 27, 849–864. [Google Scholar] [CrossRef]
  4. Momo, S.T.; Ploton, P.; Martin-Ducup, O.; Lehnebach, R.; Fortunel, C.; Sagang, L.B.T.; Boyemba, F.; Couteron, P.; Fayolle, A.; Libalah, M.; et al. Leveraging signatures of plant functional strategies in wood density profiles of African trees to correct mass estimations from terrestrial laser data. Sci. Rep. 2020, 10, 2001. [Google Scholar] [CrossRef] [PubMed]
  5. Brazil., PR (Presidência da República). Lei No 11.284, de 2 de Março de 2006 Publicado No DOU No 43, de 03/03/2006; Diário Oficial da União: Brasília, DF, Brazil. 2006. Available online: https://www.planalto.gov.br/ccivil_03/_Ato2004-2006/2006/Lei/L11284.htm (accessed on 18 January 2024).
  6. Richardson, V.A.; Peres, C.A. Temporal decay in timber species composition and value in Amazonian Logging Concessions. PLoS ONE 2016, 11, e0159035. [Google Scholar] [CrossRef] [PubMed]
  7. Keith, H.; Lindenmayer, D.; MacIntosh, A.; MacKey, B. Under what circumstances do wood products from native forests benefit climate change mitigation? PLoS ONE 2015, 10, e0139640. [Google Scholar] [CrossRef] [PubMed]
  8. Baccini, A.; Walker, W.; Carvalho, L.; Farina, M.; Sulla-Menashe, D.; Houghton, R.A. Tropical forests are a net carbon source based on aboveground measurements of gain and loss. Science 2017, 358, 230–234. [Google Scholar] [CrossRef] [PubMed]
  9. Intergovernmental Panel on Climate Change (IPCC). Climate Change 2021: The Physical Science Basis. Contribution of Working Group I to the Sixth Assessment Report of the Intergovernmental Panel on Climate Change; Masson-Delmotte, V.P., Zhai, A., Pirani, S.L., Connors, C., Péan, S., Berger, N., Caud, Y., Chen, L., Goldfarb, M.I., Gomis, M., et al., Eds.; Cambridge University Press: Cambridge, UK, 2021; Available online: https://www.ipcc.ch/report/sixth-assessment-report-working-group-i/ (accessed on 18 January 2024).
  10. Chave, J.; Andalo, C.; Brown, S.; Cairns, M.A.; Chambers, J.Q.; Eamus, D.; Fölster, H.; Fromard, F.; Higuchi, N.; Kira, T.; et al. Tree allometry and improved estimation of carbon stocks and balance in tropical forests. Oecologia 2005, 145, 87–99. [Google Scholar] [CrossRef]
  11. Chave, J.; Muller-Landau, H.C.; Baker, T.R.; Easdale, T.A.; ter Steege, H.; Webb, C.O. Regional and phylogenetic variation of wood density across 2,456 neotropical tree species. Ecol. Appl. 2006, 16, 2356–2367. [Google Scholar] [CrossRef]
  12. Baker, T.R.; Phillips, O.L.; Malhi, Y.; Almeida, S.; Arroyo, L.; Di Fiore, A.; Erwin, T.; Killen, T.J.; Laurance, S.G.; Laurance, W.F.; et al. Variation in wood density determines spatial patterns in Amazonian forest biomass. Glob. Chang. Biol. 2004, 10, 545–562. [Google Scholar] [CrossRef]
  13. Goodman, R.C.; Phillips, O.L.; Baker, T.R. The importance of crown dimensions to improve tropical tree biomass estimates. Ecol. Appl. 2014, 24, 680–698. [Google Scholar] [CrossRef] [PubMed]
  14. Mukuralinda, A.; Kuyah, S.; Ruzibiza, M.; Ndoli, A.; Nabahungu, N.L.; Muthuri, C. Allometric equations, wood density and partitioning of aboveground biomass in the arboretum of Ruhande, Rwanda. Trees For. People 2021, 3, 100050. [Google Scholar] [CrossRef]
  15. Nogueira, E.M.; Nelson, B.W.; Fearnside, P.M. Wood density in dense forest in central Amazonia, Brazil. For. Ecol. Manag. 2005, 208, 261–286. [Google Scholar] [CrossRef]
  16. Malhi, Y.; Wood, D.; Baker, T.R.; Wright, J.; Phillips, O.L.; Cochrane, T.; Meir, P.; Chave, J.; Almeida, S.; Arroyo, L.; et al. The regional variation of aboveground live biomass in old-growth Amazonian forests. Glob. Chang. Biol. 2006, 12, 1107–1138. [Google Scholar] [CrossRef]
  17. Billard, A.; Bauer, R.; Mothe, F.; Colin, F.; Christine, D.; Longuetaud, F. Vertical variations in wood basic density for two softwood species. Eur. J. For. Res. 2021, 140, 1401–1416. [Google Scholar] [CrossRef]
  18. Zanne, A.E.; Lopez-Gonzalez, G.; Coomes, D.A.; Ilic, J.; Jansen, S.; Lewis, S.; Miller, R.B.; Swenson, N.G.; Wiemann, M.C.; Chave, J. Global Wood Density Database. Dryad Identifier 2009. [Google Scholar] [CrossRef]
  19. Chave, J.; Coomes, D.; Jansen, S.; Lewis, S.L.; Swenson, N.G.; Zann, A.E. Towards a worldwide wood economics spectrum. Ecol. Lett. 2009, 12, 351–366. [Google Scholar] [CrossRef]
  20. Mitchard, E.T.A.; Feldpausch, T.R.; Brienen, R.J.W.; Lopez-Gonzalez, G.; Monteagudo, A.; Baker, T.R.; Lewis, S.L.; Lloyd, J.; Quesada, C.A.; Gloor, M.; et al. Markedly divergent estimates of Amazon Forest carbon density from ground plots and satellites. Glob. Ecol. Biogeogr. 2014, 8, 935–946. [Google Scholar] [CrossRef] [PubMed]
  21. Melo, A.W.F.D. Alometria de Árvores e Biomassa Florestal na Amazônia Sul-Ocidental. Ph.D. Thesis, Tropical Forest Sciences, Instituto Nacional de Pesquisas da Amazônia (INPA), Manaus, Amazonas, Brazil, 2017; 156p. Available online: https://repositorio.inpa.gov.br/handle/1/4997 (accessed on 18 January 2024).
  22. Muller-Landau, H.C. Interspecific and intersite variation in wood density of tropical trees. Biotropica 2004, 36, 20–32. [Google Scholar] [CrossRef]
  23. Van Gelder, H.A.; Poorter, L.; Sterck, F.J. Wood mechanics, allometry, and life-history variation in a tropical rain forest tree community. New Phytol. 2006, 171, 367–378. [Google Scholar] [CrossRef]
  24. Wiemann, M.C.; Williamson, G.B. Biomass Determination Using Wood Specific Gravity from Increment Cores; General Technical Report FPL-GTR-225; Department of Agriculture, Forest Service, Forest Products Laboratory: Madison, WI, USA, 2013; 7p. [Google Scholar]
  25. Wiemann, M.C.; Williamson, G.B. Wood specific gravity variation with height and its implications for biomass estimation. USDA Forest Service, Forest Products Laboratory. Res. Pap. 2014, 677, 1–12. [Google Scholar] [CrossRef]
  26. Chiu, H.S.; Guo, W.; Spiecker, H. Analysis of wood density profiles of tree stems: Incorporating vertical variations to optimize wood sampling strategies for density and biomass estimations. Trees 2015, 29, 551–561. [Google Scholar] [CrossRef]
  27. Billard, A.; Bauer, R.; Mothe, F.; Jonard, M.; Colin, F.; Longuetaud, F. Improving aboveground biomass estimates by taking into account density variations between tree components. Ann. For. Sci. 2020, 77, 103. [Google Scholar] [CrossRef]
  28. Schmitt, A.R.K. Variação Geográfica e Intraespecífica da Densidade Básica da Madeira do Gênero Eschweilera (E. coriacea e E. truncata) No Estado Do AMAZONAS. Master’s Dissertation, Tropical Forest Sciences, Instituto Nacional de Pesquisas da Amazônia (INPA), Manaus, Amazonas, Brazil, 2017; 56p. [Google Scholar]
  29. Selivon, C.A. Plano de Operação Anual-POA; UPA-002; Fazenda Antimari I e II: Rio Branco, Acre, Brazil, 2014; 94p. [Google Scholar]
  30. Achard, F.H.; Stibig, F.; Eva, H.; Mayaux, P. Tropical forest cover monitoring in the humid tropics: TREES project. Trop. Ecol. 2002, 43, 9–20. [Google Scholar]
  31. Alvares, C.A.; Stape, J.L.; Sentelhas, P.C.; Gonçalves, J.L.d.M.; Sparovek, G. Koppen’s climate classification map for Brazil. Meteorol. Z. 2013, 22, 711–728. [Google Scholar] [CrossRef]
  32. Instituto Nacional de Meteorologia (INMET). Banco de Dados Meteorológicos para Ensino e Pesquisa. Available online: http://www.inmet.gov.br (accessed on 18 January 2024).
  33. Duarte, A.F. Aspectos da climatologia do Acre, Brasil, com base no intervalo 1971 2000. Rev. Bras. Meteorol. 2006, 21, 308–317. [Google Scholar]
  34. Instituto Brasileiro de Geografia e Estatística (IBGE). Mapas Temáticos: Solos Estaduais/Acre. 2005. Available online: https://mapas.ibge.gov.br/tematicos/solos.html (accessed on 18 January 2024).
  35. Reflora. Flora do Brasil 2020 em Construção. Jardim Botânico do Rio de Janeiro, Rio de Janeiro, RJ, Brazil. 2021. Available online: http://floradobrasil.jbrj.gov.br/ (accessed on 14 January 2024).
  36. Soares, C.P.B.; Neto, P.F.; Souza, L.A. Dendrometria e Inventário Florestal, 2nd ed.; Editora da Universidade Federal de Viçosa (UFV): Viçosa, Minas Gerais, Brazil, 2011; 272p. [Google Scholar]
  37. Associação Brasileira de Normas Técnicas (ABNT). NBR 11941: Madeira—Determinação da Densidade Básica; Associação Brasileira de Normas Técnicas (ABNT): Rio de Janeiro, Brazil, 2003; 6p. [Google Scholar]
  38. Silva, H.F.; Ribeiro, S.C.; Botelho, A.S.; Faria, R.A.V.B.; Teixera, M.B.R.; Mello, J.M. Estimativa do estoque de carbono por métodos indiretos em área de restauração florestal em Minas Gerais. Sci. For. 2015, 43, 943–953. [Google Scholar] [CrossRef]
  39. Laboratório de Produtos Florestais (LPF). Banco de Dados Madeiras Brasileiras. Available online: https://lpf.florestal.gov.br/pt-br/banco-de-dados-madeiras-brasileiras-selecao (accessed on 18 January 2024).
  40. Campos, J.C.C.; Leite, H.G. Mensuração Florestal: Perguntas e Respostas, 5th ed.; UFV, Ed.; Atual. e Ampl.: Viçosa, Minas Gerais, Brazil, 2017; 636p. [Google Scholar]
  41. Longuetaud, F.; Mothe, F.; Santenoise, P.; Diop, N.; Dlouha, J.; Fournier, M.; Deleuze, C. Patterns of within-stem variations in wood specific gravity and water content for five temperate tree species. Ann. For. Sci. 2017, 74, 64. [Google Scholar] [CrossRef]
  42. Reis, P.C.M.D.R.; Reis, L.P.; Souza, A.L.D.; Carvalho, A.M.M.L.; Mazzei, L.; Reis, A.R.S.; Torres, C.M.M.E. Agrupamento de espécies madeireiras da Amazônia com base em propriedades físicas e mecânicas. Ciência Florest. 2019, 29, 336–346. [Google Scholar] [CrossRef]
  43. Poorter, L.; Wright, S.J.; Paz, H.; Ackerly, D.D.; Condit, R.; Ibarra-Manríquez, G.; Harms, K.E.; Licona, J.C.; Martínez-Ramos, M.; Mazer, S.J.; et al. Are functional traits good predictors of demographic rates? Evid. Five Neotrop. Forests. Ecol. 2008, 89, 1908–1920. [Google Scholar] [CrossRef]
  44. Henry, M.; Besnard, A.; Asante, W.A.; Eshun, J.; Adu-Bredu, S.; Valentini, R.; Bernoux, M.; Saint-André, L. Wood density, phytomass variations within and among trees, and allometric equations in a tropical rainforest of Africa. For. Ecol. Manag. 2010, 260, 1375–1388. [Google Scholar] [CrossRef]
  45. Larjavaara, M.; Muller-Landau, H.C. Rethinking the value of high wood density. Funct. Ecol. 2010, 24, 701–705. Available online: http://www.jstor.org/stable/40863567 (accessed on 18 January 2024). [CrossRef]
  46. Becker, G.S.; Braun, D.; Gliniars, R.; Dalitz, H. Relations between wood variables and how they relate to tree size variables of tropical African tree species. Trees 2012, 26, 1101–1112. [Google Scholar] [CrossRef]
  47. Díaz, S.; Hector, A.; Wardle, D.A. Biodiversity in forest carbon sequestration initiatives: Not just a side benefit. Curr. Opin. Environ. Sustain. 2009, 1, 55–60. [Google Scholar] [CrossRef]
  48. Nave, L.E.; Walters, B.F.; Hofmeister, K.L.; Perry, C.H.; Mishra, U.; Domke, G.M.; Swanston, C.W. The role of reforestation in carbon sequestration. New For. 2019, 50, 115–137. [Google Scholar] [CrossRef]
  49. Heinrich, V.H.A.; Dalagnol, R.; Cassol, H.L.G.; Rosan, T.M.; de Almeida, C.T.; Junior, C.H.L.S.; Campanharo, W.A.; House, J.I.; Sitch, S.; Hales, T.C.; et al. Large carbon sink potential of secondary forests in the Brazilian Amazon to mitigate climate change. Nat. Commun. 2021, 12, 1785. [Google Scholar] [CrossRef]
  50. Budowski, G.N. Distribution of tropical American rain forest species in the light of succession processes. Turrialba 1965, 15, 40–42. [Google Scholar]
  51. Maciel, M.D.N.M.; Watzlawick, L.F.; Schoeninger, E.R.; Yamaji, F.M. Classificação ecológica das espécies arbóreas. Rev. Acadêmica Ciência Anim. 2003, 1, 69–78. [Google Scholar] [CrossRef]
  52. Poorter, L.; McDonald, I.; Alarcón, A.; Fichtler, E.; Licona, J.; Peña-Claros, M.; Sterck, F.; Villegas, Z.; Sass-Klaassen, U. The importance of wood traits and hydraulic conductance for the performance and life history strategies of 42 rainforest tree species. New Phytol. 2010, 185, 481–492. [Google Scholar] [CrossRef]
  53. Bastin, J.-F.; Fayolle, A.; Tarelkin, Y.; Bulcke, J.V.D.; de Haulleville, T.; Mortier, F.; Beeckman, H.; Van Acker, J.; Serckx, A.; Bogaert, J.; et al. Wood specific gravity variations and biomass of central African tree species: The simple choice of the outer wood. PLoS ONE 2015, 10, e0142146. [Google Scholar] [CrossRef]
  54. Hietz, P.; Valencia, R.; Wright, J.S. Strong radial variation in wood density follows a uniform pattern in two neotropical rain forests. Funct. Ecol. 2013, 27, 684–692. [Google Scholar] [CrossRef]
  55. Chowdhury, M.Q.; Khan, M.R.; Mehedi, M.A.H. Wood density variation in four plantation species growing in Bangladesh. J. Indian Acad. Wood Sci. 2013, 10, 32–38. [Google Scholar] [CrossRef]
  56. Phillips, O.L.; Sullivan, M.J.; Baker, T.R.; Mendoza, A.M.; Vargas, P.N.; Vásquez, R. Species matter: Wood density influences tropical forest biomass at multiple scales. Surv. Geophys. 2019, 40, 913–935. [Google Scholar] [CrossRef] [PubMed]
  57. Kunstler, G.; Falster, D.; Coomes, D.A.; Hui, F.; Kooyman, R.; Laughlin, D.C.; Poorter, L.; Vanderwel, M.; Vieilledent, G.; Wright, S.J.; et al. Plant functional traits have globally consistent effects on competition. Nature 2016, 529, 204–207. [Google Scholar] [CrossRef] [PubMed]
  58. Weber, J.C.; Montes, C.S.; Abasse, T.; Sanquetta, C.R.; Silva, D.A.; Mayer, S.; Muñiz, G.I.B.; Garcia, R.A. Variation in growth, wood density and carbon concentration in five tree and shrub species in Niger. New For. 2018, 49, 35–51. [Google Scholar] [CrossRef]
  59. de Souza, F.C.; Dexter, K.G.; Phillips, O.L.; Brienen, R.J.W.; Chave, J.; Galbraith, D.R.; Gonzalez, G.L.; Mendoza, A.M.; Pennington, R.T.; Poorter, L.; et al. Evolutionary heritage influences Amazon tree ecology. Proc. R. Soc. B Biol. Sci. 2016, 283, 20161587. [Google Scholar] [CrossRef]
  60. Hietz, P.; Rosner, S.; Hietz-Seifert, U.; Wright, S.J. Wood traits related to size and life history of trees in a Panamanian rainforest. New Phytol. 2017, 213, 170–180. [Google Scholar] [CrossRef] [PubMed]
  61. Demol, M.; Calders, K.; Moorthy, S.M.K.; Van den Bulcke, J.; Verbeeck, H.; Gielen, B. Consequences of vertical basic wood density variation on the estimation of aboveground biomass with terrestrial laser scanning. Trees 2021, 35, 671–684. [Google Scholar] [CrossRef]
  62. Williamson, G.B.; Wiemann, M.C. Measuring wood specific gravity correctly. Am. J. Bot. 2010, 97, 519–524. [Google Scholar] [CrossRef]
Figure 1. Location of the study area in the Antimary I and II ranches in the Porto Acre municipality, Acre state, within an annual production unit of 1253.02 ha.
Forests 15 00734 g001
Figure 2. Sampling of wood disks removed along the commercial bole.
Forests 15 00734 g002
Figure 3. WD of 20 tree species from the southwestern Brazilian Amazon. ● represents the mean and ʘ represents individual observations. The 95% confidence interval for the mean is indicated, which was calculated using individual standard deviations. Species: 1—Albizia niopoides (Spruce ex Benth., Burkart); 2—Apuleia leiocarpa (Vogel, J.F. Macbr.); 3—Astronium lecointei (Ducke); 4—Barnebydendron riedelii (Tul., J.H. Kirkbr.); 5—Castilla ulei (Warb.).; 6—Cedrela odorata (L.); 7—Ceiba pentandra (L., Gaertn.); 8—Ceiba samauma (Mart., K. Schum.); 9—Copaifera multijuga (Hayne); 10—Dipteryx odorata (Aubl., Willd.); 11—Eschweilera bracteosa (Poepp. Ex O. Berg, Miers); 12—Eschweilera grandiflora (Aubl., Sandwith); 13—Ficus insipida (Willd.); 14—Handroanthus serratifolius (Vahl., S. Grose); 15—Hura crepitans (L.); 16—Hymenaea courbaril (L.); 17—Parkia paraensis (Ducke); 18—Schizolobium parahyba var. amazonicum (H. ex D.) B.; 19—Sterculia apetala (Jacq., H. Karst.); 20—Terminalia tetraphylla (Aubl., Gere & Boatwr.).
Forests 15 00734 g003
Figure 4. Vertical variation in the WD for species with “low-density” wood.
Forests 15 00734 g004
Figure 5. Vertical variation in the WD for species with “medium-density” wood.
Forests 15 00734 g005
Figure 6. Vertical variation in the WD for high-density-wood species.
Forests 15 00734 g006
Figure 7. Linear models: graphical analysis of the equations fitted for the WD of the stems of large individuals of 20 commercial species. The models include species in all wood density categories (low, medium, and high).
Forests 15 00734 g007
Figure 8. Nonlinear models: graphical analysis of the equations fitted for the WD of the stems of large individuals of 20 commercial species. The models include species of all wood density categories (low, medium, and high).
Forests 15 00734 g008
Figure 9. Graphical analysis of equations for low- and medium-density-wood species fitted for the stem WD of large individuals of commercial species.
Forests 15 00734 g009
Figure 10. Graphical analysis of equations for high-density-wood species fitted for the stem WD of large individuals of commercial species.
Forests 15 00734 g010
Table 1. Categories and criteria describing wood types based on basic wood density (WD).
CategoryCriterion
Low densityWD of the stem ≤ 0.40 g cm−3
Medium densityWD of the stem 0.41–0.60 g cm−3.
High densityWD of the stem ≥ 0.61 g cm−3
Table 2. Linear and nonlinear regression models to estimate the WD of the stem.
Model NameStatistical ModelType
Linear model
Model 1 ρ s t e m = β 0 + β 1 ρ b a s e + ε Simple linear regression
Model 2 ρ s t e m = β 0 + β 1 d + β 2 ρ b a s e + ε Multiple linear regression
Model 3 ρ s t e m = β 0 + β 1 d + β 2 h + β 3 ρ b a s e + ε Multiple linear regression
Nonlinear model
Model 1 ρ s t e m = β 0 × d β 1 × ε Simple nonlinear regression
Model 2 ρ s t e m = β 0 × d β 1 × h β 2 × ε Multiple nonlinear regression
β0, β1, and β2 refer to the coefficients of the equation and ε to the error; ρ s t e m = the WD of the entire stem; ρ b a s e = WD at the stem base; d = the diameter at breast height; and h = the commercial height.
Table 3. Mean WD (g cm−3) by sample position along the stem and wood type: T = overall mean 1 of all sections; I = mean 1 at the base of the stem 2; F = mean 1 of the final vertical section 3.
Basic DensitySpecies Group
Low DensityMedium DensityHigh DensityTotals
n x ¯ ± SDCI 95%n x ¯ ± SDCI 95%n x ¯ ± SDCI 95%n x ¯ ± SDCI 95%
T 200.346 ± 0.0560.320–0.3721140.458 ± 0.0680.445–0.470900.738 ± 0.0750.722–0.7532240.560 ± 0.1640.539–0.582
I200.338 ± 0.0590.310–0.3661140.477 ± 0.0920.460–0.494900.756 ± 0.0960.736–0.7752240.576 ± 0.1770.553–0.600
F200.354 ± 0.0670.323–0.3861140.441 ± 0.0860.425–0.457900.725 ± 0.0710.710–0.7392240.547 ± 0.1670.525–0.569
1 is the arithmetic mean; 2 represents Section A; 3 refers to the last section sampled along the stem, which could be Section B, C, or D depending on the species; n refers to the number of tree samples; x ¯ is the arithmetic mean; SD is the standard deviation; and CI is the 95% confidence interval.
Table 4. Relative difference (for low-density-wood species) between the WD at the stem base and in the last 1 sampled stem section.
SpeciesnVertical Variation (%)
Ceiba pentandra5−16.24 2
Ficus insipida.414.18
Hura crepitans.623.50
Sterculia apetala535.08
1 This refers to the last section sampled along the stem, which can be Section B, C, or D depending on the species. 2 The negative value indicates a decrease in density along the stem (Figure 4).
Table 5. Relative difference (for medium-density-wood species) between the average WD at the stem base and in the last 1 sampled stem section.
SpeciesnVertical Variation (%)
Barnebydendron riedelii5−2.60 2
Castilla ulei37−2.79 2
Cedrela odorata83.13
Ceiba samauma.226.18
Copaifera multijuga6−2.64 2
Parkia paraenses20−36.31 2
Schizolobium parahyba var. amazonicum16−34.79 2
1 Refers to the last section sampled along the stem, which can be Section B, C, or D depending on the species; 2 Negative values indicate a decrease in density along the stem (Figure 5).
Table 6. Relative difference for species in the high-density-wood category between the average WD at the stem base and in the last 1 sampled stem section.
SpeciesnVertical Variation (%)
Albizia niopoides7−7.96 2
Apuleia leiocarpa13−7.50 2
Astronium leicointei6−7.85 2
Dipteryx odorata11−7.64 2
Eschweilera bracteosa159.23
Eschweilera grandiflora13−7.08 2
Handroanthus serratifolius8−2.71 2
Hymenaea courbari8−2.71 2
Terminalia tetraphylla92.64 2
1 Refers to the last section sampled along the stem, which can be Section B, C, or D depending on the species; 2 Negative values indicate a decrease in density along the stem (Figure 6).
Table 7. Linear regression model general equation (including all species in the different wood density categories (low, medium, and high)): coefficients and evaluation criteria of the linear equations for estimating the WD of the stems of large individuals of commercial species.
ModelnCoefficientp-ValueR2 %RMSEAICMADCV
1224b00.0459300.00092.470.04499−747.690.030299375.41
b10.8922110.000
2224b00.0363620.03092.490.04493−746.220.030425425.43
b10.0001060.467
b20.8941520.000
3224b00.0330160.05692.510.04487−208.800.030436745.43
b10.0000700.643
b20.0006930.419
b30.8869290.000
Table 8. Nonlinear regression model general equation (including species in all wood density categories (low, medium, and high)): coefficients and evaluation criteria of the linear equations for estimating the WD of the stems of large individuals of 20 commercial species.
ModelnCoefficientp-ValueRSMEAICMAD
1224b01.079770.006130.1634−171.830.1439071
b1−0.150890.07117
2224b00.430920.003480.1461−220.970.1208498
b1−0.247700.00101
b20.499380.0000
Table 9. Low- and medium-density-wood equation: coefficients and criteria for evaluating linear equations for estimating the WD of the stems of large individuals of commercial species.
ModelnCoefficientp-ValueR2 %RQEMAICMADCV
1134b00.146210.00070.810.041616−465.760.032856667.45
b10.646710.000
2134b00.153000.00070.840.041593−208.810.032754387.42
b1−0.000060.703
b20.643200.000
3134b00.152700.00070.840.041592−208.800.032761337.42
b1−0.000070.706
b20.000040.970
b30.643000.000
Table 10. Equations for high-density-wood species: coefficients and criteria for evaluating linear equations for estimating the WD of the stems of large individuals of commercial species.
ModelnCoefficientp-ValueR2 %RSMEAICMADCV
190b00.192120.00085.610.028115−381.450.0202962.751
b10.721770.000
290b00.17993790.00085.850.027883−208.810.0203262.75
b10.00019530.231
b20.71788090.000
390b00.17928100.00085.870.027866−208.810.02031032.753
b10.00018000.291
b20.00027030.746
b30.71432000.000
Disclaimer/Publisher’s Note: The statements, opinions and data contained in all publications are solely those of the individual author(s) and contributor(s) and not of MDPI and/or the editor(s). MDPI and/or the editor(s) disclaim responsibility for any injury to people or property resulting from any ideas, methods, instructions or products referred to in the content.

