Article

Phytophthora Communities Associated with Agathis australis (kauri) in Te Wao Nui o Tiriwa/Waitākere Ranges, New Zealand

1
George Mason Centre for the Natural Environment, University of Auckland, Auckland 1010, New Zealand
2
The New Zealand Institute for Plant & Food Research Limited, Mt Albert Research Centre, Auckland 1025, New Zealand
3
The New Zealand Institute for Plant & Food Research Limited, Havelock North 4157, New Zealand
4
School of Biological Sciences, University of Auckland, Auckland 1010, New Zealand
5
Department of Primary Industries and Regional Development, Perth, WA 6000, Australia
*
Author to whom correspondence should be addressed.
Forests 2024, 15(5), 735; https://doi.org/10.3390/f15050735
Submission received: 7 March 2024 / Revised: 14 April 2024 / Accepted: 16 April 2024 / Published: 23 April 2024
(This article belongs to the Section Forest Ecology and Management)

Abstract

:
Studies of Phytophthora impact in forests generally focus on individual species without recognition that Phytophthora occur in multispecies communities. This study investigated community structure of Phytophthora species in the rhizosphere of Agathis australis (kauri) in Te Wao Nui o Tiriwa/Waitākere Ranges, New Zealand, in the context of kauri dieback disease expression. Soil sampling and tree monitoring were conducted on 767 randomly selected mature kauri trees. Phytophthora species were detected using both soil baiting and DNA metabarcoding of environmental DNA (eDNA). Four species were detected with soil baiting (P. agathidicida, P. cinnamomi, P. multivora, and P. pseudocryptogea/P. cryptogea) and an additional three species with metabarcoding (P. kernoviae, P. cactorum/P. aleatoria and an unknown clade 7 species). Phytophthora cinnamomi was the most abundant species and was distributed throughout the forest. Both P. multivora and P. agathidicida were limited to forest edges, suggesting more recent introductions. P. agathidicida presence was strongly correlated with declining canopy health, confirming its role as the main driver of kauri dieback. The limited distribution of P. agathidicida and infrequent detections (11.0% samples) suggests that that this species is spreading as an introduced invasive pathogen and provide hope that with strategic management (including track upgrades and closures, restricting access to uninfected areas, and continual monitoring) uninfected areas of the forest can be protected. The frequent detections of P. cinnamomi and P. multivora from symptomatic trees in the absence of P. agathidicida suggest more research is needed to understand their roles in kauri forest health.

1. Introduction

Phytophthora species are increasingly associated with the decline of forest ecosystems around the world and are often responsible for causing serious plant disease [1,2,3]. Considerable research on these issues has been focused on the single and invasive species implicated in these diseases. However, Phytophthora typically occur in forests as multispecies communities often including both native and invasive species [4,5]. Despite increasing knowledge about the diversity and cooccurrence of Phytophthora species in forest ecosystems [6,7,8,9,10], little is known about how these species might act together in communities.
Phytophthora species are associated with several diseases of foundation forest trees, such as oak (Quercus spp.) [11] and beech (Fagus sylvatica L.) [12] in Europe and jarrah (Eucalyptus marginata Donn ex Smith) in Australia [13,14]. Phytophthora diseases of these foundation tree species threaten whole ecosystems, and the consequences of losing many trees are hard to predict [15]. In New Zealand (NZ), the foundation tree species Agathis australis (D.Don) Lindl. (kauri) is under threat from dieback caused by Phytophthora agathidicida [16].
Phytophthora agathidicida invades the root system of kauri, disrupting the vascular tissue, causing resin ‘bleeding’ around the root collar and lower trunk, yellowing of the leaves, and crown decline, often leading to death [17,18]. To date, the origin of P. agathidicida is unknown; it has only been found in NZ but has characteristics of an introduced species, e.g., extremely low genetic diversity [16]. Recent research on the molecular clock of P. agathidicida suggests it may have been introduced to NZ prior to 1945 [19].
Kauri is the longest-lived and largest tree species in NZ and the only indigenous member of the ancient conifer family Araucariaceae in the country [20]. The natural distribution of kauri is limited to the northern North Island. Due to extensive past disturbance and milling, less than 1% (7500 ha) of old-growth kauri forests present at the time of European settlement remains [21]. In addition, there are approximately 60,000 ha of regenerating stands across the upper North Island, much of which are now protected [22]. A significant stand of kauri forest (over 17,000 ha) occurs in Te Wao Nui o Tiriwa (the Great Forest of Tiriwa)/Waitākere Ranges Regional Park (WRRP), situated west of the most populous city in NZ, Auckland. Kauri is a key flagship species for conservation and a valuable aspect of NZ tourism and recreation. Kauri are a sacred (taonga) species to Māori (indigenous) people and are revered for their importance culturally and for their role as a foundation species in their ecosystem [23,24].
Phytophthora agathidicida was first detected on North Island in Te Wao Nui o Tiriwa/Waitākere Ranges in 2006; it was isolated from the margin of bleeding lesions on symptomatic trees [17]. Kauri health in association with P. agathidicida was first monitored there in 2010 and 2011 and showed a high prevalence of kauri dieback, with about 7.9% of surveyed kauri affected. A follow-up survey conducted in 2017 raised concerns with respect to how far the disease and pathogen had spread [25]. In response to this discovery, a landscape scale rāhui (cultural restriction excluding forest access) was put in place over Te Wao Nui o Tiriwa/Waitākere Ranges in 2017 by the local indigenous people, Te Kawerau ā Maki, responsible for the land [25]. The rāhui was focused on minimising the risk of spreading P. agathidicida until more information on the extent of the pathogen distribution was available and appropriate risk mitigation measures were in place. This placed a temporary ritual prohibition on the area and restricted access to the forest to separate people from things that are tapu (sacred or prohibited). The rāhui involved track closures and prevented public access to remote areas of the forest. In response to the rāhui, Auckland Council, in partnership with Te Kawerau ā Maki, implemented a further forest-wide survey in 2021 to determine the extent of kauri decline and the extent of P. agathidicida infestation throughout WRRP. This study is part of this survey.
The soils around kauri are typically acidic with limited fertility due to the buildup of deep litter layers and excessive leaching (podsolisation) [21]. As a result, distinctive communities of plants [26] and microbes [27] are associated with kauri. Not only is the kauri ecosystem distinct, but it is also highly diverse [28]. The loss of kauri from kauri dieback will likely lead to the decline and/or loss of these distinctive and diverse ecosystems.
Several Phytophthora species have previously been detected from kauri forests using a traditional soil baiting method [29] and through baiting waterways [30]. In addition to P. agathidicida; P. cinnamomi Rands, P. cryptogea Pethybr. and Laff., P. multivora P.M. Scott and T. Jung, P. nicotianae Breda de Haan, P. chlamydospora Brasier and E.M. Hansen, and P. kernoviae Brasier, Beales and S.A. Kirk have been isolated from kauri forest soils [13,17,18,31,32,33]. Phytophthora gonapodyides (H.E. Petersen) Buisman, P. chlamydospora, P. asparagi Saude and Hausbeck, P. kernoviae, P. amnicola T.I. Burgess and T. Jung and an unknown clade six species called P. sp ”Waitākere” have been previously detected in waterways of the Waitākere Ranges [30,33]. Analysis of the pathogenicity of P. agathidicida, P. cinnamomi, P. multivora, and P. cryptogea has shown that P. agathidicida is significantly more pathogenic to kauri than other Phytophthora species [34]. However, these and other pathogens, including, but not limited to Phytophthora species may be contributing factors in kauri decline.
The use of Environmental DNA (eDNA) and metabarcoding have been used more recently to survey for Phytophthora species from water and soil in natural ecosystems and urban or other anthropogenically-disturbed environments worldwide [35,36,37,38]. Using these methods, natural ecosystems consistently yield greater numbers of Phytophthora species compared to non-native ecosystems [35,36,39]. Environmental DNA and metabarcoding methods typically detect more species than traditional baiting and plating methods [38,39,40]. This is most likely because they can detect unculturable species or those with low pathogenicity and can deal with low levels of inoculum [40]. In NZ kauri forests, eDNA and metabarcoding have been used to detect fungi and bacteria present in the soil around healthy and diseased kauri trees [41], but it has not yet been used to detect Phytophthora species. The current study is the first time eDNA and metabarcoding have been used to survey Phytophthora species in NZ forests.
The aim of this study was to investigate Phytophthora communities associated with healthy and symptomatic kauri in Te Wao Nui o Tiriwa/Waitākere Ranges, NZ, using both soil baiting and eDNA analysis and to compare the association of Phytophthora species with kauri dieback and detection rates between methods.

2. Materials and Methods

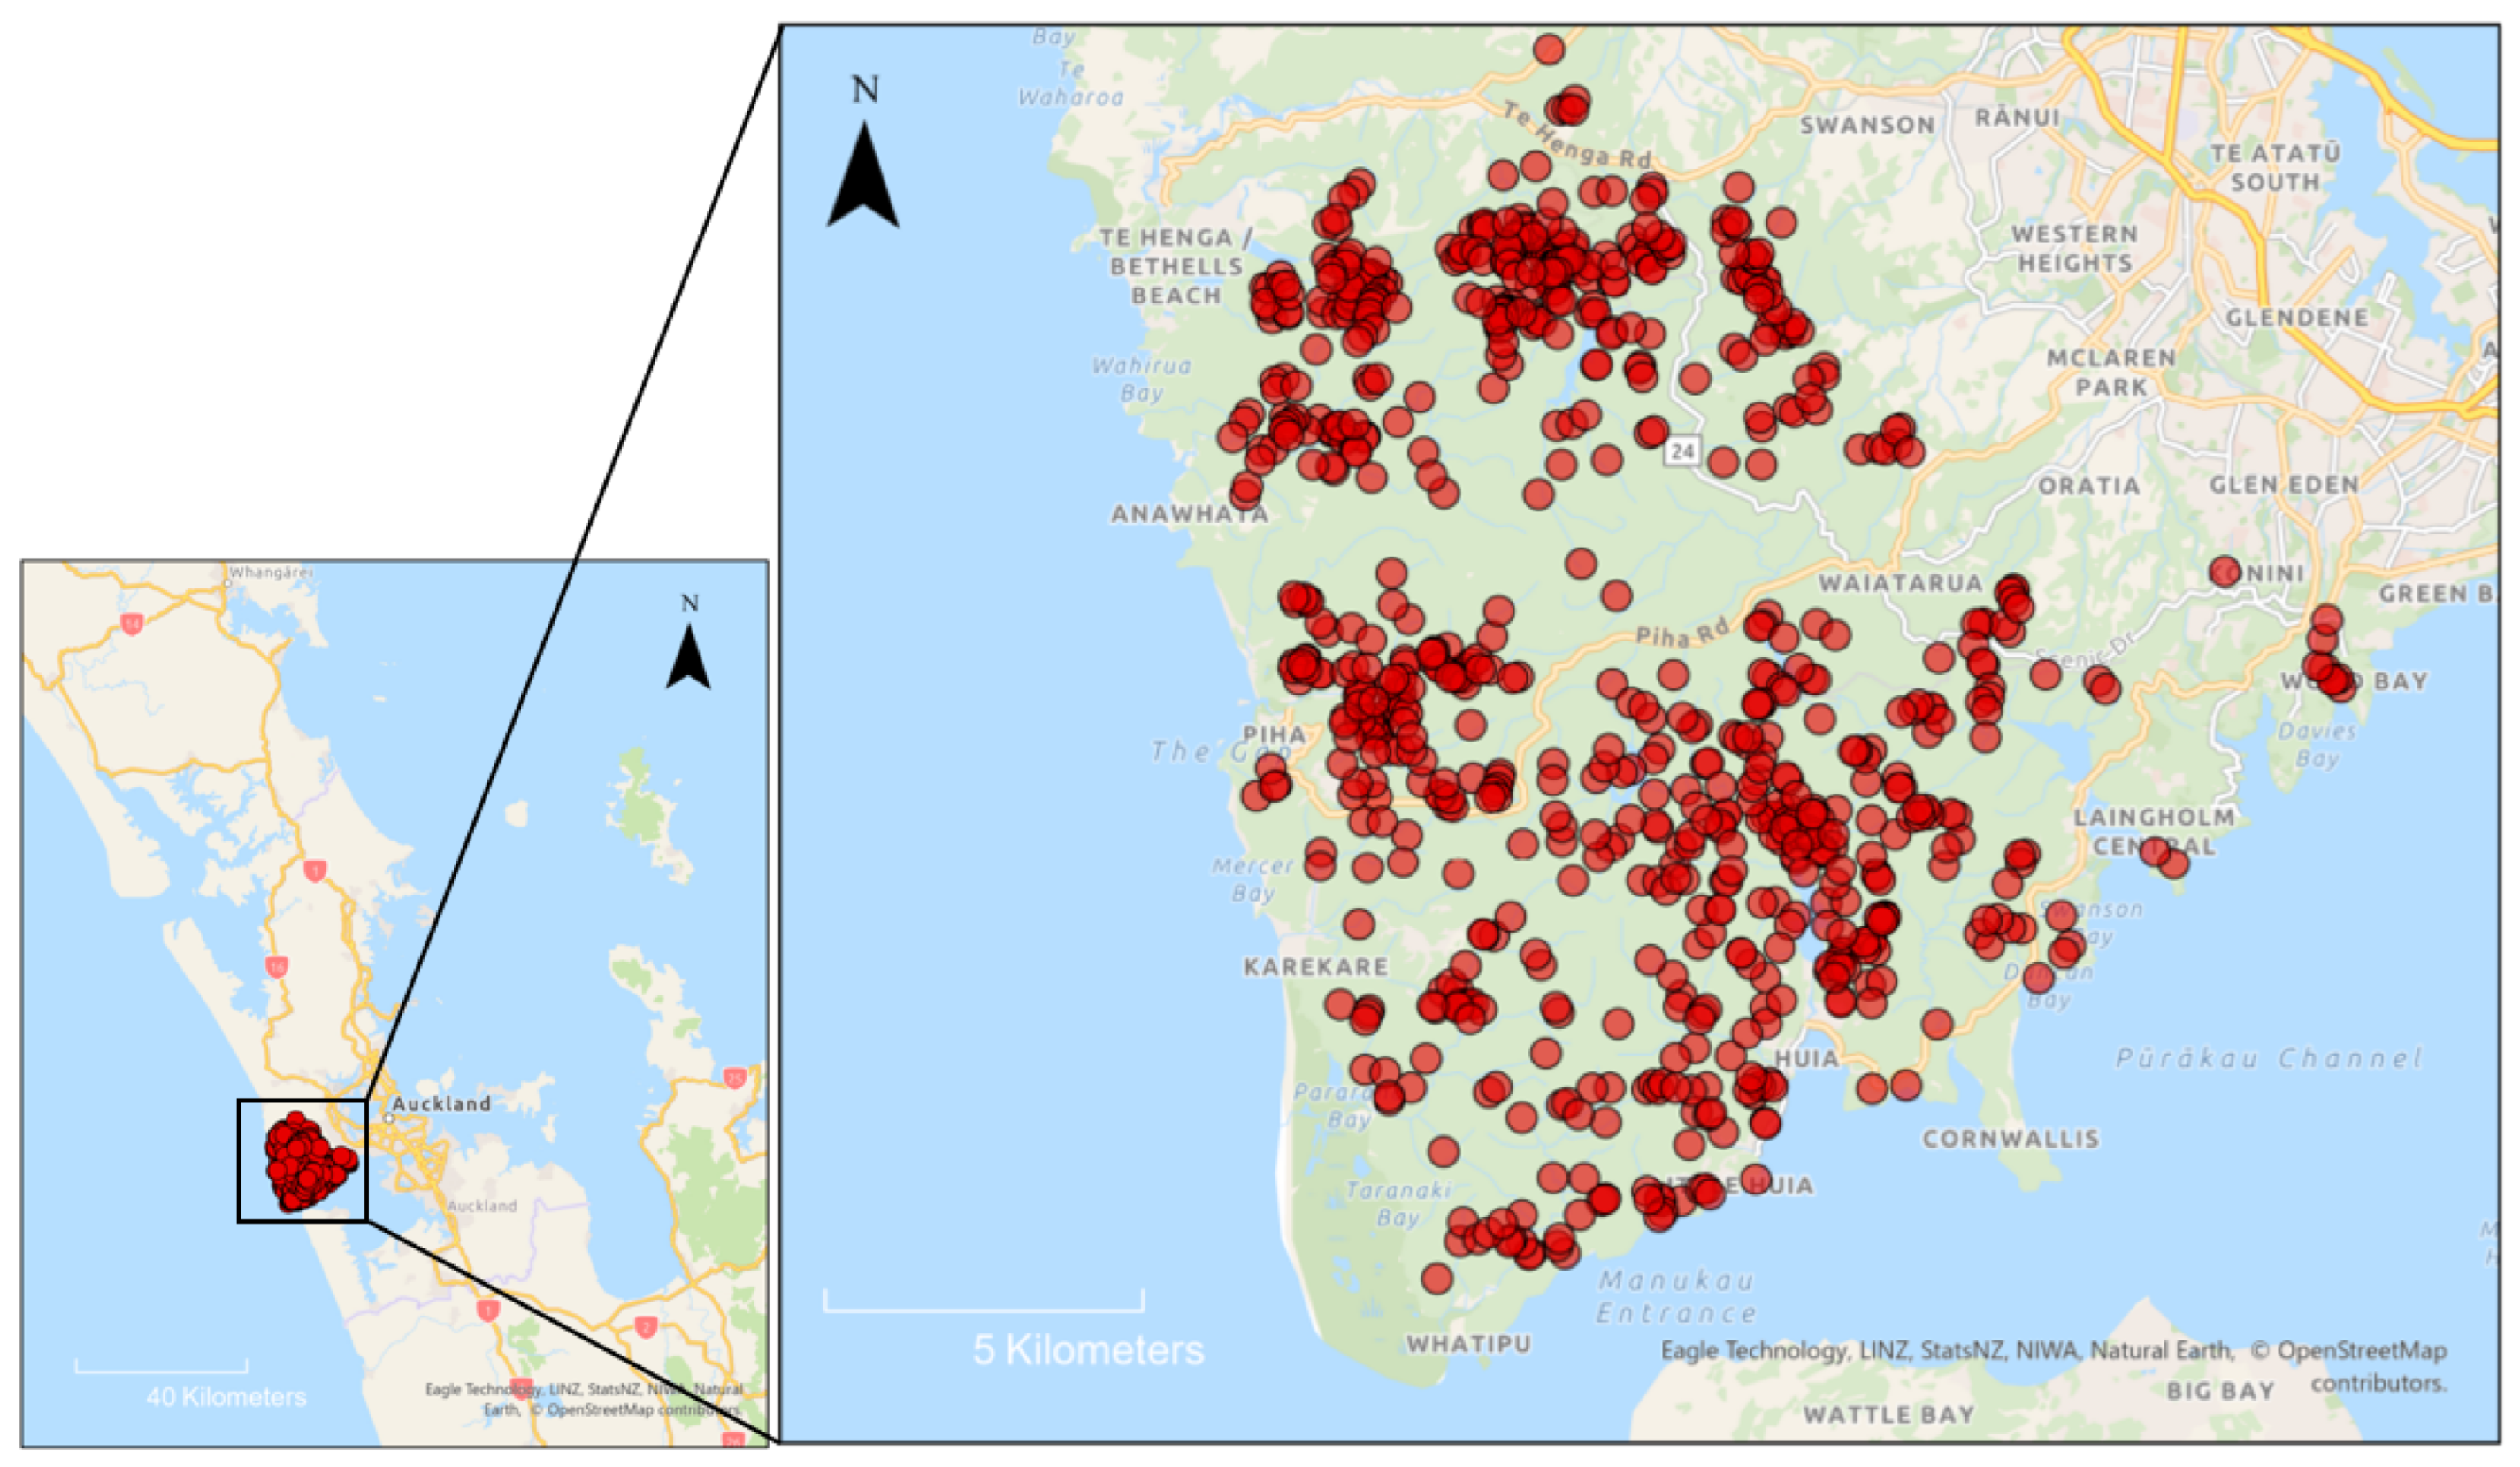
2.1. Site Characteristics and Kauri Dieback History

Te Wao Nui o Tiriwa/Waitākere Ranges is located on NZ’s North Island and is one of the largest areas of native forest in the greater Auckland region and one of the largest areas of kauri forest in NZ. The study area was limited to the Waitākere Ranges Regional Park (WRRP; 36°53–37°03 S, 174°27–174°34 E), which covers most of Te Wao Nui o Tiriwa, consisting of more than 17,000 ha of parkland between metropolitan Auckland, the coast of the Tasman Sea to the west and the Manukau Harbour to the south (Figure 1). The terrain is hilly, ranging from sea level to 474 m elevation [42]. Mean annual temperature ranges from 12.5 to 14.5 °C. Total annual rainfall measured at a nearby station (36°54 S 174°31, 260 m above sea level) is approximately 1800 mm (1991–2020) (The National Climate Database, NIWA, https://cliflo.niwa.co.nz/, accessed on 15 April 2024).

2.2. Survey Design and Sampling

Full details of the surveillance design are presented by Froud et al. [43]. In brief, mature kauri crowns were detected with remote sensing using a combination of HiRAMS aerial imagery and LiDAR data with 68,420 mature kauri greater than 15 m in height putatively identified [43]. Of these, 2140 were selected at random for field surveying with soil samples collected from 767 of these trees [43]. Soil samples were collected between March and July 2021. Trees were classified as symptomatic if they had a canopy dieback score > 3 on a 5-point scale where 1 = asymptomatic and 5 = dead (details of canopy scoring in Froud et al. [43]) and/or the presence of a basal bleed [44].
Four soil sub-samples were taken at 90° intervals around each tree and at 1–2 m from the trunk starting either below the tree tag or, if the tree had a basal or lateral root resin ‘bleed’, below the most active ‘bleed’. Soil was taken to a depth of 10–15 cm after brushing away the loose litter layer and contained a mixture of organic material, mineral soil, and kauri feeder roots. The four sub-samples were amalgamated into one sample per tree, totaling approximately 650–750 g. The soil samples were double-bagged and stored in a dark place at temperatures from 10–25 °C until dispatched to the laboratory. Samples were thoroughly mixed and homogenised by sieving (6 mm) in the lab. A 2 g tube was filled with a subset of each soil sample (containing feeder root fragments and rhizosphere soil) and stored at −20 °C in the dark until DNA extraction.

2.3. Soil Baiting

Separate aliquots of each soil sample were used to isolate Phytophthora species in a P. agathidicida-selective [29] and standard baiting assay [45], although results from both assays were combined for data analysis.
The procedure for the P. agathidicida-selective baiting assay was as follows [29]. Approximately 100 g, including fine feeder roots and soil from each soil sample, were air dried at 20 °C for 3–4 days on a lab bench with a dehumidifier (Mitsubishi Electric MJ-E22VX, Tokyo, Japan) set to 50% running constantly. The samples were re-moistened carefully and incubated in diffuse natural light for 3–4 days at 20–22 °C to stimulate sporangia production. The samples were then carefully flooded with distilled water to a depth of 3–5 cm above the soil surface. Soil disturbance and water turbulence were minimised by flooding slowly. Five Himalayan cedar (Cedrus deodara) needles were floated on the water surface and three freshly germinated (2-day-old), intact blue lupin (Lupinus angustifolius) radicles were suspended over the water surface using parafilm, with the root tip submerged in the water.
The samples for the standard Phytophthora assay were not dried prior to flooding and were only baited with Himalayan cedar needles.
The baits were incubated at 20 °C in light. After 2–3 days the baits were removed, surface sterilised in 50% ethanol followed by two rinses in distilled water and blotted dry on paper towels. The lupins were cut into 1 cm pieces and plated into Phytophthora-selective P6ARPH media [46]. The cedar needles were plated whole, taking care to submerge the proximal end into the media. Plates were incubated in the dark at 18–20 °C and monitored for Phytophthora-like growths daily for 5 days. Such growths were sub-cultured onto clarified 20% V8 agar for morphological characterisation. P. cinnamomi and P. agathidicida isolates were identified based on distinguishing morphological characteristics but any other Phytophthora isolates were submitted for DNA sequence analysis.

2.4. Sequencing of Cultures

All unknown isolates were identified by amplification and sequencing of the Internal Transcribed Spacer (ITS) and cytochrome c oxidase subunit 1 (coxI) gene regions. Mycelium was harvested from 3-day old cultures grown in clarified 20% V8 broth, rinsed three times in sterile deionised water, and blotted dry on paper towels. The mycelium was placed in a 2 mL cryo tube and freeze-dried for 24 h. The cap was replaced, and the mycelium was stored at −20 °C prior to DNA extraction. Genomic DNA was extracted using the Qiagen DNeasy Plant Pro Kit (Hilden, Germany) following the manufacturer’s instructions. The ITS1 gene region was amplified by PCR using the primers ITS 5 and ITS 4 [47] while the coxI gene region was amplified using COIF and COIR [48].
PCR products were run in 1.5% agarose gel and quantified using the NanoPhotometer® NP80 Spectrophotometer (Implen, Munich, Germany) for quality and quantity before sending to University of Auckland DNA Sequencing Facility (Auckland Genomics) for PCR purification and DNA sequencing (AMPure magnetic beads and Sanger sequencing (1/4 Big Dye v3.1). Sequences were viewed using Geneious Prime v.2022.0.1 (Biomatters Ltd., Auckland, New Zealand). The sequences were trimmed and (MUSCLE) aligned using the features within the Geneious software. Sequences were aligned with a curated library of validated type and isotype isolates of all the currently described species of Phytophthora supplied by Professor Treena Burgess (Harry Butler Institute, Murdoch University, Murdoch, WA, Australia).

2.5. Soil DNA Extraction and PCR Amplification

Genomic DNA was extracted from up to 250 mg of soil per tree sample using the DNeasy® PowerSoil® Pro Kit (Qiagen, Germany) following the manufacturer’s instructions. The sample was crushed in a Qiagen Tissue LyserIII machine for 50 s at 30 cycles for step 6. Final elution’s were performed in 100 µL of Tris (10 mM) buffer (buffer C6 of the kit). All DNA was stored at −20 °C before amplicon generation.
For all samples, amplicon libraries for ITS gene region were created by applying a nested PCR using the primary Oomycete-specific primers oom18S/ITS7 [49] in the first round, and the nested Phytophthora-specific primers 18ph2f/5.8S-1R (approximate length 400 bp) [50]. In addition, 30 samples (selected based on the ITS1 gene sequencing results; Supplementary Materials Table S1) were amplified in a nested approach targeting the 40S ribosomal protein S10 (RPS10) gene region with primers PRV9-F and PRV9-R in the first round [51] and oomycete-specific primers RPS10-F and RPS10-R (approximate length is 550 bp) in the nested PCR to resolve detections to species level where this is not possible with the ITS1 region alone [52]. In both cases the nested PCR primers had Illumina MiSeq (MS) adapter sequences attached to the 5’ end, as per standard protocols for the MiSeq platform (Illumina Demonstrated Protocols: Metagenomic Sequencing Library Preparation) [53].
The PCRs were performed in 25 µL volumes containing 12.5 µL of PCR buffer KAPA HiFi HotStart ReadyMix (KAPA Biosystems, Wilmington, MA, USA). For the ITS1 PCRs there were 8.5 µL of PCR grade water, 400 nM of each primer, and 2 µL of genomic DNA (first round) or 1 µL of the PCR product (nested PCR had 9.5 µL of PCR grade water instead of 8.5 µL). For the RPS10 PCRs there were 1 µM of each primer, 2.5 µL of genomic DNA or PCR product, and 8 µL of PCR grade water. No-template negative PCR controls were included each time a PCR reaction was set up and carried forward to the nested PCR in the same manner as for the experimental samples.
PCRs were carried out in a Mastercycler® X50s thermal cycler (Eppendorf, Hamburg, Germany) with the following steps for the primary ITS1 PCR: 3 min at 95 °C for initial denaturation, followed by 35 amplification cycles of 98 °C for 20 s, 60 °C of annealing for 15 s and 72 °C for 60 s, a final extension cycle at 72 °C for 7 min, and holding at 10 °C. For the nested ITS1 PCR the conditions were 94 °C for 2 min, 25 cycles of 95 °C for 20 s, 60 °C for 25 s, 72 °C for 60 s, 72 °C for 7 min, and holding at 10 °C.
For the RPS10 primary PCR the conditions were 94 °C for 2 min, 35 cycles of 94 °C for 30 s, 59 °C for 45 s, 72 °C for 60 s, 72 °C for 10 min, and holding at 4 °C. For the nested RPS10 PCR the cycling conditions were as follows: 94 °C for 2 min, 30 cycles of 95 °C for 20 s, 60 °C for 25 s, 72 °C for 60 s, 72 °C for 7 min, and holding at 4 °C.
Amplicon library preparation was performed according to recommended protocols (Illumina Demonstrated Protocol: 16S Metagenomic Sequencing Library Preparation) [53]. After visualisation of 5 µL on 1.5% agarose gels, a duplicate PCR was run for all samples which produced an amplification product. The duplicate PCRs were combined and purified with the AMPure XP PCR purification system (Beckman Coulter Genomics, Danvers, MA, USA) following the manufacturer’s instructions (0.8× of AMPure XP beads were used per sample). The purified products were quantified using the Qubit 2.0 Fluorometer (Thermo Fisher Scientific, Waltham, MA, USA). Purified PCR amplicons were adjusted to 5 ng/µL for indexing. Indexing and sequencing were completed by Auckland Genomics, University of Auckland, New Zealand on Illumina MiSeq using 600-cycle V3 chemistry (300 bp paired-end reads).

2.6. Controls for Illumina Sequencing of ITS1 Gene Region

Positive controls were developed using DNA extracted from the following Phytophthora isolates sourced from The New Zealand Institute for Plant & Food Research Limited isolate collection: P. cinnamomi (H1454), P. agathidicida (H1453), P. pseudocryptogea (H1258) and P. multivora (H1467). All four species are known to occur in kauri forests and the isolates used were from the North Island of NZ. The DNA extraction, amplification, and sequencing methods were the same as described above.
eDNA from five environmental samples (5316, 5340, 5502, 5630, and 5597) which were negative for Phytophthora (based on the Phytophthora-specific ITS PCR) were combined as background eDNA and spiked with DNA from the four Phytophthora species to create mock community control samples (ranging from 0.0001 to 0.1 ng/µL in various combinations). The combined background eDNA was also sequenced, as described above.
Additional negative controls were sequenced for four samples (5547, 5674, 5675, and 5678) which did not produce an amplification product from the Phytophthora-specific PCR of the soil DNA extractions.
The sequencing was performed over two runs. To check for differences between the runs, five samples from the first sequencing run (5084, 5085, 5170, 5185, and 5203) were included in the second sequencing run as controls. All steps were repeated for the second run (including DNA extraction).

2.7. qPCR Validation of Mock Communities for the ITS1 Gene Sequencing

An enriched multiplex real-time PCR for P. agathidicida and P. cinnamomi was developed to validate the mock community control samples and the presence or absence of P. agathidicida and P. cinnamomi in field samples. The primers used for P. agathidicida and P. cinnamomi for the multiplex enriched qPCR targeted the ITS1 gene and were within the region that the oomycete-specific primers for the metabarcoding PCR amplified (Table 1). The P. agathidicida qPCR was highly specific and did not amplify other species, while the P. cinnamomi qPCR primers were specific to clade 7.
The PCR products from the oomycete specific ITS PCR (oom18S/ITS7) for metabarcoding were used as the template for the enriched qPCR validation. The qPCRs were performed in 15 µL volumes, containing 7.5 µL of TaqMan® Environmental Master Mix 2.0 (Applied Biosystems by Life Technologies, Foster City, CA, USA), 2.92 µL of PCR grade water, 350 nM of each primer, 160 nM of each probe, and 2 µL of template (1:100,000 dilution of oomycete specific ITS PCR oom18s/ITS7). No-template negative PCR controls were included each time a PCR reaction was set up and carried forward to the nested PCR in the same manner as for the samples. Quantitative PCRs were carried out in an Eco Real-time PCR instrument (Illumina, San Diego, CA, USA) with the following steps: 10 min at 95 °C for initial denaturation, followed by 40 amplification cycles of 95 °C for 15 s, and 60 °C of annealing for 60 s. A no-template negative control was always included in the reactions. The cycle threshold was set to 0.02.
To determine the minimum read count for a true positive in the metabarcoding, all samples with less than 500 reads for P. agathidicida and 23 samples with less than 180 reads for P. cinnamomi were run in the enriched qPCR.
In addition, to check the ability of the metabarcoding to give a quantitative measure of Phytophthora in samples, the spiked mock community DNA mixes and the oom PCR products (oom18S/ITS7) for control samples 6000 to 6006 and 6011 (Table 1) were used as templates in a multiplex qPCR to quantify the amount of P. cinnamomi and P. agathidicida DNA in each sample.

2.8. Bioinformatics

Paired-end reads were imported into the DADA2 pipeline in R Studio [57] to remove the primers and inspect read quality. Reads were trimmed to a minimum length of 100 base pairs, dereplicated, and merged. The quality of the DNA libraries before and after the trimming step were checked with FASTQC [58], and all output files were merged into a single report using MultiQC [59].
An amplicon sequence variants (ASVs) table was generated for the merged ITS reads and for the R2 reads of the RPS10 only (after filtering and trimming to 260 bp), and potential chimeras were detected and removed by means of the DADA2 pipeline.
Any ASVs with a total library of less than 50 reads were removed. Any samples with less than 100 reads total were removed. Singletons were discarded but noted for any with >3000 reads. Any samples with less than 50 reads for a single ASV were removed (as determined by the qPCR validation).
The ITS1 and RPS10 ASV tables were compared to the NCBI database comparing to the Nucleotide collection (nr/nt) and the Whole Genome Shotgun contigs (wgs) Oomycete (taxid: 4762) and Phytophthora (taxid: 4783) databases.
The ITS1 ASVs were trimmed to the ITS1 gene region to check against the curated database supplied by Professor Treena Burgess (Harry Butler Institute, Murdoch University, WA, Australia). Using Geneious Prime (Version 2022.0.1), the RPS10 ASV table was compared to the reference database (of 886 oomycetes sequences) downloaded from OomyceteDB (www.oomycetedb.org; accessed on 30 January 2024) [52].
Those ASV sequences showing <99% but more than 98% similarity to a Phytophthora species (after blasting or in the reference database) were submitted to a phylogenetic analysis to check their positions in the different Phytophthora taxonomic clades. Detected Phytophthora phylotypes, which were not a described species, were included in a simple phylogenetic analysis using Geneious (Version 2022.0.1) tree builder.

2.9. Data Analyses

All analyses were conducted using R version 4.2.3 [60].
To determine how sensitive and quantitative the ITS1 metabarcoding primers were, the number of reads of each species found in the ‘mock’ communities were compared to the DNA concentration of each species, using a negative binomial generalised linear model with function glm.nb (package MASS, version 7.3.60; [61]). The response variable was the number of reads and the model predictor was the DNA concentration. Model assumptions were verified by visually inspecting residuals for assumptions of normality and homoscedasticity [62].
Species co-occurrence was assessed using the co-occur function with a threshold of >1 in the R package co-occur version 1.3 [63]. Sites with the dominant invasive Phytophthora species, P. cinnamomi, P. agathidicida and P. multivora, were visualised using a Venn diagram constructed with the eulerr package version 7.0.0 [64].
The impact of canopy dieback score was analysed with a binomial generalised linear model (logit link; package stats, version 4.2.3 [60]) and visualised with ggplot2 version 3.4.3 [65].
The distribution of the three most abundant species (P. agathidicida, P. cinnamomi, and P. multivora) were mapped using the geographical information system (GIS) software ArcGIS Pro version 2.7.1.

3. Results

3.1. Characteristics of Sampled Trees

The trees had a minimum diameter at breast height (~1.4 m DBH) of 10 cm and were >15 m tall (n = 767) [43]. Samples were taken from across the whole of the Waitākere Ranges Regional Park (Figure 1).

3.2. Identification of Phytophthora Species by Soil Baiting

Four species of Phytophthora were isolated by soil baiting from the 767 samples (P. cinnamomi, P. agathidicida, P. multivora, and P. pseudocryptogea/P. cryptogea), and an additional three species were detected through metabarcoding of soil eDNA (P. kernoviae, a clade 1 species—likely P. cactorum (Lebert and Cohn) J. Schröt or P. aleatoria P.M. Scott, R. McDougal and P.M. Taylor, and an unknown P. europaea-like clade 7 species; Table 2). Phytophthora kernoviae is putatively native to NZ [66] and the specific origins of the other species are unknown.

3.3. Sequencing Output and Performance of Control Reactions

After the quality control filtering and merging, the ITS1 metabarcoding runs yielded an average of 14,448 ± 513 reads per sample (±standard error; range: 4–58,959). After the quality control steps, the RPS10 reverse reads (trimmed to 260 bp) from 30 samples had an average of 8187.9 ± 1028.1 reads per sample (±standard error; range: 2208–28,672). The Q score of quality was higher than 34 for the trimmed ITS library and higher than 25 for the RPS10 trimmed reverse reads.
No Phytophthora species were detected within any of the negative control reactions. Phytophthora cinnamomi, P. agathidicida, and P. pseudocryptogea were detected in 100% of the mock community control samples. Phytophthora multivora was only detected in two mock community samples in which P. cinnamomi was at 0.01 (sample ID 6005) and 0.001 (sample ID 6006) ng/µL DNA (Table 3).
The sequence reads for each species were not directly proportional to the amount of DNA present in the mock community samples (Figure 2). For example, sample 6000 was spiked with 0.1 ng/µL of DNA for each of the four species, however P. cinnamomi made up 53.3% of the reads in that sample and P. multivora was not detected (Table 3). Overall, for the mock communities there was a positive correlation between DNA concentration and the number of reads in the sample (z = 4.665, p < 0.001; R2 from a simple linear regression = 0.5529).
The number of sequence reads in the mock communities were different between P. cinnamomi and P. agathidicida (z = 4.202, p < 0.0001; Figure 2).
The spiked mock community DNA concentrations of P. agathidicida and P. cinnamomi were re-tested with qPCR which produced DNA ratios as expected for the DNA quantities spiked into each of the mock communities (Supplementary Materials Figure S1). The qPCR of the oom18s/ITS7 PCR products for the mock community samples in which the four species were spiked in equal concentrations (6000 to 6006 and 6011 from Table 3) provide evidence of sequencing bias either in the enrichment process of the nested PCRs or in the metabarcoding and hence are not a reliable quantitative measure of species abundance (Supplementary Materials Figure S1).

3.4. Identification of Phytophthora Phylotypes by NGS

From the 767 soil DNA extractions, 441 produced PCR products with the ITS primers indicating amplification of at least one Phytophthora target. The DADA2 workflow generated 816 ASV from which, after filtering and eliminating artefacts, seven Phytophthora species corresponding to six known species and one potentially new phylotype were detected (Table 2).
There were three ITS ASVs which had more than 3000 reads and were possibly a Phytophthora species but they were present in single samples (Appendix A Table A1).

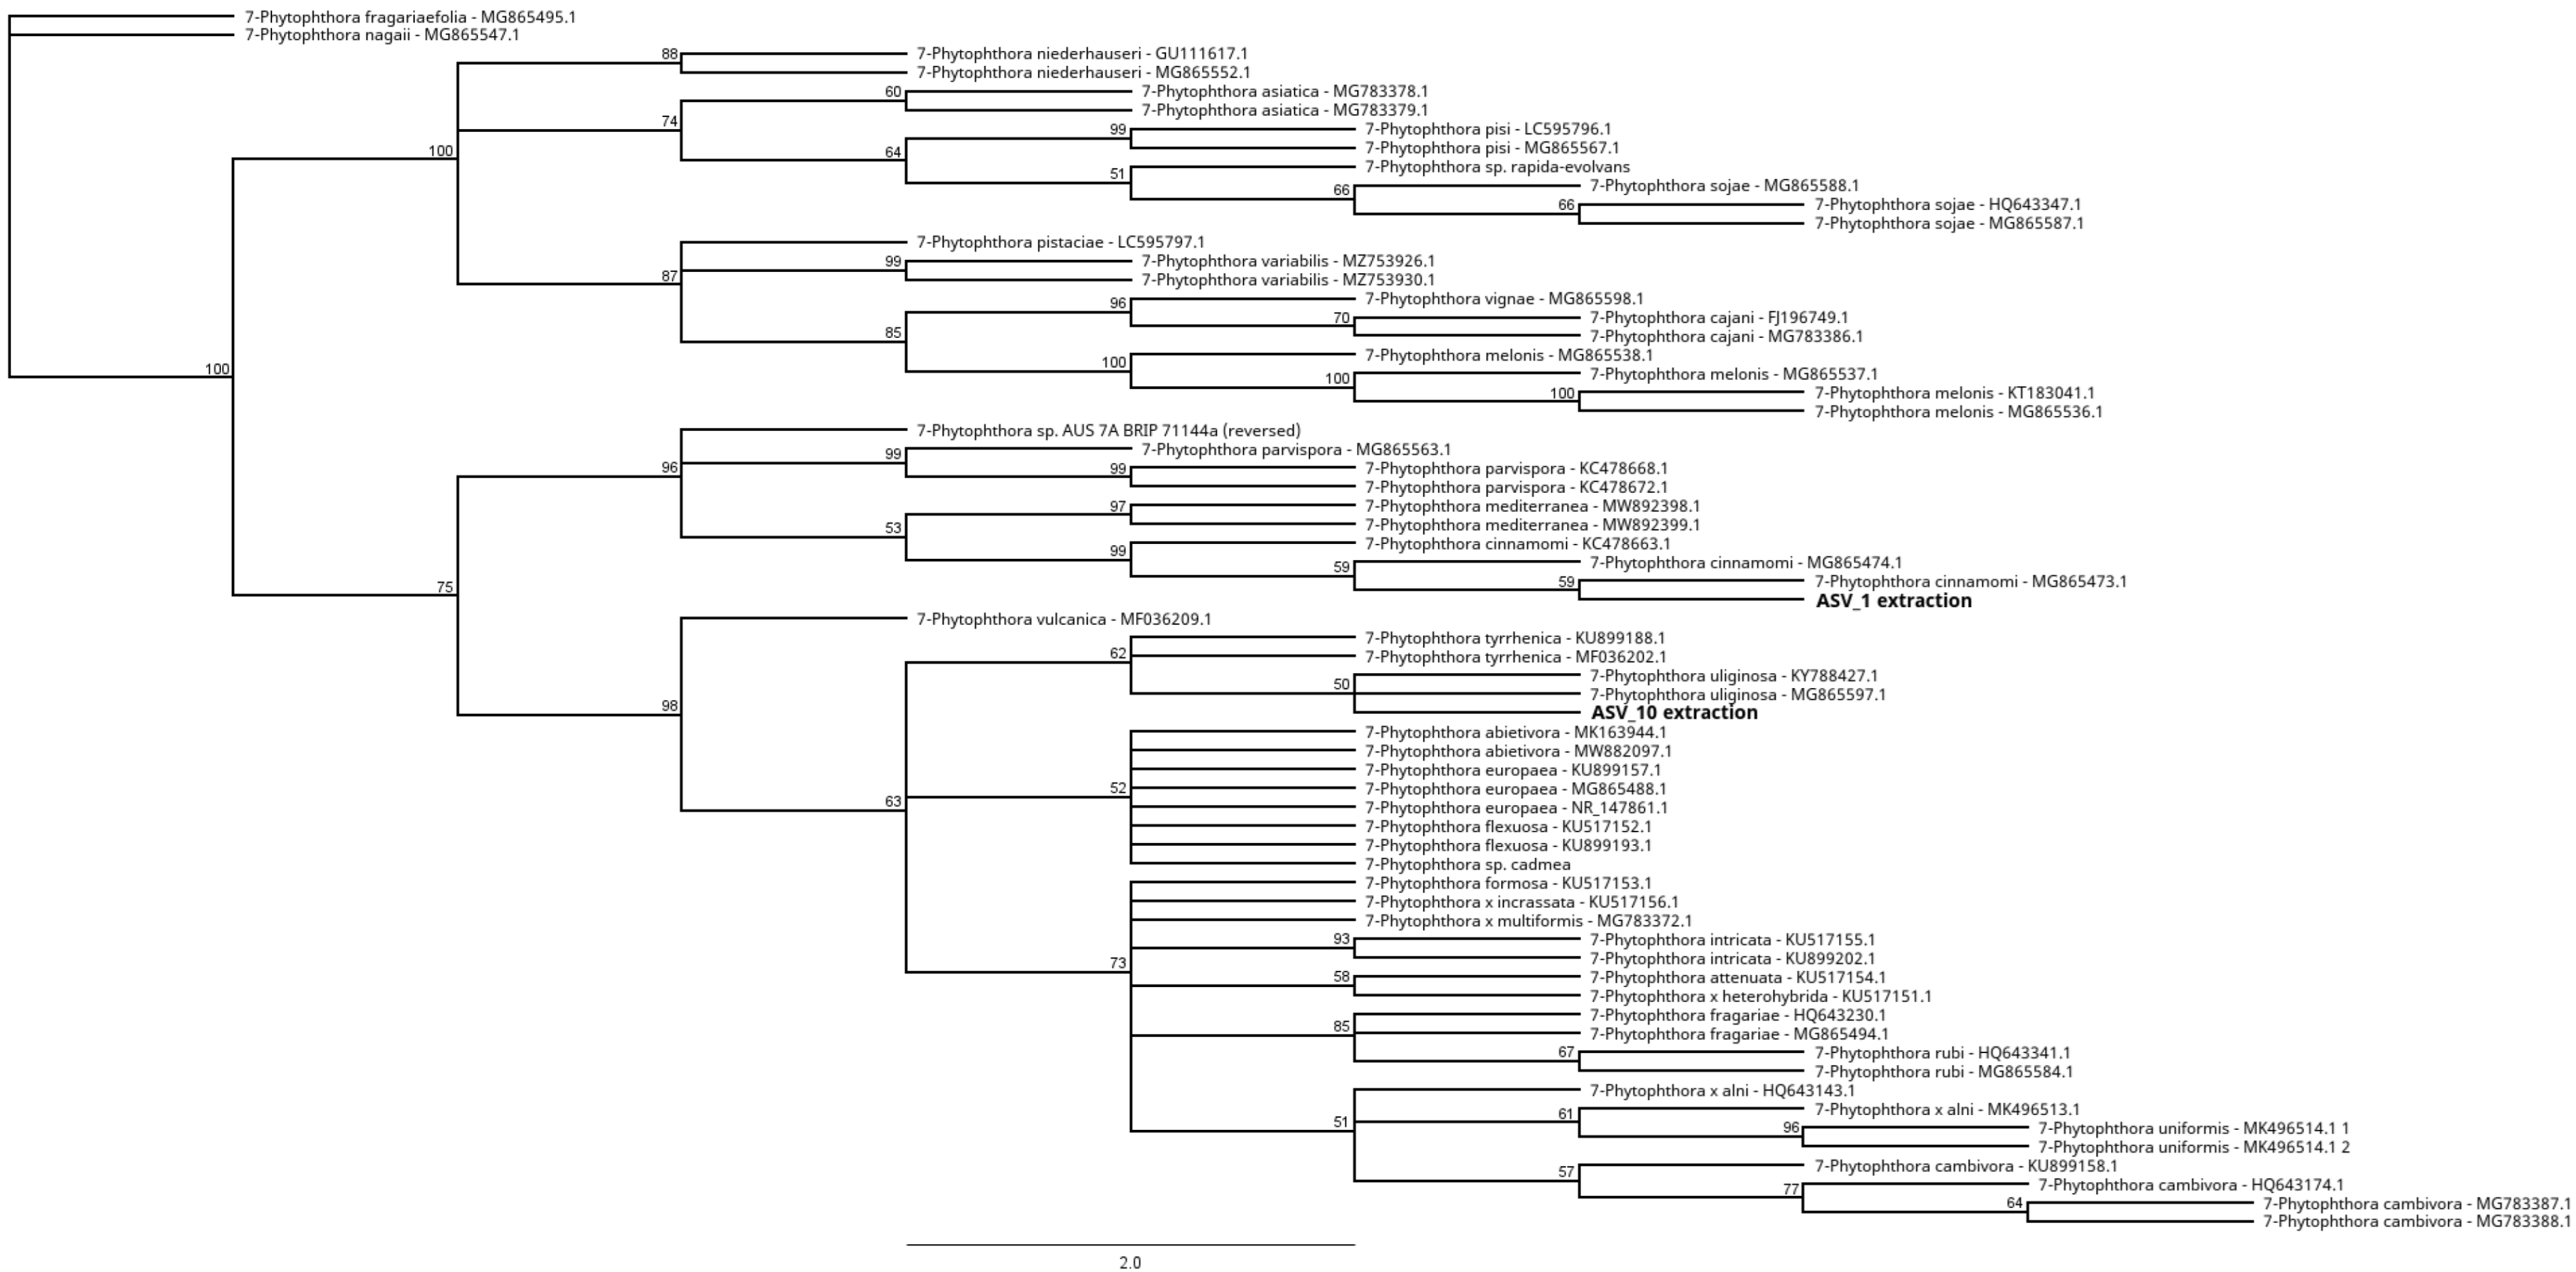
Unknown Phytophthora Species in Clade 7

There was a potentially new species in 20 samples as detected with ITS metabarcoding (Table 2; Supplementary Materials Table S1) that was similar to clade 7 Phytophthora species (including P. europaea, P. uliginosa, and P. abietivora) but distinctly different from the other clade 7 species (P. cinnamomi) detected in this study based on the ITS metabarcoding (Figure 3). The cropped sequence to the start of the ITS1 gene (200 bp) had a 100% query cover and 100% match to P. uliginosa isolate Ex-type IFB-ULI 1 (MG865597.1 NCBI reference) and 100% cover and 99.5% matches to both P. abietivora isolate Ex-type (MK163944.1 NCBI Reference) and P. europaea (MG865488.1 NCBI Reference).
From the 30 samples selected for amplification with the RPS10 primers, all produced PCR products. The DADA2 workflow generated 176 ASVs after filtering. RPS10 sequencing confirmed the identity of a P. europaea-like species in 11 of the 20 samples which were positive with ITS (>99 reads) (Supplementary Materials Tables S1 and S2). The RPS10 sequencing confirmed the presence of P. agathidicida, P. cinnamomi, and P. pseudocryptogea, but read counts were very low or single samples were positive (Supplementary Materials Tables S1 and S2). It did not confirm the presence of P. cactorum/P. aleatoria in the four samples which were positive with ITS (Supplementary Materials Tables S1 and S2).

3.5. Comparison of Baiting to Metabarcoding

Of the seven phylotypes detected in this study, all were detected with metabarcoding and four were detected with baiting. Three of these phylotypes were detected in less than 0.5% of the samples tested using one or both of the detection methods.
Overall, 255 samples were negative for a Phytophthora using both methods and 268 samples were positive with one method only. With either method, 17 samples were positive for three species and one sample had four species present (including P. agathidicida and P. cinnamomi detected by sequencing and P. multivora and P. pseudocryptogea/P.cryptogea detected by baiting). Using both detection methods at least one Phytophthora species was detected in 506 samples. Of these, one sample had four species, 16 had three species, 87 had two species and 402 had 1 species detected.
Metabarcoding identified more species richness than baiting, but there were more positives with baiting compared to metabarcoding. The differences in counts for the three main species detected were not significantly different (ANOVA F = 0.44146, p-value = 0.5428).
The baiting and metabarcoding detections for P. cinnamomi and P. agathidicida were closely correlated (Figure 4). There were 62 samples which were positive for Phytophthora multivora with baiting alone and five with sequencing alone; only one sample was positive with both methods (Figure 4).

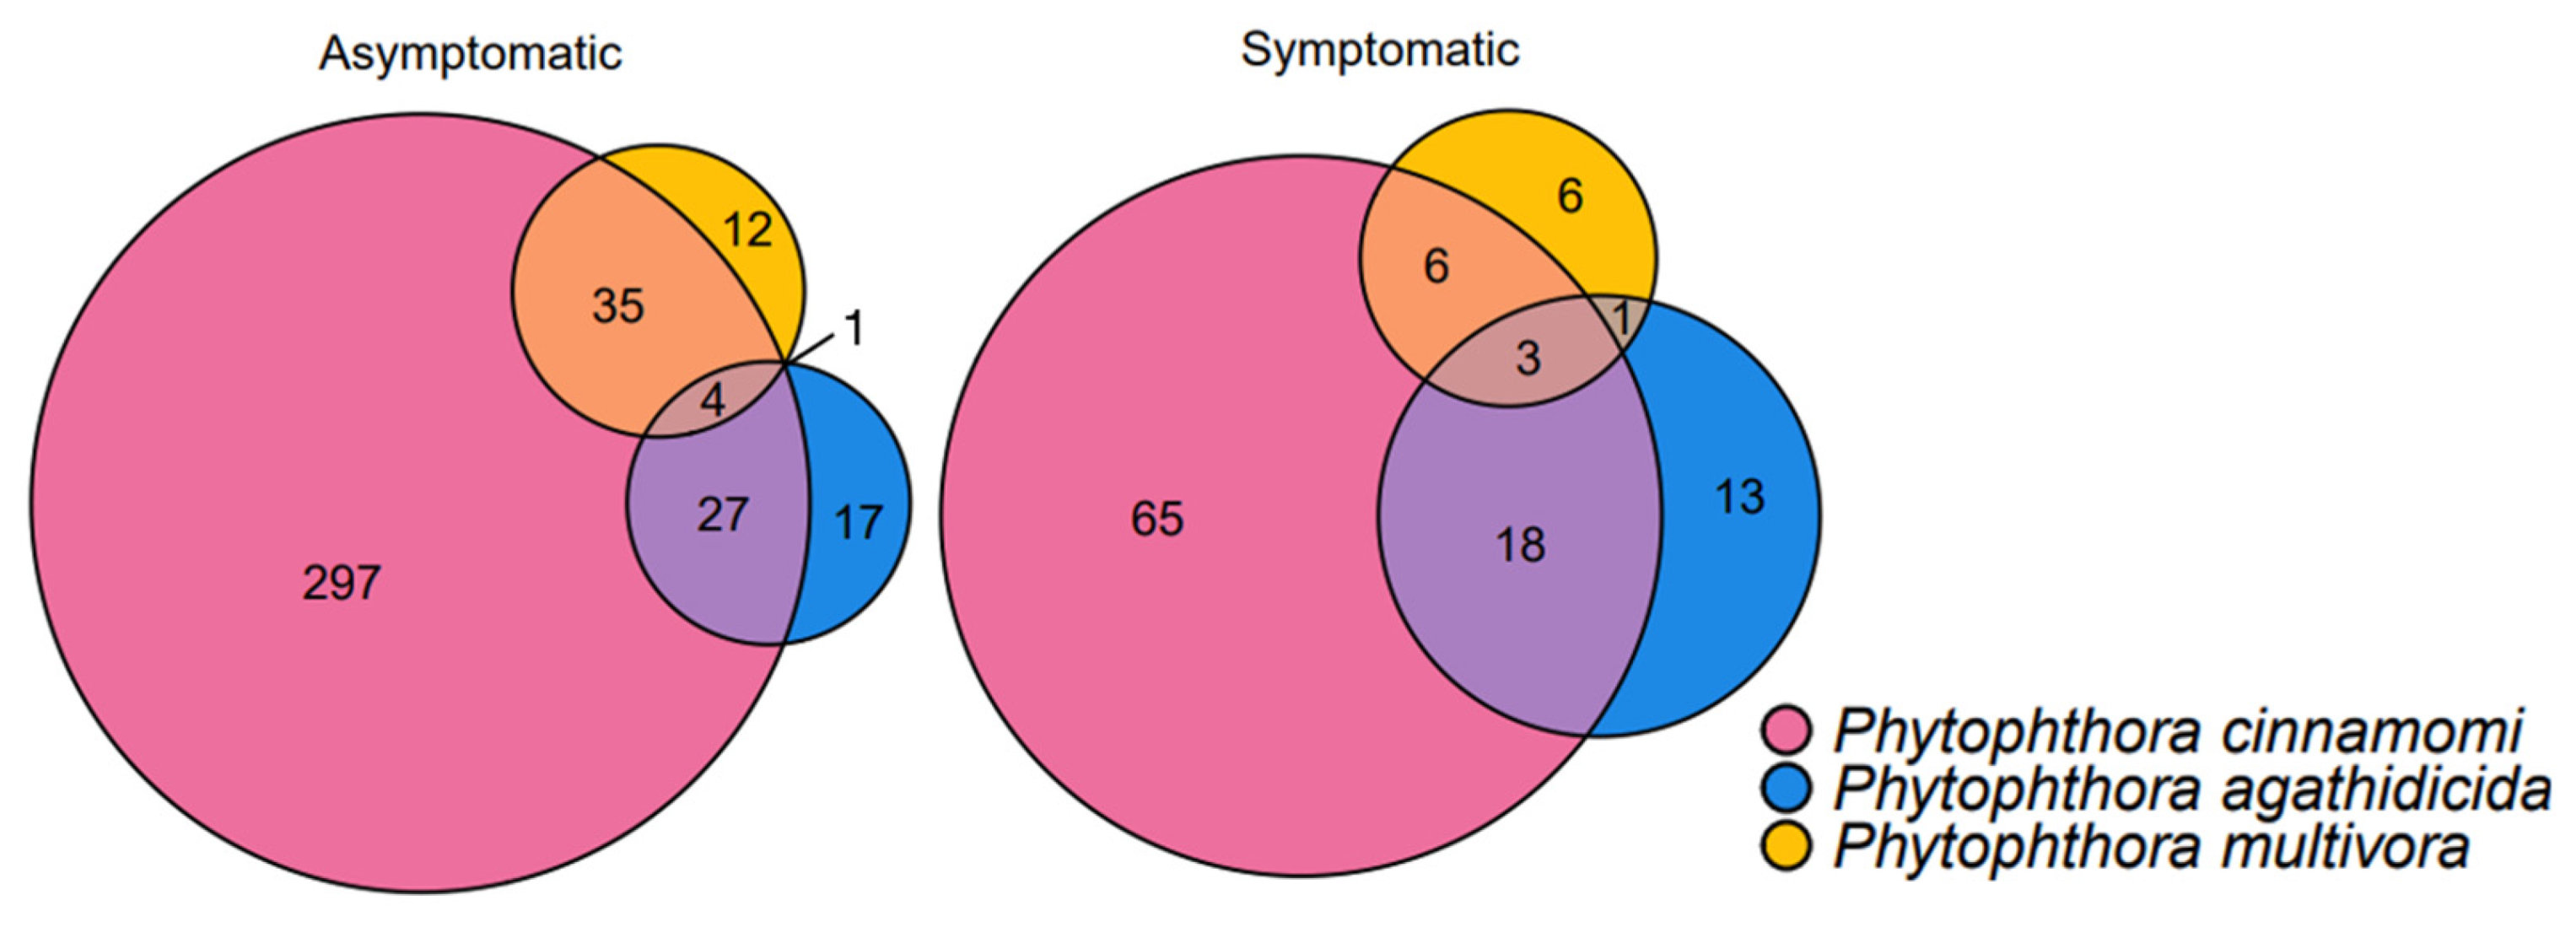
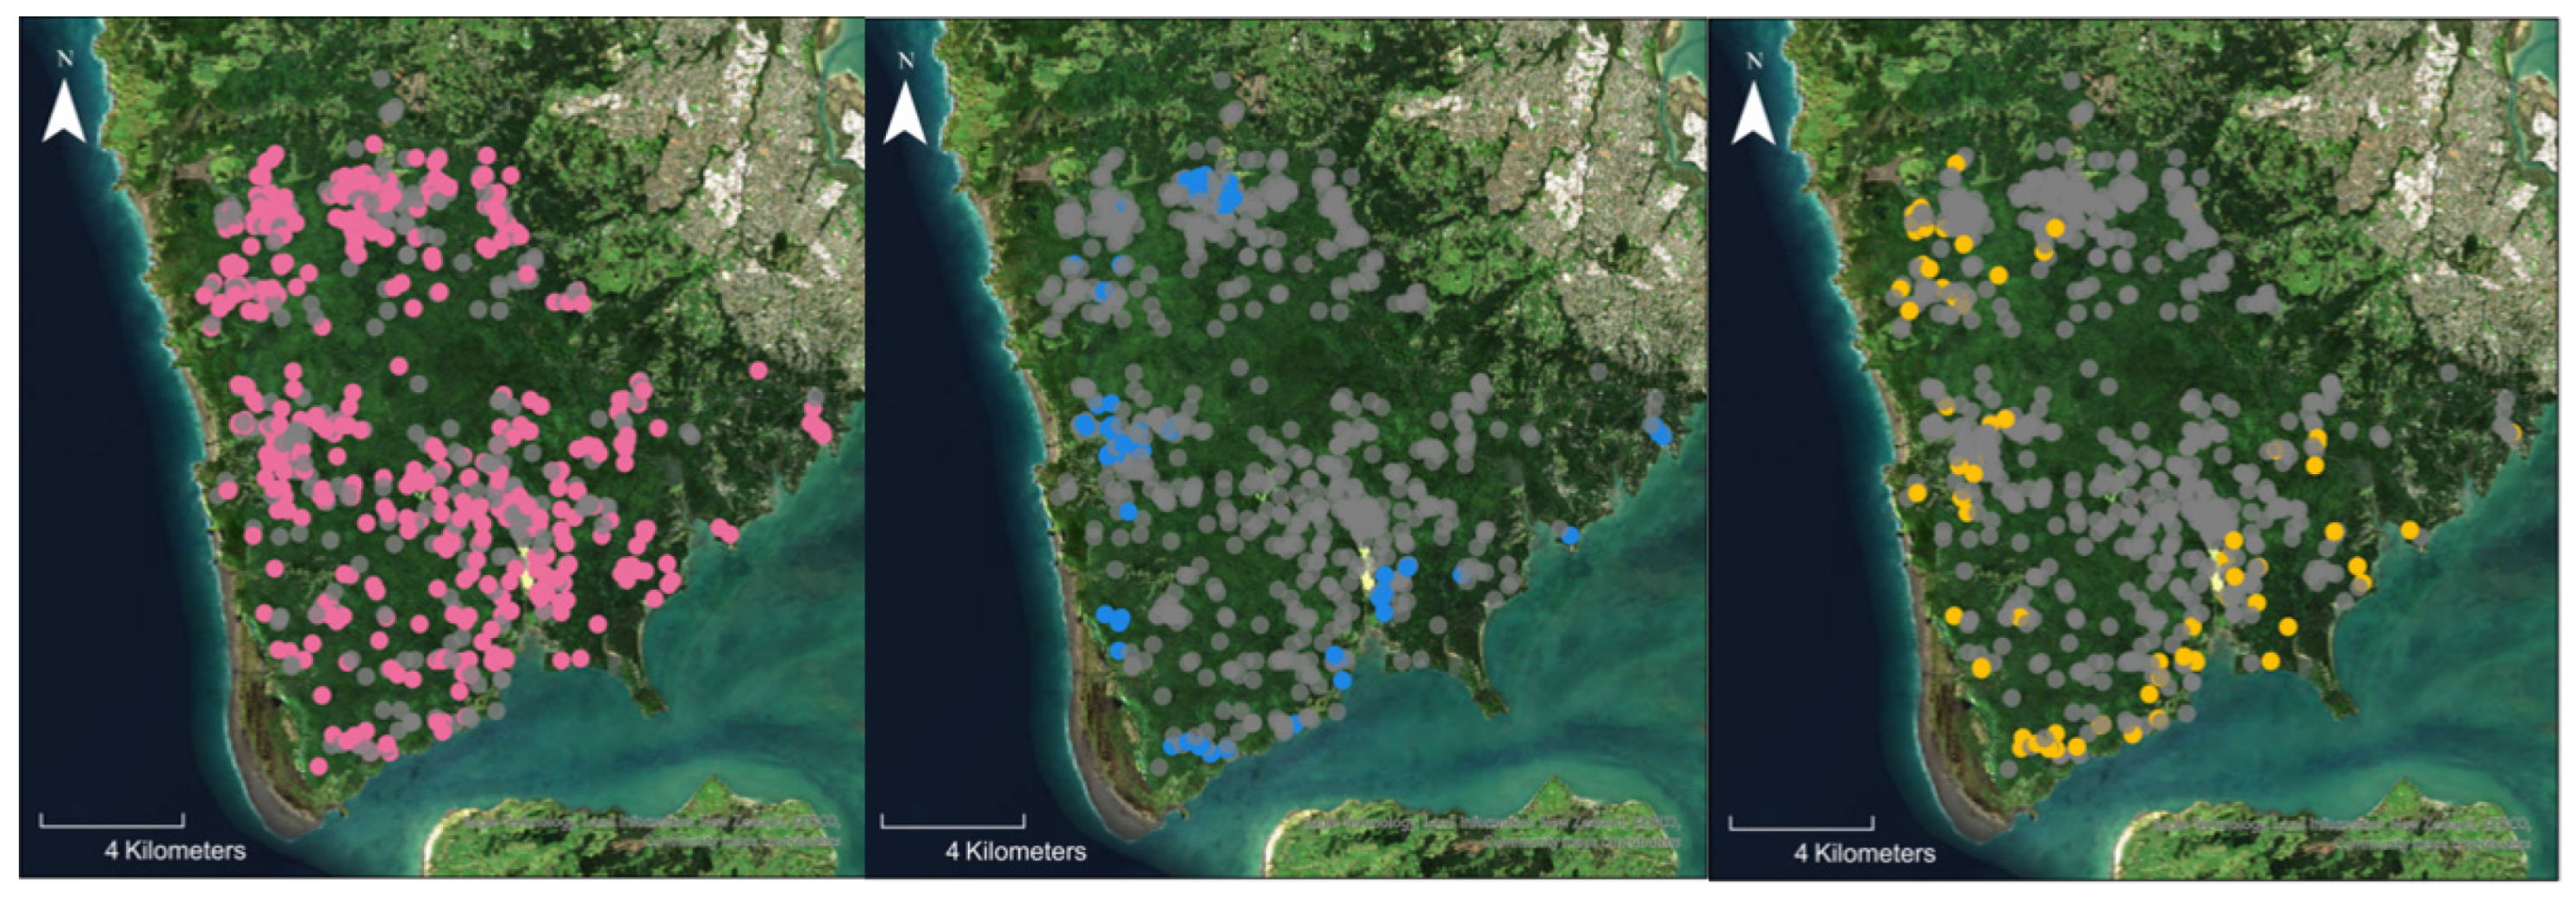
3.6. Phytophthora Community

The eDNA analysis added an additional five P. agathidicida, five P. multivora, and 51 P. cinnamomi positive detections to the distribution map reported by Froud et al. [43] (Figure 4 and Figure 5).
Overall, the distribution of these species does not differ substantially from that previously reported by Froud et al. [43], with P. cinnamomi distributed across much of the Waitākere Ranges while P. agathidicida is predominantly located in the peripheral areas with limited extension into the central area of the ranges (Figure 5). Phytophthora multivora has similarly had limited penetration into the centre of the park (Figure 5).
All three of the key species (P. cinnamomi, P. agathidicida, and P. multivora) were detected from both asymptomatic and symptomatic trees either alone or co-occurring with either of the other two species (Figure 6). Of the 595 asymptomatic trees, no Phytophthora species was detected from 202 trees. From the 172 symptomatic trees, no Phytophthora species was detected from 60 trees.
Phytophthora cinnamomi was more likely than by chance to occur together with P. multivora (p-value = 0.0305) and the unknown clade 7 Phytophthora species (p-value = 0.0429) as determined by the pairwise co-occurrence matrix (Supplementary Materials Figure S2).
All three species were found to have a significant relationship with declining tree health (i.e., increasing canopy dieback scores) indicating they may each have a role in kauri decline. However, this was strongest by far for P. agathidicida when plotted (all p-values from binomial generalised linear model < 0.005; Figure 7), suggesting that P. cinnamomi and P. multivora are, at most, minor contributors to kauri decline.

4. Discussion

This study focused on the diversity of Phytophthora species found in the root zone of symptomatic and asymptomatic kauri. Despite the large number (n > 57) of Phytophthora species already present in NZ [33,67], the Phytophthora community (seven species total) detected around kauri in Te Wao Nui o Tiriwa/Waitākere Ranges was surprisingly low. During Phytophthora surveys of temperate forests internationally, many more Phytophthora taxa are typically either associated with single trees or found within the same ecosystem. For example, 13 Phytophthora species were isolated from Alnus glutinosa (L.) Gaertn. (black alder) tissue, rhizosphere, and water samples in Portugal [68], eight species were isolated by soil and nine by water baiting from Quercus suber L. forests in Italy (14 species total) [69], and in a study across Austria, Czech Republic, and Slovakia, 19 Phytophthora taxa were isolated from rivers and streams in Alnus forests [70].
A few conifer trees have been surveyed for Phytophthora; of those that have, Austrocedrus chilensis (D. Don) Pic. Serm. and Bizzarri (Chilean cedar) in Argentina had five Phytophthora species detected [71], asymptomatic and symptomatic Picea abies (L.) H. Karst (Norway spruce) in Bulgaria had two Phytophthora species [72], and 14 Phytophthora species were detected in a Juniperus communis L. (common juniper) woodland in Scotland [73]. Of these, only Riddell et al. [73] utilised a metabarcoding approach to explore Phytophthora species richness beyond baiting in coniferous stands.
Metabarcoding consistently detects more species than soil baiting methods. For example, eDNA methods detected 20 Phytophthora species in Quercus species in Italy, compared to five species detected with baiting [5]. Similarly, 15 species were detected from Castanea sativa Mill. in Italy with eDNA compared to nine with baiting [40]. This study followed the same pattern and both detection methods yielded positive detections that would have otherwise been missed by the other method. Therefore, eDNA is a useful tool to complement baiting in future Phytophthora surveys of kauri forests.
The current study was a targeted survey in which only one known host species (Agathis australis) and one substrate (kauri root-zone soil) were sampled, and this may be a primary reason for this comparatively small community. The samples were from randomly selected trees in the forest and thus included a broad range of symptomatic and asymptomatic trees. Another contributing factor could be that NZ is a remote island nation with intense biosecurity practices implemented at the border and thus likely has fewer introductions of Phytophthora species than other countries more connected by trade, e.g., countries of the European Union and the United Kingdom.
Kauri are known to alter the soil pH and nutrient levels in the surrounding soil as the leaf litter layer accumulates and slowly decomposes [21]. These unique acidic conditions may impact the survival of Phytophthora species (both native and invasive) around kauri. In addition, since the discovery of kauri dieback in Te Wao Nui o Tiriwa/Waitākere Ranges, a rāhui (cultural exclusion) was implemented and tracks closed which would have limited the spread of soil movement around the forest. However, this recent action is not likely to have significantly impacted the diversity or distribution of species observed in this study with the evidence suggesting each of the pathogens observed have been established within the forest for many years.
Researchers are starting to give more consideration to native Phytophthora species, their distributions, and roles in their native environment [2]. Although native and other introduced Phytophthora species likely play an important role within the kauri ecosystem, it is not yet understood if any Phytophthora other than P. agathidicida play a role in contributing to kauri dieback and/or has a beneficial role in forest health. While P. agathidicida is the primary pathogen of kauri and was the most aggressive in in vitro inoculations [34], P. cinnamomi has long been associated with declining kauri [74,75] and may have a significant impact on forest health and regeneration through dampening off seedlings [32]. This study showed that P. cinnamomi was widely spread throughout Te Wao Nui o Tiriwa/Waitākere Ranges and suggests it has been present in the natural environments of NZ for a long time. It is possible that P. cinnamomi will have a greater impact in kauri forests with climate change as extreme weather events would put kauri under stress, exacerbating the effects of P. cinnamomi [31,32,76].
Both P. cinnamomi and P. multivora are well-adapted to dry environments and are significant pathogens globally [5,76,77,78]. This study showed that P. multivora was more likely to occur alongside P. cinnamomi than by chance. This could be due to the similarities in their mechanisms for dispersal, broad host range, and tolerance of drier environments. While P. cinnamomi is well established as a pathogen in different forest ecosystems across the world, P. multivora is emerging as an important pathogen to oak (Quercus ilex L.) in Italy [5]. Both species pose a threat to kauri and potentially other plant species which are often uniquely associated with kauri. Understanding the roles P. cinnamomi and P. multivora play in kauri dieback is important as they are already present in areas where P. agathidicida is not (yet) and they were each isolated from soil beneath kauri trees showing poor health in the absence of P. agathidicida. Understanding if either P. cinnamomi or P. multivora are antagonistic to P. agathidicida infection or whether the presence of either predisposes a kauri tree to infection by P. agathidicida is important for understanding the latency of kauri dieback symptom expression. Current work is underway to investigate alternate hosts of Phytophthora species in kauri forests, which will help to determine the roles of P. cinnamomi and P. multivora in these systems. Future research should investigate the epidemiology of these co-occurring species to determine if they are synergistic, antagonistic, or have no effect on P. agathidicida.
The distribution of the three main species around the forest points to different invasion histories and establishment methods. P. cinnamomi has likely been present for the longest time, with its spread and establishment facilitated by its broad host range [79]. Phytophthora cinnamomi was isolated from kauri prior to 1959 [75]. Given its extensive distribution, it is likely that the plant community has already been impacted severely with any species highly sensitive to P. cinnamomi already affected. P. cinnamomi is frequently isolated from asymptomatic kauri, which would also enhance its dispersal. In contrast, P. agathidicida and P. multivora appear to be invading from the periphery of the park and are likely newer incursions into the forest [19].
During a stream baiting survey in 2011 in which P. cinnamomi and P. agathidicida were not detected, P. multivora was detected in all five catchments sampled (Cascades A and B, Piha A and B and Nihotapu) [30]. In the current study, approximately 10% of the samples from Piha A and B catchments (as described in Randall [30]) were positive for P. multivora. However, in contrast, all of the samples collected in the Cascades A (n = 35) and B (n = 10) catchments, were negative for P. multivora. The Nihotapu catchment represents a central area of the forest: only two of the samples in the current study fell within the catchment area marked in the Randall (2011) study and both were negative for P. multivora. Nevertheless, the positive detections during the stream baiting survey (Randall 2011) suggest P. multivora inoculum levels may be relatively high.
Of the four other Phytophthora species detected in the survey, P. kernoviae and P. cryptogea have previously been reported in kauri forests [17,18]. Based on the results of this study it would appear that previous detections of P. cryptogea in association with kauri are most likely to be P. pseudocyptogea based on current taxonomy, though these could not be definitively distinguished based on the genes used in this study and further confirmation of this was beyond the scope of the current study. The pathogenicity of P. kernoviae to kauri has not been tested, though it is likely native to NZ and does not pose a threat to most native plants [66]. Phytophthora pseudocryptogea can infect the feeder roots of kauri and cause damage like P. multivora and P. cinnamomi, however none were able to kill kauri seedlings alone during glasshouse inoculations [34]. The potentially unknown clade 7 P. europaea-like species detected in the ITS metabarcoding was later confirmed with RPS10 sequencing as being similar to P. europaea E.M. Hansen and T. Jung. To confirm if this is a new species, isolates need to be cultured so their morphology can be compared to other species and their DNA extracted and sequenced.
This study showed evidence through the qPCR of the mock communities that the enrichment process by nested PCRs used for metabarcoding makes them useful for a qualitative but not quantitative description of Phytophthora communities, supporting the results of Burgess, et al. [80]. Legeay, et al. [49], the designers of the primers, also concluded this based solely on the read counts in mock communities. In this study, the qPCR assay allowed for a read count cutoff decision that was less subjective than the usual method basing this on the sequencing output alone.
It is possible that the ITS metabarcoding primers were biased towards P. cinnamomi, considering the high number of positive detections; this could be a result of the nested PCR approach. The metabarcoding primers used were poor at detecting P. multivora compared to baiting. Phytophthora multivora was detected from 63 samples by baiting, of which only one sample was positive with both baiting and metabarcoding. Although there were five additional samples that were positive only with metabarcoding that would have been missed if only baiting was used. Two ASVs were detected for P. multivora (ASV7 was present in the field samples and ASV229 was present in the mock communities) which differed by one base pair. These two ‘types’ of P. multivora were detected during the soil baiting in the current study and during a stream baiting survey in Te Wao Nui o Tiriwa/Waitākere Ranges [30].
It is unknown if the primers have lower affinity for P. multivora, in the 50 bp ahead of the primer binding sites for the oom18S primer the GC content is 40% so there should not be a primer binding issue. There may be a masking effect occurring due to the presence of the other species. In the studies which previously used the same ITS metabarcoding primers, P. multivora was not present in the environment [7] or mock communities [49]. It is quite possible that P. multivora has a lower inoculum content in the rhizosphere around kauri and the use of 250 mg of soil for the eDNA extraction limited the detection of P. multivora compared to the number of positives found by baiting 100 g soil. The ecological role of P. multivora, including its invasion history within NZ forests, is not well understood and warrants further research.
It is likely that there are more Phytophthora species present in the wider forest associated with other plant species. The stream baiting survey by Randall [30] found four additional species to the current study including P. aspargi, P. gonapodyides, and P. chlamydospora, and an unknown P. sp. “Waitākere”. A more extensive survey of alternative host Phytophthora diversity with respect to the plant species across the various substrates (water, soil, leaves, and roots) would be needed to uncover the full diversity of Phytophthora in Te Wao Nui o Tiriwa/Waitākere Ranges. The baiting assay is optimised for P. agathidicida, however, by sampling seasonally and increasing the diversity of plants used for baits, a higher richness of Phytophthora species may have been detected [81].
The results of the current study supports previous surveys that showed using both metabarcoding and isolation techniques alongside each other yields greater information about Phytophthora species [9]. One key disadvantage of metabarcoding is the small amount of soil from which DNA is extracted, this is likely why there were fewer positive detections across samples with the sequencing compared to the baiting in the current study. This may be improved with increased replication or extraction from bulk soil samples but these can be cost prohibitive. The soil DNA extraction kit used only allows for high-throughput, standardised extractions based on small samples. Metabarcoding has the key advantage of being able to detect more species in a sample, especially those that are difficult to isolate (such as the unknown clade 7 species detected here).
Routine monitoring of environments like Te Wao Nui o Tiriwa/Waitākere Ranges will help inform predictive models and understanding of the spread of Phytophthora inoculum through the environment. When there are enough data, it may also become possible to unravel the invasion histories of different species, paths of introduction, and the latency period of kauri dieback disease progression (the time between when trees become infected, exhibit symptoms, and succumb to the disease). All of this will help to inform effective management of kauri dieback and help protect valuable areas, like the centre of Te Wao Nui o Tiriwa/Waitākere Ranges, from becoming infected.

5. Conclusions

Phytophthora agathidicida and P. multivora appear to have a limited distribution around the edge of Te Wao Nui o Tiriwa/Waitākere Ranges. In comparison, P. cinnamomi is widely distributed throughout the forest, suggesting an earlier invasion history or greater capacity for dispersal. All three species showed a significant relationship with decreasing canopy health of kauri but this relationship was vastly stronger for P. agathidicida, confirming it as the main driver of disease. Both P. cinnamomi and P. multivora have been noted as ‘fine root nibblers’ and may possibly contribute to tree decline in some circumstances [69,82]. Further analysis into spatial variation of Phytophthora species assemblages and historical points of disturbance (such as roads, logging sites, and tracks) may help uncover the different invasion histories of the Phytophthora community in the Waitākere Ranges. The use of metabarcoding alongside baiting complimented each other well and should be used in future surveys. This survey of Te Wao Nui o Tiriwa/Waitākere Ranges provides hope that large areas in the centre of the forest may still be protected from the devastating disease that is kauri dieback.

Supplementary Materials

The following supporting information can be downloaded at: https://www.mdpi.com/article/10.3390/f15050735/s1, Figure S1: Relationship between the DNA concentration (log femtograms) of the spiked mock community samples (for the ITS metabarcoding) and the cycle threshold (Cq) values in the multiplexed qPCR validation for Phytophthora agathidicida and P. cinnamomi. ‘Mock DNA samples’ shows the Cq values of the neat spiked eDNA samples as template and ‘Oom PCR template’ shows the Cq values when 1:100,000 dilutions of the oomycete specific PCR product (amplified with ITS primers oom18s/ITS7 for the primary metabarcoding PCR) was used as template in a qPCR; Figure S2. Pairwise co-occurrence matrix for the Phytophthora species detected in the current study. Orange and blue tiles correspond to species pairs that were less or more likely to co-occur than predicted by a null model. Created in R with the package cooccur version 1.3; Table S1: Sequence read counts from the ITS metabarcoding for the 30 soil samples which were selected for amplification with the nested RPS10 metabarcoding approach; Table S2: Sequence read counts from the RPS10 metabarcoding for the 30 soil samples which were selected for amplification with the nested RPS10 metabarcoding approach.

Author Contributions

Conceptualization, S.H., N.W. (Nari Williams) and I.H.; methodology, S.H., I.H. and N.W. (Nari Williams); validation, J.H. and E.C.; formal analysis, S.H. and P.S.; investigation, S.H., J.H., E.C., M.A., I.H. and J.N.; resources, I.H., N.W. (Nari Williams) and N.W. (Nick Waipara); data curation, S.H.; writing—original draft preparation, S.H.; writing—review and editing, S.H., P.S., I.H., M.A., J.H., B.B. and N.W.(Nari Williams); visualization, S.H.; supervision, N.W. (Nari Williams), N.W. (Nick Waipara), B.B. and P.S.; project administration, I.H. and N.W. (Nari Williams); funding acquisition, N.W. (Nari Williams) and N.W. (Nick Waipara). All authors have read and agreed to the published version of the manuscript.

Funding

Auckland Council funded the primary analysis of soils by baiting. Funding for soil curation and isolate sequencing was provided through the Ngā Rākau Taketake program of the New Zealand National Science Challenge. Funding for eDNA analysis was contributed from the George Mason Centre for the Natural Environment at the University of Auckland. This work was funded by the New Zealand Ministry of Business, Innovation and Employment (Ngā Rākau Taketake—Myrtle Rust and Kauri Dieback Research, C09X1817).

Data Availability Statement

This data set is not publicly available but will be made available upon request at the following data repository https://data.bioheritage.nz/ with a reference DOI once the paper is accepted for publication. Data access is subject to the approval of Auckland Council and Te Kawerau ā Maki (the tribal authority).

Acknowledgments

The authors wish to acknowledge and thank Te Kawerau ā Maki whose rohe (territory) this research was carried out in and for their support of this research. The surveillance program was carried out by Auckland Council and the team from BioSense and we thank Yue-Chin Chew and Lee Hill and their teams for their tremendous efforts in implementing this substantial surveillance program. Preeti Panda is thanked for her advice during the bioinformatic analysis. Indigo Michael and Gavin Lear contributed to the soil DNA extraction efforts and costs of the DNA extraction kits.

Conflicts of Interest

Authors S.H. and N.W. (Nari Williams) have received research grants from the George Mason Trust. Authors I.H., J.H., E.C., J.N., M.A., N.W. (Nick Waipara) and N.W. (Nari Williams) received funding from the New Zealand Ministry of Business, Innovation and Employment (Ngā Rākau Taketake—Myrtle Rust and Kauri Dieback Research, C09X1817). Authors S.H., I.H., J.H., E.C., J.N., M.A., N.W. (Nick Waipara) and N.W. (Nari Williams) were employed by the company “The New Zealand Institute for Plant & Food Research Limited”. The remaining authors declare that the research was conducted in the absence of any commercial or financial relationships that could be construed as a potential conflict of interest.

Appendix A

Table A1. Individual ASVs from the ITS sequencing which had more than 3000 reads. Sequences were trimmed to the start of the ITS1 gene and compared to the reference database from Professor Treena Burgess in Geneious Prime v.2022.0.1. Full length sequences were compared to the Whole Genome Shotgun contigs (wgs) database in NCBI.
Sample NumberASVSequence ReadsDatabaseSimilarityQuery CoverMost Similar Species
53592424,937ITS1 ref100.00%100%Phytophthora_AUS_1A_KY110340
wgs (whole seq)93.36%100%Phytophthora taxon totara
54802619,767ITS1 ref99.50%100%Phytophthora sp. in clade 12A
wgs (whole seq)99.05%100%P. tubulina
5129813105ITS1 ref100.00%100%P. gregata/gibbosa/gonapodyides
wgs (whole seq)98.84%100%P. chlamydospora

References

  1. Hansen, E.M. Phytophthora Species Emerging as Pathogens of Forest Trees. Curr. For. Rep. 2015, 1, 16–24. [Google Scholar] [CrossRef]
  2. Hansen, E.M.; Reeser, P.W.; Sutton, W. Phytophthora beyond agriculture. Annu. Rev. Phytopathol. 2012, 50, 359–378. [Google Scholar] [CrossRef] [PubMed]
  3. Prospero, S.; Heinz, M.; Augustiny, E.; Chen, Y.Y.; Engelbrecht, J.; Fonti, M.; Hoste, A.; Ruffner, B.; Sigrist, R.; Van Den Berg, N.; et al. Distribution, causal agents, and infection dynamic of emerging ink disease of sweet chestnut in Southern Switzerland. Environ. Microbiol. 2023, 25, 2250–2265. [Google Scholar] [CrossRef] [PubMed]
  4. Jung, T.; Jung, M.H.; Cacciola, S.O.; Cech, T.; Bakonyi, J.; Seress, D.; Mosca, S.; Schena, L.; Seddaiu, S.; Pane, A.; et al. Multiple new cryptic pathogenic Phytophthora species from Fagaceae forests in Austria, Italy and Portugal. IMA Fungus 2017, 8, 219–244. [Google Scholar] [CrossRef]
  5. Aurangzeb, W.; Guidoni, L.; Rodríguez, C.M.; Cecca, D.; Vannini, A. Exploring the diversity of Phytophthora spp. and the role of Phytophthora multivora in cork and holm oak coastal forests in Italy. Mycol. Prog. 2023, 22, 51. [Google Scholar] [CrossRef]
  6. Riddell, C.; Frederickson-Matika, D.; Armstrong, A.; Elliot, M.; Forster, J.; Hedley, P.; Morris, J.; Thorpe, P.; Cooke, D.; Pritchard, L.; et al. Metabarcoding reveals a high diversity of woody host-associated Phytophthora spp. in soils at public gardens and amenity woodlands in Britain. PeerJ 2019, 7, e6931. [Google Scholar] [CrossRef] [PubMed]
  7. Legeay, J.; Husson, C.; Boudier, B.; Louisanna, E.; Baraloto, C.; Schimann, H.; Marcais, B.; Buee, M. Surprising low diversity of the plant pathogen Phytophthora in Amazonian forests. Environ. Microbiol. 2020, 22, 5019–5032. [Google Scholar] [CrossRef] [PubMed]
  8. Riolo, M.; Aloi, F.; La Spada, F.; Sciandrello, S.; Moricca, S.; Santilli, E.; Pane, A.; Cacciola, S.O. Diversity of Phytophthora Communities across Different Types of Mediterranean Vegetation in a Nature Reserve Area. Forests 2020, 11, 853. [Google Scholar] [CrossRef]
  9. La Spada, F.; Cock, P.J.A.; Randall, E.; Pane, A.; Cooke, D.E.L.; Cacciola, S.O. DNA Metabarcoding and Isolation by Baiting Complement Each Other in Revealing Phytophthora Diversity in Anthropized and Natural Ecosystems. J. Fungi 2022, 8, 330. [Google Scholar] [CrossRef]
  10. Riit, T.; Cleary, M.; Adamson, K.; Blomquist, M.; Burokienė, D.; Marčiulynienė, D.; Oliva, J.; Poimala, A.; Redondo, M.A.; Strømeng, G.M.; et al. Oomycete Soil Diversity Associated with Betula and Alnus in Forests and Urban Settings in the Nordic–Baltic Region. J. Fungi 2023, 9, 926. [Google Scholar] [CrossRef]
  11. Jung, T.; Blaschke, H.; Oswald, W. Involvement of soilbourne Phytophthora species in central European oak decline and the effect of site factors on the disease. Plant Pathol. 2000, 49, 706–718. [Google Scholar] [CrossRef]
  12. Jung, T. Beech decline in Central Europe driven by the interaction between Phytophthora infections and climatic extremes. For. Pathol. 2009, 39, 73–94. [Google Scholar] [CrossRef]
  13. Podger, F.D. Phytophthora cinnamomi, a cause of lethal disease in indigenous plant communities in Western Australia. Phytopathology 1972, 62, 972–981. [Google Scholar] [CrossRef]
  14. Rea, A.J.; Jung, T.; Burgess, T.I.; Stukely, M.J.C.; Hardy, G.E.S.J. Phytophthora elongata sp. nov., a novel pathogen from the Eucalyptus marginata forest of Western Australia. Australas. Plant Path 2010, 39, 477–491. [Google Scholar] [CrossRef]
  15. Ellison, A.M.; Bank, M.S.; Clinton, B.D.; Colburn, E.A.; Elliott, K.; Ford, C.R.; Foster, D.R.; Kloeppel, B.D.; Knoepp, J.D.; Lovett, G.M.; et al. Loss of Foundation Species: Consequences for the Structure and Dynamics of Forested Ecosystems. Front. Ecol. Environ. 2005, 3, 479–486. [Google Scholar] [CrossRef]
  16. Weir, B.S.; Paderes, E.P.; Anand, N.; Uchida, J.Y.; Pennycook, S.R.; Bellgard, S.E.; Beever, R.E. A taxonomic revision of Phytophthora Clade 5 including two new species, Phytophthora agathidicida and P. cocois. Phytotaxa 2015, 205, 21. [Google Scholar] [CrossRef]
  17. Beever, R.E.; Waipara, N.; Ramsfield, T.; Dick, M.; Horner, I. Kauri (Agathis australis) under threat from Phytophthora? In Proceedings of the 4th IUFRO Working Party on Phytophthoras in Forests and Native Ecosystems, Monetrey, CA, USA, 26–31 August 2007; pp. 72–85. [Google Scholar]
  18. Waipara, N.W.; Hill, S.; Hill, L.M.W.; Hough, E.G.; Horner, I.J. Surveillance methods to determine tree health, distribution of kauri dieback disease and associated pathogens. N. Z. Plant Prot. 2013, 66, 235–241. [Google Scholar] [CrossRef]
  19. Winkworth, R.C.; Bellgard, S.E.; McLenachan, P.A.; Lockhart, P.J. The mitogenome of Phytophthora agathidicida: Evidence for a not so recent arrival of the “kauri killing” Phytophthora in New Zealand. PLoS ONE 2021, 16, e0250422. [Google Scholar] [CrossRef] [PubMed]
  20. Ahmed, M.; Ogden, J. Population dynamics of the emergent conifer Agathis australis (D. Don) Lindl. (Kauri) in New Zealand I. Population structures and tree growth rates in mature stands. N. Z. J. Bot. 1987, 25, 217–229. [Google Scholar] [CrossRef]
  21. Steward, G.A.; Beveridge, A.E. A review of New Zealand kauri (Agathis australis (D.Don) Lindl.): Its ecology, history, growth and potential for management for timber. N. Z. J. For. Sci. 2010, 40, 33–59. [Google Scholar]
  22. Halkett, J.C. A basis for the management of New Zealand kauri (Agathis australis (D. Don) Lindl.) forest. N. Z. J. For. 1983, 28, 15–23. [Google Scholar]
  23. Black, A.; Waipara, N.W.; Gerth, M. Correspondence: Save Maori people’s sacred tree species. Nature 2018, 561, 177. [Google Scholar] [CrossRef] [PubMed]
  24. Fadiman, M. Kauri (Agathis australis) ethnobotany: Identity, conservation and connection in New Zealand. Fla. Geogr. 2010, 41, 4–21. [Google Scholar]
  25. Hill, L.; Stanley, R.; Hammon, C.; Waipara, N. Kauri Dieback Report 2017: An Investigation into the Distribution of Kauri Dieback, and Implications for its Future Management, within the Waitakere Ranges Regional Park; Auckland Council: Auckland, New Zealand, 2017.
  26. Wyse, S.V.; Burns, B.R.; Wright, S.D. Distinctive vegetation communities are associated with the long-lived conifer Agathis australis (New Zealand kauri, Araucariaceae) in New Zealand rainforests. Austral Ecol. 2014, 39, 388–400. [Google Scholar] [CrossRef]
  27. Padamsee, M.; Johansen, R.B.; Stuckey, S.A.; Williams, S.E.; Hooker, J.E.; Burns, B.R.; Bellgard, S.E. The arbuscular mycorrhizal fungi colonising roots and root nodules of New Zealand kauri Agathis australis. Fungal Biol. 2016, 120, 807–817. [Google Scholar] [CrossRef]
  28. Ogden, J. The long-term conservation of forest diversity in New Zealand. Pac. Conserv. Biol. 1995, 2, 77–90. [Google Scholar] [CrossRef]
  29. Beever, R.E.; Bellgard, S.E.; Dick, M.A.; Horner, I.J.; Ramsfield, T.D. Detection of Phytophthora taxon Agathis; Ministry for Agriculture & Forestry, Biosecurity New Zealand: Wellington, New Zealand, 2010.
  30. Randall, S.D. Fishing for Phytophthora: A Yearlong Investigation into the Diversity of Phytophthora Species in the Waitakere Ranges, Auckland, NZ. MSc. Ph. D. Thesis, University of Auckland, Auckland, New Zealand, 2011. [Google Scholar]
  31. Podger, F.D.; Newhook, F.J. Phytophthora cinnamomi in indigenous plant communities in New Zealand. N. Z. J. Bot. 1971, 9, 625–638. [Google Scholar] [CrossRef]
  32. Horner, I.J. The Role of Phytophthora cinnamomi and other Fungal Pathogens in the Establishment of Kauri and kahikatea; University of Auckland: Auckland, New Zealand, 1984. [Google Scholar]
  33. NZOR. New Zealand Organisms Register. Available online: https://www.nzor.org.nz/ (accessed on 13 February 2024).
  34. Horner, I.J.; Hough, E.G. Pathogenicity of four Phytophthora species on kauri: In vitro and glasshouse trials. N. Z. Plant Prot. 2014, 67, 54–59. [Google Scholar] [CrossRef]
  35. Català, S.; Pérez-Sierra, A.; Abad-Campos, P. The Use of Genus-Specific Amplicon Pyrosequencing to Assess Phytophthora Species Diversity Using eDNA from Soil and Water in Northern Spain. PLoS ONE 2015, 10, e0119311. [Google Scholar] [CrossRef]
  36. Burgess, T.I.; White, D.; McDougall, K.M.; Garnas, J.; Dunstan, W.A.; Català, S.; Carnegie, A.J.; Worboys, S.; Cahill, D.; Vettraino, A.M.; et al. Distribution and diversity of Phytophthora across Australia. Pac. Conserv. Biol. 2017, 23, 150–162. [Google Scholar] [CrossRef]
  37. Català, S.; Berbegal, M.; Pérez-Sierra, A.; Abad-Campos, P. Metabarcoding and development of new real-time specific assays reveal Phytophthora species diversity in holm oak forests in eastern Spain. Plant Pathol. 2017, 66, 115–123. [Google Scholar] [CrossRef]
  38. Khaliq, I.; Hardy, G.; White, D.; Burgess, T.I. eDNA from roots: A robust tool for determining Phytophthora communities in natural ecosystems. FEMS Microbiol. Ecol. 2018, 94, 11. [Google Scholar] [CrossRef] [PubMed]
  39. Bose, T.; Wingfield, M.J.; Roux, J.; Vivas, M.; Burgess, T.I. Community composition and distribution of Phytophthora species across adjacent native and non-native forests of South Africa. Fungal Ecol. 2018, 36, 17–25. [Google Scholar] [CrossRef]
  40. Vannini, A.; Bruni, N.; Tomassini, A.; Franceschini, S.; Vettraino, A.M. Pyrosequencing of environmental soil samples reveals biodiversity of the Phytophthora resident community in chestnut forests. FEMS Microbiol. Ecol. 2013, 85, 433–442. [Google Scholar] [CrossRef] [PubMed]
  41. Byers, A.K.; Condron, L.; Donavan, T.; O’Callaghan, M.; Patuawa, T.; Waipara, N.; Black, A. Soil microbial diversity in adjacent forest systems—Contrasting native, old growth kauri (Agathis australis) forest with exotic pine (Pinus radiata) plantation forest. FEMS Microbiol. Ecol. 2020, 96, 12. [Google Scholar] [CrossRef] [PubMed]
  42. Jongkind, A.G.; Buurman, P. The effect of kauri (Agathis australis) on grain size distribution and clay mineralogy of andesitic soils in the Waitakere Ranges, New Zealand. Geoderma 2006, 134, 171–186. [Google Scholar] [CrossRef]
  43. Froud, K.; Chew, Y.C.; Kean, J.; Jae, M.; Killick, S.; Ashby, E.; Taua-Gordon, R.; Jamieson, A.; Tolich, L. 2021 Waitakere Ranges Kauri Population Health Monitoring Survey; Auckland Council Technical Report; Auckland Council: Auckland, New Zealand, 2022.
  44. Dick, M.; Bellgard, S.E. Soil survey method for Phytophthora taxon Agathis. In Report Prepared for the Ministry of Agriculture and Forestry on behalf of Kauri Dieback Joint Agency, Version 2.1; Beauchamp, A.J., Ed.; Department of Conservation: Wellington, New Zealand, 2012; p. 13. [Google Scholar]
  45. O’Brien, P.A.; Williams, N.; Hardy, G.E.S. Detecting Phytophthora. Crit. Rev. Microbiol. 2009, 35, 169–181. [Google Scholar] [CrossRef] [PubMed]
  46. Erwin, D.C.; Ribeiro, O.K. Phytophthora Diseases Worldwide; APS Press: St. Paul, MN, USA, 1996. [Google Scholar]
  47. White, T.; Bruns, T.; Lee, S.; Taylor, J.; Innis, M.; Gelfand, D.; Sninsky, J. Amplification and Direct Sequencing of Fungal Ribosomal RNA Genes for Phylogenetics. PCR Protoc. 1990, 31, 315–322. [Google Scholar]
  48. Robideau, G.P.; De Cock, A.W.A.M.; Coffey, M.D.; Voglmayr, H.; Brouwer, H.; Bala, K.; Chitty, D.W.; Désaulniers, N.; Eggertson, Q.A.; Gachon, C.M.M.; et al. DNA barcoding of oomycetes with cytochrome c oxidase subunit I and internal transcribed spacer. Mol. Ecol. Resour. 2011, 11, 1002–1011. [Google Scholar] [CrossRef]
  49. Legeay, J.; Husson, C.; Cordier, T.; Vacher, C.; Marcais, B.; Buée, M. Comparison and validation of Oomycetes metabarcoding primers for Phytophthora high throughput sequencing. J. Plant Pathol. 2019, 101, 743–748. [Google Scholar] [CrossRef]
  50. Scibetta, S.; Schena, L.; Chimento, A.; Cacciola, S.O.; Cooke, D.E.L. A molecular method to assess Phytophthora diversity in environmental samples. J. Microbiol. Meth. 2012, 88, 356–368. [Google Scholar] [CrossRef] [PubMed]
  51. Martin, F.N.; Coffey, M.D. Mitochondrial Haplotype Analysis for Differentiation of Isolates of Phytophthora Cinnamomi. Phytopathology 2012, 102, 229–239. [Google Scholar] [CrossRef]
  52. Foster, Z.S.L.; Albornoz, F.E.; Fieland, V.J.; Larsen, M.M.; Jones, F.A.; Tyler, B.M.; Nguyen, H.D.T.; Burgess, T.I.; Riddell, C.; Voglmayr, H.; et al. A New Oomycete Metabarcoding Method Using the rps10 Gene. Phytobiomes J. 2022, 6, 214–226. [Google Scholar] [CrossRef]
  53. Illumina. llumina 16S Metagenomic Sequencing Library Preparation (IlluminaTechnical Note 15044223). 2013. Available online: https://support.illumina.com/documents/documentation/chemistry_documentation/16s/16s-metagenomic-library-prep-guide-15044223-b.pdf (accessed on 24 January 2024).
  54. McDougal, R.; Bellgard, S.E.; Scott, P.; Ganley, B. Comparison of a Real Time PCR Assay and a Soil Bioassay Technique for Detection of Phytophthora taxon Agathis from Soil; Scion: Rotorua, New Zealand, 2014. [Google Scholar]
  55. Than, D.; Hughes, K.; Boonhan, N.; Tomlinson, J.; Woodhall, J.; Bellgard, S. A TaqMan real-time PCR assay for the detection of Phytophthora ‘taxon Agathis’ in soil, pathogen of Kauri in New Zealand. For. Pathol. 2013, 43, 324–330. [Google Scholar] [CrossRef]
  56. Kunadiya, M.; White, D.; Dunstan, W.A.; St, G.E.; Hardy, J.; Andjic, V.; Burgess, T.I. Pathways to false positive diagnoses using molecular genetic detection methods; Phytophthora cinnamomi a case study. Fems Microbiol. Lett. 2017, 364, fnx009. [Google Scholar] [CrossRef]
  57. Callahan, B.J.; McMurdie, P.J.; Rosen, M.J.; Han, A.W.; Johnson, A.J.A.; Holmes, S.P. DADA2: High-resolution sample inference from Illumina amplicon data. Nat. Methods 2016, 13, 581–583. [Google Scholar] [CrossRef] [PubMed]
  58. Andrews, S. FastQC: A Quality Control Tool for High Throughput Sequence Data. Version 0.12.0. 2010. Available online: http://www.bioinformatics.babraham.ac.uk/projects/fastqc/ (accessed on 20 February 2024).
  59. Ewels, P.; Magnusson, M.; Lundin, S.; Käller, M. MultiQC: Summarize analysis results for multiple tools and samples in a single report. Bioinformatics 2016, 32, 3047–3048. [Google Scholar] [CrossRef]
  60. R Core Team. R: A language and Environment for Statistical Computing; R Foundation for Statistical Computing: Vienna, Austria, 2023. [Google Scholar]
  61. Venables, B.; Ripley, B. Modern Applied Statistics with S, 4th ed.; Springer: New York, NY, USA, 2002; ISBN 0-387-95457-0. [Google Scholar]
  62. Zuur, A.F.; Ieno, E.N. A protocol for conducting and presenting results of regression-type analyses. Methods Ecol. Evol. 2016, 7, 636–645. [Google Scholar] [CrossRef]
  63. Griffith, D.M.; Veech, J.A.; Marsh, C.J. cooccur: Probabilistic Species Co-Occurrence Analysis in R. J. Stat. Softw. Code Snippets 2016, 69, 1–17. [Google Scholar] [CrossRef]
  64. Larsson, J. eulerr: Area-Proportional Euler and Venn Diagrams with Ellipses. R Package Version 7.0.0. 2022. Available online: https://rdrr.io/cran/eulerr/ (accessed on 20 February 2024).
  65. Wickham, H. ggplot2: Elegant Graphics for Data Analysis; Springer: New York, NY, USA, 2016. [Google Scholar]
  66. Gardner, J.F.; Dick, M.A.; Bader, M.K.-F. Susceptibility of New Zealand flora to Phytophthora kernoviae and its seasonal variability in the field. N. Z. J. For. Sci. 2015, 45, 23. [Google Scholar] [CrossRef]
  67. Scott, P.; Williams, N. Phytophthora diseases in New Zealand forests. N. Z. J. For. 2014, 59, 14–21. [Google Scholar]
  68. Bregant, C.; Batista, E.; Hilário, S.; Linaldeddu, B.T.; Alves, A. Phytophthora Species Involved in Alnus glutinosa Decline in Portugal. Pathogens 2023, 12, 276. [Google Scholar] [CrossRef]
  69. Seddaiu, S.; Brandano, A.; Ruiu, P.A.; Sechi, C.; Scanu, B. An overview of Phytophthora species inhabiting declining Quercus suber stands in Sardinia (Italy). Forests 2020, 11, 971. [Google Scholar] [CrossRef]
  70. Corcobado, T.; Cech, T.L.; Daxer, A.; Ďatková, H.; Janoušek, J.; Patra, S.; Jahn, D.; Hüttler, C.; Milenković, I.; Tomšovský, M.; et al. Phytophthora, Nothophytophthora and Halophytophthora diversity in rivers, streams and riparian alder ecosystems of Central Europe. Mycol. Prog. 2023, 22, 50. [Google Scholar] [CrossRef] [PubMed]
  71. Greslebin, A.G.; Hansen, E.M.; Winton, L.M.; Rajchenberg, M. Phytophthora species from declining Austrocedrus chilensis forests in Patagonia, Argentina. Mycologia 2005, 97, 218–228. [Google Scholar] [CrossRef]
  72. Lyubenova, A.; Kostov, K.; Tsvetkov, I.; Slavov, S. Possible contribution of Phytophthora spp. in decline of Norway spruce (P. abies (L.) H. Karst.) stands in Vitosha Mountain. Silva Balc. 2014, 15, 100–109. [Google Scholar]
  73. Riddell, C.E.; Dun, H.F.; Elliot, M.; Armstrong, A.C.; Clark, M.; Forster, J.; Hedley, P.E.; Green, S. Detection and spread of Phytophthora austrocedri within infected Juniperus communis woodland and diversity of co-associated Phytophthoras as revealed by metabarcoding. For. Pathol. 2020, 50, e12602. [Google Scholar] [CrossRef]
  74. Newhook, F.J. The association of Phytophthora spp. with mortality of Pinus radiata and other conifers. N. Z. J. Agric. Res. 1959, 2, 808–843. [Google Scholar] [CrossRef]
  75. Brien, R.M.; Dingley, J.M. Fourth supplement to “A revised list of plant diseases recorded in New Zealand”, 1957–1958. N. Z. J. Agric. Res. 1959, 2, 406–413. [Google Scholar] [CrossRef]
  76. Burgess, T.I.; Scott, J.K.; McDougall, K.L.; Stukely, M.J.C.; Crane, C.; Dunstan, W.A.; Brigg, F.; Andjic, V.; White, D.; Rudman, T.; et al. Current and projected global distribution of Phytophthora cinnamomi, one of the world’s worst plant pathogens. Glob. Chang. Biol. 2017, 23, 1661–1674. [Google Scholar] [CrossRef]
  77. Scott, P.M.; Burgess, T.I.; Barber, P.A.; Shearer, B.L.; Stukely, M.J.C.; Hardy, G.E.S.; Jung, T. Phytophthora multivora sp nov., a new species recovered from declining Eucalyptus, Banksia, Agonis and other plant species in Western Australia. Persoonia 2009, 22, 1–13. [Google Scholar] [CrossRef] [PubMed]
  78. Tsykun, T.; Prospero, S.; Schoebel, C.N.; Rea, A.; Burgess, T.I. Global invasion history of the emerging plant pathogen Phytophthora Multivora. BMC Genom. 2022, 23, 153. [Google Scholar] [CrossRef] [PubMed]
  79. Hardham, A.R.; Blackman, L.M. Phytophthora cinnamomi. Mol. Plant Pathol. 2018, 19, 260–285. [Google Scholar] [CrossRef] [PubMed]
  80. Burgess, T.I.; White, D.; Sapsford, S.J. Comparison of Primers for the Detection of Phytophthora (and Other Oomycetes) from Environmental Samples. J. Fungi 2022, 8, 980. [Google Scholar] [CrossRef] [PubMed]
  81. Sarker, S.R.; McComb, J.; Burgess, T.I.; Hardy, G.E.S.J. Timing and abundance of sporangia production and zoospore release influences the recovery of different Phytophthora species by baiting. Fungal Biol. 2021, 125, 477–484. [Google Scholar] [CrossRef]
  82. Ruiz Gómez, F.J.; Pérez-de-Luque, A.; Sánchez-Cuesta, R.; Quero, J.L.; Navarro Cerrillo, R.M. Differences in the Response to Acute Drought and Phytophthora cinnamomi Rands Infection in Quercus ilex L. Seedlings. Forests 2018, 9, 634. [Google Scholar] [CrossRef]
Figure 1. Location of the 767 soil samples (represented by red circles) collected in the Waitākere Ranges Regional Park survey for the current study. The smaller map on the left shows the location of the Waitākere Ranges Regional Park in relation to Auckland City on the upper North Island of New Zealand.
Forests 15 00735 g001
Figure 2. The number of sequences produced for Phytophthora agathidicida (blue with solid line), P. cinnamomi (pink with short dashes), and P. pseudocryptogea (green with long dashes) in the mock community samples with known DNA concentrations. Each line represents the best-fit line from the negative binomial generalised linear model (made using the R package MASS version 7.3.60) for each species and the surrounding shaded areas indicate 95% confidence intervals (CI). Phytophthora multivora was omitted due to lack of sequence reads.
Forests 15 00735 g002
Figure 3. A phylogram based on ITS1 gene sequence data indicating the placement of the two clade 7 species detected in this study in relation to closely related taxa. Phytophthora cinnamomi represented by ASV1_extraction and Phytophthora sp. unknown represented by ASV10_extraction. The sequences were trimmed to the ITS1 gene region and compared with the curated ITS1 gene database supplied by Professor Treena Burgess (Harry Butler Institute, Murdoch University, Murdoch, WA, Australia). Numbers above the branch represent the bootstrap support based on parsimony analysis.
Forests 15 00735 g003
Figure 4. Venn Diagrams (created using the R package eulerr) showing the number of positive samples for Phytophthora cinnamomi, P. agathidicida, and P. multivora using either baiting or ITS metabarcoding.
Forests 15 00735 g004
Figure 5. Distribution of the three key species, Phytophthora cinnamomi (pink), P. agathidicida (blue), and P. multivora (yellow), across the Waitākere Ranges Regional Park, New Zealand. The grey circles indicate the position of samples in which the relevant Phytophthora species was not detected. Created in ARC GIS Pro version 2.7.1. The scale bar is 4 km.
Forests 15 00735 g005
Figure 6. Co-occurrence of Phytophthora cinnamomi (pink), P. agathidicida (blue), and P. multivora (yellow) in the sampled kauri trees which were asymptomatic for kauri dieback (canopy score less than 3; n = 595) or symptomatic (canopy dieback score ≥ 3 and/or the presence of a basal bleed; n = 172). Positive detections with either baiting or ITS metabarcoding. There was one asymptomatic sample positive for P. agathidicida and P. multivora only, shown by the ‘1’ outside the Venn diagram with a directional line.
Forests 15 00735 g006
Figure 7. Phytophthora agathidicida (blue with solid line), P. cinnamomi (pink with short dashes), and P. multivora (yellow with long dashes) presence in kauri soil samples in association with canopy dieback scores (score of 0 = healthy tree, score of 5 = dead tree). Solid lines and surrounding grey areas indicate the fits and 95% confidence intervals (CI) from binomial generalised linear models (NBGLM) created in R with the package stats.
Forests 15 00735 g007
Table 1. Primers used for target species in the qPCR validation assay.
Primer or Probe NameTarget SpeciesSequence (5′ to 3′)Notes *References
ITS_PTA_F2P. agathidicidaAACCAATAGTTGGGGGCGA [54,55]
ITS_PTA_R3 CTCGCCATGATAGAGCTCGTC [54]
ITS_PTA_probe2 AGCCAAAGCCAGCAGCCG5′ FAM, 3′ BHQ1[54]
PCIN F6P. cinnamomiCGTGGCGGGCCCTATC [56]
PCIN R2 AAAAGAGAGGCTACTAGCTCAGTTCCC [56]
PCIN probe TGGCGAGCGTTTGGGTCCCTCT5′ HEX, 3′ BHQ2[56]
* Notes: Florescent dye label for the probes.
Table 2. Phytophthora species (n = 7) detected by soil baiting and metabarcoding from Agathis australis (kauri) rhizosphere samples (n = 767) in the Waitākere Ranges.
Phytophthora SpeciesCladeSoil BaitingMetabarcoding (Soil eDNA)Total DetectionsTotal Detections (%)
P. cinnamomi740423145559.3
P. agathidicida579448411.0
P. multivora2636688.9
P. sp. (P. europaea-like)7020202.6
P. cactorum/P. aleatoria10440.5
P. pseudocryptogea/P. cryptogea81220.3
P. kernoviae10b0220.3
Table 3. Mock community samples created by spiking eDNA from five samples with known concentrations of DNA extracted from pure cultures of Phytophthora cinnamomi (isolate H1454), P. agathidicida (isolate H1453), P. pseudocryptogea (isolate H1258), and P. multivora (isolate H1467) and the proportion of sequence reads detected for each species in each sample. Isolate IDs in brackets refer to the Plant & Food Research Phytophthora isolate collection located at the Hawkes Bay Site, New Zealand.
Reads (%) *
Sample IDDNA (ng/µL)P. cinnamomi (H1454)P. agathidicida (H1453)P. pseudocryptogea (H1258)P. multivora (H1467)
60000.153.316.027.90.0
60010.0151.019.427.40.0
60020.00155.915.326.80.7
60110.000160.72.833.40.0
60030.01-0.3--
0.158.3-38.20.0
60040.001-31.4--
0.116.5-48.71.1
60050.013.3---
0.1-37.557.61.0
60060.00169.6---
0.1-19.27.00.0
60070.01--0.7-
0.171.022.8-0.3
60080.001--30.2-
0.152.017.5-0.0
60090.01---0.0
0.153.217.129.7-
60100.001---0.0
0.162.29.126.6-
* The reads (%) was calculated by summing the total number of reads per sample and then dividing that number by the total number of reads for each species.
Disclaimer/Publisher’s Note: The statements, opinions and data contained in all publications are solely those of the individual author(s) and contributor(s) and not of MDPI and/or the editor(s). MDPI and/or the editor(s) disclaim responsibility for any injury to people or property resulting from any ideas, methods, instructions or products referred to in the content.

