Article

A Study of the Effects of Stimulants on Resin Yield, Resin Duct and Turpentine Chemical Composition in Pinus kesiya var. langbianensis

1
Yunnan Provincial Key Laboratory of Wood Adhesives and Glued Products, Southwest Forestry University, Kunming 650224, China
2
International Joint Research Center for Biomass Materials, Southwest Forestry University, Kunming 650224, China
*
Author to whom correspondence should be addressed.
Forests 2024, 15(5), 748; https://doi.org/10.3390/f15050748
Submission received: 22 March 2024 / Revised: 23 April 2024 / Accepted: 23 April 2024 / Published: 25 April 2024
(This article belongs to the Section Forest Ecophysiology and Biology)

Abstract

:
This study presents a comprehensive examination of Pinus kesiya var. langbianensis (Pinus kesiya var. langbianensis), the primary resin-extraction tree species in Yunnan Province, China. In this study, we formulated different concentration gradients of 0.25%, 0.5%, 1%, and 2% of diquat solution as tapping stimulant to test the effect of different concentrations on the resin gain rate of Pinus kesiya, and analyzed the relationship between anatomical structure, major chemical composition of turpentine and resin yield by methods such as wood anatomy and chemical composition analysis of turpentine. The primary focus of the investigation was on exploring the interrelationships among resin-tapping stimulants, anatomical structures, turpentine components, and resin yield. Research findings demonstrate a significant enhancement in resin production due to the application of stimulants, with the highest increase rate reaching 55% in a specific group, while others achieved approximately 30% increments. Moreover, measurement data about resin duct dimensions indicate a noteworthy increase in resin duct area for the stimulant-treated group compared to the control group. However, it should be noted that the impact on resin duct area by varying stimulant concentrations was relatively minor. Furthermore, continuous observation of resin extraction from different resin-yield classes of P. kesiya revealed insignificant variation in resin yield over time for the low and moderate resin-yield groups. In contrast, the high resin-yield group exhibited a gradual increase in resin production. Interestingly, the high resin-yield group exhibited the smallest resin duct area, but the highest resin duct density, indicating an interconnectedness of resin duct-related data that influences resin yield. Additionally, correlative investigations between anatomical structures and resin yield demonstrate a positive correlation between resin duct area and resin yield, total resin production, and average resin yield. This underscores the importance of resin duct area as a significant factor in resin production. On the other hand, the influence of stimulant concentrations on the turpentine components was found to be negligible. Overall, the correlation results suggest that turpentine components cannot reliably predict or differentiate between high and low resin-yield trees. This study provides a comprehensive analysis of the interrelationships among stimulants, anatomical structures, and turpentine components, offering a theoretical foundation for the resin extraction and resin processing industries in Yunnan Province.

1. Introduction

P. kesiya var. langbianensis (Pinus kesiya var. langbianensis), a tropical coniferous tree species, is widely distributed in Southeast Asia, growing between the latitudes of 12° and 30° N [1]. This species naturally occurs in northeastern India, Myanmar, China, Thailand, Laos, Cambodia, Vietnam, and the Philippines. It primarily thrives in mountainous regions at altitudes ranging from 350 to 2900 m, particularly above 1000 m [1]. In Yunnan Province, it is extensively found in southern regions such as Malipo, Simao, Puer, Jinghong, and western areas. It serves as one of the prominent fast-growing timber and resin-producing tree species in Yunnan [2]. P. kesiya var. langbianensis is known for its high resin yield, with an average resin content of 20% and a maximum of 32% [3]. According to the 2012 continuous forest resource survey data in Yunnan Province, the area covered by P. kesiya var. langbianensis is approximately 56.63 × 10⁴ hectares, with a resin storage capacity of around 27.3 × 10⁴ tons [4,5].
Resin is produced and stored in the vertical and horizontal duct systems of the phloem and xylem in trees [6]. Resin ducts exist in trees before insect attacks as an induced defense mechanism, producing resin when injured or infected [7,8]. Different characteristics of the resin duct network are correlated with resin yield [9,10]. Some research results have shown a high correlation between resin duct dimensions and resin production. In some cases, resin duct density is also positively correlated with resin yield. However, the significance of these relationships varies across studies [11,12,13,14,15]. In summary, although previous research has confirmed the general notion that larger resin ducts are associated with higher resin production, the relationship is not as strong as expected. Therefore, further investigation into the correlation between resin ducts and resin production is necessary. Furthermore, despite being a high-resin-yielding tree species unique to Yunnan Province, there is limited academic research on P. kesiya var. langbianensis. Studying the anatomical structure of P. kesiya var. langbianensis not only advances our understanding of the relationship between resin production and anatomy in the Pinaceae family, but also provides a theoretical basis for efficient resin extraction and breeding of P. kesiya var. langbianensis.
Resin is a mixture of various terpenoid compounds, and it can be fractionated into turpentine (monoterpenes and sesquiterpenes) and rosin (diterpenes) through simple distillation processes [16,17]. Rosin primarily consists of various resin acids isomers (such as abietic acid, neoabietic, palustric and levopimaradiene acids, etc.) [18]. It finds wide applications in industries such as ink production, adhesives, papermaking, food additives, pharmaceuticals, and other industrial sectors [19]. Turpentine, on the other hand, is mainly composed of monoterpenes (such as α-pinene, β-pinene, limonene, etc.) and sesquiterpenes (such as longifolene, caryophyllene, etc.). It is widely used in the fields of food, biomedicine, agriculture, and functional materials [19].
The collection of resin plays a crucial role in the production of rosin and turpentine. Over the past three decades, due to rising labor costs in Europe, the focus of resin collection has gradually shifted to China [20]. In recent years, China has emerged as a major player in resin production, benefiting from its abundant labor force and the natural advantages of tree species such as P. kesiya var. langbianensis, Masson Pine (Pinus massoniana Lamb), and Slash Pine (Pinus elliottii var. elliottii) [21]. The annual resin production in China has reached 600,000 tons, accounting for 60% of the national gum resin production and 50% of the global resin trade [21,22].
Stimulating pastes can significantly increase turpentine production and economics. These chemical stimulants, applied after mechanical trauma, promote resin production by inducing slow necrosis of living cells and prolonging the exudation process [23]. Parham, M.R. et al. [24] developed a viscous paste-like stimulus. Currently, the primary adhesives used include sulfuric acid, potassium, salicylic acid, Ethephon, Ethrel, benzoic acid, neftalene acetic acid, paraquat, copper, and 2-Chloroethyl phosphonic Acid (CEPA) [25,26,27,28,29,30,31]. Among the above compounds, salicylic acid is a phytohormone involved in signaling the induced response to biotic damage, and Ethephon, Ethrel, and CEPA are synthetic precursors of ethylene, which is also a phytohormone involved in the signaling of defensive responses to mechanical and biotic stimuli. Studies have compared the yields of these stimulating compounds, and have shown a tendency to reduce the use of sulfuric acid, opting for alternative components such as citric acid or methyl jasmonate. The latter is another plant hormone involved in signal transduction for injury-induced responses. Plant hormones are naturally pure and uncontaminated, but their prices are considerably high, which has hindered the widespread adoption of resin collection practices. In this experiment, Diquat is employed as a stimulant due to its low cost.

2. Materials and Methods

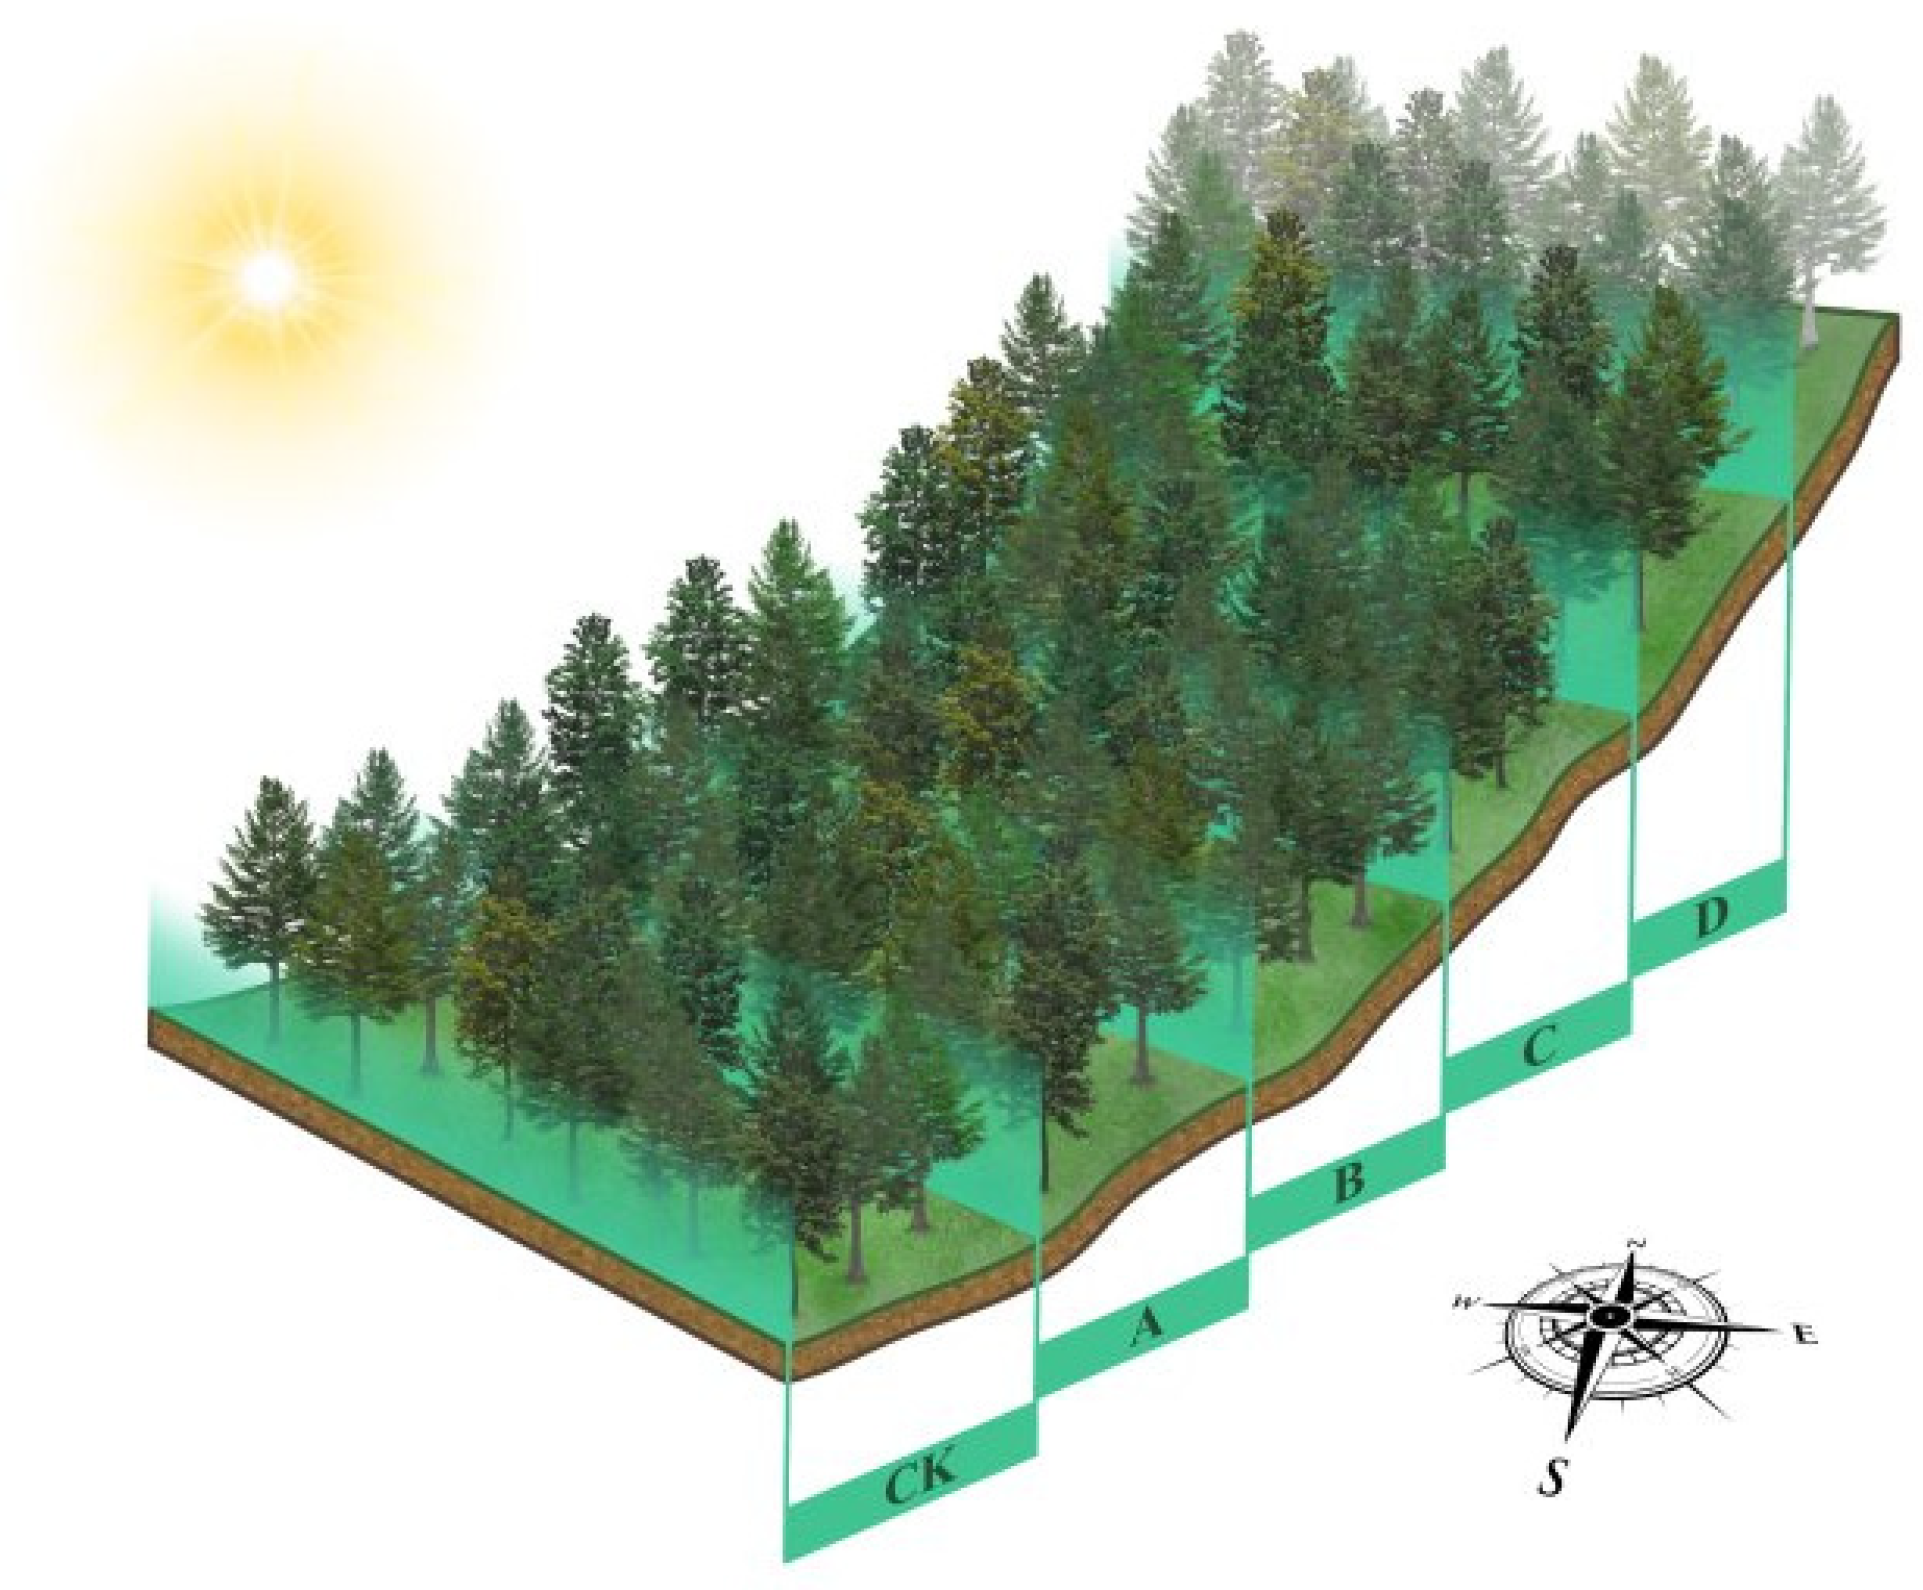
2.1. Study Area and Selection of Sample Trees

In May 2023, a 20-year-old P. kesiya var. langbianensis plantation located in Mengda County, Puer City, Yunnan Province, China, was selected as the experimental site (longitude: 100°48′16″, latitude: 24°8′1″, altitude: 1326 m). The site falls within a subtropical monsoon climate, with an average annual temperature of 17.9 °C, an average annual rainfall of 155.4 mm, and an average annual sunshine duration of 2206 h. After conducting a survey, it was determined that the site consisted of a mature P. kesiya var. langbianensis plantation. A total of 75 vigorous and healthy trees with a breast diameter of (18 ± 2) cm were selected as sample trees. These trees were carefully numbered and divided into five experimental zones (Figure 1).

2.2. Stimulant Application Methods
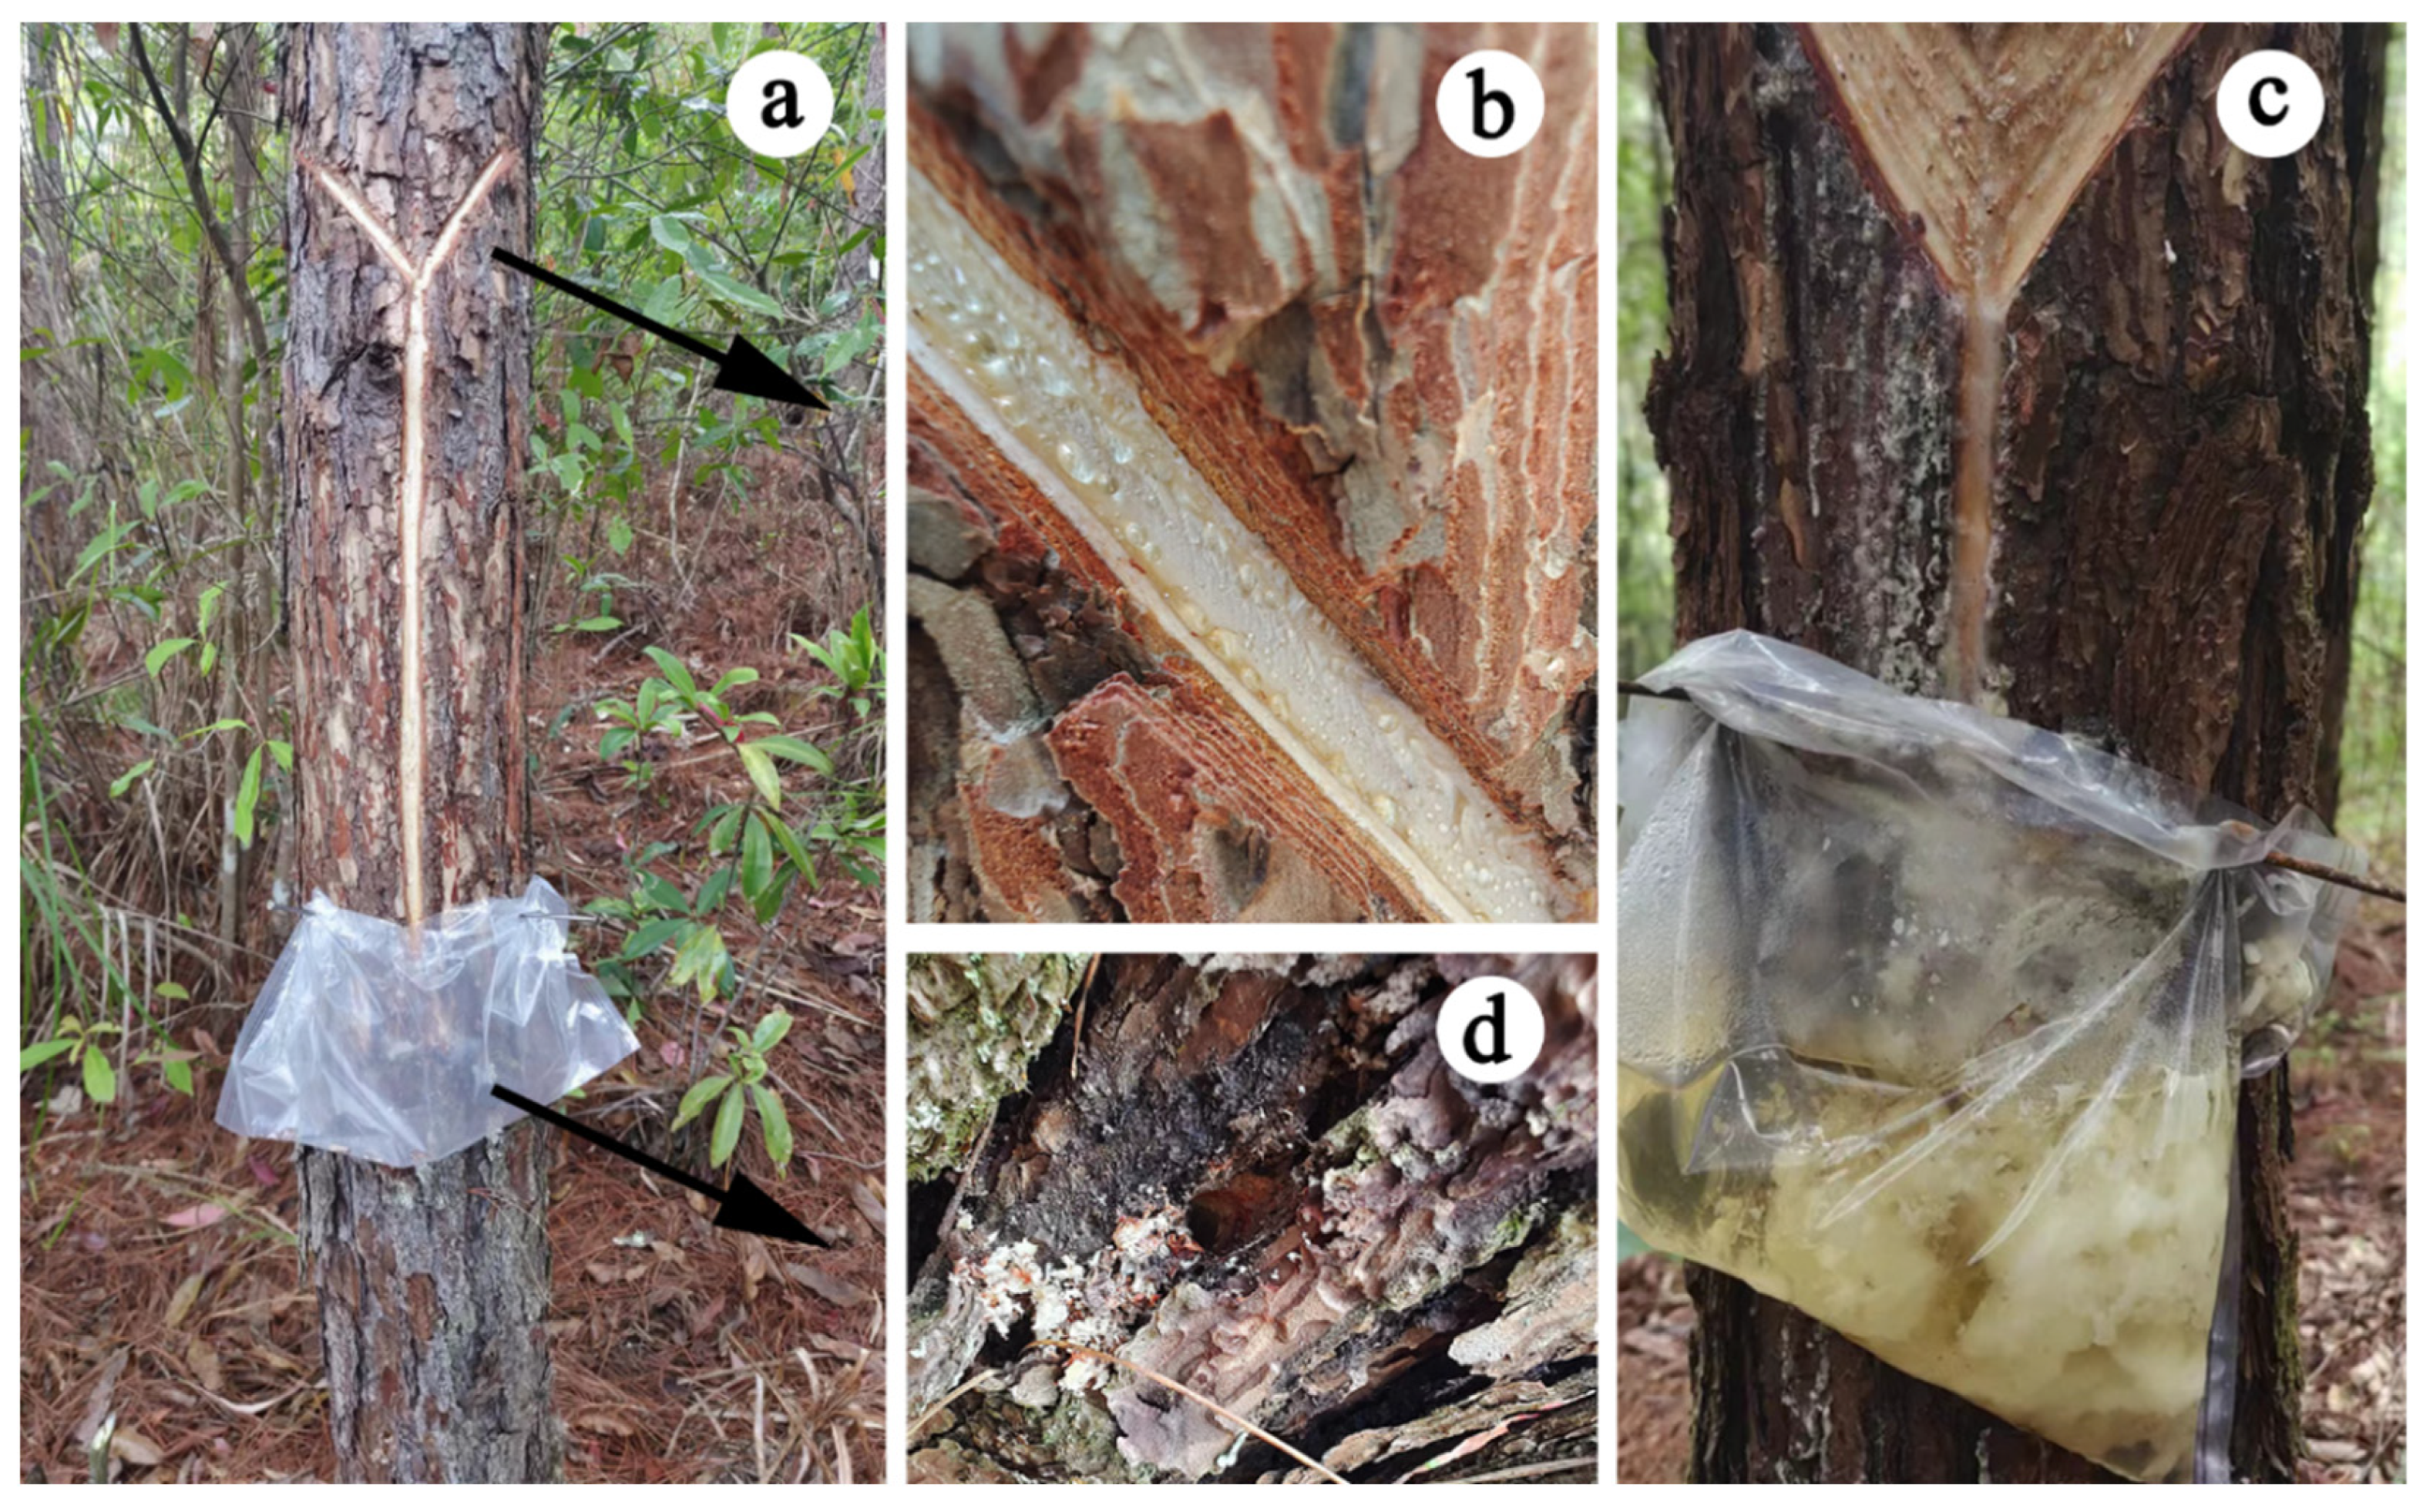
On 1 June 2023, the sample trees of the experimental groups were drilled with an electric drill at about 50 cm above the ground at an upward inclination of 30° to the trunk, to make small holes 3–5 cm deep. Different concentrations of Diquat were prepared as a lipotropic stimulant (Table 1). Group CK was drilled only, without a stimulant, and Groups A, B, C and D have applied stimulants with concentrations of 0.25%, 0.5%, 1%, and 2%, respectively (Table 1). Diquat (41% glyphosate solution) was used as a stimulant. The stimulant was diluted with distilled water. Approximately 5 mL of stimulant was injected into the small holes using a syringe. The stimulant was applied only once.

2.3. Tapping Method

The resin collection was conducted using the Y-shaped downward tapping method. The tapping commenced approximately 1.5 m above the ground level, with a cutting interval of six days. The cutting surface was oriented towards the south, and the tapping intensity was maintained at 40% of the surface area. Resin collection was initiated from the 1.5 m mark, utilizing specialized resin collection bags. The resin was collected once every 30 days and weighed for quantification (Figure 2).

2.4. Analysis of Resin Yield Growth Rate

P = (y − y0)/y0 × 100%
P: Resin yield enhancement rate after applying the stimulant, expressed as a percentage.
y: Average resin yield per P. kesiya var. langbianensis tree after applying the stimulant every 30 days, in grams.
y0: Average resin yield per P. kesiya var. langbianensis tree in the control group every 30 days, in grams.

2.5. Analysis of Resin Duct Anatomy

(1)
After the final resin collection, anatomical samples were taken from each tree. The sampling location was approximately 2 cm below the wound, where a 2 × 2 × 2 cm sample block was obtained and immediately placed in FAA (10 mL of 37% formaldehyde, 5 mL of glacial acetic acid, and 85 mL of a 50% ethanol–water solution) solution for fixation.
(2)
Sectioning procedure: Utilizing the sliding microtome (Leica 2000R, Nussloch, Germany) cut cross sections (XS) and tangential sections (TS) of the adequately softened samples to a thickness of approximately 8–10 µm. Prepare at least 3 slices for each section type as spares.
(3)
Safranin and fast green staining: Place the sections in 1% safranin O solution for staining for 12 h or more. Afterward, sequentially transfer the stained sections into 50% ethanol solution, 75% ethanol solution, 95% ethanol solution, 1% fast green solution, 95% ethanol solution, absolute ethanol, absolute ethanol, a mixture of ethanol and xylene in a 1:1 ratio, xylene, xylene. Immerse the sections in 50% ethanol solution for 10 s, followed by 15 s in 1% fast green solution, and 3 min in all other solutions. Finally, place the processed sections on glass slides, add a suitable amount of neutral gum, gently place a coverslip on top while pushing out air bubbles from underneath, and let it dry at room temperature to complete the permanent section-making process.
(4)
Image J software (ImageJ-win64) was used to measure the number of resin ducts within a 6 mm2 area in 30 different fields of view for each sample. Additionally, the area of 30 axial resin ducts was measured; there were 15 trees in each group, so we measured 450 data per group, and their average values were calculated.

2.6. Resin Composition Analysis

Weigh 50 mg of sample in a 15 mL tube, add 2 mL of anhydrous methanol solution, add 1 drop of 1% phenolphthalein indicator, use 6% tetramethylammonium hydroxide-methanol solution to drop until slightly red, and then drop the methanol solution to the 5 mL scale, mix thoroughly, and take 1 mL filtered and injected into the vial. The GC-MS conditions were as follows: starting temperature 60 °C, hold for 2 min, heat to 200 °C at 4 °C/min, hold for 2 min, and then heat to 250 °C at 2 °C/min, hold for 5 min to the end; vaporization and detection temperature 60 °C; the carrier gas was nitrogen, the shunt ratio was 1:50, and the injection volume was 0.5 μL. The results of the mass spectrometry test were compared with the NIST database to determine the corresponding components of the peaks, and the peaks of the main components were integrated using Origin 2022.

2.7. Data Analysis

The data obtained were statistically processed using Excel 2021 software, analyzed by ANOVA using SPSS 25.0, and plotted using Origin 2021.

3. Results

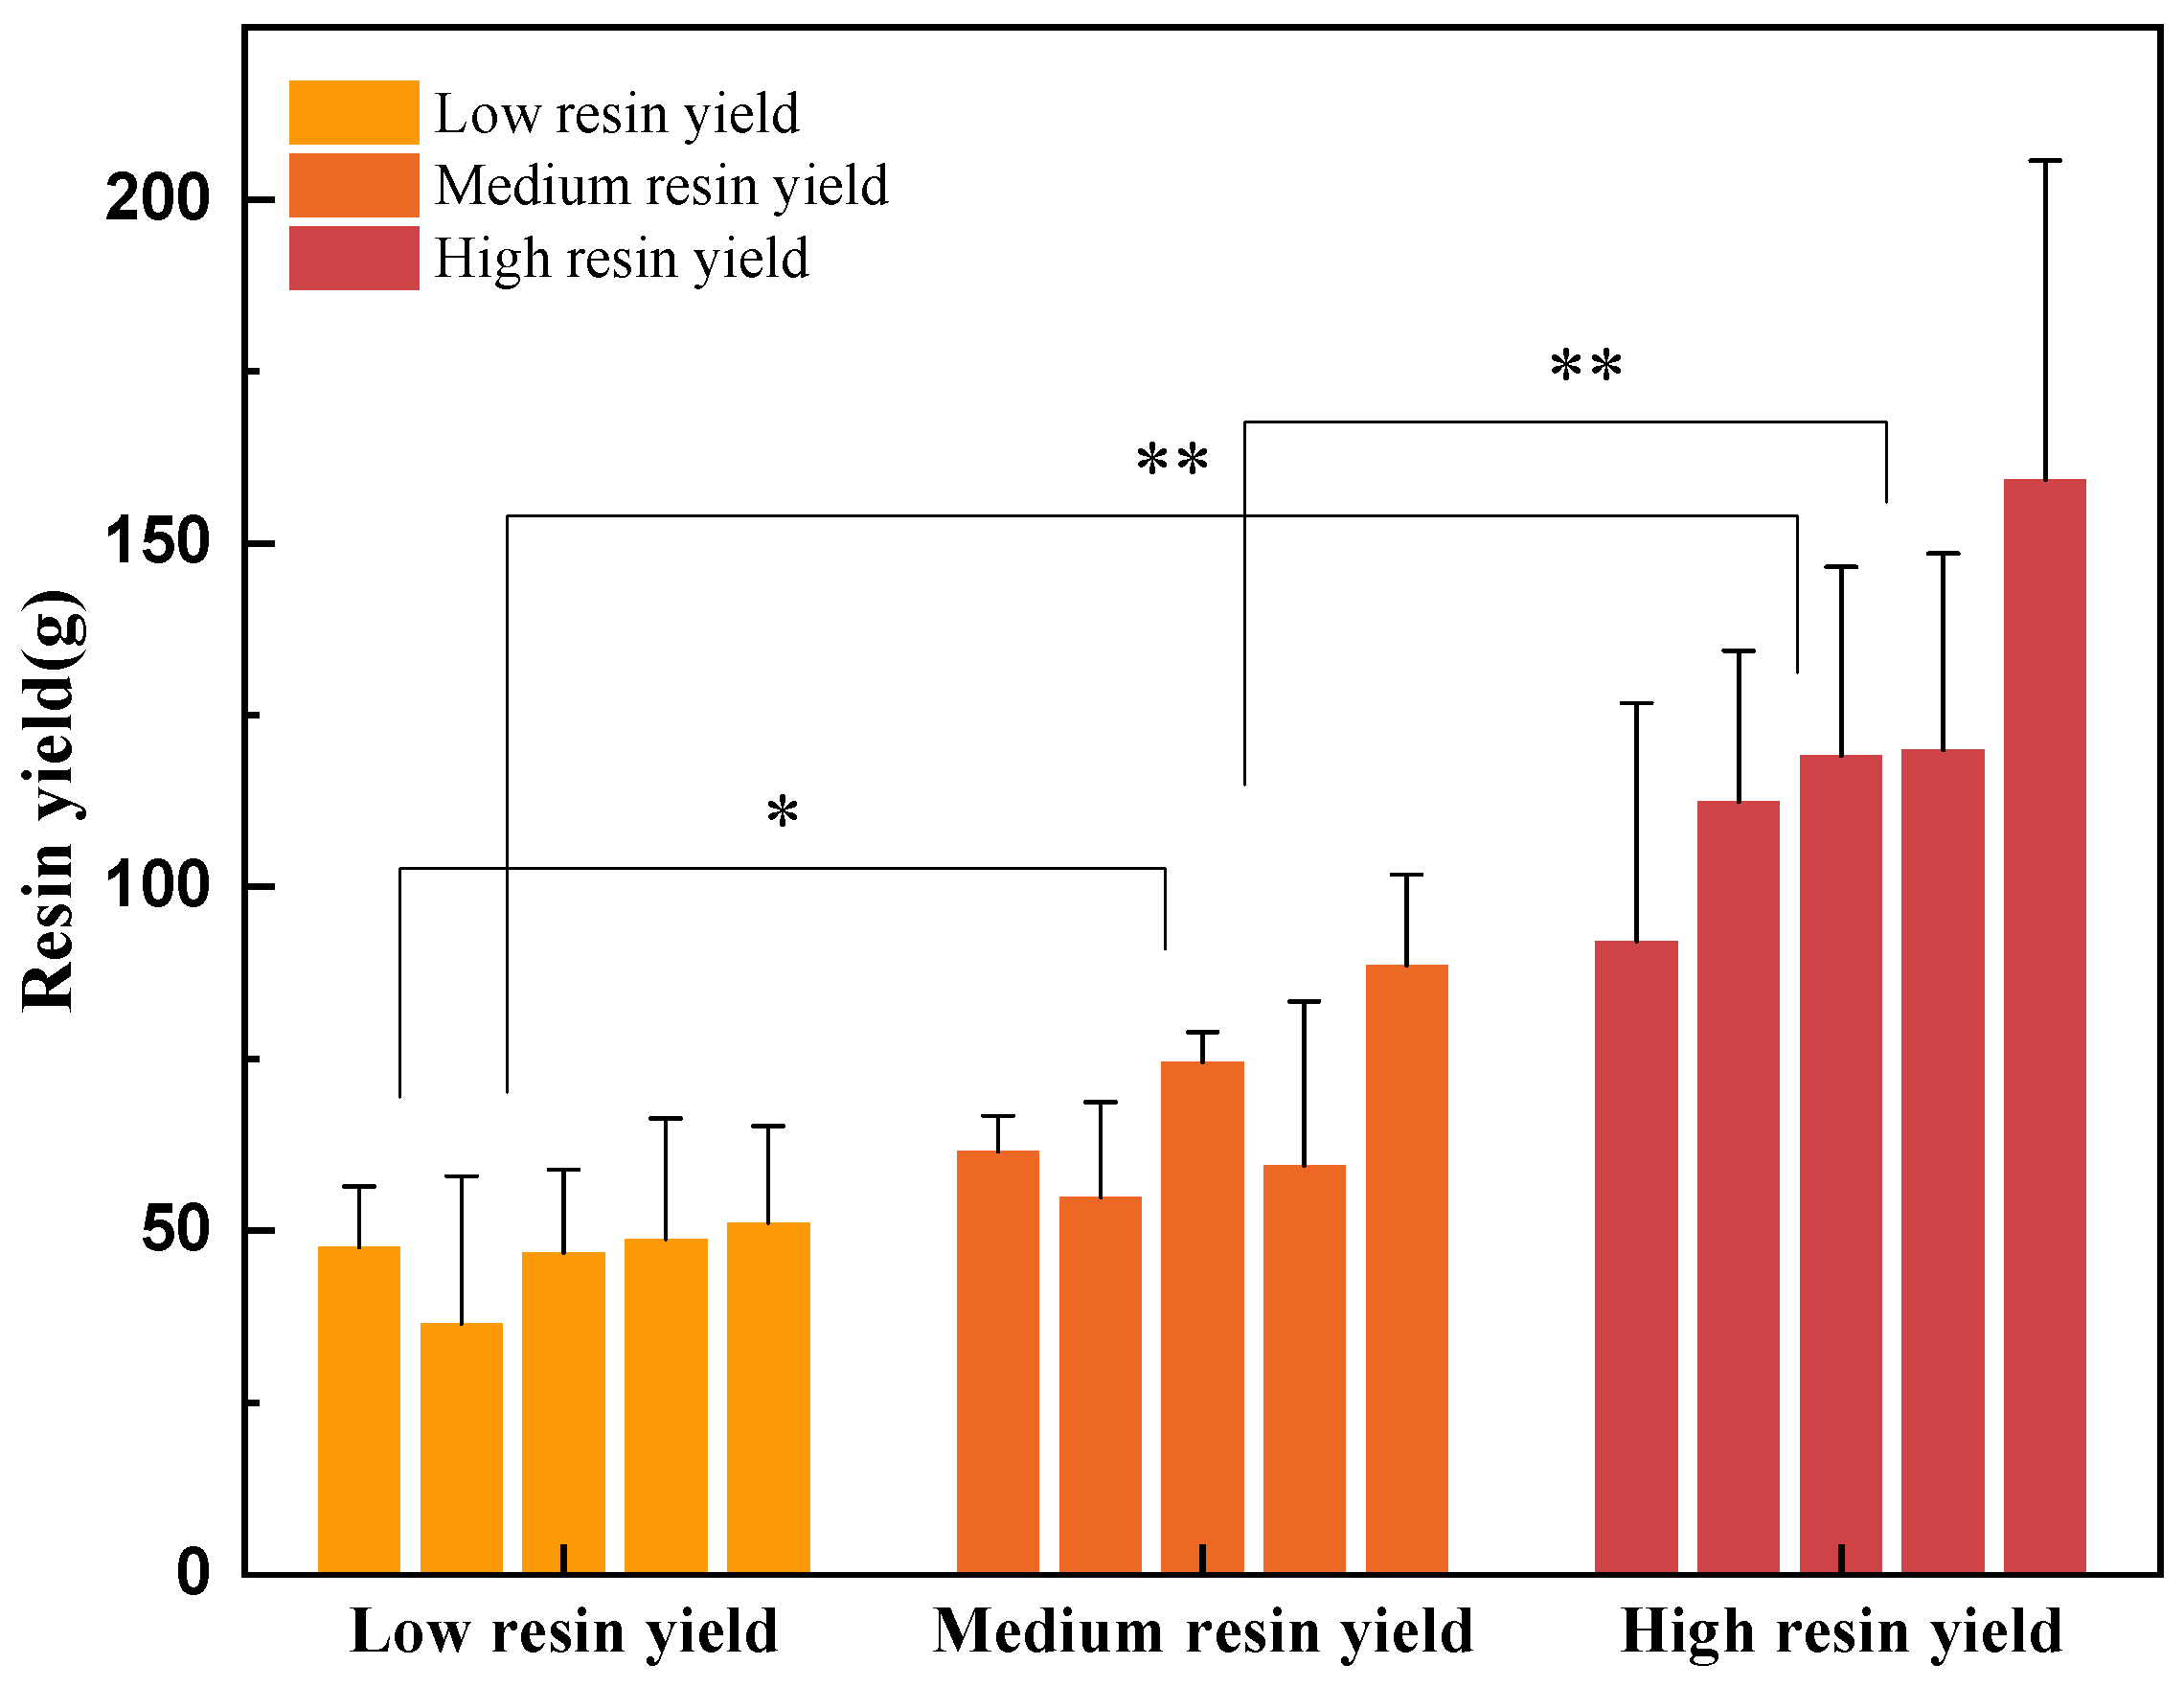
3.1. The Impact of Different Concentrations of Stimulants on Resin Yield

To validate the variation in resin yield among individual pine trees, we performed a variance analysis (ANOVA) on the resin yields of different treatment groups in June. We analyzed the resin yields of the control group and treatment groups before the reagents took effect. The results, as shown in Table 2, indicate that there is no significant difference in resin yield between the control group and treatment groups. This demonstrates the reliability and validity of the experimental results.
Based on Figure 3, there were no significant differences in resin yield among the treatment groups in June and July. In June, the average resin yields for CK, A, B, C, and D were 64.6 g, 52.9 g, 60.5 g, 62.6 g, and 58.8 g, respectively, compared to the CK group (Figure 4). The lipid enhancement rates for groups A, B, C, and D were −18%, −6%, −3%, and −9%, respectively, all exhibiting negative values. In July, the average resin yields for CK, A, B, C, and D were 72.2 g, 62.7 g, 76.6 g, 70.3 g, and 83 g (Figure 3), with enhancement rates of −13%, −6%, −3%, and 15% (Figure 4). The enhancement rates for groups A, B, and C remained unchanged, while the D group showed an increase of 15%. The negative resin yield in June and July is due to the control group having higher resin production compared to the other treatment groups. The main reason for the higher resin yield of the control group than the other treatment groups is the geographical location, soil conditions, and lighting. The control group was situated at the foot of the mountain, with relatively flat terrain and higher water storage capacity compared to the treatment groups on the slopes. Additionally, it was closer to the road, receiving more uninterrupted sunlight. When pine trees receive more water and sunlight, they naturally produce and store more resin [11]. In August, September, and October, the resin yield turned positive, indicating that the applied stimulant had effectively increased resin production in the treatment groups, gradually surpassing the control group. This suggests that the stimulant can induce significant resin production in pine trees located in less advantageous geographical positions. Figure 3 also shows that although the resin yield in the control group increased over time, the rate of increase was much slower compared to the treatment groups, validating the effectiveness of the applied stimulant. In August, the average resin yields for CK, A, B, C, and D were 70.3 g, 80.1 g, 100.9 g, 99.4 g, and 104.8 g (Figure 3). Compared to the CK group, the enhancement rates for groups A, B, C, and D were 14%, 43%, 41%, and 49% (Figure 4), indicating a significant increase in enhancement rates in August. In September, the average resin yields for CK, A, B, C, and D were 83.4 g, 104.5 g, 114.9 g, 108.1 g, and 116 g (Figure 3). While the CK group showed a slight increase in resin yield compared to August, the experimental zone entered the rainy season during this month, suggesting a close relationship between resin production and precipitation [11]. However, the resin enhancement in groups A, B, C, and D showed greater improvements, with enhancement rates of 25%, 38%, 30%, and 39% (Figure 4), slightly lower than in August. In October, the average resin yields for CK, A, B, C, and D were 100.5 g, 127.7 g, 130.7 g, 134.9 g, and 155.5 g (Figure 3). The enhancement rates for groups A, B, C, and D stabilized around 30%, with rates of 27%, 30%, 34%, and 55% (Figure 4). There were no significant differences in resin yield among the different concentration treatments (A–D) for each month (p > 0.05).

3.2. Anatomical Structure Analysis

3.2.1. Effects of Different Concentration Stimulant on Anatomical Structure

The microanatomical structure of P. kesiya var. langbianensis is illustrated in Figure 5. Measurements of resin duct-related dimensions (Figure 6A, Table 3) reveal that the axial resin duct area for the CK group is 1803.67 ± 1402.79 μm2. The axial resin duct areas for groups A, B, C, and D are 3936.52 ± 2133.45 μm2, 3673.70 ± 2501.69 μm2, 3382.70 ± 1750.26 μm2, and 3665.11 ± 2457.92 μm2, respectively. Analysis of variance indicates that the resin duct area for all groups treated with stimulants is significantly larger than the control group (p < 0.05). However, there is no significant difference in resin duct area among the different concentration stimulant treatment groups (Table 3). The application of stimulants increases the area of resin ducts [32], consequently enhancing resin production. However, the impact of different concentration stimulants on P. kesiya var. langbianensis is not significant, suggesting a close relationship between stimulants and the defense mechanism of the pine tree, but with no significant correlation to the concentration of the stimulant.
According to Figure 6B and Table 3, it can be observed that the axial resin duct density for the control group is 10.31 ± 3.34 number·6 mm−2. The axial resin duct densities for groups A, B, C, and D are 9.80 ± 3.03, 8.67 ± 3.46, 10.88 ± 2.71, and 11.65 ± 4.16 number·6 mm−2, respectively. Analysis of variance indicates that there is no significant difference in resin duct density among the different groups (p > 0.05).

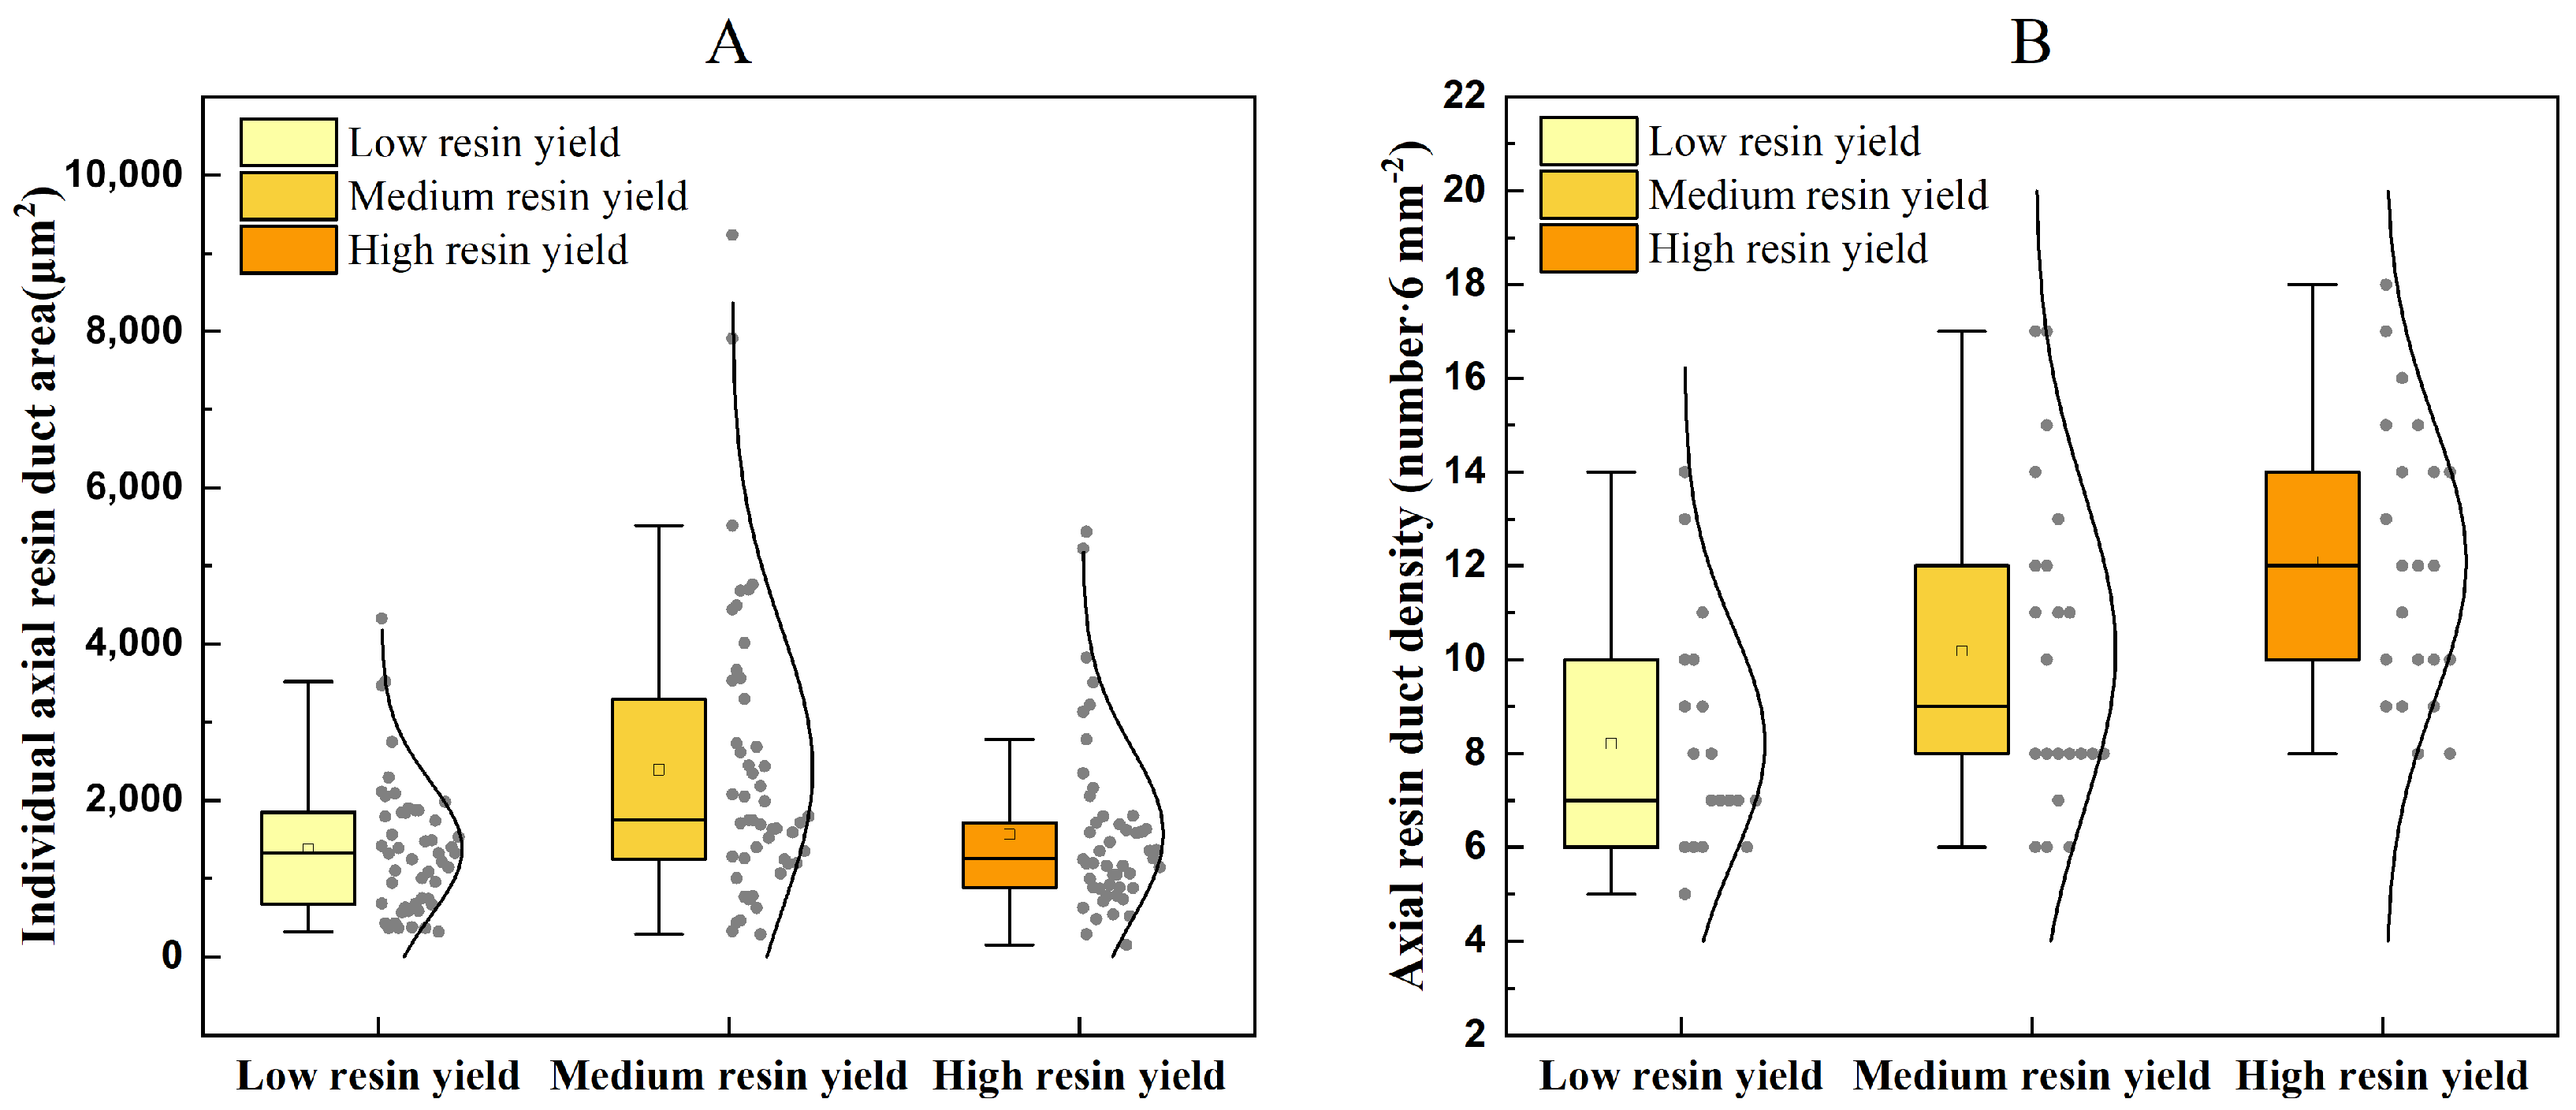
3.2.2. Analysis of Resin Duct Variations in Different Resin Yield Levels of P. kesiya var. langbianensis

The experiment involved dividing 15 trees from the control group into three groups based on resin yield: low, medium, and high (Figure 7). According to the analysis of variance (Figure 7), there were significant differences in resin yield between the low and medium groups (p < 0.05), as well as between the low and high groups (p < 0.01). Moreover, the medium and high groups also exhibited significant differences in resin yield (p < 0.01), meeting the requirements of statistical analysis.
The resin yield of the medium and low resin groups remained relatively stable throughout resin collection, showing no significant changes. However, the high resin group demonstrated a significantly higher growth rate in resin yield as the collection time progressed (Figure 8), This could be attributed to the higher metabolic response speed of the highly productive P. kesiya to external stimuli, leading to faster resin production [33].
The resin duct area of the low resin group showed a significant difference compared to the medium group (p < 0.05), but no significant difference was observed compared to the high resin group (Figure 9A, Table 4). Interestingly, the high resin group exhibited the smallest resin duct area. However, when considering the resin duct density, the high resin group was significantly higher than both the medium and low resin groups (p < 0.05). The amount of resin production in P. kesiya is determined by multiple interacting factors, rather than a single factor alone [9,10,11].

3.2.3. Analysis of the Correlation between Resin Yield and Anatomical Structure

The experiment investigated the correlations among different resin collection times, different stimulant concentrations, and relevant anatomical features of resin ducts (Figure 10). There was a highly significant positive correlation between resin yield in different months across all groups. The average resin yield in the control group (CK) exhibited a significant positive correlation with the resin duct area (Figure 10 CK) [12]. The resin duct area showed positive correlations with monthly resin yield, total resin yield, and average resin yield (Figure 10). In treatment group A, the resin duct area also displayed a significant positive correlation with resin yield (Figure 10 A). Unlike the control group, treatment group A exhibited significant positive correlations between the resin duct area and resin yield for each month, total resin yield, and average resin yield. The resin duct density in treatment group A showed a positive correlation with resin yield, although the correlation was not significant. In treatment group B, there were highly significant positive correlations among resin yields in different months, total resin yields, and average resin yields (Figure 10 B). However, there was a negative correlation between the resin duct area and resin yield (Figure 10 B) within treatment group B. The resin duct density in treatment group B showed a positive correlation with the resin yield (Figure 10 B). In treatment group C, there were significant positive correlations among resin yield in different months, total resin yield, and average resin yield (Figure 10 C). Both the resin duct area and resin duct density exhibited positive correlations with the resin yield (Figure 10 C). For treatment group D, there remained a highly significant positive correlation between resin yield in June to October and total resin yield, as well as average resin yield (Figure 10 D). The same trend was observed in the other four experimental groups (Figure 10 CK, A, B, C). The resin duct area and resin duct density in treatment group D also showed significant positive correlations with the resin yield (Figure 10 D) [13]. Among the five experimental groups, only the third group exhibited a negative correlation between the resin duct area and resin yield. From the graph (Figure 10), it can be observed that the resin duct area and resin duct density have positive correlations in groups CK, A, B, and D.

3.3. Analysis of Pine Turpentine Chemical Components

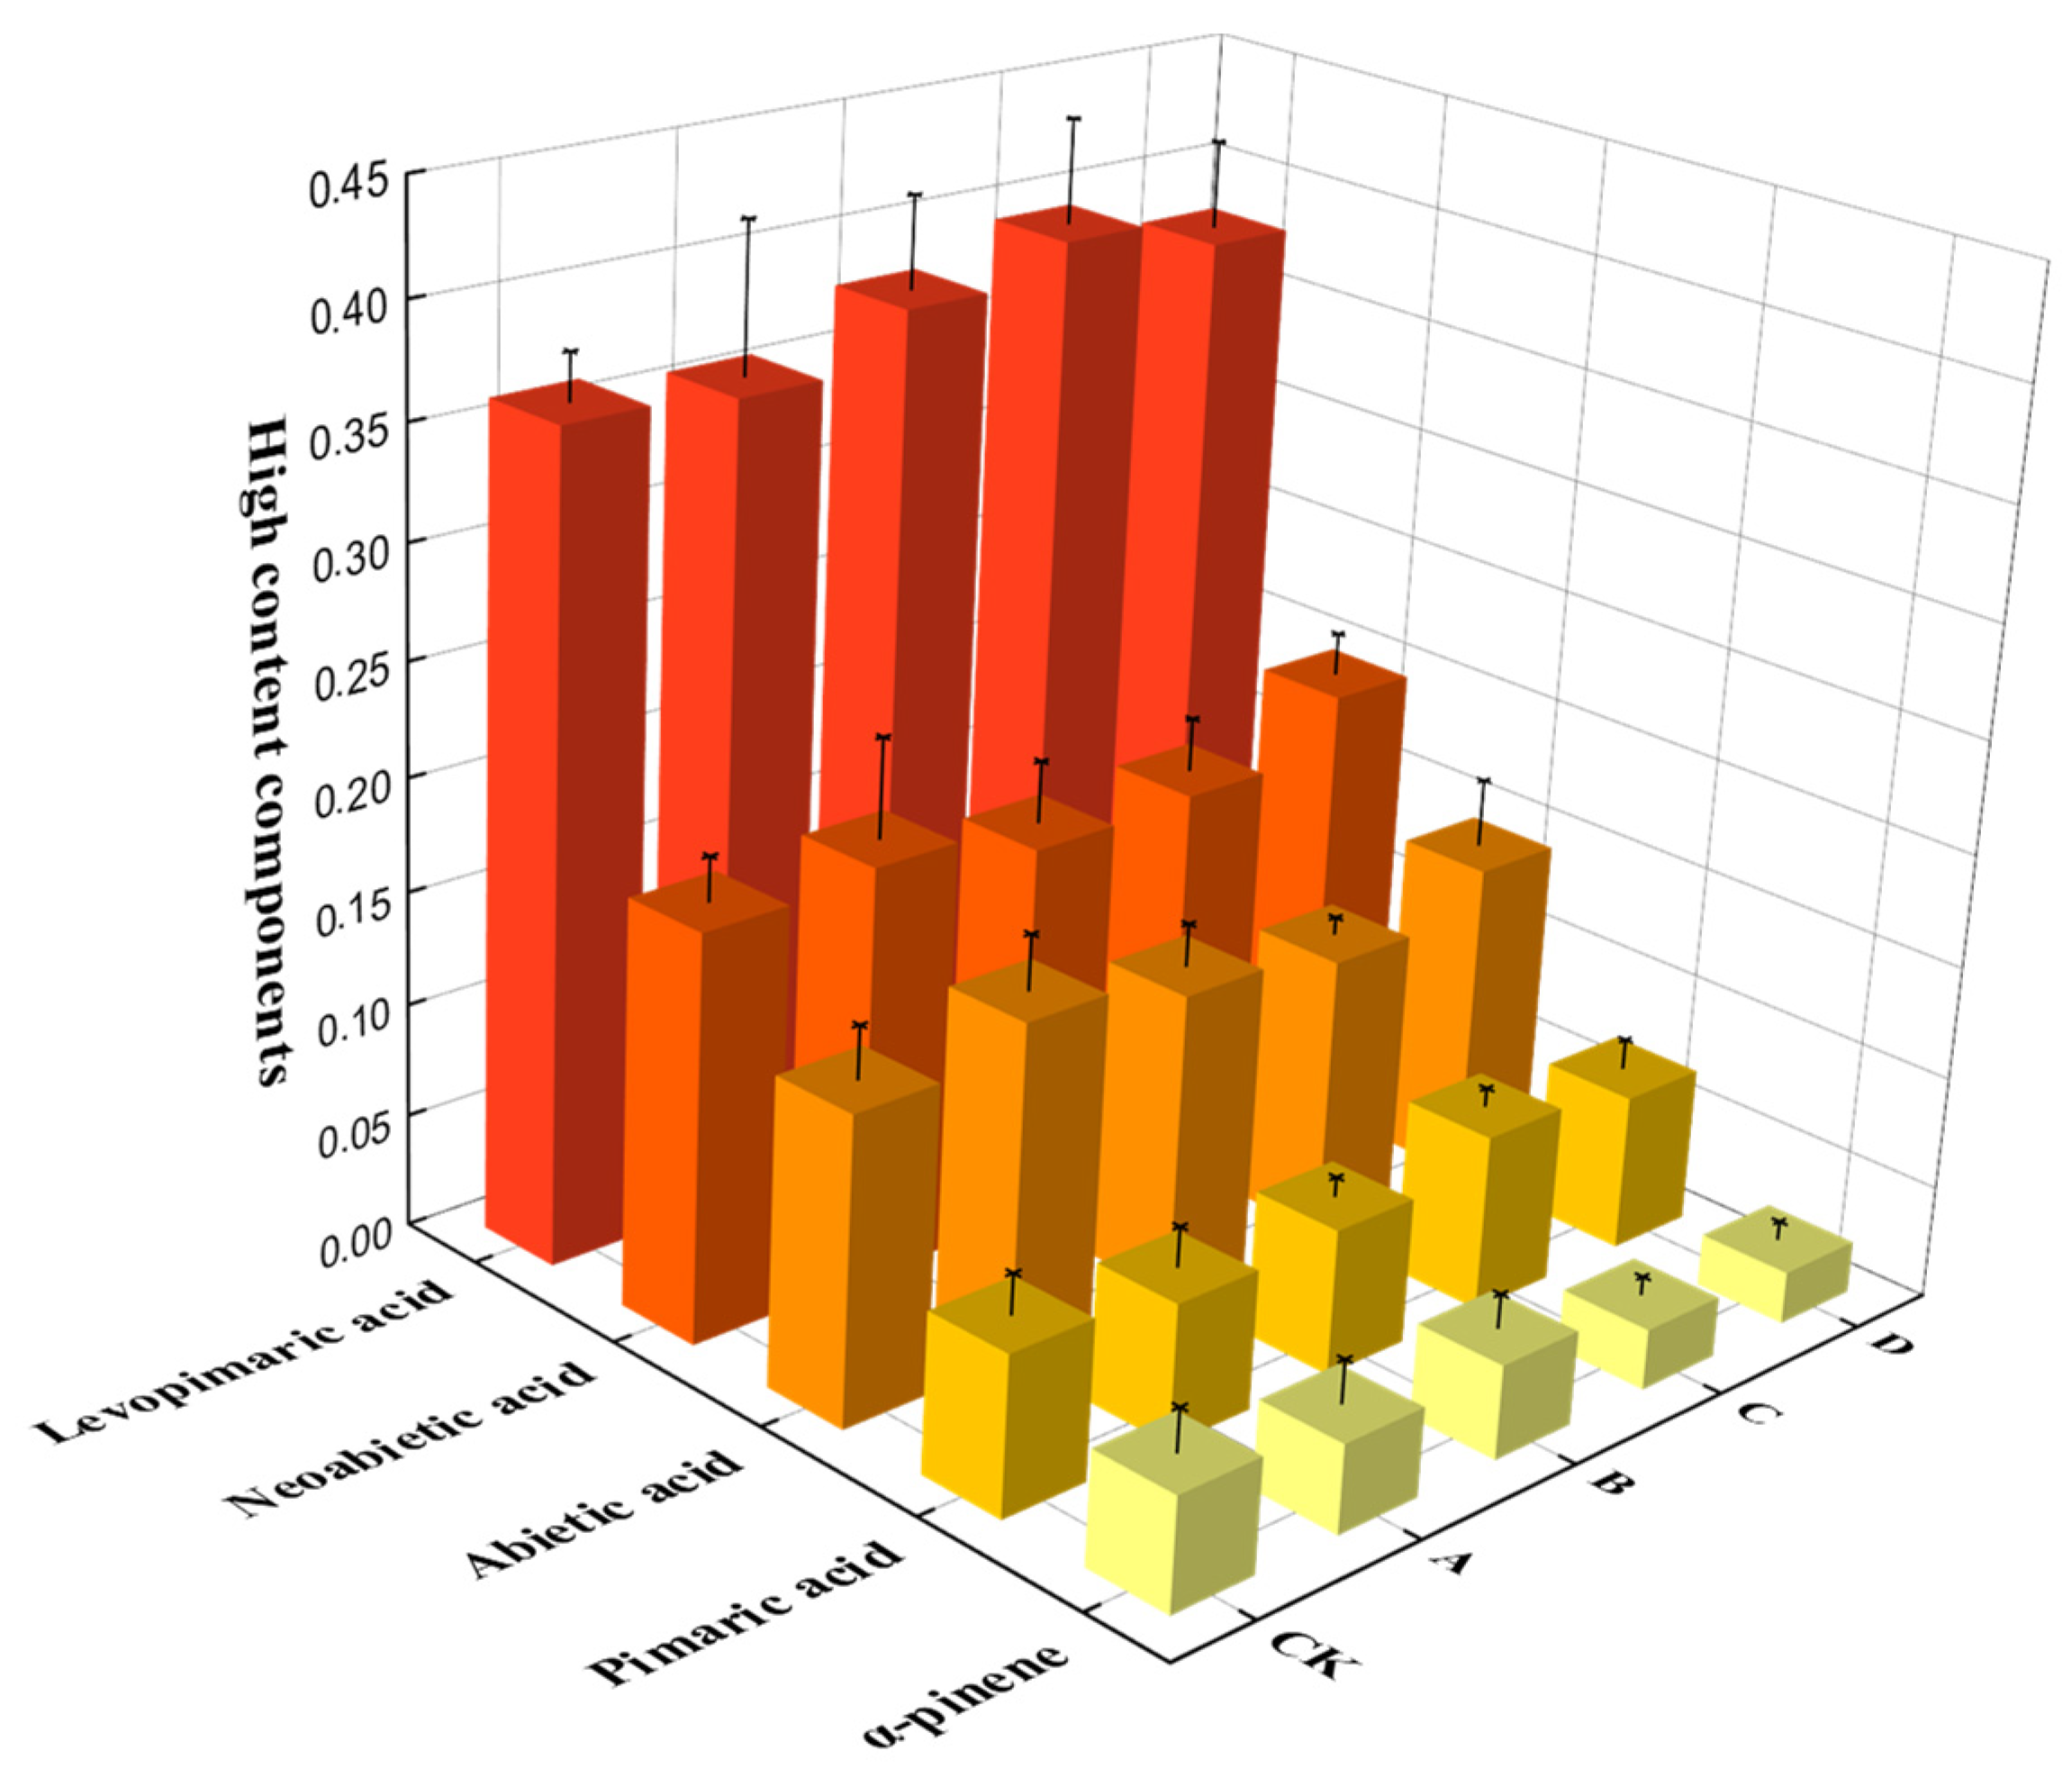
3.3.1. Analysis of the Chemical Components of Turpentine Stimulated by Different Concentrations of Stimulant

The experiment analyzed ten major components in the resin of P. kesiya var. langbianensis, and divided them into two groups based on their content levels (Figure 11 and Figure 12). Among the components with a lower content (Figure 11), the A treatment group exhibited the highest content of dehydroabietic acid, surpassing the CK, B, C, and D groups. The differences in content of abietatrienoic acid among the treatment groups were not significant. The content of isopimaric acid in the CK and B groups was higher than in the A, C, and D groups. The A group had a higher content of longipinene compared to the CK group and the remaining three treatment groups. No significant differences were found in the content of sandaracopimaric acid among the five experimental groups. For the components with higher content (Figure 12), the analysis of variance indicated no significant differences among the treatment groups for levopimaric acid, neoabietic acid, abietic acid, pimaric acid, and α-pinene.

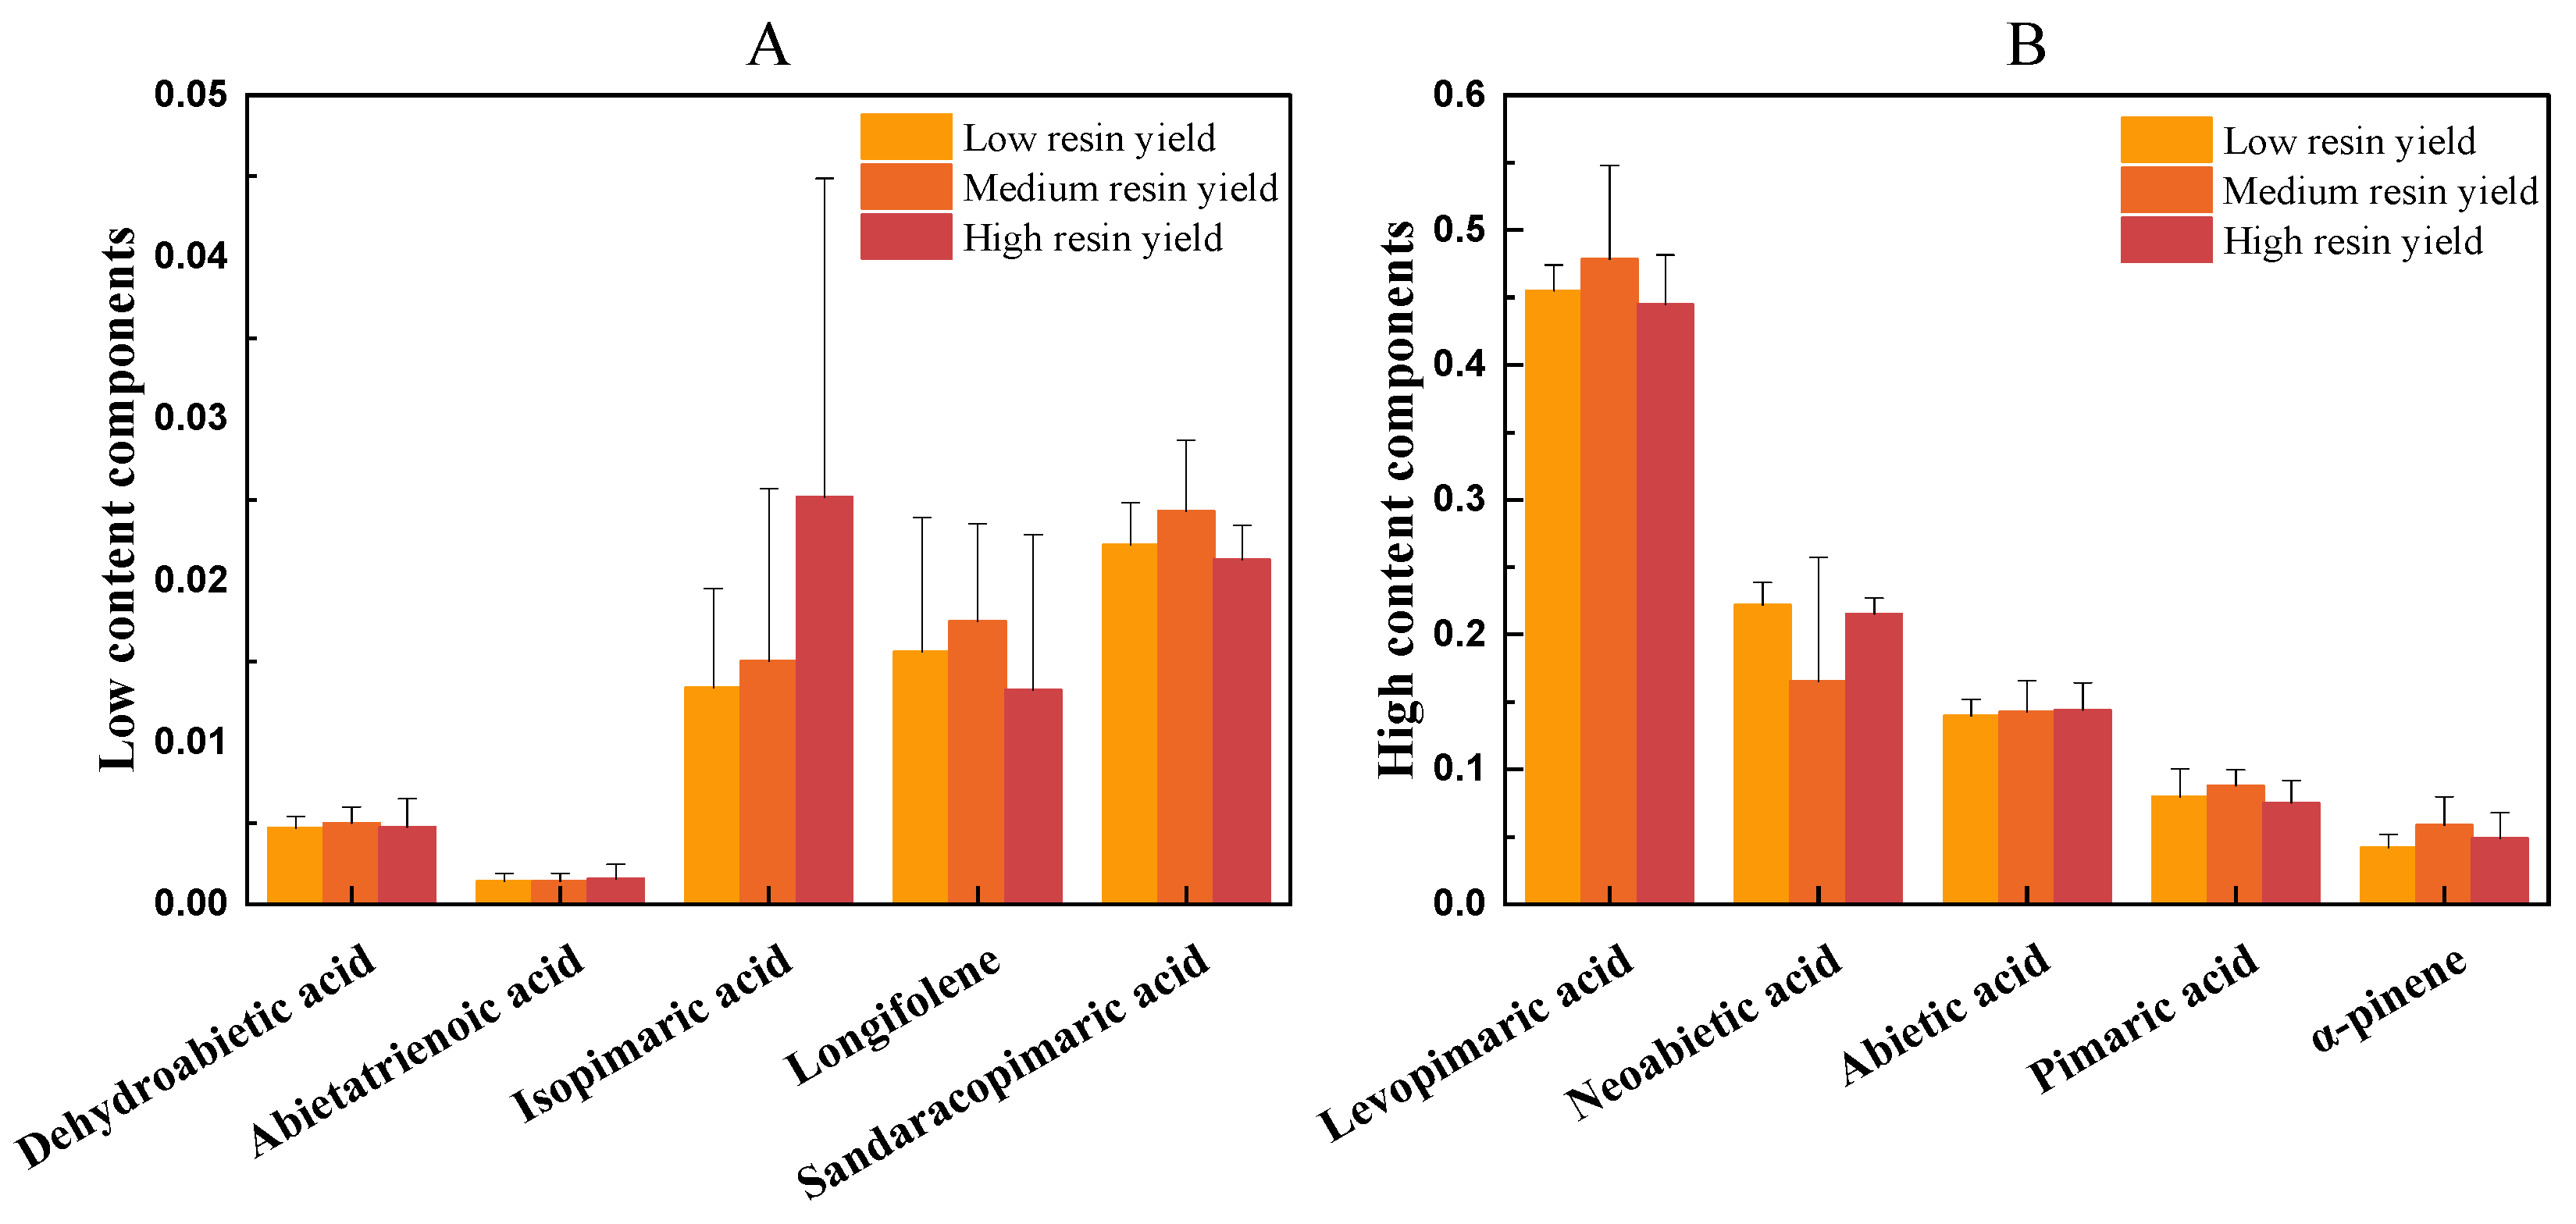
3.3.2. Analysis of Differences in Chemical Composition of P. kesiya var. langbianensis with Different Resin Yield

The 15 trees in the control group were classified into low, medium, and high lipid yields (Figure 7), and into low- and high-content components according to the chemical composition of the turpentine (Figure 13). The contents of longifolium, santalic acid dehydroclavulanic acid, and longitudinal trienoic acid did not differ significantly between lipid yields, and isopinene was significantly higher in the high-yielding lipids than in the low- and medium-yielding lipids (Figure 13A). There was also no significant difference in the content of α-pinene, isopinene, levulinic acid longitudinal, and neo-longitudinal acids (Figure 13B). It can be seen that it is not reliable to predict or differentiate between high- and low-lipid-producing P. kesiya var. langbianensis from the chemical composition of turpentine.

3.4. Correlation Analysis of Resin Yield, Anatomical Structure and Turpentine Chemical Composition

As shown in Figure 14, correlation analysis was conducted among resin yield, resin duct anatomical structure, and chemical composition in P. kesiya var. langbianensis. It was found that α-pinene exhibited a negative correlation with the resin duct area, resin duct density, and resin yield, while showing a positive correlation with abietatrienoic acid and longipinene. Longipinene showed a negative correlation with the resin duct area, resin duct density, abietatrienoic acid, levopimaric acid, sandaracopimaric acid, and pimaric acid, but a positive correlation with isopimaric acid, dehydroabietic acid, and abietic acid. Pimaric acid exhibited positive correlations with the resin duct area, resin duct density, resin yield, abietatrienoic acid, levopimaric acid, and sandaracopimaric acid, but a negative correlation with neoabietic acid, abietic acid, dehydroabietic acid, and isopimaric acid. Sandaracopimaric acid showed positive correlations with the resin duct area, resin duct frequency, resin yield, abietic acid, dehydroabietic acid, and levopimaric acid, but negative correlations with neoabietic acid and isopimaric acid. Isopimaric acid exhibited a positive correlation with neoabietic acid, but negative correlations with abietatrienoic acid and levopimaric acid. Levopimaric acid showed a negative correlation with neoabietic acid. Dehydroabietic acid demonstrated negative correlations with the resin duct area, resin duct density, and resin yield, while showing positive correlations with resin duct frequency and abietic acid. Abietic acid displayed positive correlations with resin duct area, resin duct frequency, resin yield, and abietatrienoic acid, but a negative correlation with neoabietic acid. Neoabietic acid exhibited negative correlations with resin duct area, resin duct density, resin yield, and abietatrienoic acid. Abietatrienoic acid showed positive correlations with the resin duct area, resin duct density, and resin yield. There is generally a weak correlation among the chemical components of resin in most cases, which could be attributed to their susceptibility to different genetic factors [34].

4. Discussion

In the experimental study of resin production in P. kesiya var. langbianensis stimulated by different concentrations of stimulants, it was observed that there was no significant difference in resin yield between June and July under different stimulation concentrations (Figure 3). Furthermore, the resin yield in June was consistently negative (Figure 4), possibly due to variations in topography, sunlight exposure, and soil moisture content, as the control group was situated at a relatively flat area at the foot of the mountain, where water accumulated, resulting in higher soil moisture content [11,35,36,37,38]. In July, the resin growth rates for the experimental groups with stimulant concentrations of 0.5% and 2% turned positive (Figure 4), suggesting that the effects of the stimulant may require 1–2 months to manifest. By August, all experimental groups exhibited positive resin growth rates (Figure 4), showing an increasing trend with higher stimulant concentrations. The resin growth rates for treatment groups A, B, C, and D in August were 14%, 43%, 41%, and 49%, respectively. This indicates that the stimulant had a significant impact on resin production in P. kesiya var. langbianensis by the third month, greatly promoting resin synthesis. In September, the resin growth rates for groups A, B, C, and D were 25%, 38%, 30%, and 39%, respectively. Compared to the previous month, the lipid accumulation rate for the A concentration group increased by 11%, while the rates for groups B, C, and D decreased by approximately 10%. This might be attributed to the substantial stimulation of resin excretion from the tree body last month, resulting in a slight decrease in lipid accumulation rate this month, thus validating the effectiveness of the stimulant (Figure 4). In October, the resin growth rates for groups A, B, C, and D were 27%, 30%, 34%, and 55%, respectively. The resin growth rates for each group remained relatively stable, with the lower concentration treatment group maintaining a rate of around 30%. This indicates that higher concentration stimulants can induce a higher production of resin in P. kesiya var. langbianensis. It is possible that higher concentrations would stimulate the production of more resin, but higher concentrations would mean that the trees would have to withstand greater stimulation; so, to protect these trees from being able to grow normally after tapping the resin, higher concentrations were not used in this experiment. Through one-way analysis of variance, it was found that, starting from August, there was a significant difference in resin yield between the stimulation groups and the control group (p < 0.05) (Figure 3). However, there were no significant differences observed among the experimental groups with the application of the stimulant, suggesting that high-concentration stimulants do not significantly enhance resin production in P. kesiya var. langbianensis (Figure 3), and low-concentration stimulants are sufficient to meet the resin production demands.
In the later stages of the experiment, samples were taken from the P. kesiya var. langbianensis trees stimulated with different concentrations of stimulants for anatomical research. From the perspective of axial resin duct area (Figure 6), the treatment group subjected to the stimulant showed a significantly larger axial resin duct area compared to the control group (Table 3). However, the differences in axial resin duct area between the treatment groups with different concentrations of the stimulant were not significant (Table 3). This finding aligns with the previous experiments on resin production in P. kesiya var. langbianensis, indicating that the application of the stimulant increases the area of resin ducts. However, higher concentrations of the stimulant do not stimulate the production of more resin in P. kesiya var. langbianensis or enlarge the axial resin ducts. By observing the density of the axial resin ducts, it was found that there were no significant differences among the experimental groups. This further validates the accuracy of the aforementioned experiments. In cases where the density of resin ducts is the same, a larger duct area results in a greater production of resin [13,14].
Compared to the low resin-yielding trees, high resin-yielding P. kesiya var. langbianensis exhibits a faster rate of resin synthesis (Figure 8), enabling quicker defensive responses to external stimuli. Measurements of resin duct data in different resin-yielding trees reveal a significant difference in axial resin duct area between low and medium resin-yielding trees, but not between low and high resin-yielding trees (Table 4). The density of axial resin ducts is significantly higher in high resin-yielding trees compared to low and medium resin-yielding trees (Table 4). This indicates that the resin yield in P. kesiya var. langbianensis is influenced by multiple factors interacting with each other, rather than a singular determinant.
By analyzing the correlation between resin production and anatomical structures under the stimulation of different concentrations of stimulants (Figure 10), it is observed that the resin yield in different groups exhibits a highly significant positive correlation across different months (Figure 10), suggesting a relatively stable resin yield over time for both high and low resin-yielding trees. The average resin yield in the control group (CK) shows a significant positive correlation with the resin duct area, indicating that the resin duct area determines the resin yield in P. kesiya var. langbianensis and supports the feasibility of using resin duct area as an indicator of resin production. The resin duct area shows a positive correlation with resin yield for each month, total resin yield, and average resin yield, indicating that resin duct density is also an important factor affecting resin production. In the A treatment group, the resin duct area shows a significant positive correlation with resin yield (Figure 10 A), possibly due to the expansion of resin ducts as a defense response induced by the stimulant. In the B treatment group, the resin duct area shows a negative correlation with resin yield (Figure 10 B), possibly influenced by geographical or community environmental factors [38]. The resin duct area and density in the C and D treatment groups show a positive correlation with resin yield (Figure 10C,D). Overall, the resin duct’s anatomical structural data exhibit a positive correlation with resin yield, indicating its high stability.
The experiment investigated the ten primary components in the resin of P. kesiya var. langbianensis, and divided them into two groups based on their respective levels of content. Different concentrations of stimuli were used to treat the samples, and the content of each component in the different groups was measured. The results revealed that in the A treatment group, the content of dehydroabietic acid was the highest, significantly surpassing that of the CK, B, C, and D groups. However, there was no significant difference in the content of abietatriene acid among the various treatment groups. The content of levopimaric acid in the CK and B groups was higher than that in the A, C, and D groups. Additionally, the A group exhibited a higher content of longipinene compared to the control group and the other three treatment groups. However, there was no significant difference in the content of sylvestric acid among the five experimental groups.
Through analysis of variance, it was found that the stimuli had no significant impact on the turpentine composition, only playing a role in promoting resin production. To further investigate the relationship between resin yield and the turpentine composition, the trees in the control group were divided into low, medium, and high resin-yielding groups, and then further categorized into low and high content groups based on the content of resin chemical components. The results indicated that it is not possible to reliably predict or differentiate high and low resin-yielding P. kesiya var. langbianensis solely based on the turpentine composition.
Furthermore, the correlation analysis revealed certain associations between different components and the resin duct anatomical structure and resin yield. Alpha-pinene exhibited a negative correlation with resin duct area, resin duct frequency, and resin yield, while showing a positive correlation with abietatriene acid and longipinene. Longipinene exhibited a negative correlation with resin duct area, resin duct density, abietatriene acid, levopimaric acid, sylvestric acid, and sylvic acid, while showing a positive correlation with isopimaric acid, dehydroabietic acid, and abietic acid. Sylvic acid exhibited a positive correlation with resin duct area, resin duct density, resin yield, abietatriene acid, levopimaric acid, and sylvic acid, while showing a negative correlation with neoabietic acid, abietic acid, and dehydroabietic acid. These findings provide clues regarding the correlation between resin yield and resin components.
In conclusion, the stimuli had no significant impact on the chemical composition of resin, but there exists a certain correlation between resin yield and resin components. However, it is not possible to reliably predict or differentiate high and low resin-yielding P. kesiya var. langbianensis solely based on the chemical composition of the resin. These findings hold significance for a deeper understanding of the formation mechanism of P. kesiya var. langbianensis resin and the regulation of resin production processes.

5. Conclusions

This experiment conducted a comprehensive study on the resin extraction of P. kesiya var. langbianensis, exploring the effects of resin extraction stimulants on the anatomical structure, resin chemical composition, and resin yield of P. kesiya var. langbianensis. (1) The stimulants used in the experiment had a significant effect on resin augmentation, with the highest experimental group achieving a resin augmentation rate of 55%, while the other experimental groups remained stable at around 30%. (2) Measurement data related to resin ducts showed that the experimental groups treated with stimulants had larger resin duct areas compared to the control group, although the impact of different concentrations of stimulants on resin duct area was minimal. (3) During the observation period of five consecutive months of resin extraction, the resin yield of low and medium resin-yielding P. kesiya var. langbianensis did not show significant changes over time, whereas the resin yield of high resin-yielding P. kesiya var. langbianensis gradually increased. By measuring the data related to resin ducts of P. kesiya var. langbianensis with different resin yields, it was discovered that the high resin-yielding trees had the smallest resin duct area, but the highest resin duct density, indicating that the factors affecting resin yield in P. kesiya var. langbianensis are not singular, but the result of synergistic interactions. (4) The correlation study between anatomical structure and resin yield revealed a positive correlation between resin duct area and resin yield, total resin yield, and average resin yield, indicating that resin duct area is an important factor influencing resin yield. (5) Regarding chemical composition, the different concentrations of stimulants had no significant effect on the turpentine components in P. kesiya var. langbianensis, only acting to promote resin production. The turpentine components cannot reliably differentiate between high- and low-resin-yielding P. kesiya var. langbianensis. This study provides a comprehensive theoretical basis for the resin extraction industry of P. kesiya var. langbianensis, and offers practical guidance for the development of resin extraction and processing industries in Yunnan Province.

Author Contributions

Conceptualization, H.Y. and J.Q.; methodology, H.Y.; software, C.Y.; validation, C.Y. and C.L.; investigation, Y.H.; resources, J.S.; data curation, L.C.; writing—original draft preparation, H.Y.; writing—review and editing, J.Q.; supervision, J.Q.; project administration, J.Q. All authors have read and agreed to the published version of the manuscript.

Funding

This research was funded by the Natural Science Foundation of China (31971586).

Data Availability Statement

The raw data supporting the conclusions of this article will be made available by the authors on request.

Acknowledgments

The authors gratefully thank the technicians and scientific associates from the College of Materials and Chemical engineering of the Southwest Forestry University.

Conflicts of Interest

The authors declare no conflicts of interest.

References

  1. Thomte, L.; Shah, S.K.; Mehrotra, N.; Saikia, A.; Bhagabati, A.K. Dendrochronology in the tropics using tree-rings of Pinus kesiya. Dendrochronologia 2023, 78, 126070. [Google Scholar] [CrossRef]
  2. Weng, H.; Chen, H.; Duan, A. Selection of high-yielding fat superior trees of Simao pine. J. Northwest For. Coll. 2010, 25, 71–74+79. (In Chinese) [Google Scholar]
  3. Xu, M.; Dang, G.; Ling, W. Exploration of the utilisation method of Simao pine. Seed 2012, 31, 95–96, 101. (In Chinese) [Google Scholar]
  4. Chen, W.; Chen, S.; Luo, T.; Li, J. Principal component analysis of ecological factors related to lipid production of Simao pine. West. For. Sci. 2023, 52, 27–33. (In Chinese) [Google Scholar]
  5. Dong, J.; Guo, H.; Zhang, Z.; Wu, X.; Huang, F. Dynamic changes of China’s turpentine resources in the last 10 years—A dynamic assessment based on “Lianqing” data. For. Sci. 2016, 52, 112–122. (In Chinese) [Google Scholar]
  6. Cabrita, P. A model for resin flow. In Plant Cell and Tissue Differentiation and Secondary Metabolites: Fundamentals and Applications; Springer: Cham, Switzerland, 2021; pp. 117–144. [Google Scholar] [CrossRef]
  7. Franceschi, V.R.; Krokene, P.; Christiansen, E.; Krekling, T. Anatomical and chemical defenses of conifer bark against bark beetles and other pests. New Phytol. 2005, 167, 353–376. [Google Scholar] [CrossRef] [PubMed]
  8. Fuentealba, A.; Alfaro, R.; Bauce, É. Theoretical framework for assessment of risks posed to Canadian forests by invasive insect species. For. Ecol. Manag. 2013, 302, 97–106. [Google Scholar] [CrossRef]
  9. Esteban, L.G.; Martín, J.A.; de Palacios, P.; Fernández, F.G. Influence of region of provenance and climate factors on wood anatomical traits of Pinus nigra Arn. subsp. salzmannii. Eur. J. For. Res. 2012, 131, 633–645. [Google Scholar] [CrossRef]
  10. Lai, M.; Dong, L.; Yi, M.; Sun, S.; Zhang, Y.; Fu, L.; Xu, Z.; Lei, L.; Leng, C.; Zhang, L. Genetic variation, heritability and genotype × environment interactions of resin yield, growth traits and morphologic traits for Pinus elliottii at three progeny trials. Forests 2017, 8, 409. [Google Scholar] [CrossRef]
  11. Lombardero, M.J.; Ayres, M.P.; Lorio, P.L., Jr.; Ruel, J. Environmental effects on constitutive and inducible resin defences of Pinus taeda. Ecol. Lett. 2000, 3, 329–339. [Google Scholar] [CrossRef]
  12. Garcia-Forner, N.; Campelo, F.; Carvalho, A.; Vieira, J.; Rodríguez-Pereiras, A.; Ribeiro, M.; Salgueiro, A.; Silva, M.E.; Louzada, J.L. Growth-defence trade-offs in tapped pines on anatomical and resin production. For. Ecol. Manag. 2021, 496, 119406. [Google Scholar] [CrossRef]
  13. Rodríguez-García, A.; López, R.; Martín, J.A.; Pinillos, F.; Gil, L. Resin yield in Pinus pinaster is related to tree dendrometry, stand density and tapping-induced systemic changes in xylem anatomy. For. Ecol. Manag. 2014, 313, 47–54. [Google Scholar] [CrossRef]
  14. Neis, F.A.; de Costa, F.; de Almeida, M.R.; Colling, L.C.; Junkes, C.F.d.O.; Fett, J.P.; Fett-Neto, A.G. Resin exudation profile, chemical composition, and secretory canal characterization in contrasting yield phenotypes of Pinus elliottii Engelm. Ind. Crops Prod. 2019, 132, 76–83. [Google Scholar] [CrossRef]
  15. Fabián-Plesníková, I.; Sáenz-Romero, C.; Terrazas, T.; Reyes-Ramos, A.; Martínez-Trujillo, M.; Cruz-De-León, J.; Sánchez-Vargas, N.M. Traumatic ducts size varies genetically and is positively associated to resin yield of open-pollinated progenies. Silvae Genet. 2022, 71, 10–19. [Google Scholar] [CrossRef]
  16. Neis, F.A.; de Costa, F.; de Araujo, A.T., Jr.; Fett, J.P.; Fett-Neto, A.G. Multiple industrial uses of non-wood pine products. Ind. Crops Prod. 2019, 130, 248–258. [Google Scholar] [CrossRef]
  17. Yadav, B.K.; Gidwani, B.; Vyas, A. Rosin: Recent advances and potential applications in novel drug delivery system. J. Bioact. Compat. Polym. 2016, 31, 111–126. [Google Scholar] [CrossRef]
  18. Liang, J.; Chen, X.; Wang, L.; Wei, X.; Mo, K.; Xiong, Z.; Liang, J. Influence of a novel resin tapping method on the resin yield and turpentine chemical composition of Masson pine (Pinus massoniana). Ind. Crops Prod. 2023, 204, 117377. [Google Scholar] [CrossRef]
  19. Kelkar, V.M.; Geils, B.W.; Becker, D.R.; Overby, S.T.; Neary, D.G. How to recover more value from small pine trees: Essential oils and resins. Biomass Bioenergy 2006, 30, 316–320. [Google Scholar] [CrossRef]
  20. Soliño, M.; Yu, T.; Alía, R.; Auñón, F.; Bravo-Oviedo, A.; Chambel, M.R.; de Miguel, J.; del Río, M.; Justes, A.; Martínez-Jauregui, M.; et al. Resin-tapped pine forests in Spain: Ecological diversity and economic valuation. Sci. Total Environ. 2018, 625, 1146–1155. [Google Scholar] [CrossRef]
  21. Hu, W.J.; Chen, J.; Liu, T.W.; Wu, Q.; Wang, W.-H.; Liu, X.; Shen, Z.-J.; Simon, M.; Wu, F.-H.; Pei, Z.-M.; et al. Proteome and calcium-related gene expression in Pinus massoniana needles in response to acid rain under different calcium levels. Plant Soil 2014, 380, 285–303. [Google Scholar] [CrossRef]
  22. Yi, M.; Jia, T.; Dong, L.; Zhang, L.; Leng, C.; Liu, S.; Lai, M. Resin yield in Pinus elliottii Engelm. is related to the resin flow rate, resin components and resin duct characteristics at three locations in southern China. Ind. Crops Prod. 2021, 160, 113141. [Google Scholar] [CrossRef]
  23. Wolter, K.E.; Peters, W.J.; Roberts, D.R.; McReynolds, R.D.; Broomfield, J.; Crews, E.R. Process for Increasing Oleoresin Synthesis in Pinus Species. U.S. Patent 4,203,253, 20 May 1980. [Google Scholar]
  24. Parham, M.R. Stimulation of oleoresin yield in conifers. Outlook Agric. 1976, 9, 76–81. [Google Scholar] [CrossRef]
  25. Füller, T.N.; de Lima, J.C.; de Costa, F.; Rodrigues-Corrêa, K.C.; Fett-Neto, A.G. Stimulant paste preparation and bark streak tapping technique for pine oleoresin extraction. In Biotechnology of Plant Secondary Metabolism: Methods and Protocols; Humana Press: New York, NY, USA, 2016; pp. 19–26. [Google Scholar] [CrossRef]
  26. Neis, F.A.; de Costa, F.; Füller, T.N.; de Lima, J.C.; Rodrigues-Corrêa, K.C.d.S.; Fett, J.P.; Fett-Neto, A.G. Biomass yield of resin in adult Pinus elliottii Engelm. trees is differentially regulated by environmental factors and biochemical effectors. Ind. Crops Prod. 2018, 118, 20–25. [Google Scholar] [CrossRef]
  27. Rodrigues-Corrêa, K.C.d.S.; Fett-Neto, A.G. Seasonality and chemical elicitation of defense oleoresin production in field-grown slash pine under subtropical climate. Theor. Exp. Plant Physiol. 2013, 25, 56–61. [Google Scholar] [CrossRef]
  28. Silverman, F.P.; Petracek, P.D.; Fledderman, C.M.; Ju, Z.; Heiman, D.F.; Warrior, P. Salicylate activity. 1. Protection of plants from paraquat injury. J. Agric. Food Chem. 2005, 53, 9764–9768. [Google Scholar] [CrossRef] [PubMed]
  29. López-Álvarez, Ó.; Zas, R.; Marey-Perez, M. Resin tapping: A review of the main factors modulating pine resin yield. Ind. Crops Prod. 2023, 202, 117105. [Google Scholar] [CrossRef]
  30. Méijome, A.G.; Chamorro, E.M.; Blanco, E.F.; García, E.G. Análisis de producciones y rendimientos del sistema de resinación de pica de corteza con estimulación química de doble cara ancha en masas de Pinus pinaster Ait. cuyo objetivo principal es la producción de madera. Recur. Rurais 2020, 16, 5–10. [Google Scholar] [CrossRef]
  31. García-Méijome, A.; Lorenzo, M.J.R.; Blanco, E.F.; Chamorro, E.M.; Gómez-García, E. Resin-tapping production in Pinus pinaster Ait. Stands in Galicia (NW Spain): Effects of location, number of faces, wound width and production year. Forests 2023, 14, 128. [Google Scholar] [CrossRef]
  32. Lin, J.; Hu, Y.; He, X.; Ceulemans, R. Systematic survey of resin canals in Pinaceae. Belg. J. Bot. 2002, 135, 3–14. [Google Scholar]
  33. Sood, Y.; Mahajan, P.K.; Bharti; Gupta, R.K. Correlation and Regression Studies on Estimation of Resin Yield in Pinus roxburghii. Ind. J. Pure Appl. Biosci. 2019, 7, 63–66. [Google Scholar] [CrossRef]
  34. An, N.; Ding, G.J. Study on chemical constituents of oleoresin from Pinus msssoniana in Guangxi. J. Cent. South Univ. For. Technol. 2012, 32, 59–62. (In Chinese) [Google Scholar]
  35. Blanche, C.A.; Lorio, P.L., Jr.; Sommers, R.; Hodges, J.; Nebeker, T. Seasonal cambial growth and development of loblolly pine: Xylem formation, inner bark chemistry, resin ducts, and resin flow. For. Ecol. Manag. 1992, 49, 151–165. [Google Scholar] [CrossRef]
  36. Lorio, P.L., Jr.; Hodges, J.D. Microsite effects on oleoresin exudation pressure of large loblolly pines. Ecology 1968, 49, 1207–1210. [Google Scholar] [CrossRef]
  37. Zas, R.; Quiroga, R.; Touza, R.; Vázquez-González, C.; Sampedro, L.; Lema, M. Resin tapping potential of Atlantic maritime pine forests depends on tree age and timing of tapping. Ind. Crops Prod. 2020, 157, 112940. [Google Scholar] [CrossRef]
  38. Rodrigues-Honda, K.C.d.S.; Junkes, C.F.d.O.; de Lima, J.C.; Waldow, V.d.A.; Rocha, F.S.; Sausen, T.L.; Bayer, C.; Talamini, E.; Fett-Neto, A.G. Carbon sequestration in resin-tapped slash pine (Pinus elliottii Engelm.) subtropical plantations. Biology 2023, 12, 324. [Google Scholar] [CrossRef]
Figure 1. Schematic diagram of the experimental site. CK–D represent five different experimental zones.
Forests 15 00748 g001
Figure 2. Tapping. (a) Y-shaped incision for resin extraction, (b) resin extraction groove, (c) resin collection bag, (d) holes for applying stimulants.
Forests 15 00748 g002
Figure 3. Resin yield in different concentration stimulant treatments from June to October. Different lowercase letters represent significant differences (p < 0.05).
Forests 15 00748 g003
Figure 4. Resin growth rates in different concentration stimulant treatments.
Forests 15 00748 g004
Figure 5. Microanatomical structure of P. kesiya var. langbianensis. (a) Cross-section. (b) Radial section. (c) Tangential section. ARD, Axial Resin Duct; ARRD, Axial and Radial Resin Duct Junction; RRD, Radial Resin Duct.
Forests 15 00748 g005
Figure 6. Measurements of the anatomical structure of the resin duct. (A) Individual axial resin duct area, (B) axial resin duct density.
Forests 15 00748 g006
Figure 7. Histogram of resin yield of high, medium and low. (*) p < 0.05, (**) p < 0.01.
Forests 15 00748 g007
Figure 8. Line graph of lipid production of Simao pine by month with different resin yield.
Forests 15 00748 g008
Figure 9. Distribution of anatomical structure data of the resin duct. (A) The individual axial resin duct area of P. kesiya with different resin yield, (B) The Axial resin duct density of P. kesiya with different resin yield.
Forests 15 00748 g009
Figure 10. Thermogram of correlation between resin yield and anatomical structures.
Forests 15 00748 g010
Figure 11. Illustrates the low-content chemical components of resin under different concentration treatments.
Forests 15 00748 g011
Figure 12. Illustrates the high-content chemical components of resin under different concentration treatments.
Forests 15 00748 g012
Figure 13. Comparison of the chemical composition of P. kesiya var. langbianensis turpentine between groups with different resin yields. (A) Low content components, (B) high content components.
Forests 15 00748 g013
Figure 14. Thermogram of correlation between resin yield, anatomical structure and chemical composition.
Forests 15 00748 g014
Table 1. Basic information of the experimental site.
GroupDBHStimulantAltitudeSamples
CK19.05 132615
A19.420.25%132815
B17.990.5%133015
C18.381%133215
D18.262%133415
Table 2. Analysis of variance of resin yield among five experimental zones (CK-D) in May.
SSDFMSFp Value
Between groups1209.474302.370.603>0.1
Within Groups35,080.2170501.146
Total36,289.6874
Table 3. Analysis of variance of data on the anatomical structure of the resin duct.
GroupsIndividual Axial Resin Duct Area (μm2)Axial Resin Duct Density (Number·6 mm−2)
CK1803.67 ± 1402.79 (c)10.31 ± 3.34 (a)
A3936.52 ± 2133.45 (a)9.80 ± 3.03 (a)
B3673.70 ± 2501.69 (ab)8.67 ± 3.46 (a)
C3382.70 ± 1750.26 (b)10.88 ± 2.71 (a)
D3665.11 ± 2457.92 (ab)11.65 ± 4.16 (a)
Different lowercase letters represent significant differences (p < 0.05).
Table 4. Differential analysis of the anatomical structure of the resin duct.
GroupsIndividual Axial Resin Duct Area (μm2)Axial Resin Duct Density (Number·6 mm−2)
Low resin yield1378.06 ± 861.54 (b)8.21 ± 2.46 (a)
Medium resin yield2390.91 ± 1836.06 (a)10.18 ± 3.40 (b)
High resin yield1568.54 ± 1109.08 (b)12.09 ± 2.95 (c)
Different lowercase letters represent significant differences (p < 0.05).
Disclaimer/Publisher’s Note: The statements, opinions and data contained in all publications are solely those of the individual author(s) and contributor(s) and not of MDPI and/or the editor(s). MDPI and/or the editor(s) disclaim responsibility for any injury to people or property resulting from any ideas, methods, instructions or products referred to in the content.

