


Tree Radial Growth Responses to Climate and Reservoir Impoundment in Valleys in Southwestern China
by
 , and
, and
Lian Sun
1,*,
Wangke Ding
2,
Yang Zhou
3,
Jiejun Wang
1,
Xingyue Ouyang
1,
Zijun Fan
1,
Youru Yao
1 and
Chonghong Zhang
1 1
School of Geography and Tourism, Anhui Normal University, Wuhu 241002, China
2
Anhui Pinjie Intelligent Environmental Protection Technology Corporation Limited, Anqing 246003, China
3
School of Water Resources and Hydropower Engineering, North China Electric Power University, Beijing 102206, China
*
Author to whom correspondence should be addressed.
Forests 2024, 15(5), 749; https://doi.org/10.3390/f15050749
Submission received: 15 March 2024
/
Revised: 10 April 2024
/
Accepted: 22 April 2024
/
Published: 25 April 2024
(This article belongs to the Special Issue Dendrochronology beyond the Ordinary: Understanding the Wood Formation and Climate Change)
Abstract
:Southwestern China is a critical biodiversity hotspot area, and many large hydroelectric projects have been established in the valleys in the region. Tree growth in the valleys will be affected by both regional climate and reservoir impoundment. However, it remains unknown whether the radial growth of trees in the valleys has a common response pattern to the regional climate, and it is also unclear whether the response of radial growth to reservoir impoundment can be detected. In this study, we developed tree-ring width chronologies of Pinus yunnanensis Franch. collected at 11 sites with vertical and horizontal gradients to three hydroelectric reservoirs in three riverine valleys in southwestern China. We analyzed the radial growth responses to the regional climate from 1986 to 2017 by correlation with instrumental meteorological data. Tree growth responses to reservoir impoundment were investigated through spatial and temporal comparisons using the change in the Euclidean distance and difference test. We also distinguished their responses at tree-ring sites without influenced by reservoir impoundment including two sites in the valleys and seven sites at high elevations. The results showed that the climate conditions in May and the dry season before the growth season significantly limit the radial growth in the valleys, which is different to that at high-elevation areas in southwestern China. Growth variations in the valleys are related to elevations and the trees in similar slopes positions exhibit similar responses. For trees in the low slope positions, both variance and mean values of radial growth are affected by reservoir impoundment. Trees at relatively low sites (i.e., sites M2, R2, L2), rather than the trees close to the reservoirs (i.e., sites M1, R1, L1), respond more sensitively to reservoir impoundment.
1. Introduction
The vegetation–climate relationship controls the exchange of matter and energy of earth system [1]. The variations in vegetation growth record environmental changes in the earth system through ecological and physiological processes [2]. Anthropogenic disturbances with multiple sources increase the complexity of this response. With the large demands for clean and renewable energy, hydropower development, along with reservoir impoundment, is occurring rapidly [3]. Hydropower development also influences vegetation growth by altering surrounding hydroclimate. The tree-ring is a useful tool to detect the growth–climate relationship due to its accurate dating of radial growth and ability to reflect climate change [4]. The response varies with locations [5], which is more sensitive and complex in some places, such as southwestern China, in which the ecosystem is vulnerable [6] and hydropower development are more intensive [7]. However, it remains unknown whether the radial growth of trees has a common response pattern to the regional climate in the valleys in southwestern China. It is also unclear whether the response of radial growth to reservoir impoundment can be detected.
Many studies have investigated the responses of the radial growth of trees to climate in southwestern China. Increased mean or lowest air temperature in previous winters or pre-monsoon before growth season can promote radial growth [8,9,10,11,12,13,14,15,16,17,18]. Reduced rainfall in growing season is another beneficial factor [17,19,20,21,22,23,24,25]. The higher the elevation at which a tree is located, the more significant the response pattern [26]. Sampling sites in relatively low positions of the high-elevation areas illustrate the fact that radial growth can also be suppressed by decreased moisture availability in spring before the growing season [26,27,28]. However, the existing research focused on the growth at high elevations above 2500 m a.s.l.; the growth–climate relationship below 2500 m a.s.l. has seldom been studied. Sun et al. [29] established five chronologies of tree-ring width using Pinus yunnanensis Franch. in a dry–warm valley in the lower part of the Yalong River. This research found that radial growth is limited by moisture availability in dry season and May, which is distinctly different from the response pattern at the high elevations. Shen et al. [30] found a similar response pattern at a dry–hot valley and the Yunnan–Guizhou Plateau below 2500 m a.s.l. However, it remains unknown whether the growth response pattern is common across all the areas in low elevations. Compared to the high-elevation regions, the climate in the low-elevation areas varies more. The valleys include four categories i.e., dry–hot, dry–warm, dry–temperate, and non-dry valleys [31]. In addition, most human activities, for instance industrial and agricultural productions and hydropower development, occur in the low elevations or in the valleys [32]. They will increase the complexity of environmental disturbances. The radial growth response in the areas below 2500 m a.s.l should also be given attention, as these areas occupy nearly 30% of the Hengduan Mountains region. Further exploration is required of the response rules of radial growth–climate in the low elevations in southwestern China.
Previous research has identified tree growth response to reservoir impoundment or lake with fluctuating water levels resembling a reservoir. Some studies applied tree-ring width to detect radial growth and plant phenology responding to changes in precipitation, temperature, and drought induced by reservoir impoundment [33,34,35]. Through a spatial comparison between coastal and inland trees in the vicinity of aquatic lakes, the response patterns of radial growth were found to be similar to those seen in reservoir impoundment [36]. However, in some cases, the ring width was regarded as a non-sensitive indicator. When anomalous rings such as frost, light, and compression rings were counted, the occurrence frequencies of such anomalous rings increase after reservoir impounding [37]. Due to the increase in water withdrawal from a lake in the Mediterranean region, the water level fluctuation resembled the regulation process of a hydroelectric reservoir. In this case, the groundwater table and soil water content became critically limiting factors of the radial growth [38]. Therefore, the response pattern tree growth differs in different regions, species, processes of reservoir regulation, and growth indicators. Generally, research on the radial growth response to reservoir impoundment is among the least investigated in dendrochronological studies. More cases should be presented to elucidate general rules of response. Certain questions are also yet to be answered, for instance the spatial extension of response and whether the response has an elevation effect.
Global warming and intensive engineering construction in southwestern China are exerting significant pressure on vegetation growth [39]. This region is located in the southeastern rim of the Qinghai–Tibetan Plateau, and has a regional warming rate of four times the mean level of the Northern Hemisphere since the 1980s [40]. The characteristics of natural geography in southwestern China decrease the ability of vegetation to resist global warming. This area consists of parallel mountain ranges and riverine valleys oriented in north–south direction [8], including the Hengduan Mountains region, which is a critical biodiversity hotspot area [41]. The valleys are usually very deep with a relative difference of elevation of approximately 1000~3000 m, and many of them are dry valleys whose ecosystems are particularly vulnerable [42]. Furthermore, intensive hydropower development exerts another pressure on the vulnerable nature. Southwestern China has the largest hydropower resources in China [7]. More than 40 large hydroelectric stations have been constructed. Some of them rank in the top ten in terms of dam heights (for instance, the Jinping-I dam, with height of 305 m, is the highest arch dam in the world [43]) or installed capacities (for instance, the Three Gorges hydropower station is the largest hydroelectric project in the world [44]). More hydroelectric stations are being established and more hydropower generation will be established in the future according to national plans [45,46]. After a hydropower station launches turbines, a hydroelectric reservoir will be generated by impounding previous river channels. Therefore, along with its sensitive response to global warming and intensified hydropower development, the regime of tree growth in southwestern China is complex when considering the number of hydroelectric reservoirs generated.
In this study, we used tree-ring width data sampled from 11 sites around three artificial reservoirs in the valleys in southwestern China to explore the responses of radial growth of Pinus yunnanensis to climate and reservoir impoundment from 1986 and 2017. We first hypothesized that the radial growth in the low elevations in southwestern China would have universal response patterns to climate, which would be different from the results of previous research conducted much at high elevations in this area. We also assumed that the tree growth at certain sites around the reservoir will be influenced by reservoir impoundment, which can be detected by certain statistics. To verify our hypotheses, we designed methods to distinguish the growth responses to climate and reservoir impoundment. Finally, the elevation effect of responses and the influence of reservoir impoundment were discussed based on comparisons with previous research and further analysis. This research will enrich study cases of dendroclimatology, especially for the low elevation areas in mountainous regions. Tthis work will provide a reference for debating the balance between hydropower development and environmental protection in areas with vulnerable environments and intensive human activities [47].
2. Materials and Methods
2.1. Overviews of Tree-Ring Sites and Hydroelectric Reservoirs
Tree rings from 11 sites in three riverine valleys in southwestern China were collected during 2016–2022. The sites were on three slopes closed to three artificial reservoirs and the sites in a slope spread with elevation gradient (Figure 1). Sites M1–M3 were located near the Manwan reservoir or the previous channel of the Lancang river; sites R1–R4 were located near the Ertan reservoir or the previous channel of the Yalong river; and sites L1–L4 were located near the Longkaikou reservoir or the previous channel of the Jinsha river. For each reservoir or slope, we named sites M1, R1, and L1 “the lowest sites”; sites M2, R2, and L2 “the relatively low sites”; sites M3, R3, and L3 “the relatively high sites”; and sites R4, and L4 “the highest sites”. The vertical distances of the sites to the reservoirs spanned from 52 to 902 m, and horizontal distances were between 120 and 3911 m (Table 1). As the valleys are deep, most of the tree-ring sites were located in the bottom parts of valleys up to half distances from the water to the top of mountains, except site R4, which was closed to the top.
The three artificial reservoirs differed in terms of locations, meteorological conditions, and engineering configurations (Table 2). The Manwan reservoir was impounded earliest (March 1993). The Ertan hydropower station had the largest installed capacity that China ever established in the 20th century, and it is the largest among the three reservoirs. The Longkaikou impounded lastly (November 2012) and was the smallest. The three reservoirs impounded on previous rivers (i.e., the Jinsha, Yalong, and Lancang rivers) with large annual flows (>1200 m3/s). Ertan and Longkaikou are located in dry–warm and dry–hot valleys respectively, and Manwan is in a non-dry valley. Southwestern China including the three valleys has typical dry and wet seasons.
2.2. Tree-Ring Sampling and Measurements
Field and laboratory work was conducted according to standard dendrochronological procedures. At each site, we selected 10~20 healthy trees with less fire damage, fewer insect infestations, straight trunks, and which were located away from agricultural activities. Two tree-ring cores were collected from each tree using an increment borer with diameter of 0.5 cm at 1.3 m above the ground. One core was collected parallel to the slope orientation and the other perpendicular to slope orientation. To reduce disturbance caused by differences in the tree species, all of the sampled trees were Pinus yunnanensis Franch., or Yunnan pine, a conifer commonly spread in southwestern China, especially founded at elevations below 2500 m a.s.l. [48]. Then, the cores were mounted, dried, and sanded in the laboratory. Next, the tree-ring width was measured using a microscope with LINTAB system. The width data were dated with the program COFECHA (version XP2007, the Tree-Ring Lab, Columbia University, and the Tree Ring Unit, University of Cambridge, NY, USA and Cambridge, UK) to determine correct years of the rings. For each tree, two width values for each year were averaged, which resulted in a raw tree-ring width chronology. Then fundamental statistics can be determined such as average sensitivity, auto-regression, and master correlation coefficients.
Climate signals were extracted based on the framework proposed by Cook (1987). The raw width i.e., the original measured values of the tree-ring width, is composed of five sources: age-dependent width, climate-related width, endogenous disturbance, exogenous disturbance, and largely unexplained interannual variability. Endogenous disturbance will not influence all individual across both time and space. Unexplained interannual variability influences the estimation of age-dependent width and is related to soil type, moisture, and measurement errors. As the heterogeneity among trees is small when the trees are close to each other within a site, the influences of unexplained interannual variability can be neglected. Additionally, the endogenous disturbance and unexplained interannual can be largely reduced by averaging all of the samples within a population. We reduced the exogenous disturbance by selecting population with less fire damage and insect infestations. The climate-related width can be obtained by detrending the age-dependent width from raw width by residual method. Our time span was short, which might produce ratio bias problems if we use ratio method for detrending. Thus, the residual method (raw ring width minus age-dependent width), rather than the ratio method (raw ring width divided by age-dependent width), was applied to avoid ratio bias problems. The age-dependent width was modelled with negative exponential or linear function to depict fast growth in juvenile stage and slower growth later. As our time spans were not long, we also used initial power transformation to avoid ratio bias problems. Finally, after using a biweighted method, a dimensionless tree-ring width index (TWI) series was generated to represent climate-related tree-ring width master chronology for each site. The detrending and calculating procedures mentioned above were carried out in program SigFree (version 45, the Tree-Ring Lab, Columbia University, and the Tree Ring Unit, University of Cambridge, NY, USA and Cambridge, UK). Express population signal (EPS) indicates signal and noise between and within individual trees in a community [49]. A time span with an EPS of greater than 0.7 was reserved to capture stable signals.
2.3. Meteorological Data and the Responses of Tree Growth to the Regional Climate
We used instrumental meteorological data for low elevations and other tree-ring width data at high elevations. Four meteorological stations Miyi, Huaping, Jingdong, and Nanjian were the sources of instrumental meteorological data. The stations are all in the bottom of valleys and close to the reservoirs. Similarly, the data during years of 1986 and 2017 were restricted to when the growth–climate relationship was analyzed. To compare the response patterns at high elevations above 2500 m a.s.l, we also utilized tree-ring width data collected by other researchers in the Hengduan Mountains. Only coniferous trees were finally selected to reduce uncertainty from difference in species. Therefore, a total of nine chronologies of tree-ring width were applied for comparison, i.e., chronologies with site codes CHIN025~CHIN028, CHIN037, CHIN038, CHIN076, CHIN077, and CHIN087. Sites CHIN076 and CHIN077 were also denoted as sites C1 and C2, which were also established by us and are located in dry valleys that are not influenced by reservoir impoundment [34]. These nine chronologies can be obtained from the National Centers for Environmental Information (NCEI)—Paleoclimatology Data (https://www.ncei.noaa.gov/maps/paleo/ (accessed on 10 March 2024)).
To detect the responses of tree growth to the regional climate, we first analyzed the growth relationship between tree-ring chronologies. To check the consistency of tree-growth, we conducted a Pearson’s correlation and then made two types of comparisons—a comparison within each group of a reservoir and a comparison between different groups. To further explore the relationship, a hierarchical cluster analysis was conducted to check whether the spatial pattern of the chronologies is related to valleys, reservoirs, and elevations.
The responses of radial growth to the regional climate were investigated using general method in dendroclimatology. A Pearson’s correlation was performed between TWI chronology and monthly climatic factors. Climatic factors included mean air temperature, precipitation amount, and relative humidity. The standardized precipitation evapotranspiration index (SPEI) with a time scale of six months was also considered to identify the impacts of climatic drought [50]. Climate conditions in the months from May in previous year to October in current year were selected for the correlations. Many valleys have a typical dry season (from November in the previous year to May in the current year) and wet seasons (from June to October in the current year), so the climate conditions in these two seasons were also aggregated. To reduce the uncertainty from sample size, we analyzed the growth–climate relationship during a common stable period when all of the EPS of the chronologies are larger than 0.7, i.e., the years between 1986 and 2017.
2.4. Influences of Reservoir Impoundment on Tree Growth
To uncover the influence of reservoir impounding on tree growth, we made two kinds of comparisons, i.e., spatial and temporal comparisons, based on further processing data from TWI chronologies. The spatial comparison was paired t-test for the Change in the Euclidean Distance (CED) between chronologies from different sites. For a certain period, the CED was tested between two kinds of reservoirs: (1) an experimental reservoir that was impounded during a period, (2) a reservoir that was not impounded during the period and was utilized as a reference reservoir. The details of spatial comparison between chronologies can be referred to in the Supplementary Materials (Text S1).
The temporal comparison was conducted by difference test based on time series data of “filtered TWI”. The “filtered TWI” represents the TWI that is processed and will then be used for a difference test, rather than that TWI that is applied directly for a difference test. A filter was defined as a certain tree-ring site which contains more signals of regional climate change. Thus, the chronologies of C1, C2, and R4 were selected, as these sites were located far away from the reservoirs (i.e., sites C1 and C2) or were not affected by reservoir impounding (i.e., site R4), according to previous research [34]. A chronology will be subtracted by the filters, which will yield a new data series or a “filtered chronology”. We divided a filtered chronology into two sections: a pre-impounding section and a post-impounding section. Then, the two sections are compared by difference test to check the changes of variance and mean value. Similarly, we made another kind of subtraction between chronologies referred as a “differential chronology”. The chronologies in the valleys might be affected by impounding, and their response patterns are unclear. Therefore, we used all of the differential chronologies around the reservoir to find out the specific change in radial growth caused by reservoir impounding.
Comparatively, directly making analysis using chronology, such as trend analysis or difference test, cannot remove the disturbance caused by regional climate change. Tree growth is influenced largely by natural climate change, which is characterized by periodicity including middle- and long-term variations. Thus, the results of directly temporal comparison using TWI data cannot reveal whether the trends or differences are induced by the periodicity of climate change or by reservoir impoundment.
3. Results
3.1. Characteristics of Tree Rings
Figure 2 shows the time series of tree-ring width index (TWI) or tree-ring width chronology. The interannual variations in these chronologies resemble each other especially after the year of 2001. For the sites R1 and R2 near the Ertan reservoir and sites L1–L4 near the Longkaikou reservoir, TWI increases quickly for 1~3 years after the reservoir impoundment, and then it falls to a normal level. This phenomenon is not obvious for the high site near the Ertan reservoir and all of the sites near the Manwan reservoir. Whether the sudden increase is affected by hydropower development will be discussed in the discussion section.
Here, we define the trees around same reservoir as a group. Firstly, for the total of 55 correlation coefficients between chronologies (Figure 3), most reach significance level (p < 0.05, 51 results), which means that annual changes in tree growth are generally same and that our sampling and dating are correct. Thus, they can be used in the subsequent analysis. Secondly, consistencies within group are better than that between groups, as insignificant correlations (p ≥ 0.05, 3 results) are the chronologies mainly from different reservoirs. This is consistent with our expectation that radial growth from different tree individuals near same reservoir resemble each other. Lastly, specific sites exhibit several features. In terms of correlations within a group, the relatively low sites (i.e., R2, L2, and M2) perform better in correlations within their own group. The relatively low sites result in higher correlation coefficients with their adjacent sites. In terms of sites between groups, site M1 near the Manwan reservoir correlates well with all sites in Ertan reservoir (p < 0.001). Sites R2 near the Ertan reservoir have similar performance with sites in Longkaikou reservoir (p < 0.01). However, although the Longkaikou and Manwan reservoirs are close to each other, none of the sites between these reservoirs correlates better than the others.
3.2. Radial Growth Responses to the Regional Climate
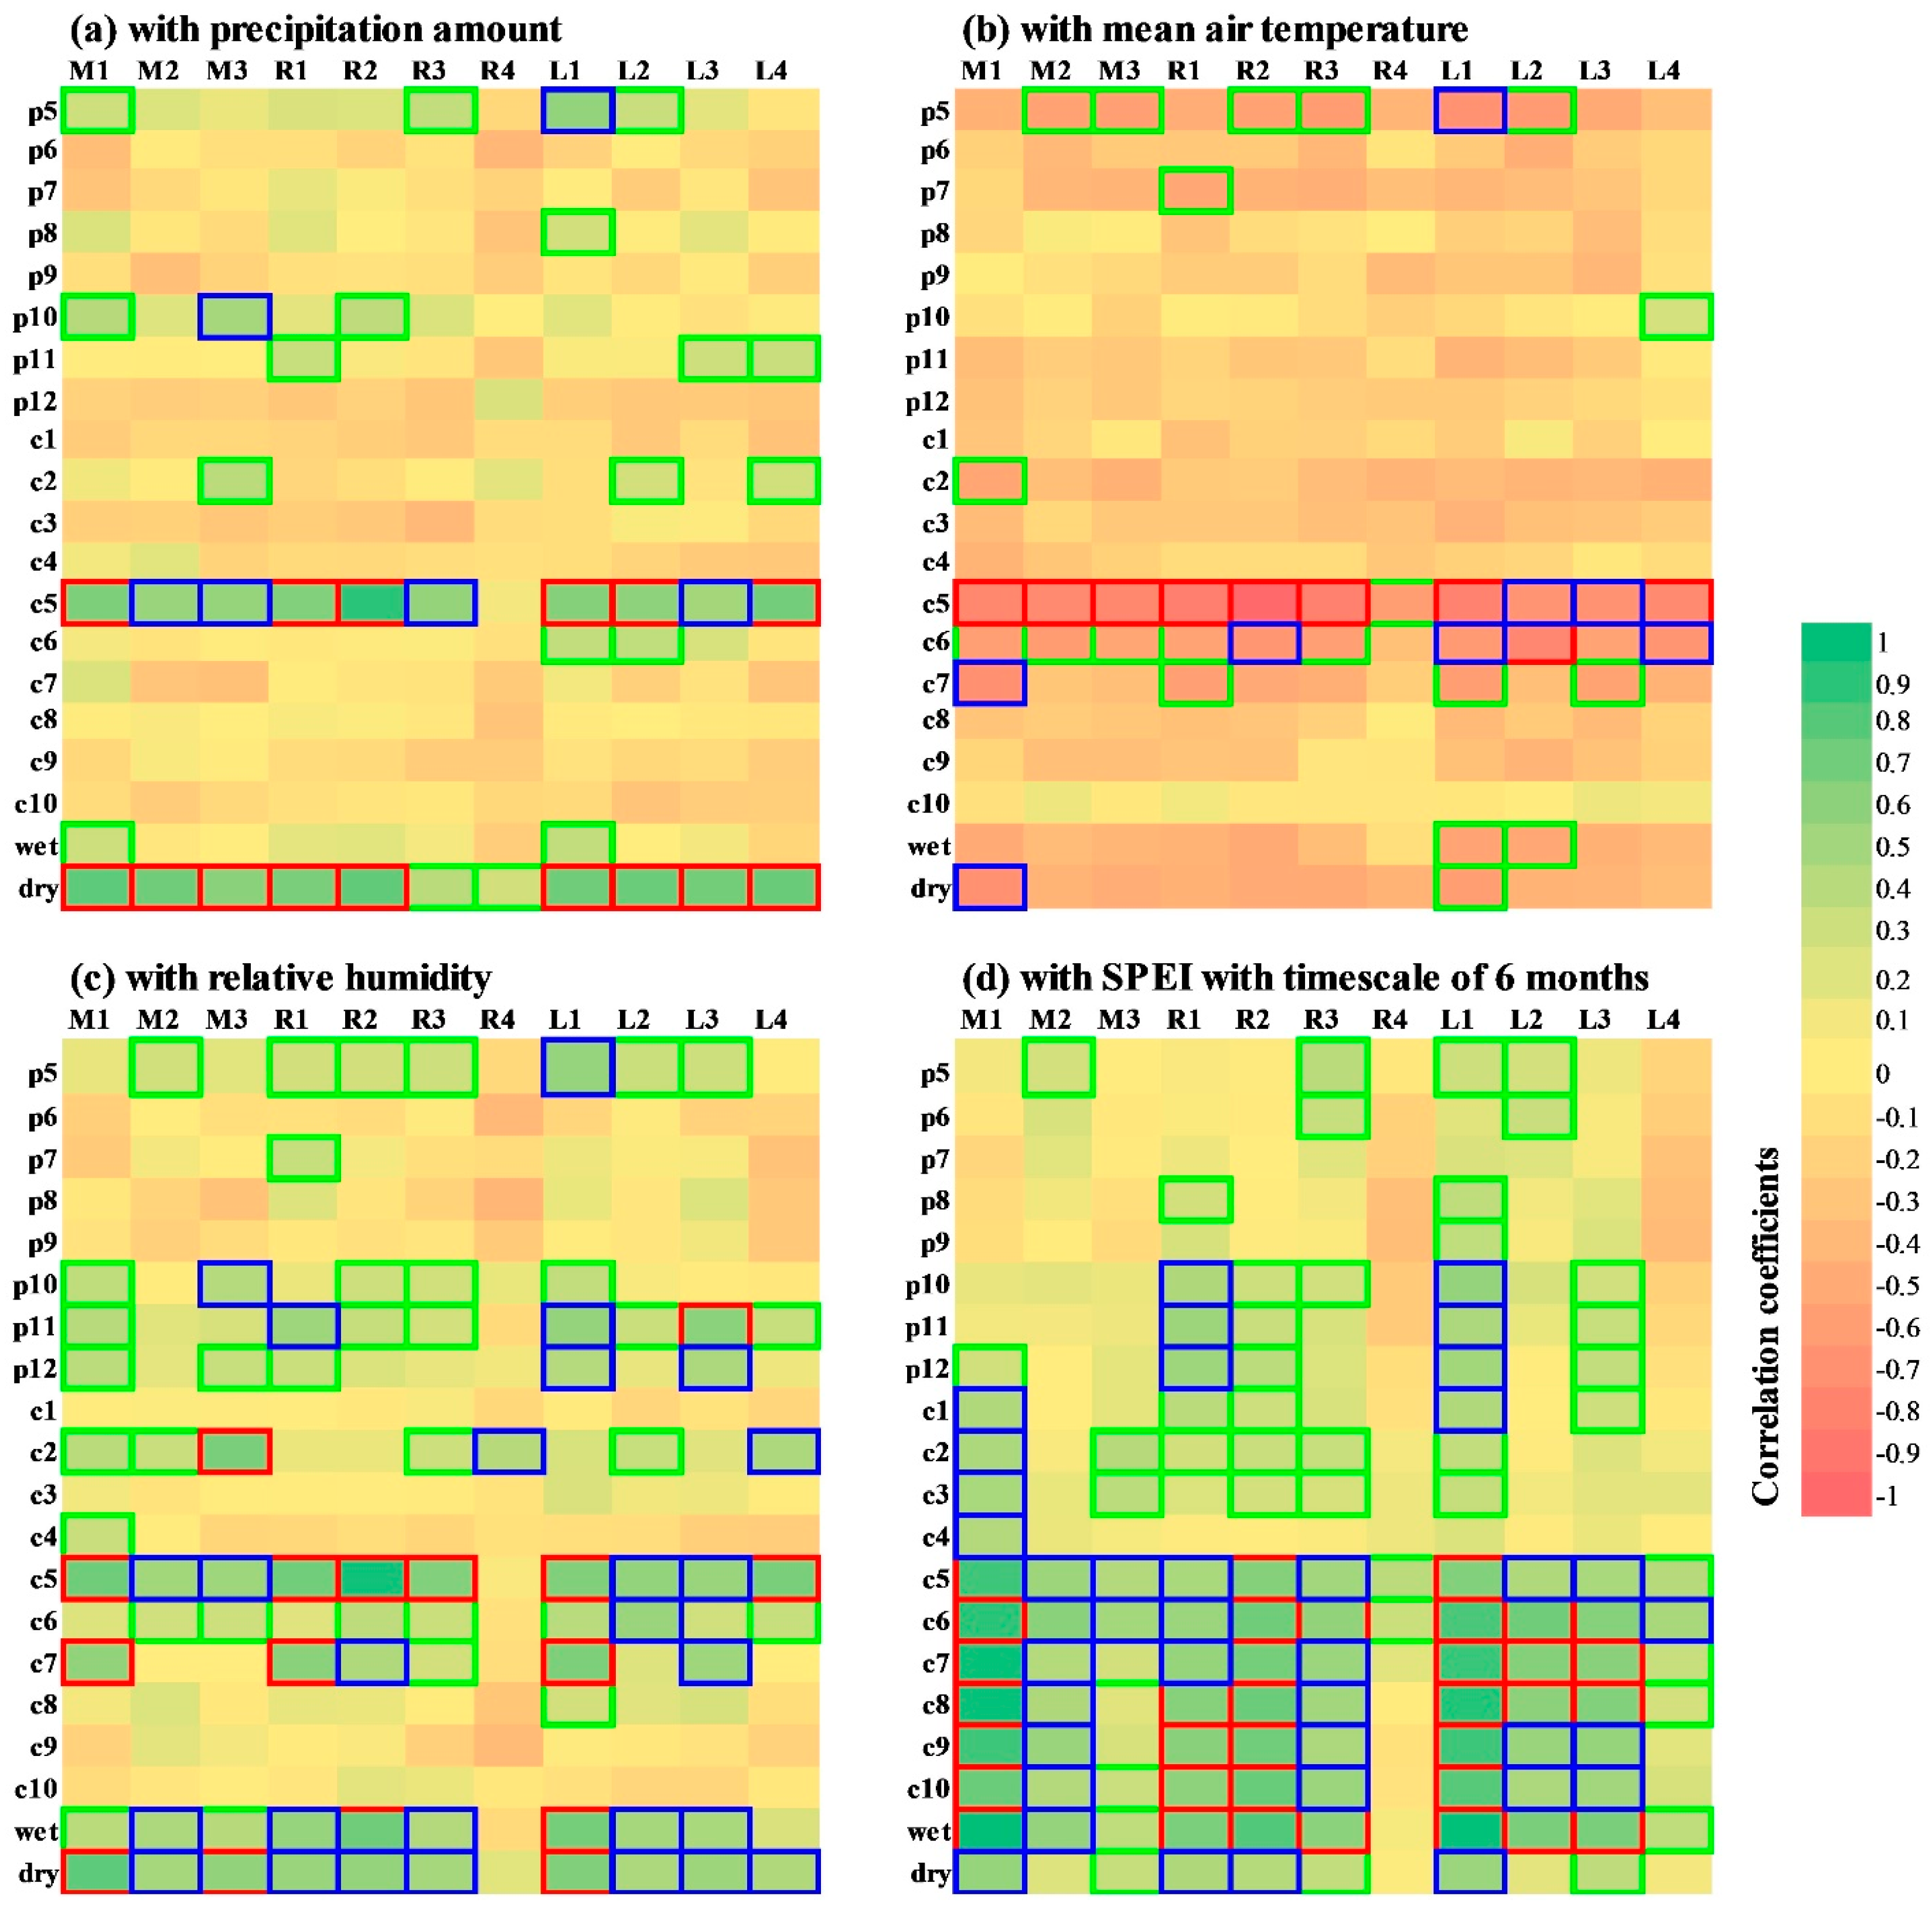
The climate conditions in May and dry season before the growth season limit the radial growth of trees in valleys. Regardless of which meteorological station was selected, the amount of precipitation in May significantly promotes tree growth and the air temperature in May significantly limits growth (p < 0.01) (Figure 4 and Figure S1). The amount of precipitation and air temperature in the dry season are also critical to growth (p < 0.05). In addition to temperature and precipitation, relative humidity is another key factor showing limitations in more months. Similar to precipitation, humidity in the current May and the dry season significantly and positively correlates with tree growth (p < 0.01). In addition, humidity in the previous May and the previous November also exhibits positive correlation (p < 0.05 for most sampling sites). Here, all of the climate conditions influencing radial growth are before the growth season, rather than during growth season since June in current year. The good correlation with SPEI shows that the radial growth is largely dependent on the moisture availability (Figure 4d).
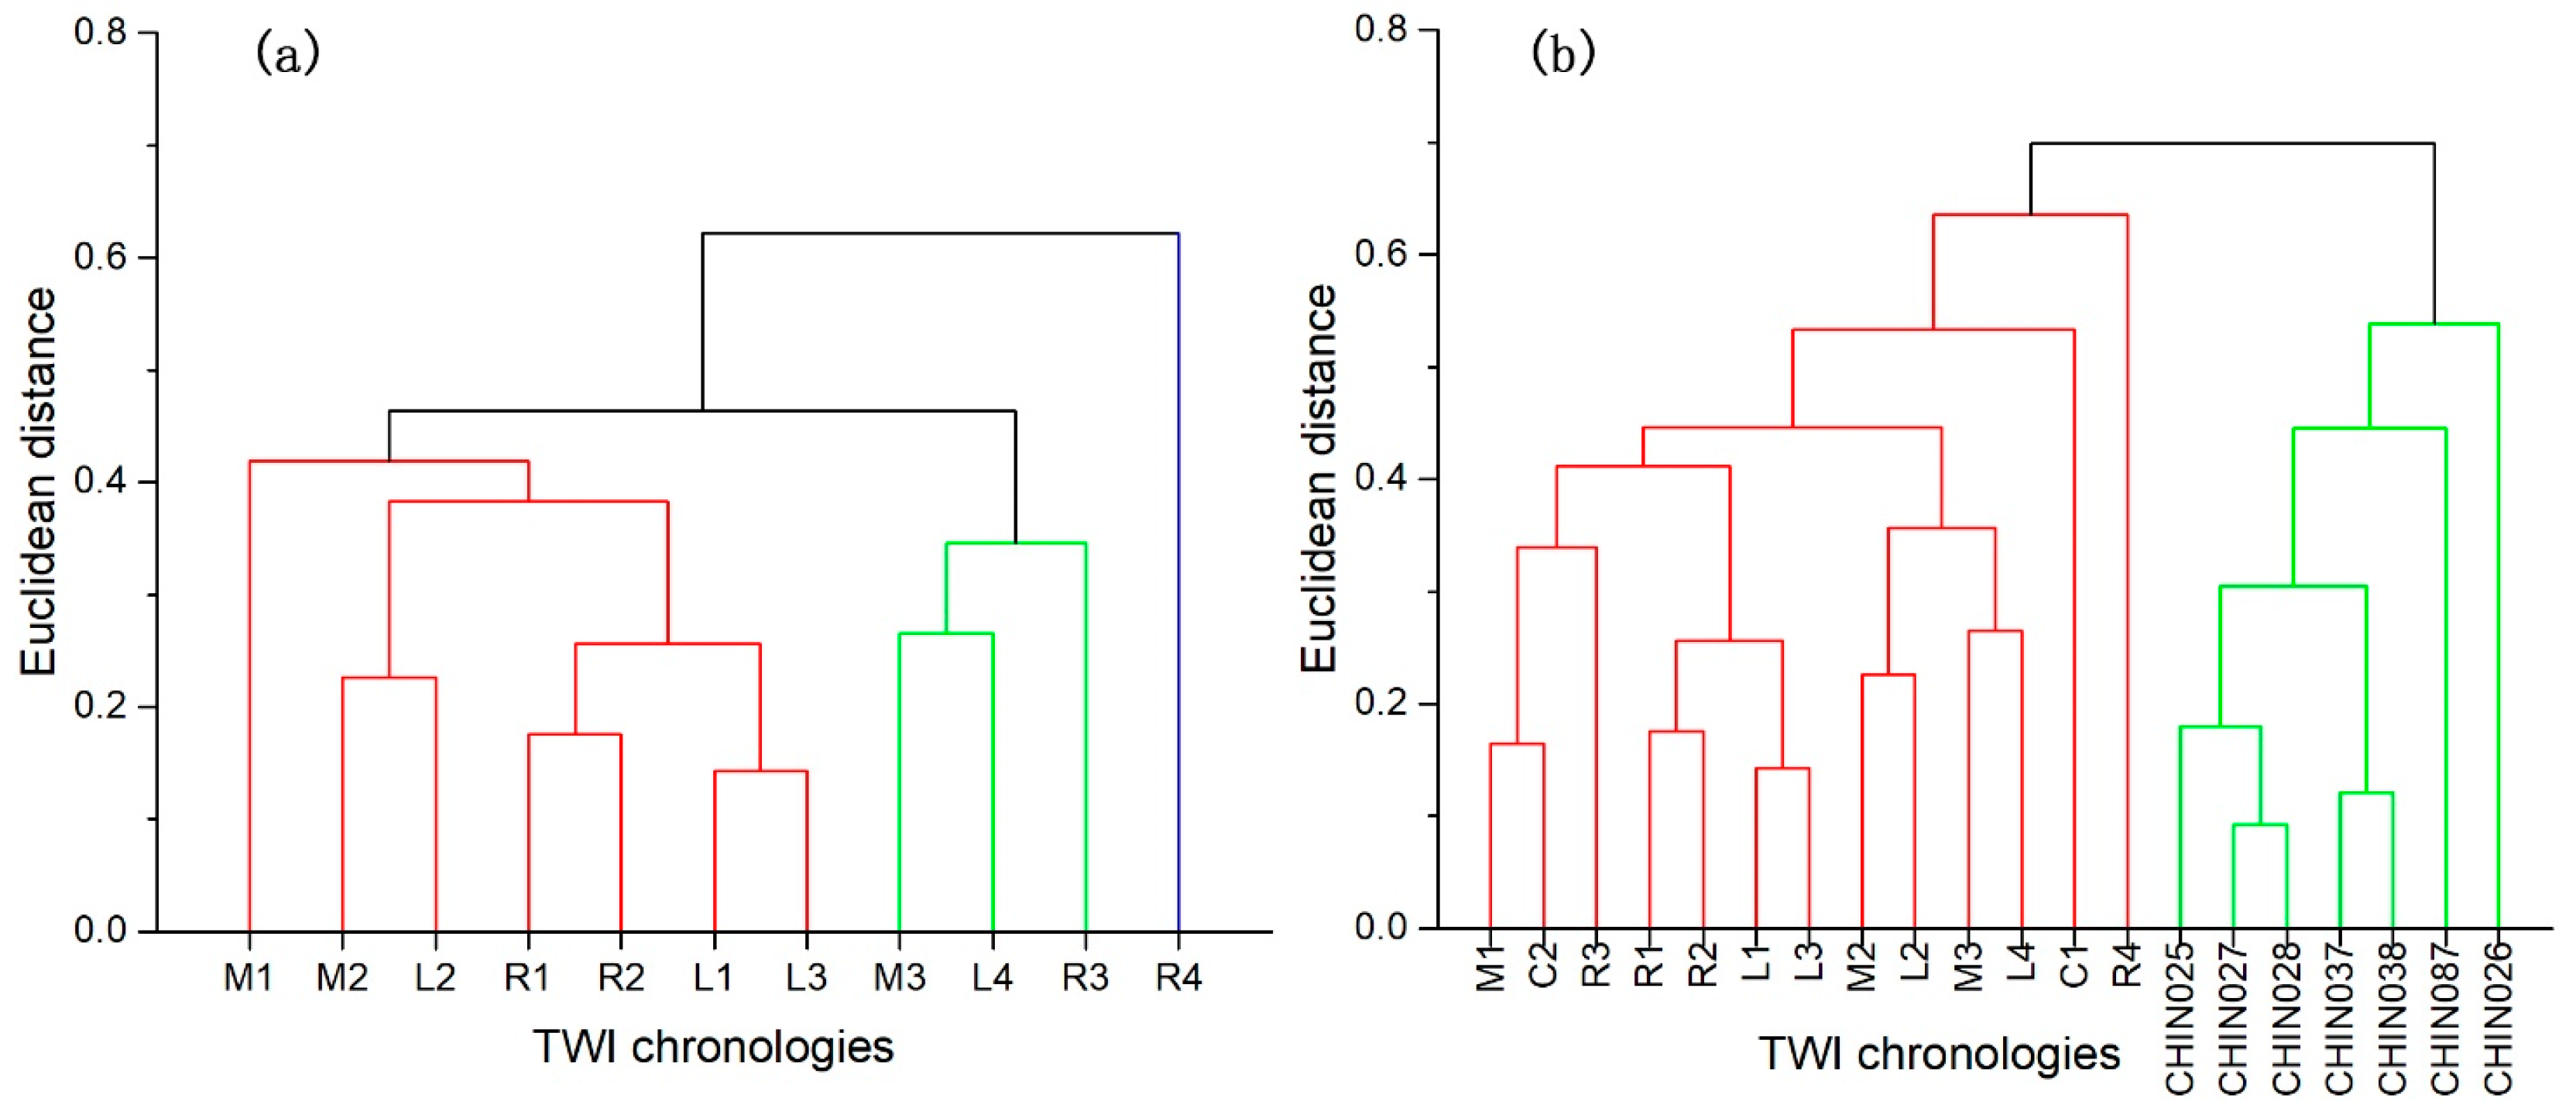
The results of the hierarchical cluster analysis show that the characteristics of tree growth in the valleys is related to elevation. Tree-ring chronologies in valleys and high-elevation areas are in two different clusters without any overlapping distinctly (Figure 5b). This suggests that the radial growth is obviously different for trees in the valleys and at the high-elevation areas. In terms of the chronologies in the valleys at similar slope positions, although they are from different valleys, they exhibit similar responses. In terms of all the sites in the valleys, most of the high sites (M3, R3, L4) are in one cluster, and the low sites (including the relatively low sites and the lowest sites) are in the other cluster (Figure 5a). Here, we did not include the highest site R4, as its response is different to other sites in the valley. Within a cluster, the Euclidean distance between sites in same positions from different valleys tends to be closer than sites from a same slope. In some cases, their Euclidean distances even rank to the closest ones. For example, for the lowest site M1 in Manwan, the lowest sites L1 in Longkaikou have the closest Euclidean distance. For the relatively low site M2, the relatively low site L2 ranks as the closest. For the lowest site R1 in Ertan, L1 ranks to the second closest, closely following site L3.
3.3. Changes in Tree-Ring Width Index after Reservoir Impounding
A paired t-test conducted on the change in the Euclidean distance of TWI (Table 3) reveals that tree growth in the valleys is affected by reservoir impounding, especially for trees at the low slope positions or close to the reservoir. After the Manwan reservoir was impounded, the change in the Euclidean distance of TWI is significant (p < 0.1) when compared with that of the Longkaikou reservoir during the same period. For the impounding of Longkaikou reservoir, the change is more significant (p < 0.05) when compared with that of the Ertan reservoir. For the impounding of Ertan reservoir, the change in the tree growth at low sites can be observed (p < 0.1) compared with that at the sites near the Manwan reservoir (p < 0.1), yet it exhibits a weak significance (p = 0.11) compared with the Longkaikou reservoir. In addition, for all of the reservoirs, the inclusion of the sites at low positions in the t-test usually leads to smaller p-values compared to thoset when all of the sites were used. This suggests that the tree growth at low slope positions or close to the reservoirs might respond more sensitively to the reservoir impounding.
A difference test on TWI with filters implies that both variance and mean value of tree growth are altered by reservoir impounding, and the relatively low sites (M2, R2, L2) respond more sensitively (Table 4). After being filtered by C1, C2, or R4, more local signals will be retained and then they can reflect reservoir impounding by difference test. The variance test shows that M2, R2, and R3 are changed significantly by some filters (p < 0.05). The mean values in sites M2 and L2 change significantly (p < 0.05), while the values of the other sites only changed slightly. For the sites filtered by the corresponding lower sites in the valleys, more changes can be observed. Half of the results of mean value testing show significant different after impounding of reservoirs (Table S1), of which M3 filtered by M2, and L4 by L2 change much more than others (p < 0.001), and R3 filtered by R2 responds sensitively (p < 0.05). Compared to the changes of mean values, only two results of variance test show significant changes. Consequently, if a site is filtered by relatively low site (M2, R2, L2), the changes of TWI will be significant.
4. Discussion
4.1. Elevation Effect of Responses to the Regional Climate
The radial growth correlation with climate data indicates that trees in the valleys is significantly limited by water availability before growth season, especially in May and the dry season. Southwestern China has distinct dry and wet seasons caused by the influence of the Asian monsoon [51]. The drought regime with less precipitation and high temperature is more obvious in the valleys due to the Foehn effect related to the mountainous topography with enormous elevation difference [52], which contributes to the deficit in the water availability. The climate condition will enhance plant respiration and reduce carbohydrate reserves [13]. Subsequently, the radial increase in following growth season will be suppressed because of the time-lagged effect [26]. The climate condition in May is more critical to the radial growth, as May is a transitional month between the dry and wet season. In many locations in the dry valley, the air temperature in early May ranks as the highest in a year while the precipitation is still lower. This climate condition quickly shifts to wet in late May. Therefore, the water availability before the growth season is critical to bud and leaf expansion [8]. This response pattern in the valleys is distinctly different with that in adjacent high-elevation areas. Usually, the radial growth at high elevation above 2500 m a.s.l. will benefit from the high air temperature in winter or spring, and the quantity of precipitation before growth season might be a sensitive factor (see paragraph two in the Section 1). The discrepancy in the response pattern between high and low elevations has been also observed in the southern rim of the Qinghai–Tibet Plateau [30] and the northeastern Qinghai–Tibet Plateau [53].
The highest site around the reservoir and close to the top of mountain exhibits different cluster analysis results, and it can function as a bridge between sites at low elevation here in the valleys and sites at high elevations other research investigated. Firstly, the cluster analysis and previous research justified this. Chronology R4 has the farthest Euclidean distance to other chronologies in the valleys, which contributes to that R4 is categorized into a single cluster (Figure 5a). When all the chronologies including both the sites in the valleys and the sites at high elevations are clustered, R4 is still in a single cluster. Tree growth in the valleys might be affected by both regional climate and reservoir impounding. However, previous research on sites near the Ertan reservoir uncovered that tree growth in a slope has elevation effect and R3 is not affected by hydropower development [34]. Thus, we are confident that tree growth at site R4 is rarely affected by reservoir impounding as its position is higher than that of site R3. Secondly, the topographic characteristic of a site explains that the tree growth has been more strongly influenced by the regional climate at site R4. Site R4 is close to the top of mountains, thus it can be selected as a tree-ring site reflecting regional climate according to the sampling standards of dendroclimatology. Comparatively, although site L4 is higher than site R4, it is at the middle position of its slope. Thus, regional climate could not significantly influence tree growth. Therefore, site R4 can be viewed as a transitional site between sites in the valleys below 2500 m a.s.l. and sites at high positions above 2500 m a.s.l.
4.2. The Responses of Radial Growth to Reservoir Impoundment
The comparison of the chronologies suggests that the relatively low positions (i.e., M2, R2, L2) are the position where tree growth responds more sensitively to reservoir impounding. The chronologies at sites M2, R2, and L2 show significant changes according to both the spatial and temporal comparisons. Comparatively, spatial and temporal comparison are not significant for sites the lowest positions close to the reservoirs (i.e., M1, R1, L1). This suggests that the tree radial growth responds to reservoir impounding more sensitively in vertical distances of between 202 and 302 m from the reservoir, or in horizontal distances of between 494 and 692 m from the reservoir. Previous research on tree growth near the Ertan reservoir uncovered that radial growth at site R2 suddenly increases after impounding, and the change is more significant than that at sites R1 and R3 [34]. The phenomenon of a sudden increase in radial growth and then falling to a normal level may contribute to the significant increase in variance after impounding.
The sensitive response at certain slope position could be related to the geological conditions and hydro-meteorological changes due to reservoir impoundment. On the one hand, the valleys in southwestern China are in a region with numerous mountains and enormous elevation difference, and most of the rock stratums are impermeable. Thus, the elevated groundwater levels cannot reach the roots of our sampling trees [29]. On the other hand, the significant change in hydrometeorology above the reservoir occurs in certain spatial range. The daily temperature decreasing and humidity increasing may be more significant above the water surface within an interval of 52–525 m. The vertical distance varies with the reservoir, e.g., the lower bound is 52 m for the Longkaikou reservoir and the upper bound is 525 for the Ertan reservoir.
4.3. Study Limitations and Future Work
Although we distinguished the changes in tree growth responses to reservoir impoundment, uncertainties in mechanism of response and method of identification limit our analysis. The method of paired t-test to determine the change in the Euclidean distance relies on the object of comparison or the reservoir. The testing results may not be accurate enough, as they differ when we use different reservoir as comparison. Nevertheless, we believe that the uncertainty would be larger if we directly make comparison between chronologies such as analysis of variance (ANOVA) and a paired t-test for TWI (rather than for the change in the Euclidean distance). The results show that these methods cannot identify the influence of reservoir impounding, and in some cases the testing results are not consistent with the real situation. For example, paired t-test on the TWIs during the years of 1993 and 1998 showed that the TWIs of the Ertan and the Longkaikou were significantly different (p < 0.05), which fails to address our question since Ertan and Longkaikou were not impounded during the period. The ANOVA analysis yielded similar results. These contradictions may be related to the complex joint influence of the regional and local climate change on tree growth, wherein the direct comparison fails to detrend the disturbance on the local climate from regional climate.
In addition, multiple influencing factors may disturb the signals of reservoir impoundment in the tree-ring data. Although the disturbance of non-reservoir-impounding factors have been decreased by selecting the same tree species, many other factors may still influence the testing of the hypothesis, for example discrepancies in micromorphology such as aspects and slope, and differences in engineering configurations, such as water depth and regulation processes. The micromorphology influences the stand condition of individual, and engineering configuration and water regulation process generate the original sources of environmental changes in atmosphere and hydrology. However, the status of the environment and process of disturbance are unclear. These issues may partially contribute to the fact that not all the sites show a significant change in the Euclidean distances of TWI. Therefore, more research is needed to uncover the response mechanisms on the ecological chains from generating disturbances, environment changes, and a physiological response to ecological indicators. This requires other methods in addition to collecting tree-rings, such as in-site monitoring, remote sensing, or ecological modelling. Despite the uncertainties, our methods based on spatial and temporal comparison have removed the disturbances caused by non-reservoir-impounding factors by setting a reference reservoir or a filtering chronology. This is an initial advancement for identifying weak signals contained in ecological data. Additionally, more types of tree growth indicators, such as tree-ring density and the stable isotopes ratio, still need to be explored to determine more precise characteristics of changes from reservoir impounding on tree growth.
5. Conclusions
Eleven age-dependent chronologies of tree-ring width index (TWI) were developed around three hydroelectric reservoirs in the riverine valleys in southwestern China. The interannual changes of these chronologies resemble each other, especially for sites from same reservoirs. The lower the amount of precipitation and high air temperature in May and the dry season before the growth season significantly limit the radial growth of trees in the valleys. A high relative humidity in the previous May and the previous November can also benefit radial growth. The good relationship between TWI and drought indicator SPEI implies that radial growth is largely dependent on the moisture availability in the valleys. These findings suggest that the response pattern in the valleys is distinctly different from that at high-elevation areas. Therefore, the radial growth responses to regional climate in the valleys in southwestern China are distinctly different from that at high elevations above 2500 m a.s.l. Tree growth in the valleys is influenced by reservoir impounding, especially for trees at the low slope positions or close to the reservoir. Similar slope positions exhibit similar responses to impoundment, even in trees from different valleys. Both the changes of variance and mean value of tree growth can be observed following reservoir impounding for the relatively low sites (i.e., sites M2, R2, L2) rather than at the lowest positions close to reservoirs.
Supplementary Materials
The following supporting information can be downloaded at: https://www.mdpi.com/article/10.3390/f15050749/s1, Figure S1: Growth–climate correlation relationship by stations Huaping, Jingdong, and Miyi; Table S1: Results of difference test for differential chronologies to test changes between pre- and post-impounding of reservoir; Text S1: Method of spatial comparison between chronologies.
Author Contributions
Conceptualization, L.S.; methodology, L.S. and W.D.; software, J.W.; validation, X.O. and Z.F.; formal analysis, J.W., X.O. and Z.F.; investigation, L.S. and Y.Z.; resources, W.D.; data curation, W.D.; writing—original draft preparation, L.S.; writing—review and editing, Y.Y.; visualization, C.Z.; supervision, Y.Y. and C.Z.; project administration, L.S.; funding acquisition, L.S. All authors have read and agreed to the published version of the manuscript.
Funding
This research was funded by the National Natural Science Foundation of China (NO. 52309075), the Natural Science Foundation of Anhui Province (NO. 2308085QD116), Wuhu Science and Technology Bureau (NO. 2023jc19), National College Students Innovation and Entrepreneurship Training Program (NO. 202310370050), the University Scientific Research Project of Department of Education of Anhui Province (NO. KJ2021A0089) and the Doctoral Research Initial Project of Anhui Normal University (NO. 2020463).
Data Availability Statement
The tree-ring data are available in the National Centers for Environmental Information (NCEI)—Paleoclimatology Data (https://www.ncei.noaa.gov/maps/paleo/), the instrumental data are obtained in the National Meteorological Information Center of the Chinese Meteorological Administration (https://data.cma.cn/).
Conflicts of Interest
Author Wangke Ding was employed by the company Anhui Pinjie Intelligent Environmental Protection Technology Corporation Limited. The remaining authors declare that the research was conducted in the absence of any commercial or financial relationships that could be construed as a potential conflict of interest.
References
- Piao, S.; Wang, X.; Park, T.; Chen, C.; Lian, X.; He, Y.; Bjerke, J.W.; Chen, A.; Ciais, P.; Tømmervik, H. Characteristics, drivers and feedbacks of global greening. Nat. Rev. Earth Environ. 2020, 1, 14–27. [Google Scholar] [CrossRef]
- Yang, H.; Munson, S.M.; Huntingford, C.; Carvalhais, N.; Knapp, A.K.; Li, X.; Peñuelas, J.; Zscheischler, J.; Chen, A. The detection and attribution of extreme reductions in vegetation growth across the global land surface. Glob. Change Biol. 2023, 29, 2351–2362. [Google Scholar] [CrossRef] [PubMed]
- Gernaat, D.E.; de Boer, H.S.; Daioglou, V.; Yalew, S.G.; Müller, C.; van Vuuren, D.P. Climate change impacts on renewable energy supply. Nat. Clim. Change 2021, 11, 119–125. [Google Scholar] [CrossRef]
- Groenendijk, P.; Sass-Klaassen, U.; Bongers, F.; Zuidema, P.A. Potential of tree-ring analysis in a wet tropical forest: A case study on 22 commercial tree species in Central Africa. For. Ecol. Manag. 2014, 323, 65–78. [Google Scholar] [CrossRef]
- Jiao, W.; Wang, L.; Smith, W.K.; Chang, Q.; Wang, H.; D’Odorico, P. Observed increasing water constraint on vegetation growth over the last three decades. Nat. Commun. 2021, 12, 3777. [Google Scholar] [CrossRef] [PubMed]
- Dong, B.G.; Yu, Y.; Pereira, P. Non-growing season drought legacy effects on vegetation growth in southwestern China. Sci. Total Environ. 2022, 846, 157334. [Google Scholar] [CrossRef] [PubMed]
- Xiao, L.; Wang, J.; Wang, B.; Jiang, H. China’s hydropower resources and development. Sustainability 2023, 15, 3940. [Google Scholar] [CrossRef]
- Fan, Z.X.; Brauning, A.; Yang, B.; Cao, K.F. Tree ring density-based summer temperature reconstruction for the central Hengduan Mountains in southern China. Glob. Planet. Change 2009, 65, 1–11. [Google Scholar] [CrossRef]
- Guo, G.; Li, Z.-S.; Zhang, Q.-B.; Ma, K.-P.; Mu, C. Dendroclimatological studies of Picea likiangensis and Tsuga dumosa in Lijiang, China. IAWA J. 2009, 30, 435–441. [Google Scholar] [CrossRef]
- Shi, S.; Li, J.; Shi, J.; Zhao, Y.; Huang, G. Three centuries of winter temperature change on the southeastern Tibetan Plateau and its relationship with the Atlantic Multidecadal Oscillation. Clim. Dyn. 2017, 49, 1305–1319. [Google Scholar] [CrossRef]
- Fan, Z.-X.; Bräuning, A.; Cao, K.-F. Annual temperature reconstruction in the central Hengduan Mountains, China, as deduced from tree rings. Dendrochronologia 2008, 26, 97–107. [Google Scholar] [CrossRef]
- Li, T.; Li, J. A 564-year annual minimum temperature reconstruction for the east central Tibetan Plateau from tree rings. Glob. Planet. Change 2017, 157, 165–173. [Google Scholar] [CrossRef]
- Jiang, Y.-M.; Li, Z.-S.; Fan, Z.-X. Tree-ring based February–April relative humidity reconstruction since AD 1695 in the Gaoligong Mountains, southeastern Tibetan Plateau. Asian Geogr. 2017, 34, 59–70. [Google Scholar] [CrossRef]
- Yin, D.; Xu, D.; Tian, K.; Xiao, D.; Zhang, W.; Sun, D.; Sun, H.; Zhang, Y. Radial Growth Response of Abies georgei to Climate at the Upper Timberlines in Central Hengduan Mountains, Southwestern China. Forests 2018, 9, 606. [Google Scholar] [CrossRef]
- Li, J.; Li, J.; Li, T.; Au, T.F. Tree growth divergence from winter temperature in the Gongga Mountains, southeastern Tibetan Plateau. Asian Geogr. 2019, 37, 1–15. [Google Scholar] [CrossRef]
- Keyimu, M.; Li, Z.; Zhang, G.; Fan, Z.; Wang, X.; Fu, B. Tree ring–based minimum temperature reconstruction in the central Hengduan Mountains, China. Theor. Appl. Climatol. 2020, 141, 359–370. [Google Scholar] [CrossRef]
- Yuan, S.; Jiang, Y.; Zhao, Z.; Cui, M.; Shi, D.; Wang, S.; Kang, M. Different trends and divergent responses to climate factors in the radial growth of Abies georgei along elevations in the central Hengduan Mountains. Dendrochronologia 2023, 80, 126114. [Google Scholar] [CrossRef]
- Yang, R.-Q.; Zhao, F.; Fan, Z.-X.; Panthi, S.; Fu, P.-L.; Bräuning, A.; Griessinger, J.; Li, Z.-S. Long-term growth trends of Abies delavayi and its physiological responses to a warming climate in the Cangshan Mountains, southwestern China. For. Ecol. Manag. 2022, 505, 119943. [Google Scholar] [CrossRef]
- Fan, Z.-X.; Bräuning, A.; Tian, Q.-H.; Yang, B.; Cao, K.-F. Tree ring recorded May–August temperature variations since AD 1585 in the Gaoligong Mountains, southeastern Tibetan Plateau. Palaeogeogr. Palaeoclimatol. Palaeoecol. 2010, 296, 94–102. [Google Scholar] [CrossRef]
- Bräuning, A. Summer temperature and summer monsoon history on the Tibetan plateau during the last 400 years recorded by tree rings. Geophys. Res. Lett. 2004, 31, L24024. [Google Scholar] [CrossRef]
- Duan, J.; Zhang, Q.B. A 449 year warm season temperature reconstruction in the southeastern Tibetan Plateau and its relation to solar activity. J. Geophys. Res. Atmos. 2014, 119, 11578–11592. [Google Scholar] [CrossRef]
- Li, Z.S.; Liu, G.H.; Gong, L.; Wang, M.; Wang, X.C. Tree ring-based temperature reconstruction over the past 186 years for the Miyaluo Natural Reserve, western Sichuan Province of China. Theor. Appl. Climatol. 2015, 120, 495–506. [Google Scholar] [CrossRef]
- Li, Z.; Liu, G.; Wu, X.; Wang, X. Tree-ring-based temperature reconstruction for the Wolong Natural Reserve, western Sichuan Plateau of China. Int. J. Climatol. 2015, 35, 3296–3307. [Google Scholar] [CrossRef]
- Yue, H.; Li, J.; Xie, S.; Chen, H.; Tian, K.; Sun, M.; Zhang, D.; Zhang, Y. Relationships between Climate Variability and Radial Growth of Larix potaninii at the Upper Altitudinal Limit in Central Hengduan Mountain, Southwestern China. Forests 2023, 14, 1790. [Google Scholar] [CrossRef]
- Zhang, Y.; Cao, R.; Yin, J.; Tian, K.; Xiao, D.; Zhang, W.; Yin, D. Radial growth response of major conifers to climate change on Haba Snow Mountain, Southwestern China. Dendrochronologia 2020, 60, 125682. [Google Scholar] [CrossRef]
- Fan, Z.-X.; Bräuning, A.; Cao, K.-F.; Zhu, S.-D. Growth–climate responses of high-elevation conifers in the central Hengduan Mountains, southwestern China. For. Ecol. Manag. 2009, 258, 306–313. [Google Scholar] [CrossRef]
- Zhang, Y.; Yin, D.; Tian, K.; Zhang, W.; He, R.; He, W.; Sun, J.; Liu, Z. Radial growth responses of Picea likiangensis to climate variabilities at different altitudes in Yulong Snow Mountain, southwest China. Chin. J. Plant Ecol. 2018, 42, 629–639. [Google Scholar]
- Guo, M.-M.; Zhang, Y.-D.; Wang, X.-C.; Liu, S.-R. Difference in responses of major tree species growth to climate in the Miyaluo Mountains, western Sichuan, China. Chin. J. Appl. Ecol. 2015, 26, 2237–2243. [Google Scholar]
- Sun, L.; Cai, Y.; Zhou, Y.; Shi, S.; Zhao, Y.; Gunnarson, B.E.; Jaramillo, F. Radial growth responses to climate of Pinus yunnanensis at low elevations of the Hengduan Mountains, China. Forests 2020, 11, 1066. [Google Scholar] [CrossRef]
- Shen, J.; Li, Z.; Gao, C.; Li, S.; Huang, X.; Lang, X.; Su, J. Radial growth response of Pinus yunnanensis to rising temperature and drought stress on the Yunnan Plateau, southwestern China. For. Ecol. Manag. 2020, 474, 118357. [Google Scholar] [CrossRef]
- Integrated Scientific Expeditional Team to Qinghai-Tibet Plateau, Chinese Academy of Sciences. The Dry Valleys of the Hengduan Mountains Region; Science Press: Beijing, China, 1992. [Google Scholar]
- Guo, Q.K.; Shan, Z.J.; Lu, W.; Qin, W.; Yin, Z.; Xu, H.C. Fingerprinting sediment sources in two typical watersheds in the dry-hot valleys of Southwest China: The role of gully and orchard land. Catena 2023, 233, 107479. [Google Scholar] [CrossRef]
- Grelsson, G. Radial stem growth of coniferous trees near Swedish reservoirs. Regul. Rivers Res. Manag. 1988, 2, 535–545. [Google Scholar] [CrossRef]
- Sun, L.; Jaramillo, F.; Cai, Y.; Zhou, Y.; Shi, S.; Zhao, Y.; Wang, W.; Yang, W.; Yi, Y.; Yang, Z.; et al. Exploring the influence of reservoir impoundment on surrounding tree growth. Adv. Water Resour. 2021, 153, 103946. [Google Scholar] [CrossRef]
- Czyżyk, K. Radial growth response of Scots Pine (Pinus sylvestris L.) after increasing the availability of water resources. Forests 2021, 12, 1053. [Google Scholar] [CrossRef]
- Zhirnova, D.; Belokopytova, L.; Meko, D.; Babushkina, E.; Vaganov, E. Climate change and tree growth in the Khakass-Minusinsk Depression (South Siberia) impacted by large water reservoirs. Sci. Rep. 2021, 11, 14266. [Google Scholar] [CrossRef]
- Tremblay, M.; Begin, Y. The response of black spruce to the climatic influence of Robert-Bourassa Reservoir in northern Quebec. Ecoscience 2000, 7, 228–236. [Google Scholar] [CrossRef]
- Mazza, G.; Becagli, C.; Proietti, R.; Corona, P. Climatic and anthropogenic influence on tree-ring growth in riparian lake forest ecosystems under contrasting disturbance regimes. Agric. For. Meteorol. 2020, 291, 108036. [Google Scholar] [CrossRef]
- Liang, Y.N.; Cai, Y.P.; Wang, X.; Li, C.H.; Liu, Q. Projected climate impacts of large artificial reservoir impoundment in Yalong River Basin of southwestern China. J. Hydrometeorol. 2021, 22, 2179–2191. [Google Scholar] [CrossRef]
- Xu, G.; Liu, X.; Zhang, Q.; Zhang, Q.; Hudson, A.; Trouet, V. Century-scale temperature variability and onset of industrial-era warming in the Eastern Tibetan Plateau. Clim. Dyn. 2019, 53, 4569–4590. [Google Scholar] [CrossRef]
- Xing, Y.; Ree, R.H. Uplift-driven diversification in the Hengduan Mountains, a temperate biodiversity hotspot. Proc. Natl. Acad. Sci. USA 2017, 114, E3444–E3451. [Google Scholar] [CrossRef]
- Zhao, Y.J.; Gong, X. Diversity and conservation of plant species in dry valleys, southwest China. Biodivers. Conserv. 2015, 24, 2611–2623. [Google Scholar] [CrossRef]
- Wang, S.W.; Sui, X.P.; Liu, Y.; Gu, H.; Xu, B.; Xia, Q. Prediction and interpretation of the deformation behaviour of high arch dams based on a measured temperature field. J. Civ. Struct. Health Monit. 2023, 13, 661–675. [Google Scholar] [CrossRef]
- Wu, X.J.; Wang, L.C.; Cao, Q.; Niu, Z.G.; Dai, X. Regional climate change and possible causes over the Three Gorges Reservoir Area. Sci. Total Environ. 2023, 903, 166263. [Google Scholar] [CrossRef] [PubMed]
- Ren, Y.Y.; Xia, L.; Wang, Y.H. Forecasting China’s hydropower generation using a novel seasonal optimized multivariate grey model. Technol. Forecast. Soc. Change 2023, 194, 122677. [Google Scholar] [CrossRef]
- National Energy Administration. The 13th Five-Year Plan for the Development of Hydroelectricity; National Energy Administration: Beijing, China, 2016.
- Ho, M.; Lall, U.; Allaire, M.; Devineni, N.; Kwon, H.H.; Pal, I.; Raff, D.; Wegner, D. The future role of dams in the United States of America. Water Resour. Res. 2017, 53, 982–998. [Google Scholar] [CrossRef]
- Tang, G.; Qi, C. Dedrochronology (South China Version), 3rd ed.; China Forestry Publishing House: Beijing, China, 2015. [Google Scholar]
- Wigley, T.M.L.; Briffa, K.R.; Jones, P.D. On the average value of correlated time-series, with applications in dendroclimatology and hydrometeorology. J. Clim. Appl. Meteorol. 1984, 23, 201–213. [Google Scholar] [CrossRef]
- Sun, L.; Cai, Y.; Yang, W.; Yi, Y.; Yang, Z. Climatic variations within the dry valleys in southwestern China and the influences of artificial reservoirs. Clim. Change 2019, 155, 111–125. [Google Scholar] [CrossRef]
- Zhang, M.; He, J.; Wang, B.; Wang, S.; Li, S.; Liu, W.; Ma, X. Extreme drought changes in Southwest China from 1960 to 2009. J. Geogr. Sci. 2013, 23, 3–16. [Google Scholar] [CrossRef]
- Zong, H.; Sun, J.-R.; Zhou, L.; Bao, F.; Zheng, X.-Z. Effect of altitude and climatic parameters on shrub-meadow community composition and diversity in the dry valley region of the eastern Hengduan Mountains, China. J. Mt. Sci. 2022, 19, 1139–1155. [Google Scholar] [CrossRef]
- Yin, D.C.; Gou, X.H.; Yang, H.J.; Wang, K.; Liu, J.; Zhang, Y.R.; Gao, L.L. Elevation-dependent tree growth response to recent warming and drought on eastern Tibetan Plateau. Clim. Change 2023, 176, 77. [Google Scholar] [CrossRef]
Figure 1.
Location of the tree-ring sites, hydropower stations, dry valleys, and meteorological stations. The tree-ring sites for comparison denote tree-ring width sites established by others from NCEI (https://www.ncei.noaa.gov/maps/paleo/ (accessed on 10 March 2024)). Here, we only show the hydropower stations on rivers Lancang, Jinsha, Yalong, and Dadu. Numbers 1–4 represent the meteorological stations Miyi, Huaping, Nanjian, and Jingdong. Panels (b–d) zoom in the details around reservoirs Ertan, Longkiakou, and Manwan in panel (a). The locations of the dry valleys were referred to the Integrated Scientific Expeditional Team to the Qinghai–Tibet Plateau [31].
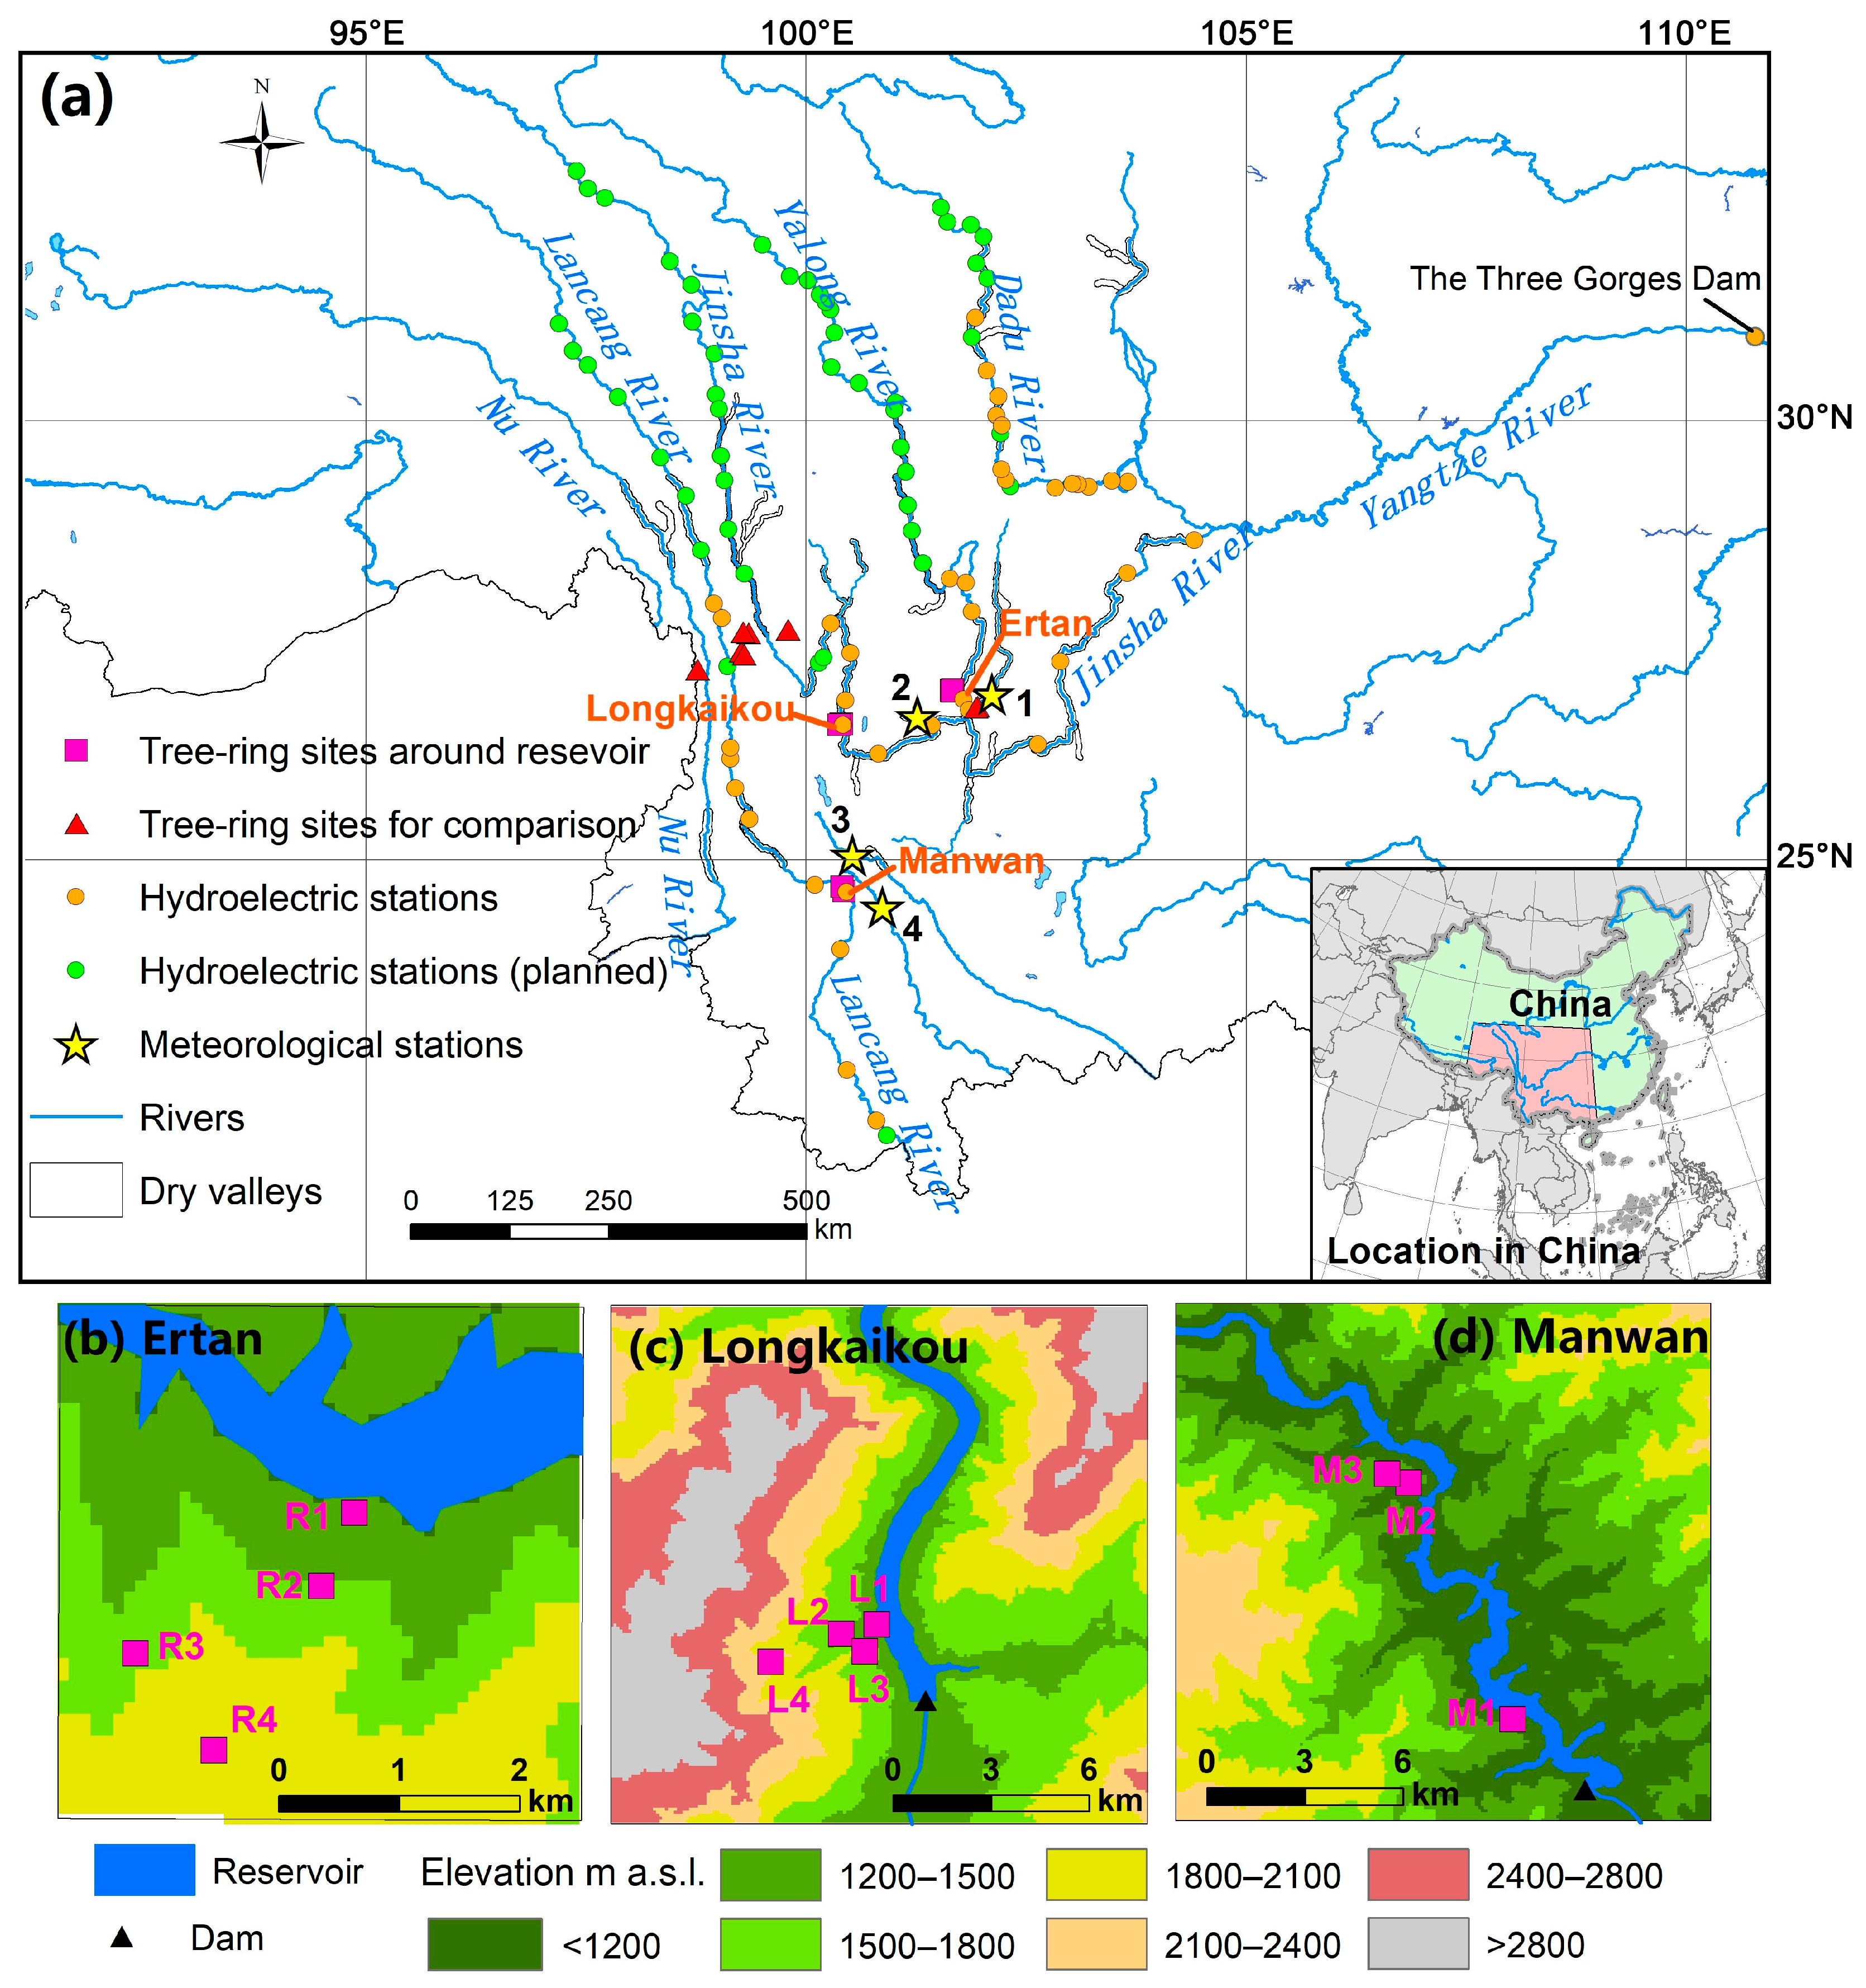
Figure 2.
Tree-ring width index (TWI) for sampling sites near reservoirs. Here, we show the period when all TWIs met EPS > 0.7, i.e., the years of 1986–2017. Sites M1–M3, or the three dashed lines, were on a slope near Manwan reservoir, sites R1–R4, or the three solid lines, were on a slope near Ertan reservoir, sites L1–L4, or the double lines, were on a slope near Longkaikou reservoir. The blue, brown, orange, and green lines indicate that the sites were the lowest, relatively low, relatively high, and the highest ones in terms of elevations in the slopes. The three vertical red lines denote the impounding time of reservoirs.
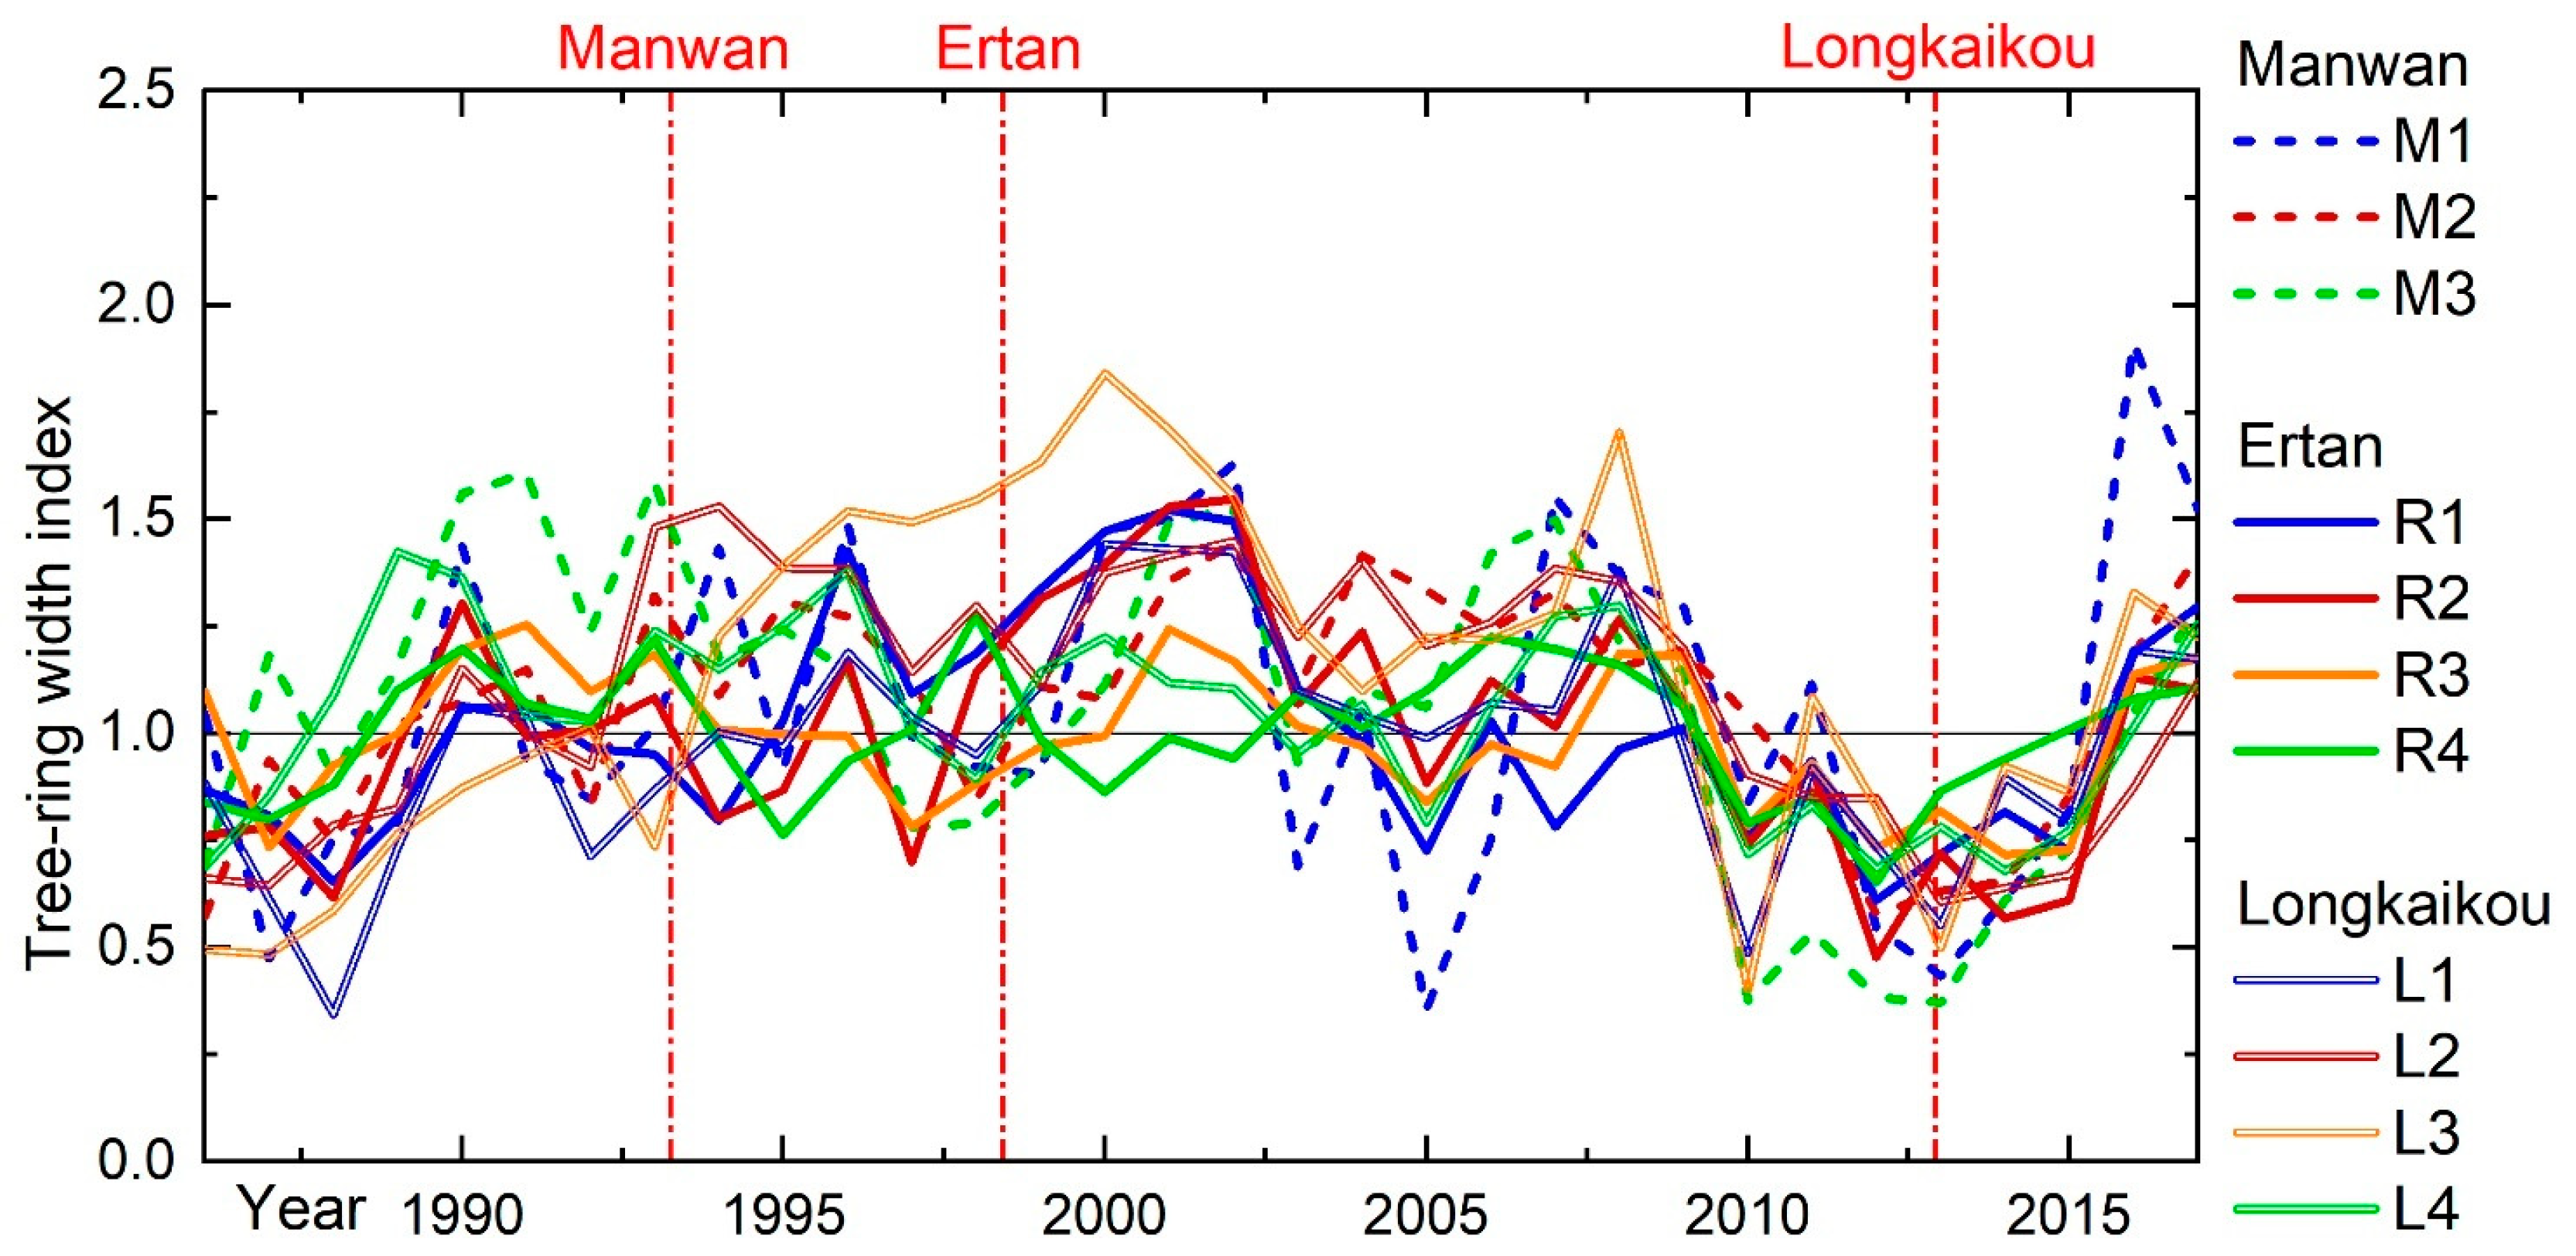
Figure 3.
Correlation coefficients between TWI chronologies. The green, blue, and red fonts represent significance levels of 0.05, 0.01, and 0.001, respectively.
Figure 3.
Correlation coefficients between TWI chronologies. The green, blue, and red fonts represent significance levels of 0.05, 0.01, and 0.001, respectively.

Figure 4.
The correlation coefficients between TWI chronology and climate data. Here, the results by the meteorological station Nanjian are shown, and results by other stations can be seen in the Supplementary Materials. The horizontal and vertical labels in each panels mean the tree-ring sites and months, respectively. “p”, “c”, “wet”, and “dry” refer to previous year, current year, wet season, and dry season, respectively. (a−d) indicate that the tree-ring chronology was correlated with precipitation amount, mean air temperature, relative humidity, and SPEI with timescale of 6 months, respectively. The green, blue, and red frames represent significance levels of 0.05, 0.01, and 0.001, respectively.

Figure 5.
Clusters for TWI chronologies. A color represents a cluster. Chronologies at the high-elevation areas are denoted as “CHIN”. (a) Three clusters for chronologies in the valleys, (b) two clusters for chronologies in valleys and high-elevation areas.
Figure 5.
Clusters for TWI chronologies. A color represents a cluster. Chronologies at the high-elevation areas are denoted as “CHIN”. (a) Three clusters for chronologies in the valleys, (b) two clusters for chronologies in valleys and high-elevation areas.


Table 1.
Information regarding the tree-ring sampling sites and tree-ring width. The slope position refers to the site located from the foot slope (0%) to the ridge (100%) of a slope. The two distances denote the vertical and horizontal distance to the reservoir, respectively.
Table 1.
Information regarding the tree-ring sampling sites and tree-ring width. The slope position refers to the site located from the foot slope (0%) to the ridge (100%) of a slope. The two distances denote the vertical and horizontal distance to the reservoir, respectively.
| M1 | M2 | M3 | R1 | R2 | R3 | R4 | L1 | L2 | L3 | L4 | |
|---|---|---|---|---|---|---|---|---|---|---|---|
| Elevation (m a.s.l.) | 1172 | 1232 | 1290 | 1256 | 1502 | 1725 | 2036 | 1350 | 1500 | 1700 | 2200 |
| Slope (°) | 18 | 10 | 20 | 31 | 38 | 41 | 5 | 22 | 10 | 8 | 8 |
| Aspect | NE | SW | N | N | N | NE | N | E | E | E | E |
| Slope position (%) | 12 | 15 | 19 | 6 | 30 | 52 | 83 | 3 | 12 | 24 | 54 |
| Vertical distance (m) | 178 | 238 | 296 | 56 | 302 | 525 | 836 | 52 | 202 | 402 | 902 |
| Horizontal distance (m) | 362 | 692 | 1010 | 161 | 674 | 1900 | 2210 | 120 | 494 | 783 | 3911 |
| Nr. of detrended trees | 15 | 13 | 10 | 14 | 15 | 12 | 15 | 18 | 13 | 18 | 12 |
| Average sensitivity | 0.446 | 0.33 | 0.369 | 0.288 | 0.324 | 0.258 | 0.269 | 0.38 | 0.505 | 0.36 | 0.375 |
| Master correlation | 0.658 | 0.494 | 0.682 | 0.481 | 0.659 | 0.63 | 0.510 | 0.501 | 0.358 | 0.449 | 0.527 |
| Time span | 1984–2020 | 1983–2020 | 1967–2020 | 1956–2021 | 1976–2021 | 1942–2021 | 1970–2017 | 1958–2017 | 1940–2017 | 1945–2017 | 1944–2017 |
| Time span of EPS > 0.70 | 1986–2020 | 1986–2020 | 1982–2020 | 1960–2021 | 1976–2021 | 1955–2021 | 1980–2017 | 1964–2017 | 1983–2017 | 1951–2017 | 1950–2017 |
Table 2.
Information for the hydroelectric reservoirs.
| Normal Water Level (m) | Total Storage (108 m3) | Water Area (km2) | Dam Height (m) | Installed Capacity (104 kW) | Annual Flow (m3/s) | Impounding Time | Name of Impounded River | |
|---|---|---|---|---|---|---|---|---|
| Manwan | 994 | 10.6 | 24 | 132 | 155 | 1230 | March 1993 | Lancang |
| Ertan | 1200 | 58.0 | 101 | 240 | 330 | 1670 | May 1998 | Yalong |
| Longkaikou | 1298 | 5.1 | 20 | 116 | 180 | 1780 | November 2012 | Jinsha |
Table 3.
Results of the paired t-test for the change in the Euclidean distance of TWI between pre- and post-impounding of reservoir. Experimental reservoir means that the impoundment occurred during selected time span, and reference reservoir represents no impounding occurred during the same time span. “Sites at low positions” represent the relatively low sites (M2, R2, L2) and the lowest sites (M1, R1, L1). * Denotes the value is less than 0.05.
| Experimental Reservoir | Reference Reservoir | All Sites Engaged | Sites at Low Positions Engaged | ||||
|---|---|---|---|---|---|---|---|
| t Statistic | DF | Prob > |t| | t Statistic | DF | Prob > |t| | ||
| Manwan | Ertan | −1.08 | 11 | 0.30 | −0.48 | 3 | 0.67 |
| Longkaikou | −1.86 | 11 | 0.09 | −3.03 | 3 | 0.06 | |
| Ertan | Manwan | −0.39 | 11 | 0.70 | −2.69 | 3 | 0.07 |
| Longkaikou | 1.38 | 11 | 0.19 | 2.26 | 3 | 0.11 | |
| Longkaikou | Manwan | −1.04 | 11 | 0.32 | −1.90 | 3 | 0.15 |
| Ertan | −2.65 | 11 | 0.02 * | −4.54 | 3 | 0.02 * | |
Table 4.
P-values of the difference tests for filtered chronologies between pre- and post-impounding of reservoir. * Denotes the value is less than 0.05.
Table 4.
P-values of the difference tests for filtered chronologies between pre- and post-impounding of reservoir. * Denotes the value is less than 0.05.
| Filtered Chronology | Variance Test for Chronology Filtered by | Mean Value Test for Chronology Filtered by | ||||
|---|---|---|---|---|---|---|
| C1 | C2 | R4 | C1 | C2 | R4 | |
| M1 | 0.86 | 0.81 | 0.14 | 0.24 | 0.62 | 0.17 |
| M2 | 0.02 * | 0.45 | 0.24 | 0.05 * | 0.49 | 0.02 * |
| M3 | 0.53 | 0.10 | 0.52 | 0.39 | 0.71 | 0.12 |
| R1 | 0.07 | 0.33 | 0.28 | 0.97 | 0.56 | 0.52 |
| R2 | 0.47 | 0.60 | 0.03 * | 0.90 | 0.44 | 0.17 |
| R3 | 0.10 | 0.34 | 0.75 | 0.16 | 0.29 | 0.67 |
| R4 | 0.57 | 0.78 | \ | 0.45 | 0.79 | \ |
| L1 | 0.73 | 0.13 | 0.46 | 0.29 | 0.86 | 0.55 |
| L2 | 0.87 | 0.17 | 0.29 | 0.02 * | 0.21 | 0.00 * |
| L3 | 0.33 | 0.83 | 0.32 | 0.28 | 0.94 | 0.21 |
| L4 | 0.47 | 0.21 | 0.74 | 0.13 | 0.81 | 0.10 |
Disclaimer/Publisher’s Note: The statements, opinions and data contained in all publications are solely those of the individual author(s) and contributor(s) and not of MDPI and/or the editor(s). MDPI and/or the editor(s) disclaim responsibility for any injury to people or property resulting from any ideas, methods, instructions or products referred to in the content. |
© 2024 by the authors. Licensee MDPI, Basel, Switzerland. This article is an open access article distributed under the terms and conditions of the Creative Commons Attribution (CC BY) license (https://creativecommons.org/licenses/by/4.0/).
Share and Cite
MDPI and ACS Style
Sun, L.; Ding, W.; Zhou, Y.; Wang, J.; Ouyang, X.; Fan, Z.; Yao, Y.; Zhang, C. Tree Radial Growth Responses to Climate and Reservoir Impoundment in Valleys in Southwestern China. Forests 2024, 15, 749. https://doi.org/10.3390/f15050749
AMA Style
Sun L, Ding W, Zhou Y, Wang J, Ouyang X, Fan Z, Yao Y, Zhang C. Tree Radial Growth Responses to Climate and Reservoir Impoundment in Valleys in Southwestern China. Forests. 2024; 15(5):749. https://doi.org/10.3390/f15050749
Chicago/Turabian StyleSun, Lian, Wangke Ding, Yang Zhou, Jiejun Wang, Xingyue Ouyang, Zijun Fan, Youru Yao, and Chonghong Zhang. 2024. "Tree Radial Growth Responses to Climate and Reservoir Impoundment in Valleys in Southwestern China" Forests 15, no. 5: 749. https://doi.org/10.3390/f15050749
Note that from the first issue of 2016, this journal uses article numbers instead of page numbers. See further details here.