
The Genetic Diversity of Natural Ilex chinensis Sims (Aquifoliaceae) Populations as Revealed by SSR Markers


1
Co-Innovation Center for Sustainable Forestry in Southern China, Key Laboratory of State Forestry and Grassland Administration on Subtropical Forest Biodiversity Conservation, College of Life Sciences, Nanjing Forestry University, 159 Longpan Road, Nanjing 210037, China
2
Jiangsu Academy of Forestry, 109 Danyang Road, DongShanqiao, Nanjing 211153, China
*
Authors to whom correspondence should be addressed.
†
These authors contributed equally to this work.
Forests 2024, 15(5), 763; https://doi.org/10.3390/f15050763
Submission received: 22 March 2024
/
Revised: 19 April 2024
/
Accepted: 23 April 2024
/
Published: 26 April 2024
(This article belongs to the Section Genetics and Molecular Biology)
Abstract
:Ilex chinensis Sims. is an evergreen tree species native to China and mainly distributed in the region south of the Qinling Mountains and the Huai River. This species has important ornamental, medicinal, ecological, and economic values, and plays a positive role in improving the environment and people’s lives. To reveal the genetic diversity and genetic structure of 401 individuals from 14 populations in the major distribution area of I. chinensis, 11 pairs of SSR primers were selected for PCR amplification. The products were then subjected to capillary electrophoresis, and the genetic diversity of Ilex individuals was analyzed using relevant software. The results showed that the genetic diversity of I. chinensis was at a moderate-to-high level. A total of 54 alleles were detected at 11 SSR loci in the 14 Ilex populations, with an average of 4.831 alleles per locus. AMOVA analysis indicated that the genetic variation of I. chinensis populations mainly originated within populations. A STRUCTURE analysis divided the 401 I. chinensis individuals into four different genetic clusters. The unweighted pair group methods using arithmetic averages (UPGMA) clustering based on Nei’s genetic distance revealed that the population from Xinping of Yuxi, Yunnan Province (XP), and the population from Longan of Qianxinan, Guizhou Province (LoA) were located in the outermost layer of the phylogenetic tree, indicating the furthest genetic relationship between these two population and other populations. The remaining populations could be roughly divided into two groups. Principal coordinate analysis (PCoA) demonstrated that the 401 individuals were clearly divided into three groups, which was consistent with the results of the STRUCTURE analysis and UPGMA clustering. This study identified the hotspots of genetic diversity of I. chinensis, as well as units for the conservation of individuals. It also revealed the patterns of genetic variation and population distribution of I. chinensis in different regions, providing a molecular basis for the geographical zoning and formulation of breeding programs for I. chinensis, as well as germplasm resource management.
1. Introduction
Ilex, a genus in the monogeneric Aquifoliaceae, is unique phylogenetically and biogeographically. Due to its remarkable morphological diversity and phenotypic plasticity [1,2], this genus accommodates a vast number of species with inconsistent numbers by different authors, e.g., ≈400 spp. [3,4], ≈600 spp. [5], and >664 spp. [6]. As a cosmopolitan genus, Ilex widely occurs in Asia, Oceania, Africa, Europe, the Canaries and Azores, North America, and South America, with an origin center in subtropical Asia [6] and modern diversification centers in East Asia and South America [7].
The role of Ilex for forest-community assembly and biodiversity maintenance is markedly significant in tropical and subtropical regions, as Ilex species are locally diverse in evergreen broadleaf forests. For instance, there are 14 and 12 species of hollies in the subtropical evergreen broadleaf forests of Mt. Wuyi and Mt. Huangshan in Eastern China, and four species (I. chinensis Sims., I. wilsonii Loes., I. editicostata Hu & Tang and I. suaveolens (H. Lév.) Loes.) are common in the latter [8,9]. On Mt. Wuyi, I. elmerrilliana S. Y. Hu is a dominant species, with an important value of 2.64% [10]. Ilex species may exhibit different life forms. In a mid-montane mixed forest on Mt. Emei in Western China, deciduous I. micrococca var. pilosa appears in the canopy layer, while evergreen I. fargesii Franch. and I. rockii S. Y. Hu appear in the small tree layer and the ground layer, respectively [11]. For the Azores archipelago, with a temperate climate, I. azorica Gand. is commonly found dominant in natural forests [12].
In terms of utilization, holly seems to be versatile, with the most well-known being the source of beverages. In Chinese tea beverages, kudingcha (bitter spike tea) from holly leaves is very unique, and it is different from the tea from Camellia leaves. The leaf material of kudingcha was reported from several Ilex species, such as I. latifolia Thunb., I. kaushue S. Y. Hu (I. kudingcha), I. cornuta Lindl. & Paxton, and I. pentagona S. K. Chen, Y. X. Feng & C. F. Liang [13]. I. paraguariensis A.St.-Hil. and I. guayusa Loes. from South America are sources of beverages due to their rich purine alkaloids (mostly caffeine, secondarily theobromine and theophylline) in leaves [14], and these beverages are called yerba maté and guayusa, respectively. Furthermore, hundreds of compounds have been identified from Chinese Ilex species, with the most common being triterpenoids, triterpenoid saponins, flavonoids, sterols, polyphenols, and other compounds [15]. Thus, the Ilex species has multiple health benefits and potential for drug development [16,17]. In addition, Ilex species are excellent ornamental and honey plants [18,19].
Great attention has been paid to the species richness, geographical diversity, ecological importance, and unique utilization of Ilex species. Therefore, a number of biological investigations have been focused on taxonomic, phylogenetic, and genomic studies. On taxonomy, new taxa continue to be discovered [20,21,22]. In terms of phylogeny, DNA molecular evidence has been widely used to reveal evolutionary relationships between species. A series of regional and global studies have been reported [1,4,5,6,7,23,24]. As for genome studies, currently, only a small number of reports focus on the whole genome [25,26] and mitochondria genome [27]. More reports are focused on chloroplast genomes [28,29,30]. Intraspecific microevolution, however, has not received sufficient attention yet. The reports on genetic diversity and genetic structure are limited to a few species, such as I. paraguariensis [12,31,32,33,34], I. guayusa [35], and I. crenata Thunb. [36]. Although molecular markers have developed for I. leucoclada (Maximowicz) Makino [37] and I. chinensis [38], there is no evaluation of genetic variation. For some species, genetic diversity has been reported; however, the markers used are not codominant [39]. In addition, in Europe, there is a report on a chloroplast haplotype analysis of the English holly species (I. aquifolium Marshall) [40].
In summary, investigations into the genetic variation of Ilex tend to focus on the super-specific level (mostly based on small samples for a species) and neglect the intra-specific level (based on populations). For a given holly species, an in-depth understanding of the patterns of genetic variation among populations and geographical regions, as well as the driving factors that contribute to it, is still lacking. This situation is not informative to the establishment of the species concept for hollies. Because a phenomenon of hybridization and introgression seems to occur in some hollies [41,42,43], this results in blurred species boundaries. On the other hand, insufficient information on genetic variation at the population level limited the practice in the collection, preservation, and utilization of Ilex species germplasm resources.
As an evergreen tree species, I. chinensis is native to China and mainly occurs in the area south of the Qinling Mountains and Huai River, usually found in evergreen broad-leaved forests and forest edges on mountain slopes at an altitude of 500–1000 m. In addition to China, it has also been extensively cultivated and introduced to other regions around the world, such as Japan, South Korea, Vietnam, Malaysia, and others. This species has significant ornamental, medicinal, ecological, and economic value, and plays a positive role in environmental improvement and people’s lives. There is only one report on the development of molecular markers for genetic variation for I. chinensis, and it lacks a systematic analysis of genetic diversity. As a widely distributed and evergreen tree species, it is an ideal material for the exploration of genetic variation of Ilex species. The aim of this study is to (i) explore natural populations of I. chinensis, (ii) analyze intraspecific genetic diversity using microsatellite markers, (iii) reveal the distribution patterns of genetic variation between populations and regions, and (iv) infer potential environmental factors contributing to genetic variation patterns.
2. Materials and Methods
2.1. Population Sampling
From August 2022 to April 2023, 401 individuals were sampled from 14 natural populations of I. chinensis in China (Figure S1). In each population, 10–15 fresh leaves per tree were collected from 20–30 adult individuals. In order to avoid collecting individuals with the same genetic background, the distance between adjacent individuals in the same population should not be less than 30 m. For smaller populations, all individuals were collected. Leaf tissues were quickly dried using silica gel and stored at room temperature in the laboratory. The geographical locations and altitudes of the sampled populations were recorded using the Biotracks app (Table S1).
2.2. DNA Extraction and Microsatellite Genotyping
DNA extraction was performed using the Rapid Plant Genome DNA Extraction System (DP321) Kit (Tiangen, Beijing, China). The concentration and purity of the extracted DNA were measured by a NanoReady Micro UV-Vis spectrophotometer (Life Real, Hangzhou, China), and the DNA was diluted to an appropriate concentration with TE buffer. For the qualification of the DNA sample, 0.8% agarose gel electrophoresis was conducted, and the qualified samples were stored in the refrigerator at −20 °C.
Based on the transcriptome sequencing results of Ilex × altaclerensis ‘Belgica Aurea’ [44], 80 SSR loci primers were picked and synthesized by the General Biol company (Chuzhou, China), and 11 SSR loci primers suitable for I. chinensis were selected from the 80 SSR primers to study the genetic diversity of the I. chinensis genotypes (Table S2).
The 5′ ends of the forward sequences of the screened polymorphic primers were fluorescently modified (FAM, HEX, TAMRA, or ROX). All samples were amplified using fluorescence-modified forward primers and normal reverse primers, and polymerase chain reactions (PCRs) were performed with 2×Taq PCR MasterMix (Tiangen, Beijing, China) with an amplification system of 20 μL. The PCR protocol was designed as 35 cycles of initial denaturation at 94 °C for 4 min, followed by an extension of 35 s at 94 °C, appropriate annealing temperature for 35 s, extension at 72 °C for 45 s, and ending with a final extension at 72 °C for 5 min. PCR amplification products of different lengths and different fluorescent markers were mixed for genotyping by a high-throughput genetic analyzer (ABI3730, Applied Biosystems, Waltham, MA, USA).
2.3. Data Analysis
Sequencing results from capillary electrophoresis were imported into GeneMarker 2.2 software (SoftGenetics, State College, PA, USA), and parameters such as length intervals of molecular internal standards and target fragments were set to read the band length data of microsatellite primer amplification products.
The number of observed alleles (Na), the number of effective alleles (Ne), the Shannon information index (I), the observed heterozygosity (Ho), the expected heterozygosity (He), the genetic differentiation index (Fst), gene flow (Nm), analysis of molecular variance (AMOVA), and principal coordinate analysis (PCoA) were determined using GenAlEx 6.503 software [45]. The polymorphism information content (PIC) was determined using PowerMarker software (version V3.25) [46]. Based on Nei’s standard genetic distance, MEGA7 software was used to perform a systematic clustering analysis on the populations [47]. A Bayesian clustering analysis in STRUCTURE 2.3.4 software was used to analyze populations’ genetic structure and estimate individual ancestry [48]. The map was drawn using ArcGIS 10.8.2 software [49].
3. Results
3.1. Genetic Diversity at the Species Level
A total of 54 alleles were detected at 11 SSR loci in 14 I. chinensis populations, with an average of 4.831 alleles per SSR locus (Figure 1). Na per locus ranged from 2.000 (Ilex-SSR-32) to 10.786 (Ilex-SSR-75). Ne was an indicator reflecting the size of genetic variation within a population. The closer this value was to the detected Na, the more evenly distributed the alleles were in the population. The mean Ne in this study was 2.573, which significantly differed from the mean Na. It suggested that the distribution of alleles in I. chinensis populations overall was not uniform enough.
Ho ranged from 0.037 (Ilex-SSR-32) to 0.796 (Ilex-SSR-75), with a mean of 0.440. He ranged from 0.09 (Ilex-SSR-32) to 0.822 (Ilex-SSR-75), with a mean of 0.488. In plant-based studies, when He was around 0.61 ± 0.21, it indicated that the genetic diversity of the species was at a moderate to high level. Therefore, it could be seen that the I. chinensis population had a relatively high genetic diversity. Similarly, Shannon’s information index (I) ranged from 0.181 (Ilex-SSR-32) to 1.991 (Ilex-SSR-75), with a mean of 0.977, indicating a relatively high level of genetic diversity in I. chinensis at the species level.
In this study, all values of F obtained were positive, suggesting that homozygotes were dominant in the population. For I. chinensis, Fis ranged from 0.008 (Ilex-SSR-01) to 0.590 (Ilex-SSR-32), with a mean of 0.163, indicating the possibility of inbreeding within local populations, but at a relatively low frequency. On the other hand, Fit ranged from 0.123 (Ilex-SSR-75) to 0.795 (Ilex-SSR-32), with a mean of 0.333, indicating a relatively low overall frequency of inbreeding within the entire population. These results were consistent with the characteristics of I. chinensis as an entomophilous plant with long pollen-dispersal distances, weak self-compatibility, and predominantly single-plant distribution, which may have resulted in a relatively distant genetic relationship between parents.
According to Table 1, it can be seen that among the 11 microsatellite loci selected, only Ilex-SSR-32, Ilex-SSR-34, and Ilex-SSR-41 exhibited moderate-to-low polymorphism, while all other loci were highly polymorphic. The average PIC for each locus was 0.587, ranging from 0.176 (Ilex-SSR-32) to 0.911 (Ilex-SSR-75). This indicated that the microsatellite loci selected in this study had an overall high polymorphism.
3.2. Genetic Diversity at the Population Level
The genetic diversity indices for 14 natural populations of I. chinensis are shown in Table 2. The range of Na was between 3.636 and 6.182, with an average of 4.831. Ne ranged from 2.198 to 2.939, with an average of 2.573. The range of Shannon’s information index was between 0.829 and 1.198, with an average of 0.927. Ho ranged from 0.365 to 0.535, with an average of 0.440. The minimum value was for the WS population, and the maximum was for the LiA population. He ranged from 0.402 to 0.595, with an average of 0.488. The minimum value was for the JS population, and the maximum was for the JR population.
Among the 14 populations of I. chinensis, the He values of five populations were greater than 0.5, indicating that these populations had relatively rich genetic diversity. The Ho value of the LY population was greater than the He, indicating a low level of homozygote excess in this population. In the remaining 13 populations, Ho values were all smaller than He, indicating an excess of heterozygotes in these populations. Based on these comprehensive genetic diversity indices, the JR population had the highest genetic diversity, while the JS population had the lowest genetic diversity.
From a geographical perspective, there were some differences in the genetic diversity of the I. chinensis populations in the southeastern region, central region, and southwestern region of China. In particular, He for the southeastern region was 0.515, the central region was 0.483, and the western region was 0.461. Therefore, the overall genetic diversity of I. chinensis in the southeastern region of China was slightly higher than that in the central and southwestern regions of China.
3.3. Genetic Variation and Genetic Structure
The F-statistic (Fst) was 0.185 (Table 3), which fell within the range of 0.15 to 0.25. It indicated that there was a high level of genetic differentiation among the I. chinensis populations, suggesting that there were substantial differences between them. This might be due to the relatively low average gene flow between populations (Nm = 0.870, Table 1). An AMOVA analysis of 14 different I. chinensis populations indicated that 18.5% of the genetic variation was found among populations, while 81.5% was found within populations (Table 3). This suggested that there was a high level of genetic variation within individual populations and that the main source of genetic variation in I. chinensis came from within-population processes.
In order to analyze the genetic structure of I. chinensis populations, a Bayesian clustering model was used to analyze the ancestral relationships among these populations. The results of the ΔK analysis showed that the maximum value of ΔK was reached when K = 4 (Figure 2). The clustering result for K = 4 is shown in Figure 3, with four different colors (green, blue, yellow, and red) representing four genetic clusters named qI~qIV (Table S3), respectively. According to the geographical distribution map of the genetic structure of I. chinensis populations (Figure 4), most of the genetic information of populations WZ, LY, JR, and LiA in the southeast came from the same ancestral population. Similarly, populations located in the central region and some parts of the southwest also shared most of their genetic information from the same ancestral population. The populations JZ, LiA, and WYS, located in the Qinling Mountains, Dabie Mountains, and Wuyi Mountains, respectively, showed obvious gene introgression. In contrast, the XP and LoA populations in the southwest may have had less gene flow due to their higher altitudes, which led to a greater genetic distance from other populations.
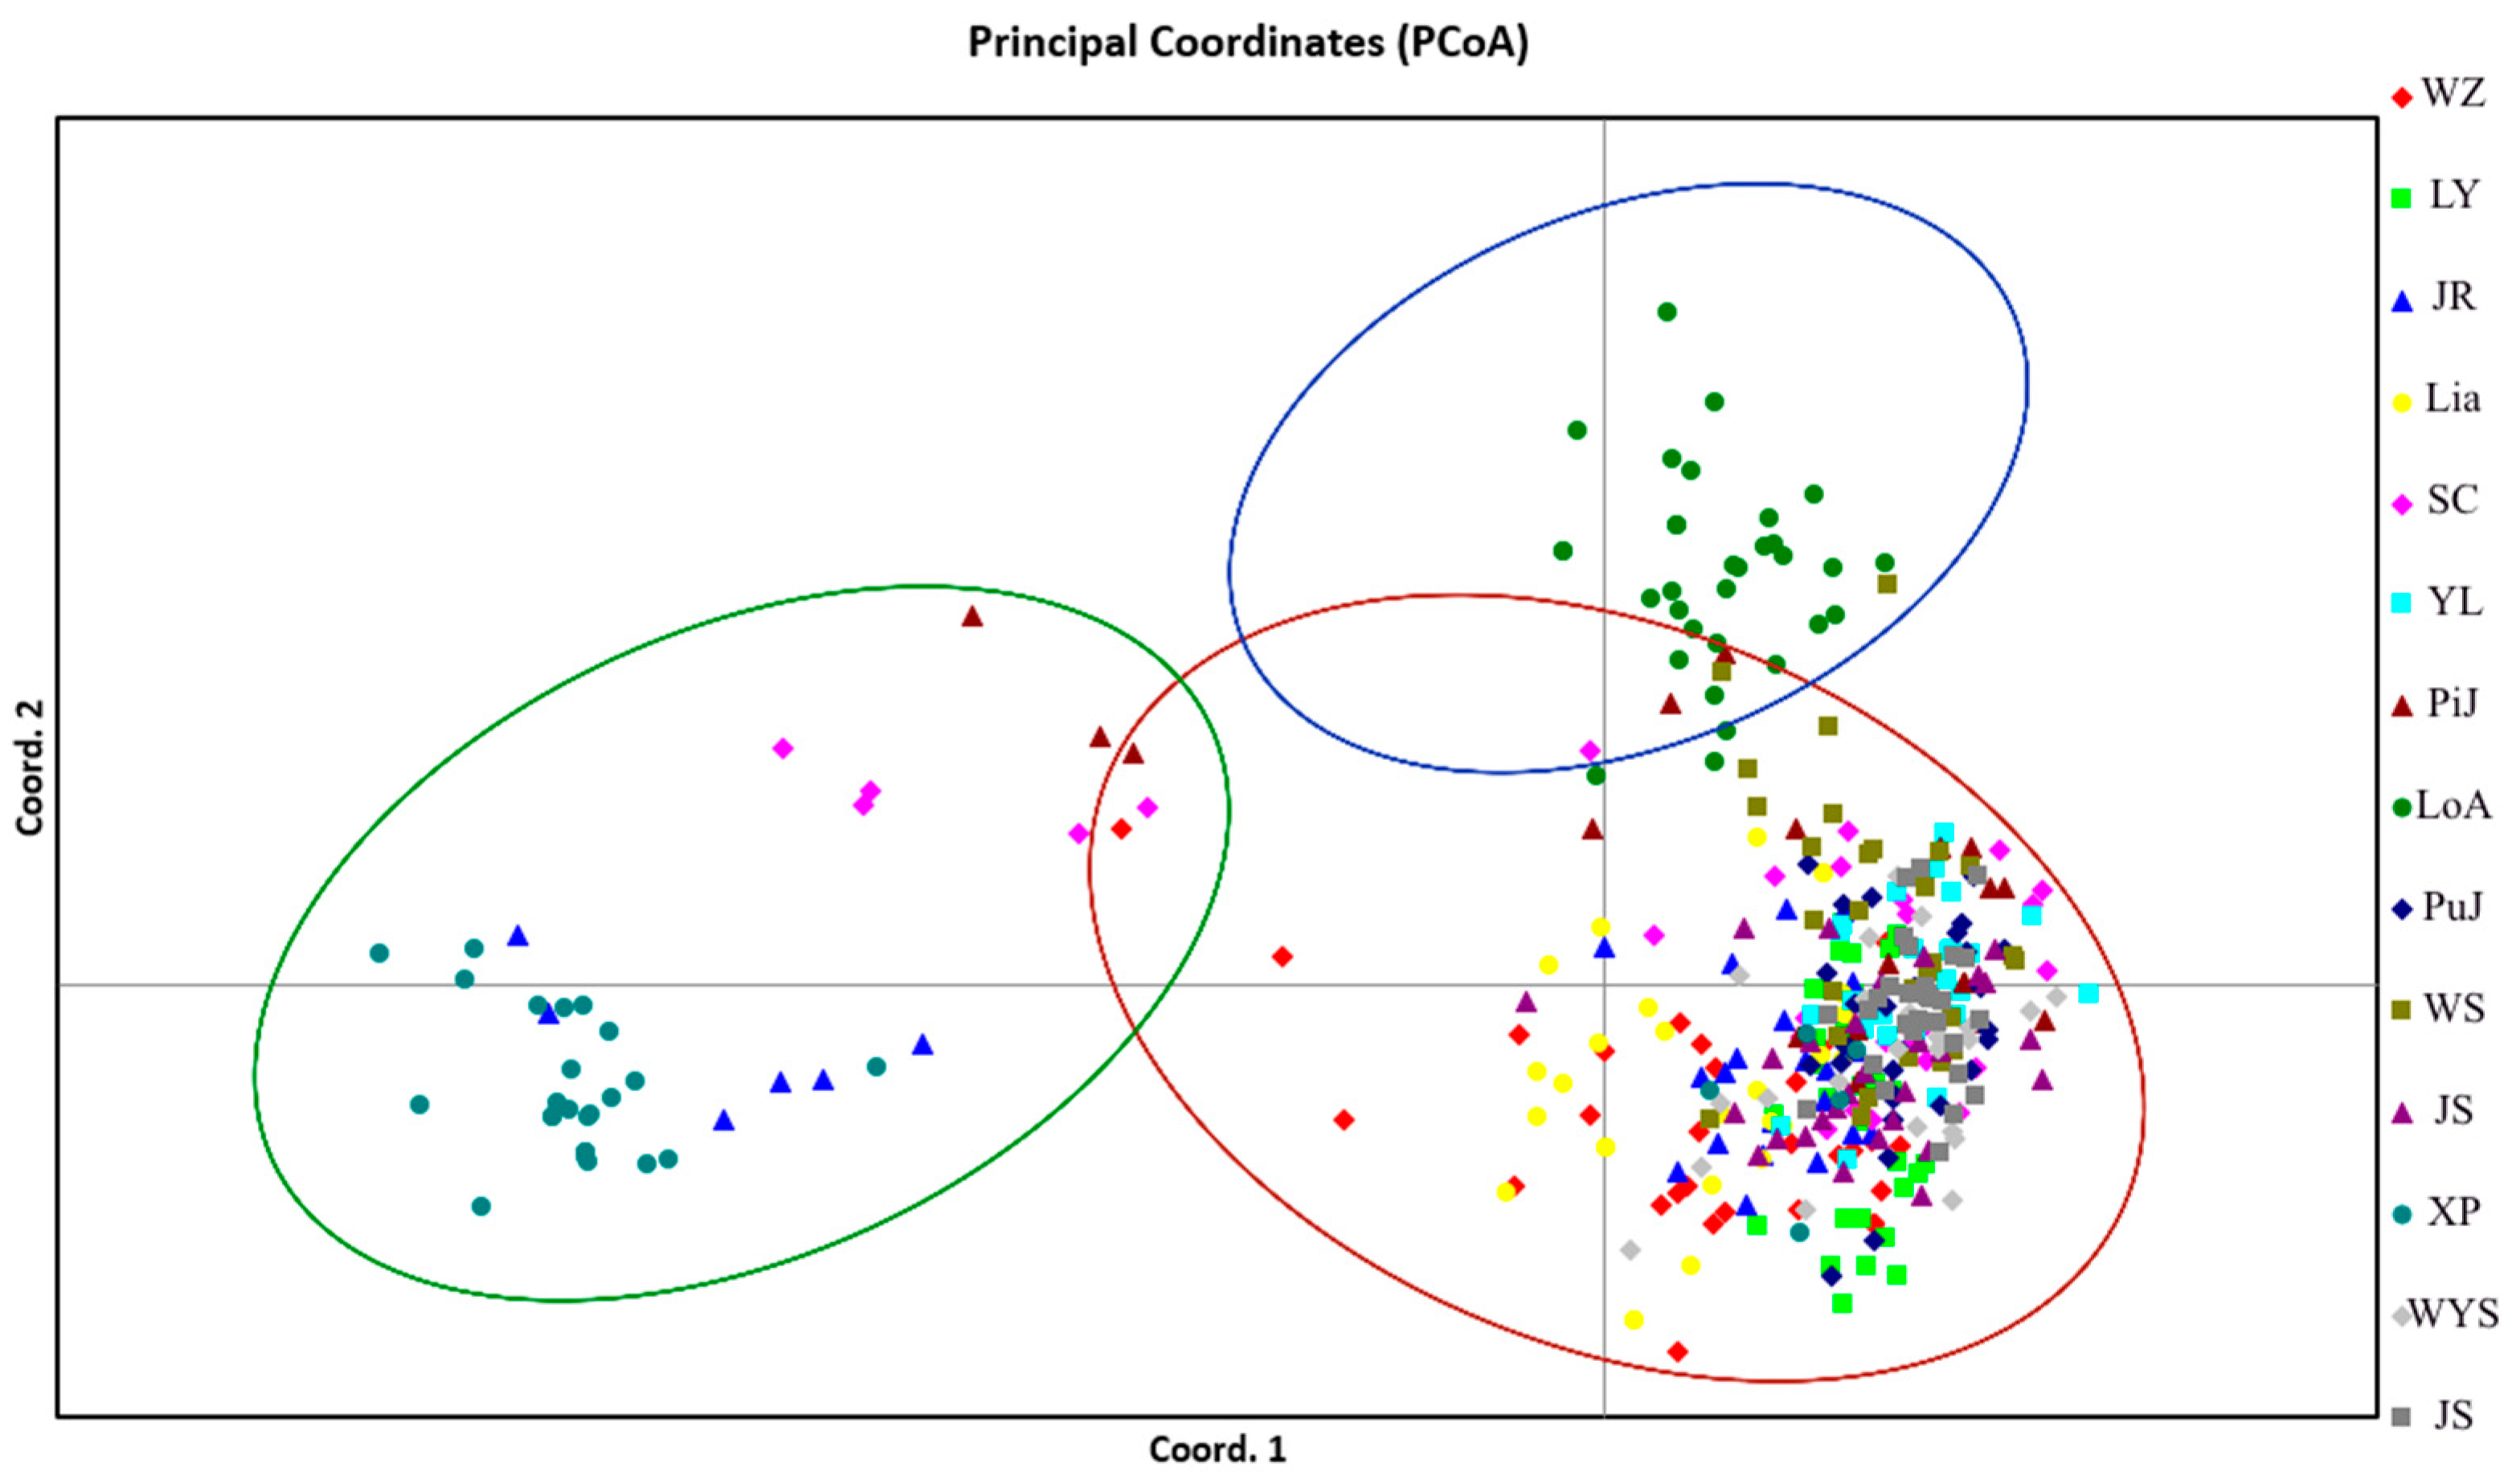
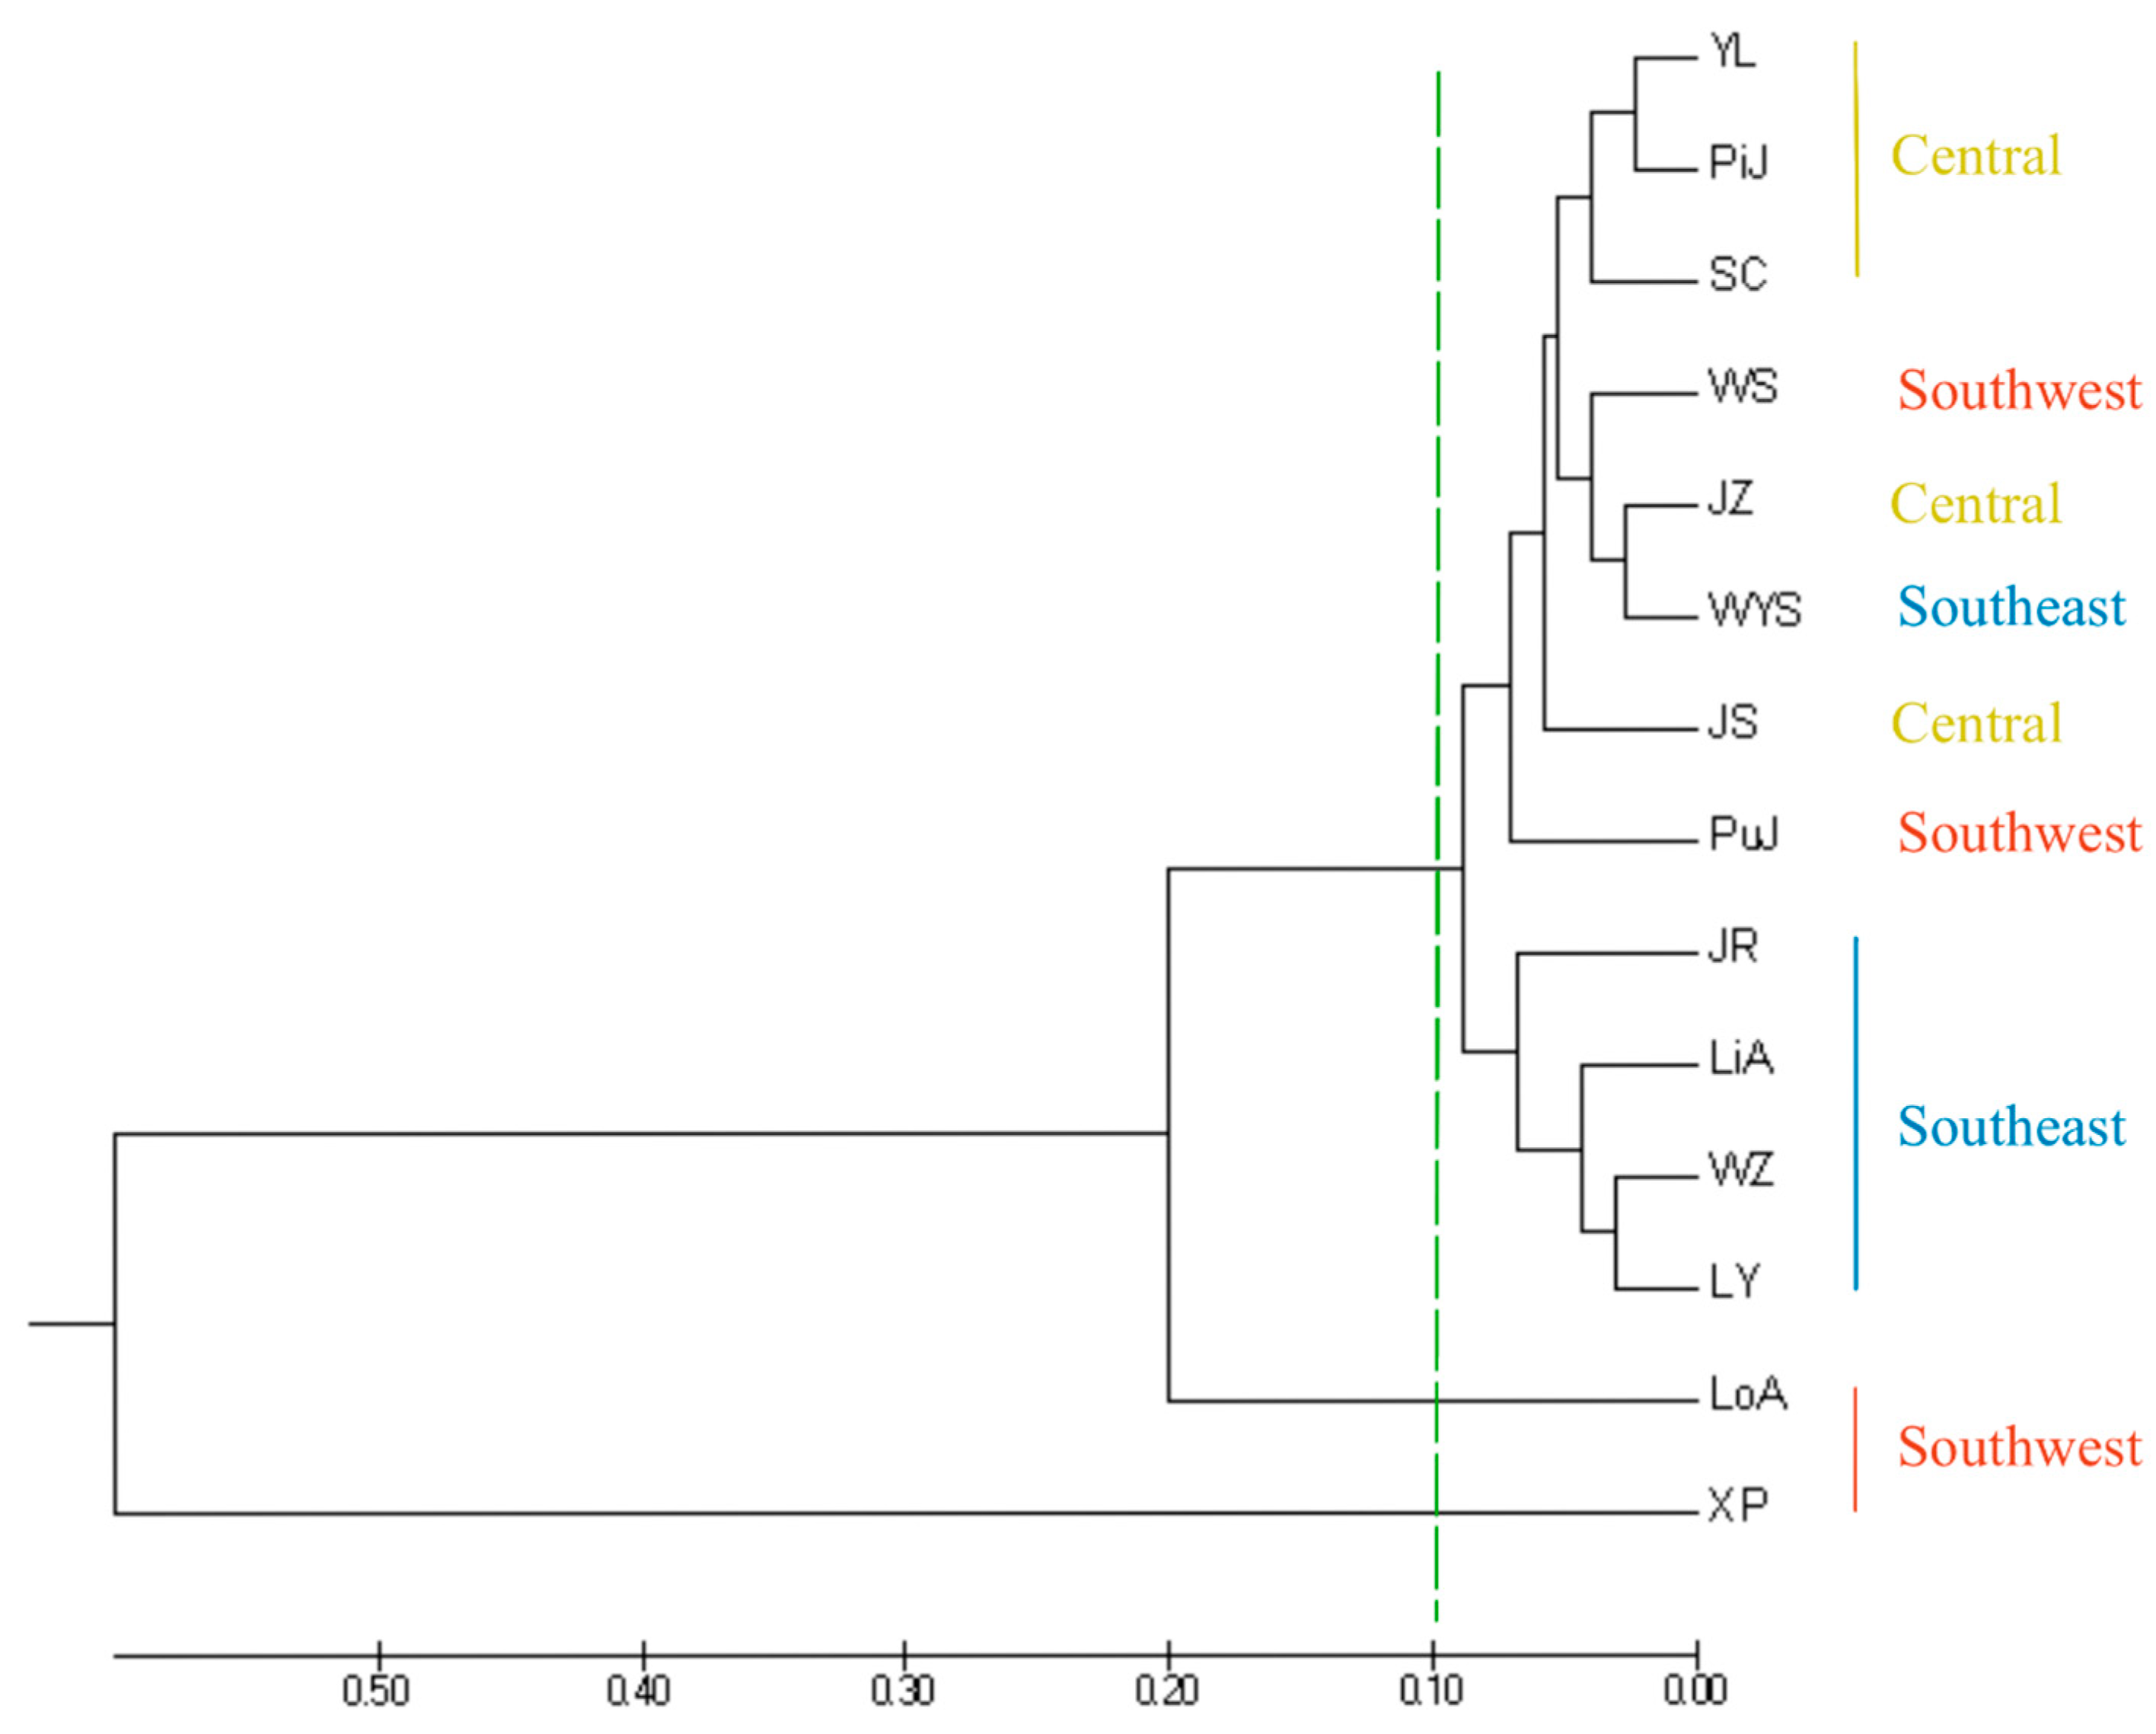
A UPGMA tree of 14 I. chinensis populations was constructed based on Nei’s genetic distance (Figure 5), in which XP and LoA were located at the outermost part of the phylogenetic tree, indicating that this population had the farthest genetic relationship with other populations. The remaining population could be roughly divided into two groups at a genetic distance of 0.1. Among them, the four southeastern populations of JR, LiA, WZ, and LY clustered into one branch, while YL, PiJ, SC, WS, JZ, WYS, JS, and PuJ clustered into another branch. This branch included all central populations and some southeastern and southwestern populations. The clustering analysis results indicated that there was a clear geographical structure between populations, meaning that most populations with closer geographical locations gathered together first, which was similar to the results of STRUCTURE. A principal coordinate analysis (PCoA) based on the inter-population pairing Fst matrix of the 14 I. chinensis populations revealed that the 401 individuals were clearly divided into three groups (Figure 6). Group 1 included 12 populations distributed in the southeastern, central, and some southwestern regions. Group 2 consisted of the XP population located in the southwestern region, while Group 3 included the LoA population in the southwestern region. These results were consistent with the findings of the structure analysis and similar to the results of the UPGMA clustering analysis.
4. Discussion
4.1. Genetic Diversity
The SSR molecular markers are crucial for genetic diversity analysis, due to their several genetic features, such as codominance inheritance [50]. SSR markers may have higher polymorphism than dominant markers (RAPD, ISSR, etc.). As a key index of a plant’s adaptability to environmental changes, genetic diversity may be influenced by natural selection, genetic drift, migration, and reproductive systems [51]. Studying the genetic diversity of Ilex at the population level will provide a theoretical reference for the protection and utilization of Ilex species resources. Although the species in Ilex are important types of resource plants, with high ecological, ornamental, and economic value, research on the genetic diversity of this group is currently weak, especially for I. chinensis.
Here, for the first time, we provide an empirical study of the genetic diversity across 14 populations of I. chinensis. There are not many comparable case studies of genetic diversity for Chinese hollies; AFLP Markers were used to analyze the genetic diversity of one wild and five cultivated populations of I. glabra (L.) A. Gray for the identification of the varieties, genetic improvement, and germplasm resource protection [52]. The development of SSR markers for I. chinensis has been reported [38], but no subsequent diversity analysis was found. ISSR markers have been used for I. integra Thunb., an insular endemic species of hollies, indicating a low genetic diversity and a high genetic differentiation [39]. It is obvious that the measured data of SSR markers for Chinese hollies is basically lacking. As for the Ilex species materials from other regions, there are several genetic diversity studies available for reference.
Investigation of six populations from successive age cohorts (adult, regenerating, and seed-derived populations) of I. paraguariensis in Southern Brazil revealed a relatively high level of He, with the highest and lowest values of 0.660 and 0.584, respectively [34]. The overall He across 14 nuclear SSR loci was 0.459 for the “yerba mate” germplasm of I. paraguariensis [31]. Another report also showed that “yerba mate” breeding populations were highly variable [33]. On the other hand, the results from I. guayusa suggested a moderately low degree of genetic diversity (He = 0.396) [35].
Based on our data, the overall He of the 11 SSR loci for I. chinensis was 0.488, indicating that this holly species had a moderately high genetic diversity. There are slight differences in He among different geographical groups, with an average He of 0.515, 0.483, and 0.461 for the southeast (five populations), central (five populations), and southwest groups (four populations), respectively. The trend of He between geographical groups is also supported by other genetic parameters, and there is a downward trend from the east to west geographical groups for the number of efficient alleles (Ne), the observed heterozygosity (Ho), and Shannon’s information index (I). Overall, compared to existing reports, I. Chinensis holds a moderately high level of genetic diversity and shows a decreasing trend in geographical groups from east to west.
4.2. Genetic Differentiation and Genetic Structure
In this study, a series of analyses showed that the population of I. chinensis had a relatively high level of genetic differentiation and a clear genetic structure. The AMOVA analysis results indicated that genetic variation mainly existed within the population, accounting for 81.5% of the total variation. Generally speaking, genetic variation in heterozygous plants mainly existed within populations [53]. The genetic differentiation between populations of I. chinensis is slightly higher than that of mesophytic forest-tree species. A number of reports on the proportion of within–among the population were documented for these tree species, such as Camellia species (77% vs. 23%) [54], Rhododendron rex H. Lév. (83.5% vs. 16.5%) [55], Dalbergia nigra (Vell.) Benth. (85.2% vs. 14.8%) [56], and Camellia taliensis (W. W. Sm.) Melch. (87.1% vs. 12.9%) [57]. However, the genetic differentiation of I. chinensis is significantly higher than that of some forest-dominant tree species, e.g., Quercus liaotungensis Koidz. (94.5% vs. 5.5%) [58] and Castanopsis hystrix Hook. f. & Thomson ex A. DC. (96% vs. 4%) [59], as well as some cultivated woody plants, e.g., Diospyros kaki Thunb. (98% vs. 2%) [60].
UPGMA clustering, STRUCTURE clustering based on the Bayesian algorithm, and PCoA all had similar results, which means that those with similar geographic locations were clustered together. Regional genetic clustering was based on population, specifically origin clustering, and this genetic structure was typical in isolated populations. Among them, the XP and LoA populations located in high-altitude areas constitute two separate branches. All southeast populations, except population WYS, form a genetic cluster with a central cluster assembled by other populations. The geographical pattern of this genetic structure roughly follows the overall trend of east–central–west differentiation, although there are exceptions. In fact, previous reports are generally consistent. Castanopsis fargesii Franch. was reported to display a typical geographic pattern of east–central–west [61]. An obvious pattern of the two clades was reported for the lacquer tree, e.g., a western group including 35 sites in Western China, and the eastern group embracing 40 sites in Eastern China, South Korea, and Japan [62]. Three genetic clades (eastern, southwestern, and northwestern regions) were found in Liriodendron chinense (Hemsl.) Sarg. [63].
Overall, I. Chinese has a relatively high genetic differentiation among populations, and the geographical pattern of genetic structure is manifested as three clades: east, central, and west.
4.3. Intrinsic Factors Affecting Genetic Variation
Life histories and breeding systems highly affect genetic diversity and structure [64]. As a group of typical dioecious species, Ilex species have small and white or pale-colored flowers and are pollinated by insects [65]. So far, there have been no reports on the breeding system and pollen and seed vectors of I. chinensis. Nevertheless, based on its dioecious sex system and relevant observations of the hollies mentioned above, it is not difficult to speculate that the breeding system of I. chinensis is outcrossing. Apis cerana Fabricius was the flower visitor of fourteen holy species [66]. A recent investigation has shown that β-caryophyllene in I. rotunda Thunb. may be used as an information substance to attract Apis cerana for pollination [67]. In a dioecious species, I. opaca Aiton, female reproductive success and fruit yields were limited by resource levels rather than pollen availability [68]. Due to its dioecy, holly species typically maintain a breeding system of outcrossing. Outcrossing species tended to be more genetically diverse and had less genetic differentiation among their populations, while woody plants had less population differentiation [64]. In addition, the mode of reproduction (sexual vs. asexual) is likely to have important effects on genetic variation and its spatial distribution within plant populations [69,70]. Based on relevant expectations [64], outcrossing can explain why I. chinensis, to a considerable extent, has moderately high genetic diversity, rather than relatively high genetic differentiation.
Hollies were reported to be bird-dispersed tree or shrub species, such as I. integra [71] and I. aquifolium [72,73]. Although the main mode of seed transmission is bird dispersal, such as Turdus iliacus L., the seeds are secondary transported by predating rodents, such as Clethrionomys gladiolus [74]. Interestingly, the seeds of I. aquifolium may also be spread by mammals (mainly Vulpes vulpes and Meles meles) [75]. The phenomenon of post-dispersal seed predation also exists in I. canariensis Poir. [76]. In another study, different fruits of I. chapaensis Merr. were documented by various animals, with Paguma larvata for large green fruits and birds for red or black fruits [66]. Seed dispersal by birds is assumed to profoundly impact genetic diversity in many plant species [77]. Environmental fecal samples in a study of plant–frugivore interactions can be applied to the investigation of plant ecology and genetic variability [78]. Although long-distance dispersal syndromes (ornithochory) do not always ensure genetic connectivity across large areas in island systems [79], we believed that it was crucial to promote gene flow among populations of I. chinensis. Thus, relatively moderate genetic differentiation between populations may be related to the obstacle of plant seeds–birds interaction.
4.4. Environmental Factors Affecting Genetic Variation
As for forest plants, altitude has a potential impact on genetic diversity within species. However, a previous inquiry demonstrated different patterns of variation. Populations at intermediate altitudes have greater diversity than populations at lower and higher altitudes [80]. The data of genetic diversity analysis from five subpopulations of Rhododendron simsii Planch. at altitude gradients (972–1370 m) showed a high–low–high variation pattern in expected heterozygosity (He) [62]. Contrasting elevational patterns of genetic variation were reported in Euptelea pleiospermum Hook. f. et Thoms., and significant impacts were found for the central mountains, with higher genetic diversity in the middle-altitude populations than in the low and high altitudes. No elevational effects were detected for marginal mountains [81]. In a study on grassland species, the authors drew a conclusion that altitude does not affect genetic diversity [82]. For the case of I. chinensis, the altitude variation of genetic diversity presented a negative correlation, with high diversity in low-altitude populations and low diversity in high-altitude populations. Specifically, the populations in the southeast were widely distributed in the Middle and Lower Yangtze Valley Plain, while the populations in the southwest were only scattered in the high-altitude areas of the Wumeng Mountains and Hengduan Mountains.
Ilex was believed to have originated in the early Eocene (50.8 Ma), grown in moist subtropical East Asia, and expanded its range of temperature tolerance rather than moisture tolerance in the subsequent evolutionary process [6]. I. chinensis was dated from the Pliocene–Pleistocene boundary (2.53 Ma) [6]. The uplift of the Himalaya–Hengduan Mountains (late Miocene to early Pliocene) accompanied by simultaneous cooling was assumed to trigger the differentiation of oaks [83]. Specifically, the uplift of the Yunnan–Guizhou Plateau began at 2.8 Ma and had a fast and dramatic uplift around 0.8 Ma [84]. Thus, we speculated that the eastern–central–western pattern of genetic differentiation for I. chinensis may be affected by the uplift of the Yunnan–Guizhou Plateau and its associated climate change. In addition, human interference may also affect the genetic structure of I. chinensis. The fine-scale genetic structure of I. aquifolium may be influenced by human interventions (mainly coppice practice and cattle browsing) [85].
Population JR appeared to be mixed with a few individuals similar to the individuals of population XP (Figure 3). We do not rule out the existence of introduced individuals in population JR. However, further exploration is needed.
5. Conclusions
This study found for the first time that the genetic diversity of I. chinensis was at a moderate level, and most of this genetic variation existed within populations. The high level of population differentiation could have been maintained through bird-mediated seed dispersal. The geographic pattern of I. chinensis showed a gradual decrease in genetic diversity from east to west and from low to high altitudes. This study provided the complete genetic data of I. chinensis for the first time, which provided a molecular basis for the collection of genetic resources, the preservation of core germplasm resources, and the development of new varieties of I. chinensis. It also provided valuable information for hybridization and species boundary delineation of I. chinensis. For deeper genetic diversity analysis, a series of follow-up studies, such as cpDNA and nDNA sequencing, genomics, etc., would be needed.
Supplementary Materials
The following supporting information can be downloaded at https://www.mdpi.com/article/10.3390/f15050763/s1: Figure S1: The geographical distribution of 14 populations of Ilex chinensis; Table S1: Accession data for the populations of Ilex chinensis; Table S2: Primer sequences and fragment size information for 11 microsatellite loci; Table S3: The proportion of four genetic branches in 14 populations.
Author Contributions
Conceptualization, Q.Z. and M.Z.; formal analysis, X.W.; investigation, S.H. and P.Z.; resources, S.H. and P.Z.; data curation, X.W.; writing—original draft preparation, S.H. and Y.F.; writing—review and editing, Q.Z. and M.Z.; funding acquisition, Q.Z. and M.Z. All authors have read and agreed to the published version of the manuscript.
Funding
This research was funded by the Jiangsu Agriculture Science and Technology Innovation Fund [CX(21)3013], the Independent Research Projects of Jiangsu Academy of Forestry [ZZKY202105], the Jiangsu Provincial Innovation and Extension Project of Forestry Science and Technology [LYKJ[2021]07], and the Jiangsu Provincial Innovation and Extension Project of Agriculture Science and Technology [2023-SJ-009].
Data Availability Statement
The raw data supporting the conclusions of this article will be made available by the authors on request.
Conflicts of Interest
The authors declare no conflicts of interest.
References
- Gottlieb, A.M.; Giberti, G.C.; Poggio, L. Molecular analyses of the genus Ilex (aquifoliaceae) in Southern south America, evidence from AFLP and ITS sequence data. Am. J. Bot. 2005, 92, 352–369. [Google Scholar] [CrossRef] [PubMed]
- Herrera, C.M.; Bazaga, P. Epigenetic correlates of plant phenotypic plasticity: DNA methylation differs between prickly and nonprickly leaves in heterophyllous Ilex aquifolium (Aquifoliaceae) trees. Bot. J. Linn. Soc. 2013, 171, 441–452. [Google Scholar] [CrossRef]
- Manen, J.-F. Are both sympatric species Ilex perado and Ilex canariensis secretly hybridizing? Indication from nuclear markers collected in Tenerife. BMC Evol. Biol. 2004, 4, 46. [Google Scholar] [CrossRef] [PubMed]
- Selbach-Schnadelbach, A.; Cavalli, S.S.; Manen, J.F.; Coelho, G.C.; De Souza-Chies, T.T. New information for Ilex phylogenetics based on the plastid psbA-trnH intergenic spacer (Aquifoliaceae). Bot. J. Linn. Soc. 2009, 159, 182–193. [Google Scholar] [CrossRef]
- Loizeau, P.A.; Barriera, G.; Manen, J.F.; Broennimann, O. Towards an understanding of the distribution of Ilex L. (Aquifoliaceae) on a worldwide scale. Biol. Skr. 2005, 55, 501–520. [Google Scholar]
- Yao, X.; Song, Y.; Yang, J.B.; Tan, Y.H.; Corlett, R.T. Phylogeny and biogeography of the hollies (Ilex L., Aquifoliaceae). J. Syst. Evol. 2021, 59, 73–82. [Google Scholar] [CrossRef]
- Cuénoud, P.; Martinez, M.A.D.P.; Loizeau, P.-A.; Spichiger, R.; Andrews, S.; Manen, J.-F. Molecular phylogeny and biogeography of the genus Ilex L. (Aquifoliaceae). Ann. Bot. 2000, 85, 111–122. [Google Scholar] [CrossRef]
- Ding, H.; Fang, Y.; Yang, Q.; Chen, X.; Yuan, F.; Xu, H.; He, L.; Yan, J.; Chen, T.; Yu, C.; et al. Community characteristics of a mid-subtropical evergreen broad-leaved forest plot in the Wuyi Mountains, Fujian Province, southeastern China. Biodivers. Sci. 2015, 23, 479–492. [Google Scholar] [CrossRef]
- Ding, H.; Fang, Y.; Yang, X.; Yuan, F.; He, L.; Yao, J.; Wu, J.; Chi, B.; Li, Y.; Chen, S.; et al. Community characteristics of a subtropical evergreen broad-leaved forest in Huangshan, Anhui Province, East China. Biodivers. Sci. 2016, 24, 875–887. [Google Scholar] [CrossRef]
- Ding, H.; Yang, Y.F.; Xu, H.; Fang, Y.; Chen, X.; Yang, Q.; Yi, X.; Xu, H.; Wen, X.; Xu, X. Species composition and community structure of the typical evergreen broad-leaved forest in the Wuyi Mountains of Southeastern China. Acta Ecol. Sin. 2015, 35, 1142–1154. [Google Scholar]
- Tang, C.Q.; Ohsawa, M. Coexistence mechanisms of evergreen, deciduous and coniferous trees in a mid-montane mixed forest on Mt. Emei, Sichuan, China. Plant Ecol. 2002, 161, 215–230. [Google Scholar] [CrossRef]
- Pavão, D.; Jevšenak, J.; Engblom, J.; Silva, L.B.; Elias, R. Tree growth-climate relationship in the Azorean holly in a temperate humid forest with low thermal amplitude. Dendrochronologia 2023, 77, 126050. [Google Scholar] [CrossRef]
- Li, L.; Xu, L.J.; Ma, G.Z.; Dong, Y.M.; Peng, Y.; Xiao, P.G. The large-leaved kudingcha (Ilex latifolia Thunb and Ilex kudingcha CJ Tseng): A traditional Chinese tea with plentiful secondary metabolites and potential biological activities. J. Nat. Med. 2013, 67, 425–437. [Google Scholar] [CrossRef] [PubMed]
- Negrin, A.; Long, C.; Motley, T.J.; Kennelly, E.J. LC-MS metabolomics and chemotaxonomy of caffeine-containing holly (Ilex) species and related taxa in the Aquifoliaceae. J. Agric. Food Chem. 2019, 67, 5687–5699. [Google Scholar] [CrossRef]
- Jiang, S.; Cui, H.; Wu, P.; Liu, Z.; Zhao, Z. Botany, traditional uses, phytochemistry, pharmacology and toxicology of Ilex pubescens Hook et Arn. J. Ethnopharmacol. 2019, 245, 112147. [Google Scholar] [CrossRef] [PubMed]
- Noureddine, T.; Al Husseini, Z.; Nehme, A.; Massih, R.A. Antibacterial activity of Ilex paraguariensis (Yerba Mate) against Gram-positive and Gram-negative bacteria. J. Infect. Dev. Ctries. 2018, 12, 712–719. [Google Scholar] [CrossRef] [PubMed]
- Shao, S.-Y.; Li, R.-F.; Sun, H.; Li, S. New triterpenoid saponins from the leaves of Ilex chinensis and their hepatoprotective activity. Chin. J. Nat. Med. 2021, 19, 376–384. [Google Scholar] [CrossRef] [PubMed]
- Bareke, T.; Addi, A. Bee flora diversity in different vegetation communities of Gsha-Sayilem forest in Kaffa Zone, south-western Ethiopia. Plants Environ. 2000, 2, 138–148. [Google Scholar] [CrossRef]
- Qian, Y.P.; Tian, R.N. Research advance of Ilex germplasm resources and their application to landscape. World For. Res. 2016, 29, 40–45. [Google Scholar]
- Shi, S.; Chen, S.-F.; Zhong, F.-H.; Wu, G.-X.; Liao, W.-B.; Fan, Q. Ilex sanqingshanensis sp. Nov. (Aquifoliaceae) from Jiangxi Province, China. Nord. J. Bot. 2015, 33, 662–667. [Google Scholar] [CrossRef]
- Lozada-Perez, L. A new species of Ilex (Aquifoliaceae) from Mexico. Phytotaxa 2019, 409, 296–300. [Google Scholar] [CrossRef]
- Jiang, L.; Wu, L.F.; Huang, G.Y.; Yu, J.R.; He, B.S.; Xu, K.W. A new species of Ilex sect. Ilex (Aquifoliaceae) from Guangdong, China. Phytotaxa 2020, 428, 153–158. [Google Scholar] [CrossRef]
- Manen, J.F.; Boulter, M.C.; Naciri-Graven, Y. The complex history of the genus Ilex L. (Aquifoliaceae): Evidence from the comparison of plastid and nuclear DNA sequences and from fossil data. Plant Syst. Evol. 2002, 235, 79–98. [Google Scholar] [CrossRef]
- Yang, Y.; Jiang, L.; Liu, E.D.; Liu, W.L.; Chen, L.; Kou, Y.X.; Fan, D.M.; Cheng, S.M.; Zhang, Z.Y.; Peng, H. Time to update the sectional classification of Ilex (Aquifoliaceae): New insights from Ilex phylogeny, morphology, and distribution. J. Syst. Evol. 2023, 61, 1036–1046. [Google Scholar] [CrossRef]
- Xu, K.-W.; Wei, X.-F.; Lin, C.-X.; Zhang, M.; Zhang, Q.; Zhou, P.; Fang, Y.-M.; Xue, J.-Y.; Duan, Y.-F. The chromosome-level holly (Ilex latifolia) genome reveals key enzymes in triterpenoid saponin biosynthesis and fruit color change. Front. Plant Sci. 2022, 13, 98. [Google Scholar] [CrossRef] [PubMed]
- Yao, X.; Lu, Z.; Song, Y.; Hu, X.; Corlett, R.T. A chromosome-scale genome assembly for the holly (Ilex polyneura) provides insights into genomic adaptations to elevation in Southwest China. Hortic. Res. 2022, 9, 2323. [Google Scholar] [CrossRef]
- Zhou, P.; Zhang, Q.; Li, F.; Huang, J.; Zhang, M. Assembly and comparative analysis of the complete mitochondrial genome of Ilex metabaptista (Aquifoliaceae), a Chinese endemic species with a narrow distribution. BMC Plant Biol. 2023, 23, 393. [Google Scholar] [CrossRef]
- Yao, X.; Tan, Y.-H.; Liu, Y.-Y.; Song, Y.; Yang, J.-B.; Corlett, R.T. Chloroplast genome structure in Ilex (Aquifoliaceae). Sci. Rep. 2016, 6, 28559. [Google Scholar] [CrossRef] [PubMed]
- Kong, B.L.-H.; Park, H.-S.; Lau, T.-W.D.; Lin, Z.; Yang, T.-J.; Shaw, P.-C. Comparative analysis and phylogenetic investigation of Hong Kong Ilex chloroplast genomes. Sci. Rep. 2021, 11, 5153. [Google Scholar] [CrossRef]
- Xu, K.; Lin, C.; Lee, S.Y.; Mao, L.; Meng, K. Comparative analysis of complete Ilex (Aquifoliaceae) chloroplast genomes: Insights into evolutionary dynamics and phylogenetic relationships. BMC Genom. 2022, 23, 203. [Google Scholar] [CrossRef]
- Cascales, J.; Bracco, M.; Poggio, L.; Gottlieb, A.M. Genetic diversity of wild germplasm of ‘‘yerba mate’’ (Ilex paraguariensis St. Hil.) from Uruguay. Genetica 2014, 142, 563–573. [Google Scholar] [CrossRef] [PubMed]
- Seoane, C.; Diaz, V.; Kageyama, P.; Moreno, M.; Tambarussi, E.; Aguiar, A.; Sebbenn, A. The neotropical tree Ilex paraguariensis A. St. Hil. (Aquifoliaceae): Pollen and seed dispersal in a fragmented landscape. Ann. For. Res. 2019, 62, 157–171. [Google Scholar] [CrossRef]
- Paiva, D.I.; Cascales, J.; Rosetti, M.E.N.; Scherer, R.A.; Gauchat, M.E.; Gottlieb, A.M. Unraveling the genetic complexity of a cultivated breeding population of “yerba mate” (Ilex paraguariensis St. Hil.). Acad. Bras. Cienc. 2020, 92, e20190113. [Google Scholar] [CrossRef] [PubMed]
- Bittencourt, L.; e Silva, D.T.; Nascimento, B.; Saiki, F.A.; Bet Stedille, L.I.; da Costa, N.C.F.; Mantovani, A. Genetic diversity in successive age cohorts of Ilex paraguariensis in Southern Brazil. For. Sci. 2022, 68, 291–298. [Google Scholar] [CrossRef]
- Erazo-Garcia, M.P.; Guadalupe, J.J.; Rowntree, J.K.; Borja-Serrano, P.; Monteros-Silva, N.E.d.L.; Torres, M.d.L. Assessing the genetic diversity of Ilex guayusa Loes., a medicinal plant from the ecuadorian amazon. Diversity 2021, 13, 182. [Google Scholar] [CrossRef]
- Geukens, E.; Haegeman, A.; Van Meulder, J.; Van Laere, K.; Smolders, E.; Ruttink, T.; Leus, L. Exploring genetic diversity in an Ilex crenata breeding germplasm. Horticulturae 2023, 9, 485. [Google Scholar] [CrossRef]
- Torimaru, T.; Tani, N.; Tsumura, Y.; Hiraoka, K.; Tomaru, N. Development and polymorphism of simple sequence repeat DNA markers for the evergreen shrub Ilex leucoclada M. Mol. Ecol. Notes 2004, 4, 531–533. [Google Scholar] [CrossRef]
- Chen, W.-W.; Xiao, Z.-Z.; Tong, X.; Liu, Y.-P.; Li, Y.-Y. Development and characterization of 25 microsatellite primers for Ilex chinensis (Aquifoliaceae). Appl. Plant Sci. 2015, 3, 1500057. [Google Scholar] [CrossRef]
- Leng, X.; Wang, Z.; An, S.; Feng, J.; Liu, Y.; Wang, G. ISSR analysis of genetic diversity of Ilex integra, an insular endemic plant. Biodivers. Sci. 2005, 13, 546–554. [Google Scholar] [CrossRef]
- Rendell, S.; Ennos, R.A. Chloroplast DNA diversity of the dioecious European tree Ilex aquifolium L. (English holly). Mol. Ecol. 2003, 12, 2681–2688. [Google Scholar] [CrossRef]
- Setoguchi, H.; Watanabe, I. Intersectional gene flow between insular endemics of Ilex (Aquifoliaceae) on the Bonin Islands and the Ryukyu Islands. Am. J. Bot. 2000, 87, 793–810. [Google Scholar] [CrossRef] [PubMed]
- Shi, L.; Li, N.; Wang, S.; Zhou, Y.; Huang, W.; Yang, Y.; Ma, Y.; Zhou, R. Molecular evidence for the hybrid origin of Ilex dabieshanensis (Aquifoliaceae). PLoS ONE 2016, 11, e0147825. [Google Scholar] [CrossRef]
- Manen, J.-F.; Barriera, G.; Loizeau, P.-A.; Naciri, Y. The history of extant Ilex species (Aquifoliaceae): Evidence of hybridization within a Miocene radiation. Mol. Phylogenet. Evol. 2010, 57, 961–977. [Google Scholar] [CrossRef] [PubMed]
- Zhang, Q.; Zhang, M.; Ding, Y.; Zhou, P.; Fang, Y. Composition of photosynthetic pigments and photosynthetic characteristics in green and yellow sectors of the variegated Aucuba japonica ‘Variegata’ leaves. Flora 2018, 240, 25–33. [Google Scholar] [CrossRef]
- Peakall, R.O.D.; Smouse, P.E.; GENALEX 6: Genetic analysis in Excel. Population genetic software for teaching and research. Mol. Ecol. Notes 2006, 6, 288–295. [Google Scholar] [CrossRef]
- Liu, K.; Muse, S.V. PowerMarker: An integrated analysis environment for genetic marker analysis. Bioinformatics 2005, 21, 2128–2129. [Google Scholar] [CrossRef] [PubMed]
- Kumar, S.; Stecher, G.; Tamura, K. MEGA7: Molecular evolutionary genetics analysis version 7.0 for bigger datasets. Mol. Biol. Evol. 2015, 33, 1870–1874. [Google Scholar] [CrossRef] [PubMed]
- Evanno, G.; Regnaut, S.; Goudet, J. Detecting the number of clusters of individuals using the software STRUCTURE: A simulation study. Mol. Ecol. 2005, 14, 2611–2620. [Google Scholar] [CrossRef] [PubMed]
- Zhu, C.T. Application of ArcGIS in geography teaching of secondary school: A case study in the practice of map teaching. Wirel. Pers. Commun. Int. J. 2018, 102, 2543–2553. [Google Scholar]
- Costa, V.; Angelini, C.; De Feis, I.; Ciccodicola, A. Uncovering the complexity of transcriptomes with RNA-SEQ. In The Role of Bioinformatics in Agriculture; Apple Academic Press: Palm Bay, FL, USA, 2014. [Google Scholar]
- Schielzeth, H.; Wolf, J.B.W. Community genomics: A community-wide perspective on within-species genetic diversity. Am. J. Bot. 2021, 108, 2108–2111. [Google Scholar] [CrossRef]
- Sun, Y.P.; Zhang, D.L.; Geng, F. Genetic diversity and taxon delineation of Ilex glabra using AFLP markers. Acta Hortic. 2010, 859, 261–270. [Google Scholar]
- Wang, Y.-S.; Zhao, L.-M.; Wang, H.; Wang, J.; Huang, D.-M.; Hong, R.-M.; Teng, X.-H.; Miki, N. Molecular genetic variation in a clonal plant population of Leymus chinensis (Trin.) Tzvel. J. Integr. Plant Biol. 2005, 47, 1055–1064. [Google Scholar] [CrossRef]
- Yan, H.; Qi, H.; Li, Y.; Wu, Y.; Wang, Y.; Chen, J.; Yu, J. Assessment of the genetic relationship and population structure in Oil-Tea Camellia species using simple sequence repeat (SSR) markers. Genes 2022, 13, 2162. [Google Scholar] [CrossRef] [PubMed]
- Zhang, X.; Liu, Y.-H.; Wang, Y.-H.; Shen, S.-K. Genetic diversity and population structure of Rhododendron rex Subsp. rex inferred from microsatellite markers and chloroplast DNA sequences. Plants 2020, 9, 338. [Google Scholar] [CrossRef] [PubMed]
- Da Silva, A.L., Jr.; Cabral, R.L.R.; Sartori, L.; de Miranda, F.D.; Caldeira, M.V.W.; Moreira, S.O.; Godinho, T.d.O.; de Oliveira, F.S. Molecular markers applied to the genetic characterization of Dalbergia nigra: Implications for conservation and management. Trees 2022, 36, 1539–1557. [Google Scholar] [CrossRef]
- Wang, F.; Cheng, X.; Cheng, S.; Li, W.; Huang, X. Genetic diversity of the wild ancient tea tree (Camellia taliensis) populations at different altitudes in Qianjiazhai. PLoS ONE 2023, 18, e0283189. [Google Scholar] [CrossRef] [PubMed]
- Guo, B.; Hao, X.; Han, L.; Zhai, Y.; Zhou, S.; Chen, S.; Ren, D.; An, X. Unraveling the genetic diversity and structure of Quercus liaotungensis population through analysis of microsatellite markers. PeerJ 2021, 9, e10922. [Google Scholar] [CrossRef]
- Li, N.; Yang, Y.; Xu, F.; Chen, X.; Wei, R.; Li, Z.; Pan, W.; Zhang, W. Genetic diversity and population structure analysis of Castanopsis hystrix and construction of a core collection using phenotypic traits and molecular markers. Genes 2022, 13, 2383. [Google Scholar] [CrossRef] [PubMed]
- Guan, C.; Zhang, P.; Hu, C.; Chachar, S.; Riaz, A.; Wang, R.; Yang, Y. Genetic diversity, germplasm identification and population structure of Diospyros kaki Thunb. from different geographic regions in China using SSR markers. Sci. Hortic. 2019, 251, 233–240. [Google Scholar] [CrossRef]
- Sun, Y.; Hu, H.; Huang, H.; Vargas-Mendoza, C.F. Chloroplast diversity and population differentiation of Castanopsis fargesii (Fagaceae): A dominant tree species in evergreen broad-leaved forest of subtropical China. Tree Genet. Genomes 2014, 10, 1531–1539. [Google Scholar] [CrossRef]
- Wang, S.; Luo, Y.; Yang, T.; Zhang, Y.; Li, Z.; Jin, W.; Fang, Y. Genetic diversity of Rhododendron simsii Planch. natural populations at different altitudes in Wujiashan Mountain. Caryologia 2019, 72, 41–51. [Google Scholar]
- Yang, A.; Zhong, Y.; Liu, S.; Liu, L.; Liu, T.; Li, Y.; Yu, F. New insight into the phylogeographic pattern of Liriodendron chinense (Magnoliaceae) revealed by chloroplast DNA: East–west lineage split and genetic mixture within western subtropical China. PeerJ 2019, 7, e6355. [Google Scholar] [CrossRef]
- Hamrick, L.; Godt, M.J.W. Effects of life history traits on genetic diversity in plant species. Philosophical Transactions of the Royal Society of London. Ser. B Biol. Sci. 1996, 351, 1291–1298. [Google Scholar]
- Matsuhisa, S.; Ushimaru, A. Sexual dimorphism in floral longevity and flowering synchrony in relation to pollination and mating success in three dioecious Ilex species. Am. J. Bot. 2015, 102, 1187–1197. [Google Scholar] [CrossRef]
- Tsang, A.C.W.; Corlett, R.T. Reproductive biology of the Ilex species (Aquifoliaceae) in Hong Kong, China. Can. J. Bot. 2005, 83, 1645–1654. [Google Scholar] [CrossRef]
- Kuang, Z.Y.; Peng, Y.; Fang, Y.M. Preliminary observation on the effect of volatile organic components of Ilex rotunda on its pollinating insect Apis cerana. J. Nanjing For. Univ. (Nat. Sci. Ed.) 2023. Available online: https://kns.cnki.net/kcms/detail/32.1161.S.20230327.1323.006.html (accessed on 10 January 2024).
- Carr, D.E. Sexual dimorphism and fruit production in a dioecious understory tree, Ilex opaca Ait. Oecologia 1991, 85, 381–388. [Google Scholar] [CrossRef] [PubMed]
- Torimaru, T.; Tomaru, N.; Nishimura, N.; Yamamoto, S. Clonal diversity and genetic differentiation in Ilex leucoclada M. patches in an old-growth beech forest. Mol. Ecol. 2003, 12, 809–818. [Google Scholar] [CrossRef] [PubMed]
- Torimaru, T.; Tomaru, N. Fine-scale clonal structure and diversity within patches of a clone-forming dioecious shrub, Ilex leucoclada (Aquifoliaceae). Ann. Bot. 2005, 95, 295–304. [Google Scholar] [CrossRef]
- Takagi, E.; Togashi, K. Evidence of sex change in Ilex integra. Botany 2012, 90, 75–78. [Google Scholar] [CrossRef]
- Obeso, J.R.; Fernández-Calvo, I.C. Fruit removal, pyrene dispersal, post-dispersal predation and seedling establishment of a bird-dispersed tree. Plant Ecol. 2002, 165, 223–233. [Google Scholar] [CrossRef]
- Arrieta, S.; Suarez, F. Spatial dynamics of Ilex aquifolium populations seed dispersal and seed bank: Understanding the first steps of regeneration. Plant Ecol. 2005, 177, 237–248. [Google Scholar] [CrossRef]
- Obeso, J.R. Patterns of variation in Ilex aquifolium fruit traits related to fruit consumption by birds and seed predation by rodents. Ecoscience 1998, 5, 463–469. [Google Scholar] [CrossRef]
- Martínez, I.; García, D.; Obeso, J.R. Differential seed dispersal patterns generated by a common assemblage of vertebrate frugivores in three fleshy-fruited trees. Écoscience 2008, 15, 189–199. [Google Scholar] [CrossRef]
- Salvande, M.; Mulet, M.; Gonzalez, L.A.G. Ilex canariensis Poir. (Aquifoliaceae) post-dispersal seed predation in the Canary Islands. Plant Ecol. 2006, 187, 143–151. [Google Scholar] [CrossRef]
- Karubian, J.; Browne, L.; Bosque, C.; Carlo, T.; Galetti, M.; Loiselle, B.A.; Blake, J.G.; Cabrera, D.; Durães, R.; Labecca, F.M.; et al. Seed dispersal by neotropical birds: Emerging patterns and underlying processes. Ornitol. Neotrop. 2012, 23, 9–24. [Google Scholar]
- Parejo-Farnés, C.; Albaladejo, R.G.; Camacho, C.; Aparicio, A. From species to individuals: Combining barcoding and microsatellite analyses from non-invasive samples in plant ecology studies. Plant Ecol. 2018, 219, 1151–1158. [Google Scholar] [CrossRef]
- Sosa, P.A.; González-González, E.A.; González-Pérez, M.A.; de Paz, P.L.P. Contrasting patterns of genetic differentiation in Macaronesian lineages of Ilex (Aquifoliaceae). Bot. J. Linn. Soc. 2013, 173, 258–268. [Google Scholar] [CrossRef]
- Ohsawa, T.; Ide, Y. Global patterns of genetic variation in plant species along vertical and horizontal gradients on mountains. Glob. Ecol. Biogeogr. 2008, 17, 152–163. [Google Scholar] [CrossRef]
- Meng, H.J.; Wei, X.Z.; Jiang, M.X. Contrasting elevational patterns of genetic variation in Euptelea pleiospermum along mountains at the core and edges of its latitudinal range. Plant Ecol. 2019, 220, 13–28. [Google Scholar] [CrossRef]
- Hahn, T.; Kettle, C.J.; Ghazoul, J.; Frei, E.R.; Matter, P.; Pluess, A.R. Patterns of genetic variation across altitude in three plant species of semi-dry grasslands. PLoS ONE 2012, 7, e41608. [Google Scholar] [CrossRef] [PubMed]
- Meng, H.H.; Su, T.; Gao, X.Y.; Li, J.; Jiang, X.L.; Sun, H.; Zhou, Z.K. Warm–cold colonization: Response of oaks to uplift of the Himalaya–Hengduan Mountains. Mol. Ecol. 2017, 26, 3276–3294. [Google Scholar] [CrossRef] [PubMed]
- Tong, G.B.; Zhang, J.P.; Yang, X.D.; Luo, B.X.; Wang, Y.Z.; Chen, P.Y. Late cenozoic palynoflora and environment changes in Yunnan-Guizhou Plateau. Mar. Geol. Quat. Geol. 1994, 14, 91–104. [Google Scholar]
- Vega, C.; Fernández, V.; Gil, L.; Valbuena-Carabaña, M. Clonal diversity and fine-scale genetic structure of a keystone species: Ilex aquifolium. Forests 2022, 13, 1431. [Google Scholar] [CrossRef]
Figure 1.
Maps of PCR product separation for 11 SSR loci. The first three individuals (A–C) came from the WZ population, and the last three individuals (D–F) came from the SC population.
Figure 1.
Maps of PCR product separation for 11 SSR loci. The first three individuals (A–C) came from the WZ population, and the last three individuals (D–F) came from the SC population.
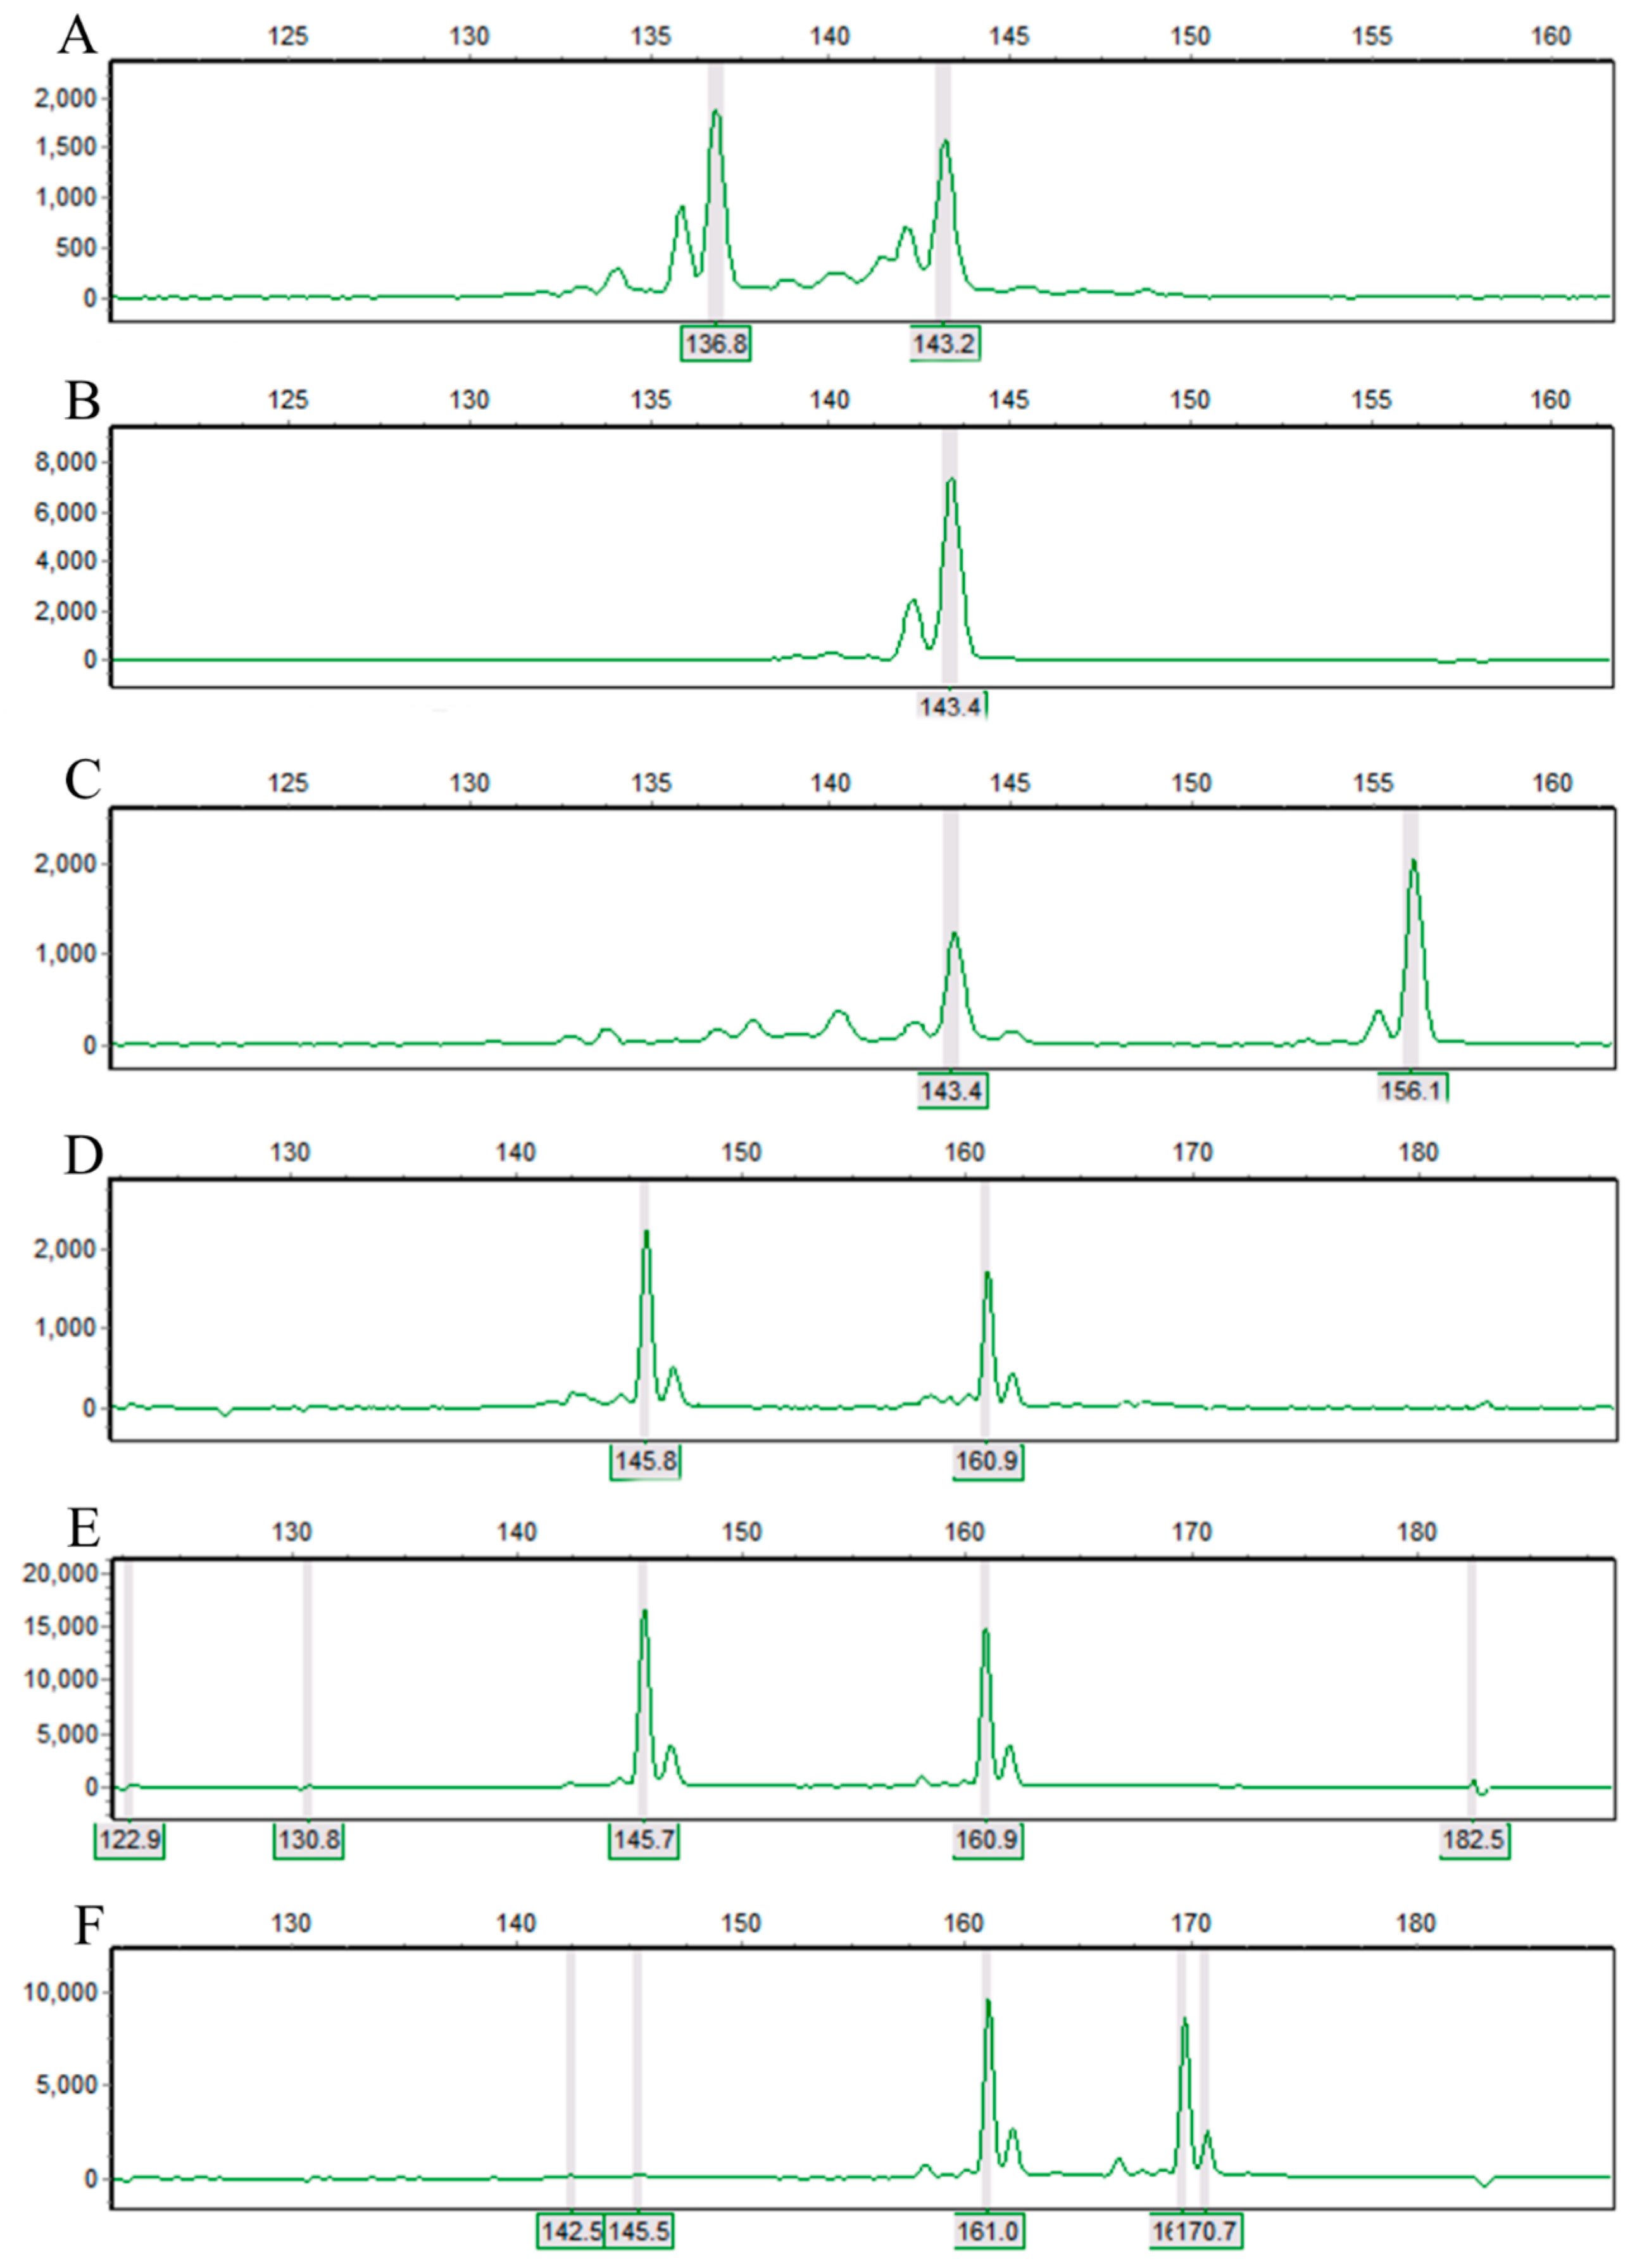
Figure 2.
Relationships between the number of clusters (K) and the corresponding ΔK statistics calculated according to ΔK (Evanno et al., 2005) [48] based on Structure analysis.
Figure 2.
Relationships between the number of clusters (K) and the corresponding ΔK statistics calculated according to ΔK (Evanno et al., 2005) [48] based on Structure analysis.
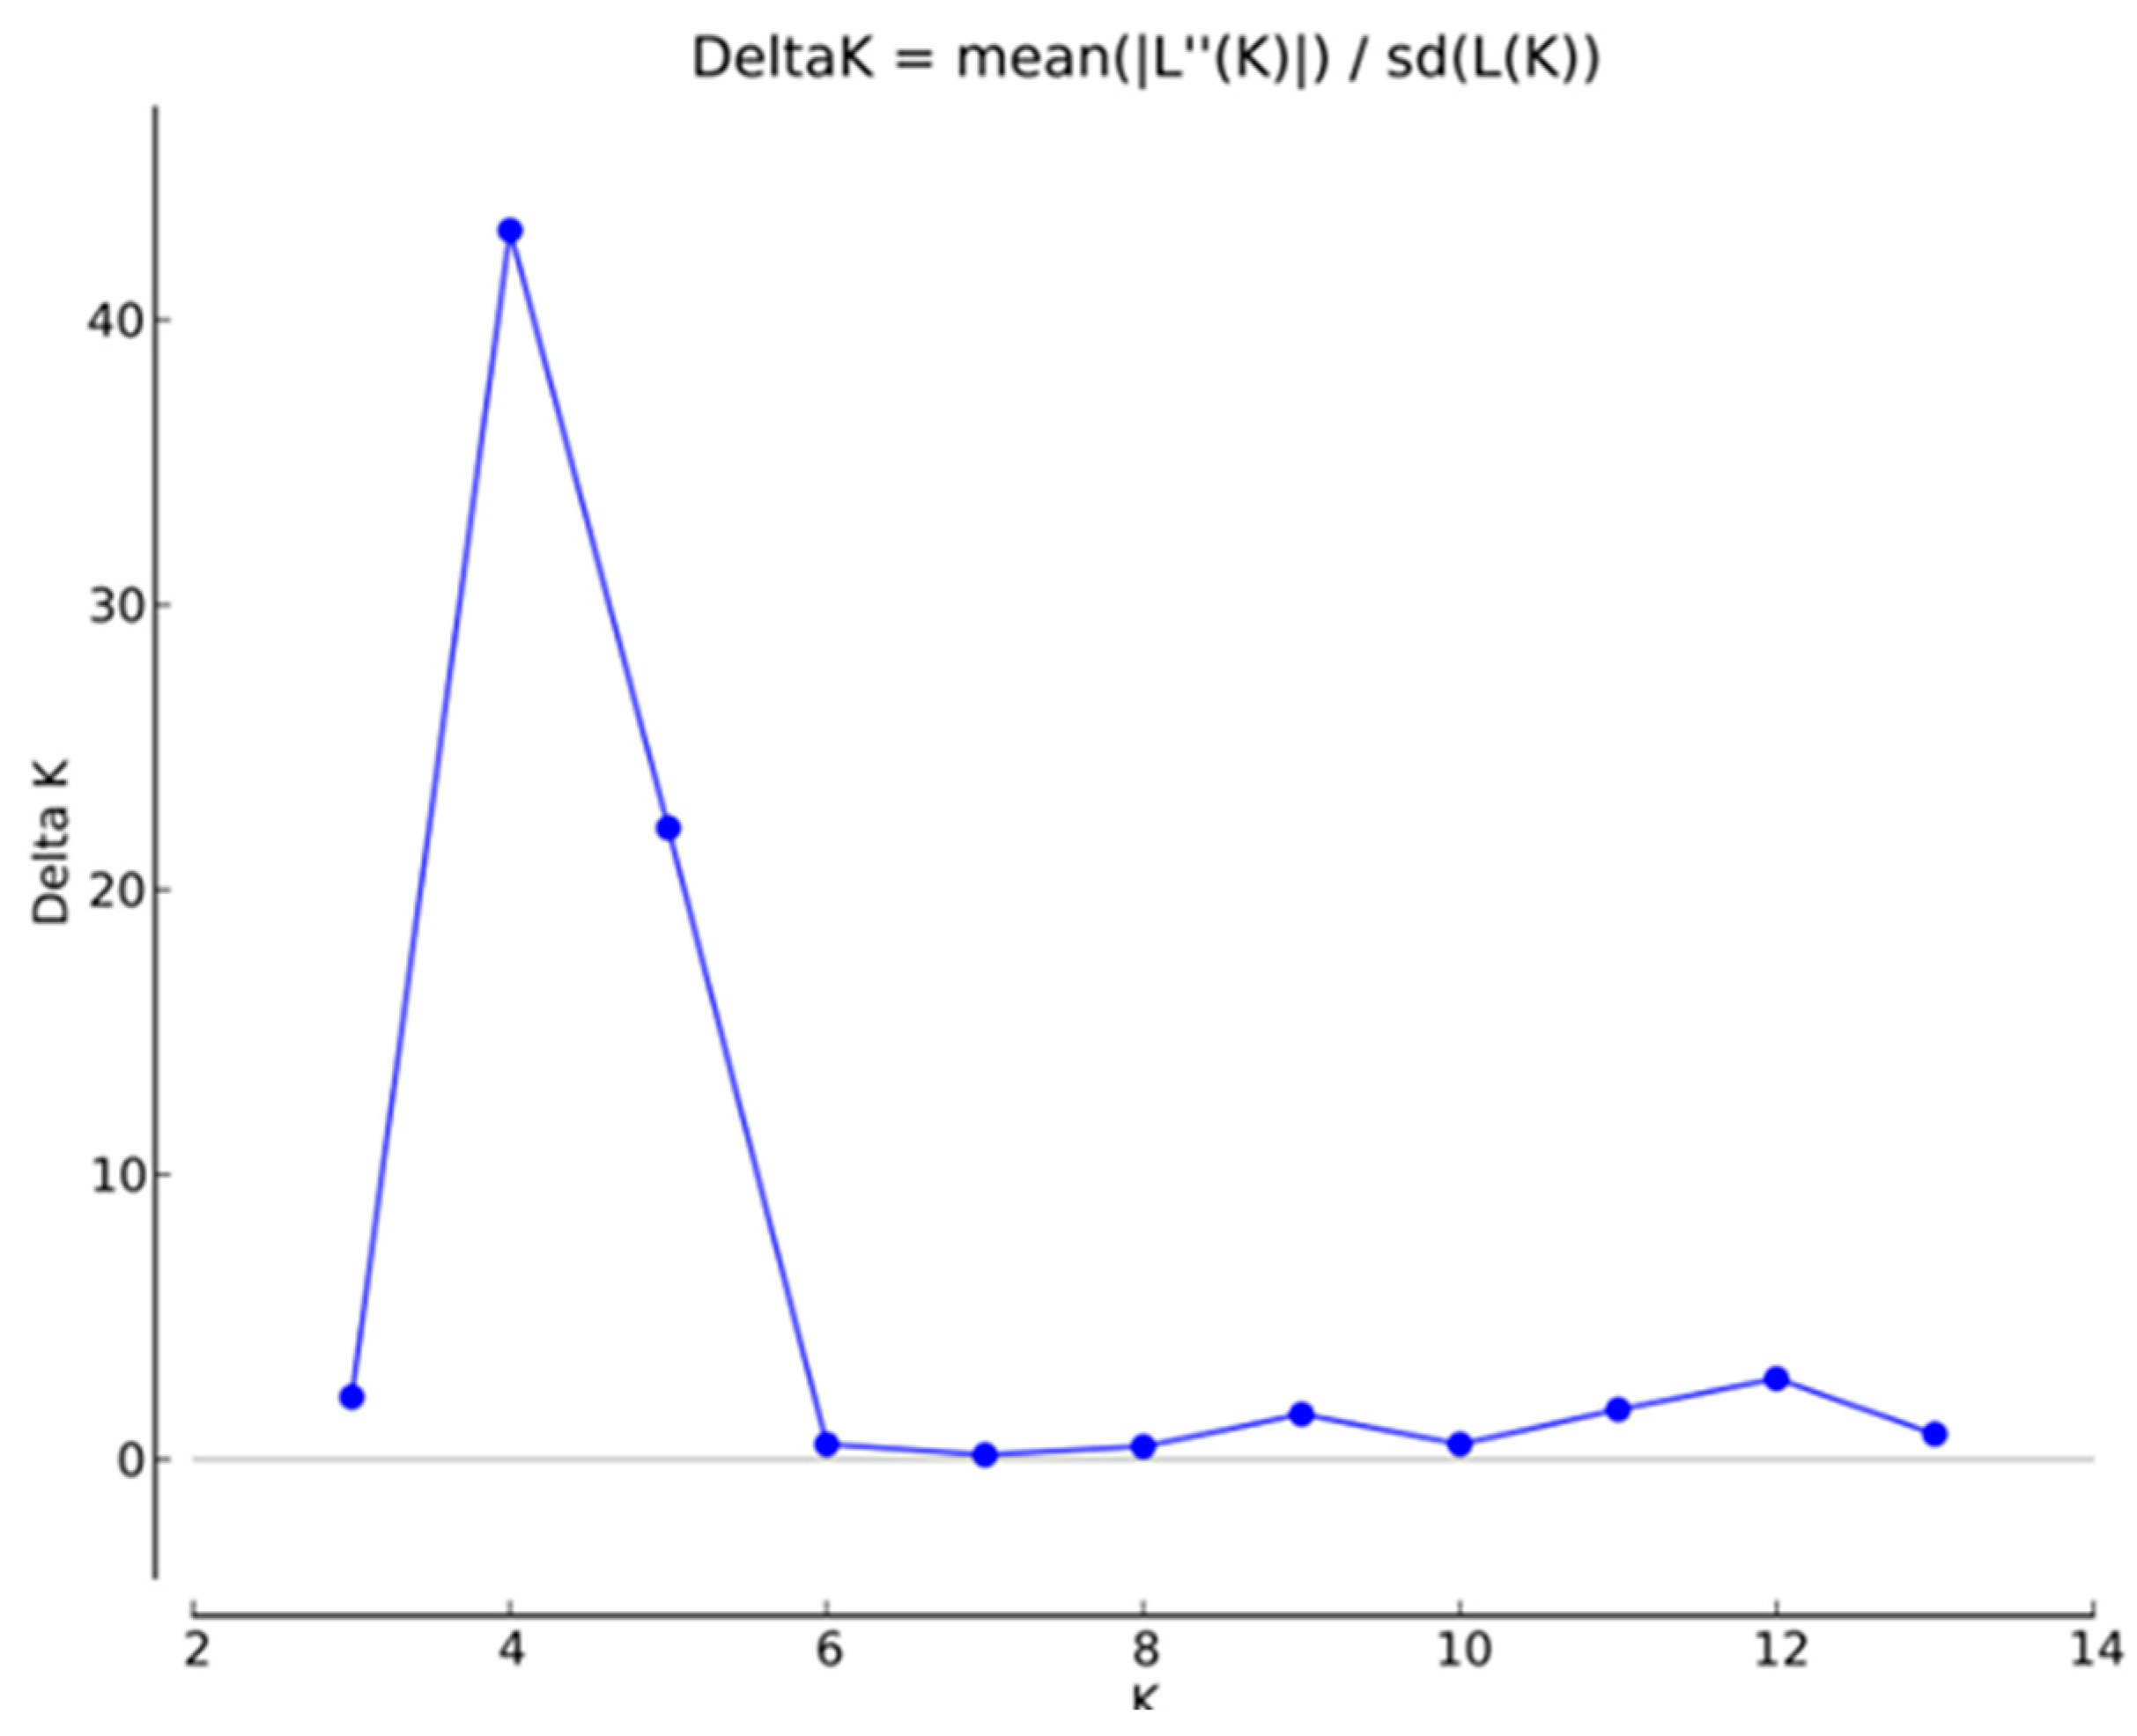
Figure 3.
Population genetic structure based on the Bayesian clustering model among 216 samples at K = 4. Green, blue, yellow and red represent the four genetic clusters of qI~qIV, respectively.
Figure 3.
Population genetic structure based on the Bayesian clustering model among 216 samples at K = 4. Green, blue, yellow and red represent the four genetic clusters of qI~qIV, respectively.

Figure 4.
Geographical distribution of STRUCTURE results and genetic structure in 14 populations (K = 4). The WZ, LY, JR, LiA, and WYS populations belong to the southeastern population. The JZ, JS, YL, PiJ, and SC populations belong to the central population. The WS, PuJ, XP, and LoA populations are from the southwest. Green, blue, yellow and red represent the four genetic clusters of qI~qIV, respectively.

Figure 5.
UPGMA cluster analysis based on Nei’s unbiased genetic distances.

Figure 6.
Score plot generated using PCoA. All the results showed that the samples could be divided into three clusters.
Figure 6.
Score plot generated using PCoA. All the results showed that the samples could be divided into three clusters.

Table 1.
Polymorphism information for 11 microsatellite loci.
| Na | Ne | I | Ho | He | F | Fis | Fit | Fst | PIC | Nm | |
|---|---|---|---|---|---|---|---|---|---|---|---|
| Ilex-SSR-01 | 5.429 | 2.804 | 1.165 | 0.582 | 0.587 | 0.008 | 0.008 | 0.193 | 0.187 | 0.715 | 1.089 |
| Ilex-SSR-28 | 3.714 | 1.972 | 0.800 | 0.368 | 0.438 | 0.136 | 0.159 | 0.333 | 0.207 | 0.538 | 0.960 |
| Ilex-SSR-29 | 4.429 | 2.221 | 0.966 | 0.425 | 0.541 | 0.215 | 0.213 | 0.302 | 0.113 | 0.557 | 1.967 |
| Ilex-SSR-32 | 2.000 | 1.116 | 0.181 | 0.037 | 0.090 | 0.468 | 0.590 | 0.795 | 0.500 | 0.176 | 0.250 |
| Ilex-SSR-34 | 2.786 | 1.550 | 0.573 | 0.232 | 0.330 | 0.291 | 0.297 | 0.535 | 0.339 | 0.490 | 0.488 |
| Ilex-SSR-41 | 2.500 | 1.271 | 0.327 | 0.121 | 0.170 | 0.204 | 0.289 | 0.508 | 0.308 | 0.243 | 0.561 |
| Ilex-SSR-68 | 5.071 | 2.531 | 1.112 | 0.516 | 0.580 | 0.103 | 0.110 | 0.251 | 0.158 | 0.647 | 1.329 |
| Ilex-SSR-69 | 7.000 | 3.798 | 1.522 | 0.705 | 0.715 | 0.018 | 0.014 | 0.130 | 0.118 | 0.810 | 1.871 |
| Ilex-SSR-74 | 4.357 | 2.158 | 0.924 | 0.468 | 0.487 | 0.049 | 0.039 | 0.263 | 0.232 | 0.627 | 0.826 |
| Ilex-SSR-75 | 10.786 | 6.102 | 1.991 | 0.796 | 0.822 | 0.032 | 0.031 | 0.123 | 0.094 | 0.911 | 2.397 |
| Ilex-SSR-79 | 5.071 | 2.777 | 1.181 | 0.585 | 0.611 | 0.036 | 0.042 | 0.232 | 0.198 | 0.737 | 1.010 |
| Mean | 4.831 | 2.573 | 0.977 | 0.440 | 0.488 | 0.142 | 0.163 | 0.333 | 0.223 | 0.587 | 0.870 |
Na: number of alleles, Ne: effective number of alleles, I: Shannon information index, Ho: observed heterozygosity, He: expected heterozygosity, F: fixation index, Fis: inbreeding coefficient of a local population, Fit: overall inbreeding coefficient, Fst: F-statistic, Nm: geneflow, PIC: polymorphism information content.
Table 2.
Mean values of the genetic diversity statistics for 11 microsatellite loci in 14 populations.
Table 2.
Mean values of the genetic diversity statistics for 11 microsatellite loci in 14 populations.
| Population Code | Na | Ne | I | Ho | He |
|---|---|---|---|---|---|
| Southeast | |||||
| WZ | 5.091 | 2.442 | 0.985 | 0.490 | 0.499 |
| LY | 4.000 | 2.221 | 0.835 | 0.468 | 0.454 |
| JR | 5.727 | 2.903 | 1.198 | 0.510 | 0.595 |
| LiA | 5.091 | 2.970 | 1.088 | 0.535 | 0.550 |
| WYS | 5.364 | 2.939 | 0.999 | 0.403 | 0.478 |
| Mean | 5.055 | 2.695 | 1.021 | 0.481 | 0.515 |
| Central | |||||
| JZ | 4.636 | 2.342 | 0.933 | 0.436 | 0.464 |
| JS | 4.273 | 2.198 | 0.809 | 0.380 | 0.402 |
| YL | 4.909 | 2.698 | 0.956 | 0.423 | 0.458 |
| PiJ | 5.818 | 2.932 | 1.141 | 0.469 | 0.535 |
| SC | 6.182 | 2.729 | 1.176 | 0.433 | 0.558 |
| Mean | 5.164 | 2.580 | 1.003 | 0.428 | 0.483 |
| Southwest | |||||
| WS | 4.636 | 2.286 | 0.880 | 0.363 | 0.444 |
| PuJ | 3.636 | 2.338 | 0.774 | 0.385 | 0.412 |
| XP | 4.364 | 2.518 | 1.000 | 0.435 | 0.518 |
| LoA | 3.909 | 2.500 | 0.899 | 0.426 | 0.468 |
| Mean | 4.136 | 2.410 | 0.888 | 0.402 | 0.461 |
Table 3.
Analysis of molecular variance (AMOVA) in 401 individuals from 14 populations.
| Source | Degree of Freedom (df) | The Sum of Squares (SS) | The Mean of Squares (MS) | Est. Var. | Participation/% |
|---|---|---|---|---|---|
| Among Pops | 13 | 515.129 | 39.625 | 0.635 | 18.5% |
| Within Pops | 401 | 939.000 | 2.342 | 2.342 | 81.5% |
| Total | 414 | 1454.129 | 41.967 | 2.977 | 100% |
| FST = 0.185 *** | |||||
***, p < 0.001.
Disclaimer/Publisher’s Note: The statements, opinions and data contained in all publications are solely those of the individual author(s) and contributor(s) and not of MDPI and/or the editor(s). MDPI and/or the editor(s) disclaim responsibility for any injury to people or property resulting from any ideas, methods, instructions or products referred to in the content. |
© 2024 by the authors. Licensee MDPI, Basel, Switzerland. This article is an open access article distributed under the terms and conditions of the Creative Commons Attribution (CC BY) license (https://creativecommons.org/licenses/by/4.0/).
Share and Cite
MDPI and ACS Style
Hou, S.; Zhou, P.; Fang, Y.; Wang, X.; Zhang, M.; Zhang, Q. The Genetic Diversity of Natural Ilex chinensis Sims (Aquifoliaceae) Populations as Revealed by SSR Markers. Forests 2024, 15, 763. https://doi.org/10.3390/f15050763
AMA Style
Hou S, Zhou P, Fang Y, Wang X, Zhang M, Zhang Q. The Genetic Diversity of Natural Ilex chinensis Sims (Aquifoliaceae) Populations as Revealed by SSR Markers. Forests. 2024; 15(5):763. https://doi.org/10.3390/f15050763
Chicago/Turabian StyleHou, Sixuan, Peng Zhou, Yanming Fang, Xuejie Wang, Min Zhang, and Qiang Zhang. 2024. "The Genetic Diversity of Natural Ilex chinensis Sims (Aquifoliaceae) Populations as Revealed by SSR Markers" Forests 15, no. 5: 763. https://doi.org/10.3390/f15050763
Note that from the first issue of 2016, this journal uses article numbers instead of page numbers. See further details here.