Article

Distribution Dynamics of Diplopanax stachyanthus Hand.-Mazz. (Mastixiaceae) and Its Implications in Relict Mastixioid Flora Conservation

1
Yunnan Key Laboratory of Plant Reproductive Adaptation and Evolutionary Ecology, Institute of Biodiversity, School of Ecology and Environmental Science, Yunnan University, Kunming 650500, China
2
Southeast Asia Biodiversity Research Institute, Chinese Academy of Sciences & Center for Integrative Conservation, Xishuangbanna Tropical Botanical Garden, Chinese Academy of Sciences, Menglun 666303, China
3
Yunnan International Joint Laboratory of Southeast Asia Biodiversity Conservation, Menglun 666303, China
4
The Key Laboratory of Rare and Endangered Forest Plants of National Forestry and Grassland Administra-tion & The Key Laboratory for Silviculture and Forest Resources Development of Yunnan Province, Yun-nan Academy of Forestry and Grassland, Kunming 650201, China
*
Authors to whom correspondence should be addressed.
These authors contributed equally to this work.
Forests 2024, 15(5), 766; https://doi.org/10.3390/f15050766
Submission received: 7 April 2024 / Revised: 22 April 2024 / Accepted: 24 April 2024 / Published: 27 April 2024

Abstract

:
Climate is a key driver shaping the distribution pattern of organisms. Cenozoic climate change has led to extensive biota turnover. Untangling the distribution dynamics of a representative lineage of flora can provide deep insights into biodiversity conservation. Diplopanax is a notable relict lineage of the Tertiary mastixioid flora with abundant fossils in the Northern Hemisphere. Diplopanax stachyanthus Hand.-Mazz. is a representative relic lineage of the mastixioid flora, which was once widespread in the Northern Hemisphere of the early Tertiary period, but with only endemic distribution in the (sub)tropical humid forests of East Asia. It offers a unique chance to understand how climatic drivers shape the Boreotropical flora. In this research, we investigated the distribution dynamics of D. stachyanthus at the last glacial maximum (LGM), mid-Holocene (MH), current, and three periods of the future (2041–2060, 2061–2080, and 2081–2100) at four shared socio-economic emissions scenarios pathways. Our results indicated that the Precipitation of the Wettest Quarter (32.6%), the Precipitation of the Driest Quarter (21.2%), and the Precipitation of the Coldest Quarter (17.3%) are the key factors affecting its distribution. The current high suitable distribution areas are primarily in southern China and northern Indo-China. The enforced winter monsoon seasons in East Asia since the late Pliocene period are the key climatic drivers reducing its once widespread distribution in the Northern Hemisphere. Under future scenarios, centroid transfer analysis suggests that its distribution center will shift southwestward, but the potentially suitable habitats in the coastal regions of southern China and northern Indo-China will be lost. These coastal populations should be prioritized for ex situ conservation. Expanding the nature reserve within its long-term stable distribution range in southwest China is an effective strategy for the in situ conservation of the ancient mastixioid flora.

1. Introduction

Climate plays a pivotal role in shaping the distribution patterns of organisms [1]. In the future, drastic climate fluctuations will affect the suitable distribution areas of species, leading to habitat fragmentation and intensifying biodiversity loss [2,3,4]. The Sixth Assessment Report of the IPCC underscores that, unless there is a marked reduction in global greenhouse gas emissions, the objective of constraining warming to below 2 °C will remain unattainable [5]. Earlier research has indicated that a 2 °C temperature increase may result in a 16% reduction in distribution areas [6] and an increasing risk of species extinction [7,8,9]. The upsurge in anthropogenic climate change has accelerated habitat loss and fragmentation, especially for endangered species [10].
The warm and humid climate of the Northern Hemisphere during the Early Tertiary period once maintained a large number of plant species distributed in mid-to-high latitudes and around the north [11]. Cenozoic climate change, especially Quaternary glaciation, caused Tertiary relict plants to retreat to the three major glacial refuge areas in East Asia, North America, and southwestern Europe [12,13].
Species adjust their distribution areas in response to climate change to ensure the continuation of their lineage [14]. For example, during the Late Cretaceous and Paleogene periods, Ginkgoes were widely distributed in the high-latitude regions of the Eurasian continent. However, as the climate changed, by the late Miocene period, Ginkgoes had become extinct in North America, followed by their disappearance from Europe after the Pliocene [15]. Subsequently, due to the effects of the Quaternary glaciation, the current distribution patterns were gradually formed. Similar situations occurred in the distribution range formation processes of Davidia [16,17] and Cathaya [18]. During the Paleocene–Eocene period, the earth was generally much warmer and more humid than today [19]. The Northern Hemisphere experienced a more equable climate, with minimal latitudinal temperature gradients [20]. The Arctic was relatively warm, supporting forests instead of ice caps [21]. Tropical rainforests extended into higher latitudes [22]. Followed by the drastic climate dry and cold shift at the Eocene–Oligocene boundary [23] and the continuous cooling during the Oligocene and the Neogene periods [24], these Boreotropic lineages retreated to the southern refugia and (or) experienced regional extinction resulted in disconnected distribution [24]. Nevertheless, the time and formation of the Northern Hemisphere disjunction concealed a complicated nature, which involved the ancient vicariance, long distance dispersal, or a combination of both [25,26,27,28]. All these studies provide a deep understanding of the key drivers that shape the Northern Hemisphere plant diversity pattern.
Among the Northern Hemisphere disjunctions, less attention was placed on the disjunction between the Asian endemic (sub)tropical lineages and their widespread fossils. The masitixioids, also known as Mastixioideae [29], is allied to Cornaceae, with two extant genera of evergreen trees, Mastixia Blume and Diplopanax Hand.-Mazz. [30,31]. Mastixioids are currently only native to limited areas of Southeast Asia [29]. They are well-known thermophilous plants and usually occur in primary humid subtropical to paratropical broad-laved evergreen vegetation from a latitude 600–1900 m, generally in moist habitats [31,32]. Currently, due to their fragile climate niche and high productivity, these vegetation have undergone severe degradation and disturbance [33]. The species and quantity of Mastixioid, as well as the distribution range, are constantly shrinking, and some species are on the brink of extinction [34,35,36,37]. For instance, Mastixia caudatilimba C. Y. Wu ex Soong and Mastixia trichophylla W. P. Fang have both been classified as Endangered (EN).
Remarkably, maxitxioids once covered much of the Cenonzic Northern Hemisphere [30,38,39]. Fossil mastixioids have a long evolutionary history and a wide distribution in Europe, spanning from the latest Cretaceous to the Pliocene period (65 Ma—3 Ma) [30,40,41]. The lineage showed striking abundance and diversity in the European Eocene of the middle latitudes [42], but the occurrences of the Oligocene are in southern Europe, e.g., Italya [39], probably in response to the cooling and dry shift at the E–O boundary [11,43]. They eventually disappeared in Europe during the Pliocene period [40], probably due to the continuously cooling in the Late Neogene period [44]. In contrast, the North American masitixioid fossils show low species diversity and have been recognized from the Middle and Late Eocene periods in Oregon (as Mastixicarpum, [45]), the Late Eocene La Port Flora in California, and the Paleocene and Eocene localities in Wyoming, which indicated that mastixioids were widespread in the early Tertiary period of western North America [29]. Such wide distribution of mastixioids in both Europe and North America during the Eocene period might have been facilitated by the North Atlantic Land Bridge (NALB) [46,47]. The paleogeographic pattern of the fossils indicated that mastixioids retreated to the southern refugia during the late Neogene period and eventually arrived in Southeast Asia [30,48]. The mastixioids from the middle Miocene to the early Pleistocene period Siwalik sediments in Arunachal Pradesh eastern Himalaya are the southmost fossils ever found and the first recorded in Asia [49]. Due to the numerous occurrences and abundance in the fossil flora, mastixioids have been conventionally used as a proxy to indicate a warm and humid climate tropical climate [30].
The genus Diplopanax is restrictively distributed in the primary humid forests of Southern China and northern Vietnam [50,51,52] with two extant species. D. stachyanthus is distributed in southern China and northern Indochina (Figure 1), and D. vietnamensis is endemic to Vietnam [29,53].
The fruit morphology of Diplopanax is very diagnostic, e.g., the ellipsoidal woody fruits with a single-seeded boat shaped locule (which is C-shaped locule on the transverse section), elongated germination valve and numerous scattered vascular bundles rather than a single pair of ovular bundles [16], which is easily distinguishable. Its fossils were well recognized in a wide stratigraphic range from the Early Eocene to Miocene periods in Europe [30,41,54,55]; and Eocene west North American [29,45,56]. Nevertheless, the key climatic drivers that shape the distribution of the mastixioids are still not well understood, as there are very limited fossil records in Asia, plus complicated tectonic activities along the Tethys seaway and Asian modern monsoon evolutionary process [49,57,58]. Additionally, the species was also included in the IUCN Red List in 1998 and wascategorized as Vulnerable (VU) based on criterion A1c [59]. Therefore, Diplopanax offered a unique chance to explore the key drivers that shape the distribution dynamics of this ancient tropical mastixiods flora since the Neogene period.
In this study, we employed the Species Distribution Models (SDMs), paleoclimate and paleogeographic database to simulate the distribution dynamics of Diplopanax at the last glacial maximum (LGM), mid-Holocene (MH), and current and future periods, aiming to: (1) untangle the key climatic factors that affect the distribution of D. stachyanthus; and (2) predict the spatial distribution dynamics of D. stachyanthus at different geological times. This study can improve our understanding of the impacts of the climate change on the relic plants in the Asian tropical rainforests and can provide a deep insight into how the climatic drivers have shaped the current distribution of the mastixioid flora for better conservation and forest management in the future.

2. Materials and Methods

2.1. Study Region

The modern center of the suitable habitat of D. stachyanthus is in South China and Southwest China, extending to northern Vietnam and northern Myanmar. Given the large size and limited dispersal ability of D. stachyanthus, we have confined the expansion range of the species to within 5° of its distribution boundaries. The study region was defined using species occurrence data, ranging from 92° E to 123° E and from 10° N to 32° N (Figure 2). The study area is located in the Indian monsoon region, characterized by distinct seasonal variations, including alternating monsoon wind directions, hot and humid summers, as well as dry and cool winters [60].

2.2. Distributional Records of Species and Bioclimatic Variables

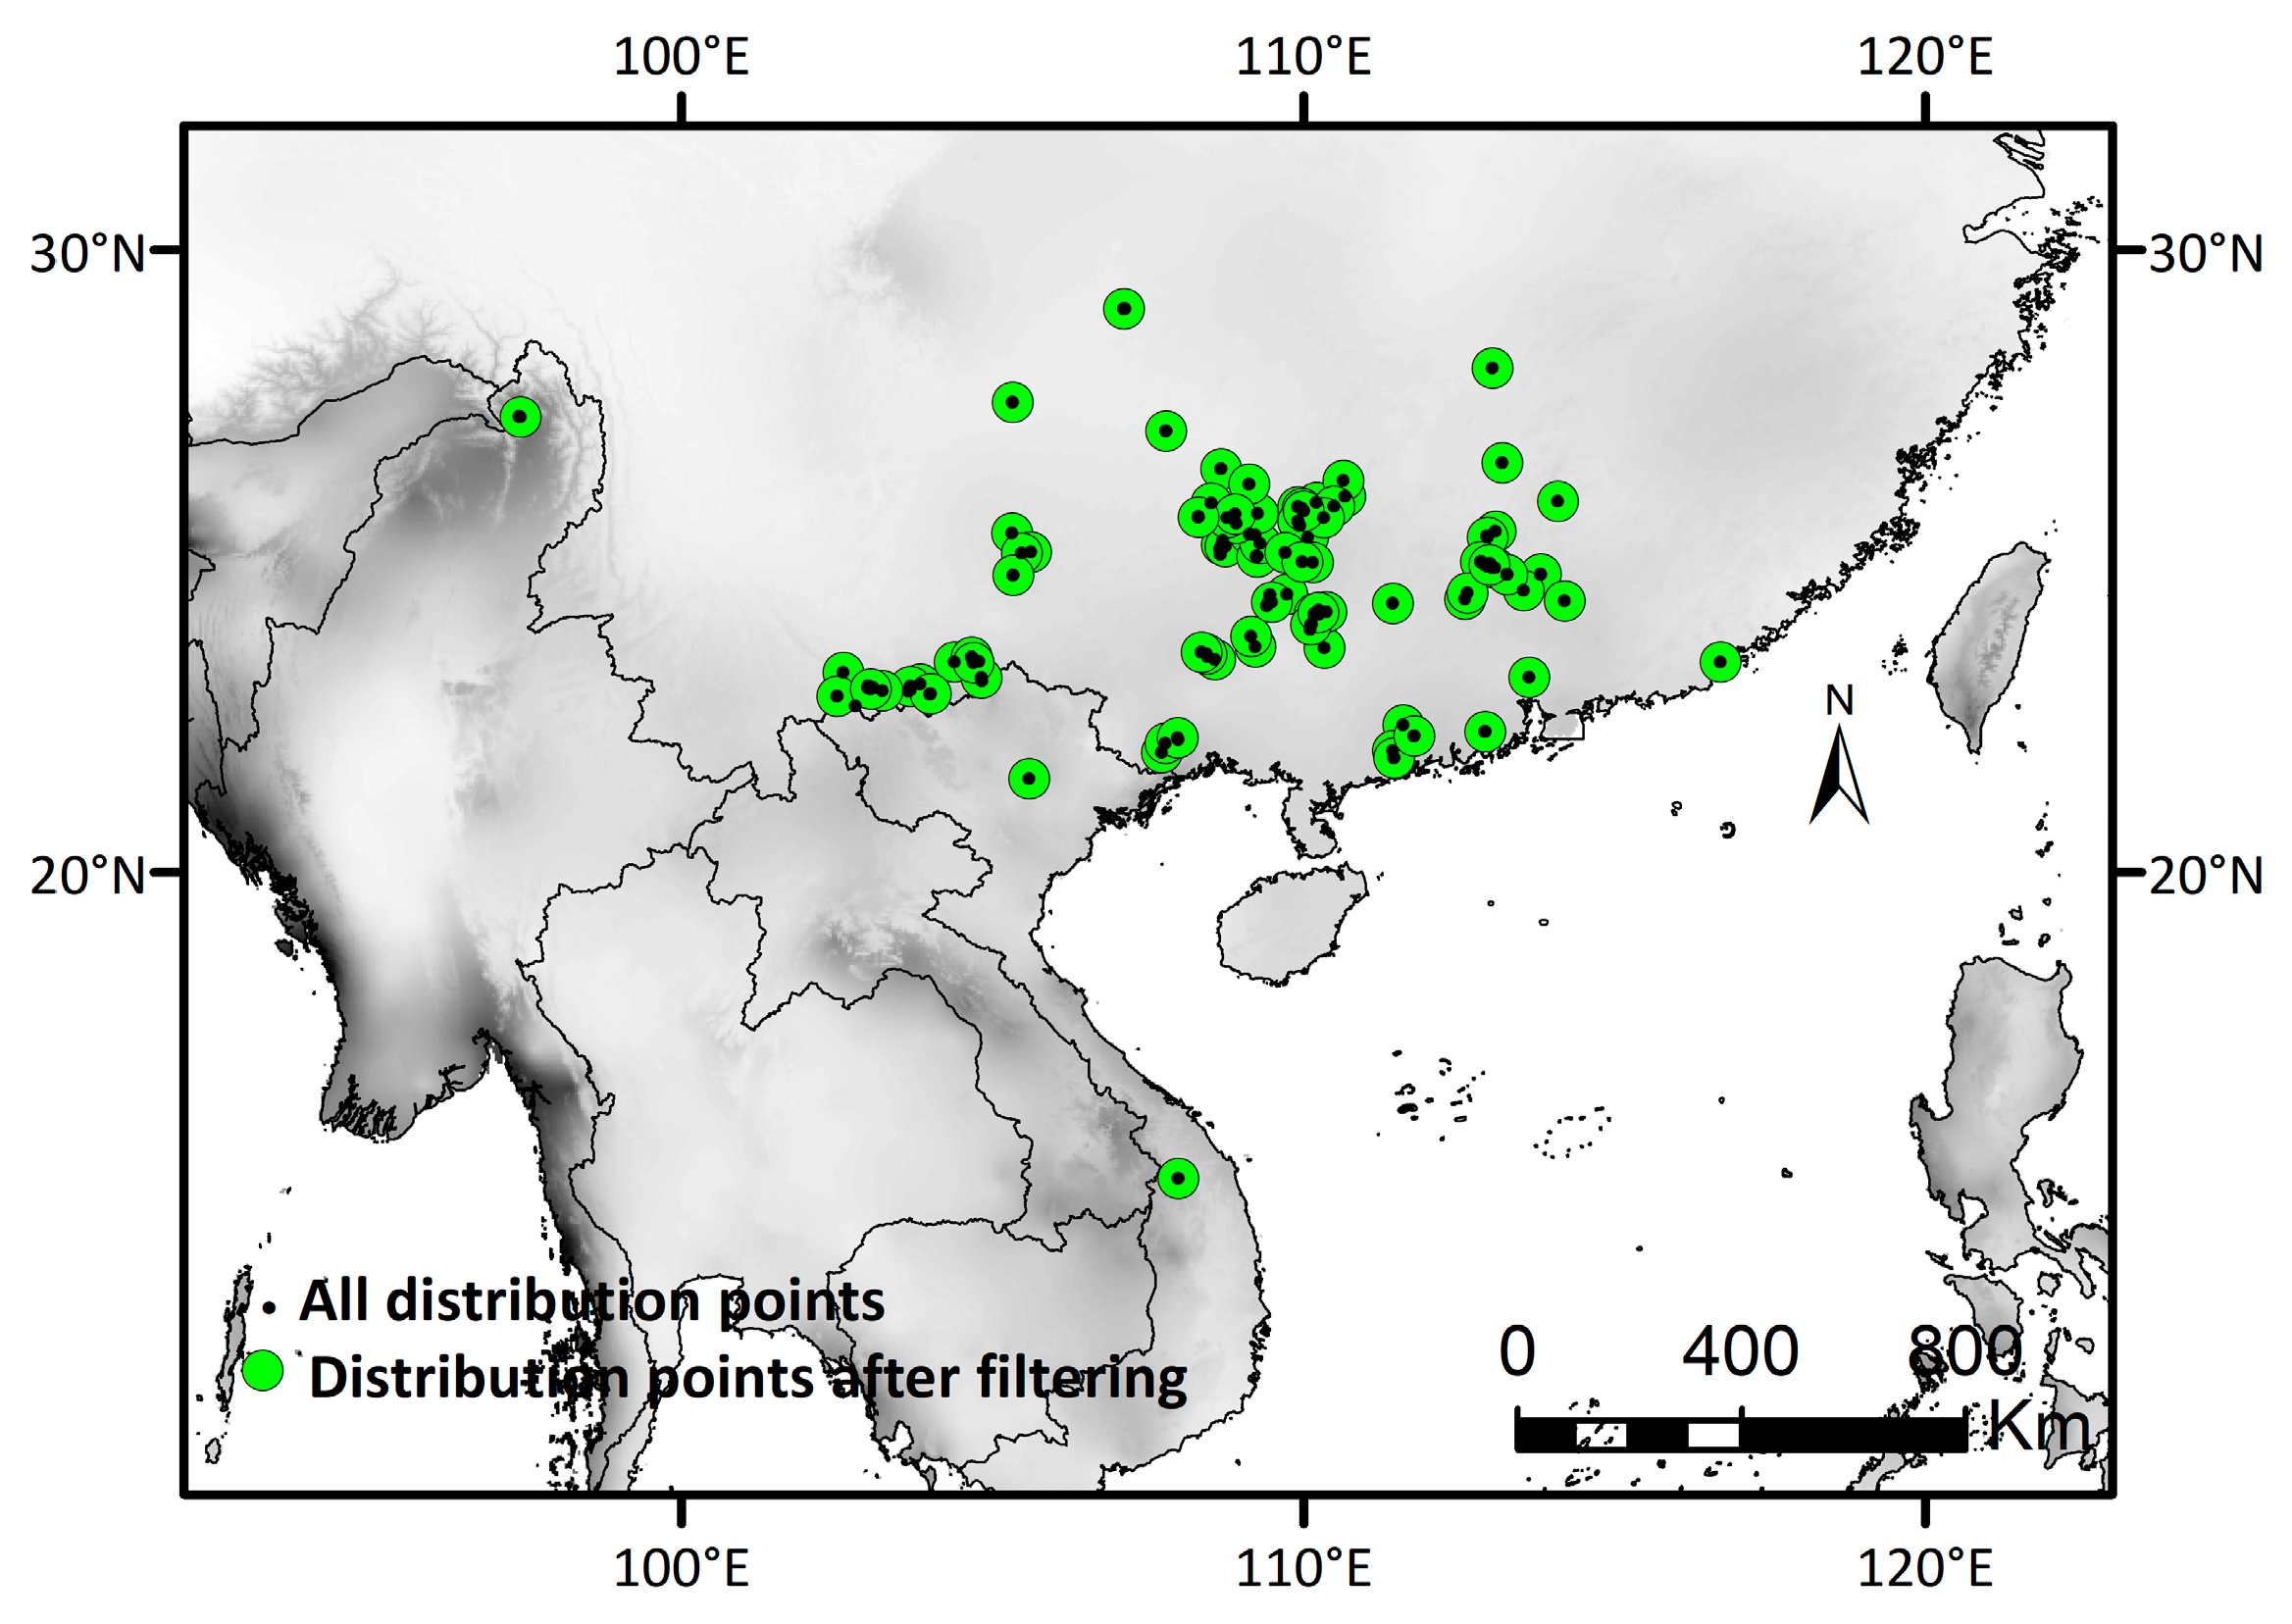
2.2.1. Occurrence Records

Occurrence data were obtained from the Global Biodiversity Information Facility (GBIF; https://www.gbif.org/ (accessed on 15 August 2023)), the Chinese Virtual Herbarium (CVH; https://www.cvh.ac.cn/ (accessed on 15 August 2023)), and our field collection records. For those specimen records without coordinates (longitude and latitude), we manually verified the specific collection location and supplemented the relevant information using Google Earth v2017. We checked the specimen information, deleted duplicate records and specimen records with identification errors, and used a total of 305 distribution records for subsequent analysis (Table S1 and Figure 2). The strong correlation of biological distribution data might cause the deviation in simulative results [61]. In R v4.2.2, we utilized the d‘ismo’ package [62] to randomly retain one point within each 0.2° × 0.2° grid, aiming to reduce the excessive correlation caused by closely located distribution points. Finally, 84 distribution records were reserved for subsequent analysis (Table S1 and Figure 2).

2.2.2. Selection of Bioclimatic Factors

The 19 bioclimatic variables for each period were downloaded from WorldClim (https://www.worldclim.org (accessed on 15 August 2023); 2.5 arc min resolution). Data for the Last Glacial Maximum (LGM) and Mid-Holocene (MH) were sourced from version 1.4, while data for other periods are from version 2.1. The current bioclimatic data uses the average values from 1970 to 2000 [63,64]. GCMEval [65] was used to select the three best-performing global climate models, BCC-CSM2-MR, MIROC6 and MPI-ESM1-2-LR from the Climate Model Intercomparison Project sixth(CMIP6) [66,67]. To reduce the uncertainty associated with specific models [68], we used the average model of the three models to predict the potential distribution of D. stachyanthus for the following three periods (2041–2060, 2061–2080 and 2081–2100) under four shared socio-economic emissions scenarios pathways (SSP1-2.6, SSP2-4.5, SSP3-7.0 and SSP5-8.5). The potential habitat of D. stachyanthus during the LGM and MH periods was predicted using the average of the MPI–ESM–P, MIROC–ESM, and CCSM4 models.

2.3. Bioclimatic Variable Selection

To avoid the overfitting problem caused by multicollinearity between climate variables [69], we performed environmental variable contribution and Pearson correlation analyses on bioclimatic variables in R v4.1.0. We retained variables with correlation coefficients |r| < 0.8 [70] and observed that some environmental factors had correlation coefficients exceeding |0.8|. In response, only one variable with a higher contribution was retained and employed in the SDMs [71,72]. For subsequent analysis, six variables were selected to predict the distribution of D. stachyanthus (Tables S2 and S3).

2.4. Model Configuration and Selection

To select the optimal model for species distribution modeling, an evaluation of the performance of 21 ecological niche models within the s‘dm’ package [73] in R was conducted (Table S4). All models used 70% of the distribution data as the training set and the remaining 30% as the test set, with 10 replicates and cross-validation as the run type. The training dataset was used for model calibration, and the testing dataset was used for cross-validation of the model evaluation during the calibration process. We evaluated the performance of the models by actively employing the area under the receiver operating characteristic curve (AUC) and the accurate skill statistic (TSS) [74], where higher AUC and TSS values indicated higher accuracy. When the AUC > 0.9 and the TSS > 0.6, the model performance is considered excellent [75,76]. Random forest (RF) was the model with the highest AUC and TSS values and was, therefore, selected for the subsequent SDM analysis (Table S4).

2.5. Suitability Level Classification and Spatial Changes

In ArcGIS 10.8 [77], we imported the ASCII format results of the distribution areas predicted by RF for each period, facilitating calculation and comparison. Based on the predicted species existence probability values from RF (0–1), the distribution results were reclassified into four regions as follows: no-suitable habitat (0–0.1); low-suitability habitat (0.1–0.3); medium-suitability habitat (0.3–0.6); and high-suitability habitat (0.6–1) [70,78,79]. Subsequently, we utilized SDMtoolbox 2.0 [80] within ArcGIS to analyze the expansion/contraction of the distribution area and converted Maxent’s predicted map into a binary grid layer (unsuitable: 0; suitable: 1). Analyzing the potential distribution of suitable/unsuitable areas under four climate scenarios during different periods, we identified four types of distribution changes: loss, gain, stable, and not suitable [70].

2.6. Centroid Shifts

The analysis of centroid position changes in suitable habitats under the four shared socio-economic emissions scenarios during different periods were calculated using the SDMtoolbox.

3. Results

3.1. Model Performance

The evaluation of 21 models reveals that RF demonstrates the highest AUC and TSS values (AUC = 0.95, TSS = 0.8) (Table S4). Consequently, it is chosen for subsequent D. stachyanthus distribution predictions. Based on RF, the known occurrence points of D. stachyanthus align well with its predicted suitable habitat during the current time period (Figure 3).

3.2. Environmental Variable Contribution

The three most influential bioclimatic variables were bio16 (Precipitation of Wettest Quarter) (32.6%), bio17 (Precipitation of Driest Quarter) (21.2%) and bio19 (Precipitation of Coldest Quarter) (17.3%) (Table 1). The total contribution of bioclimatic variables related to precipitation is 71.1%.

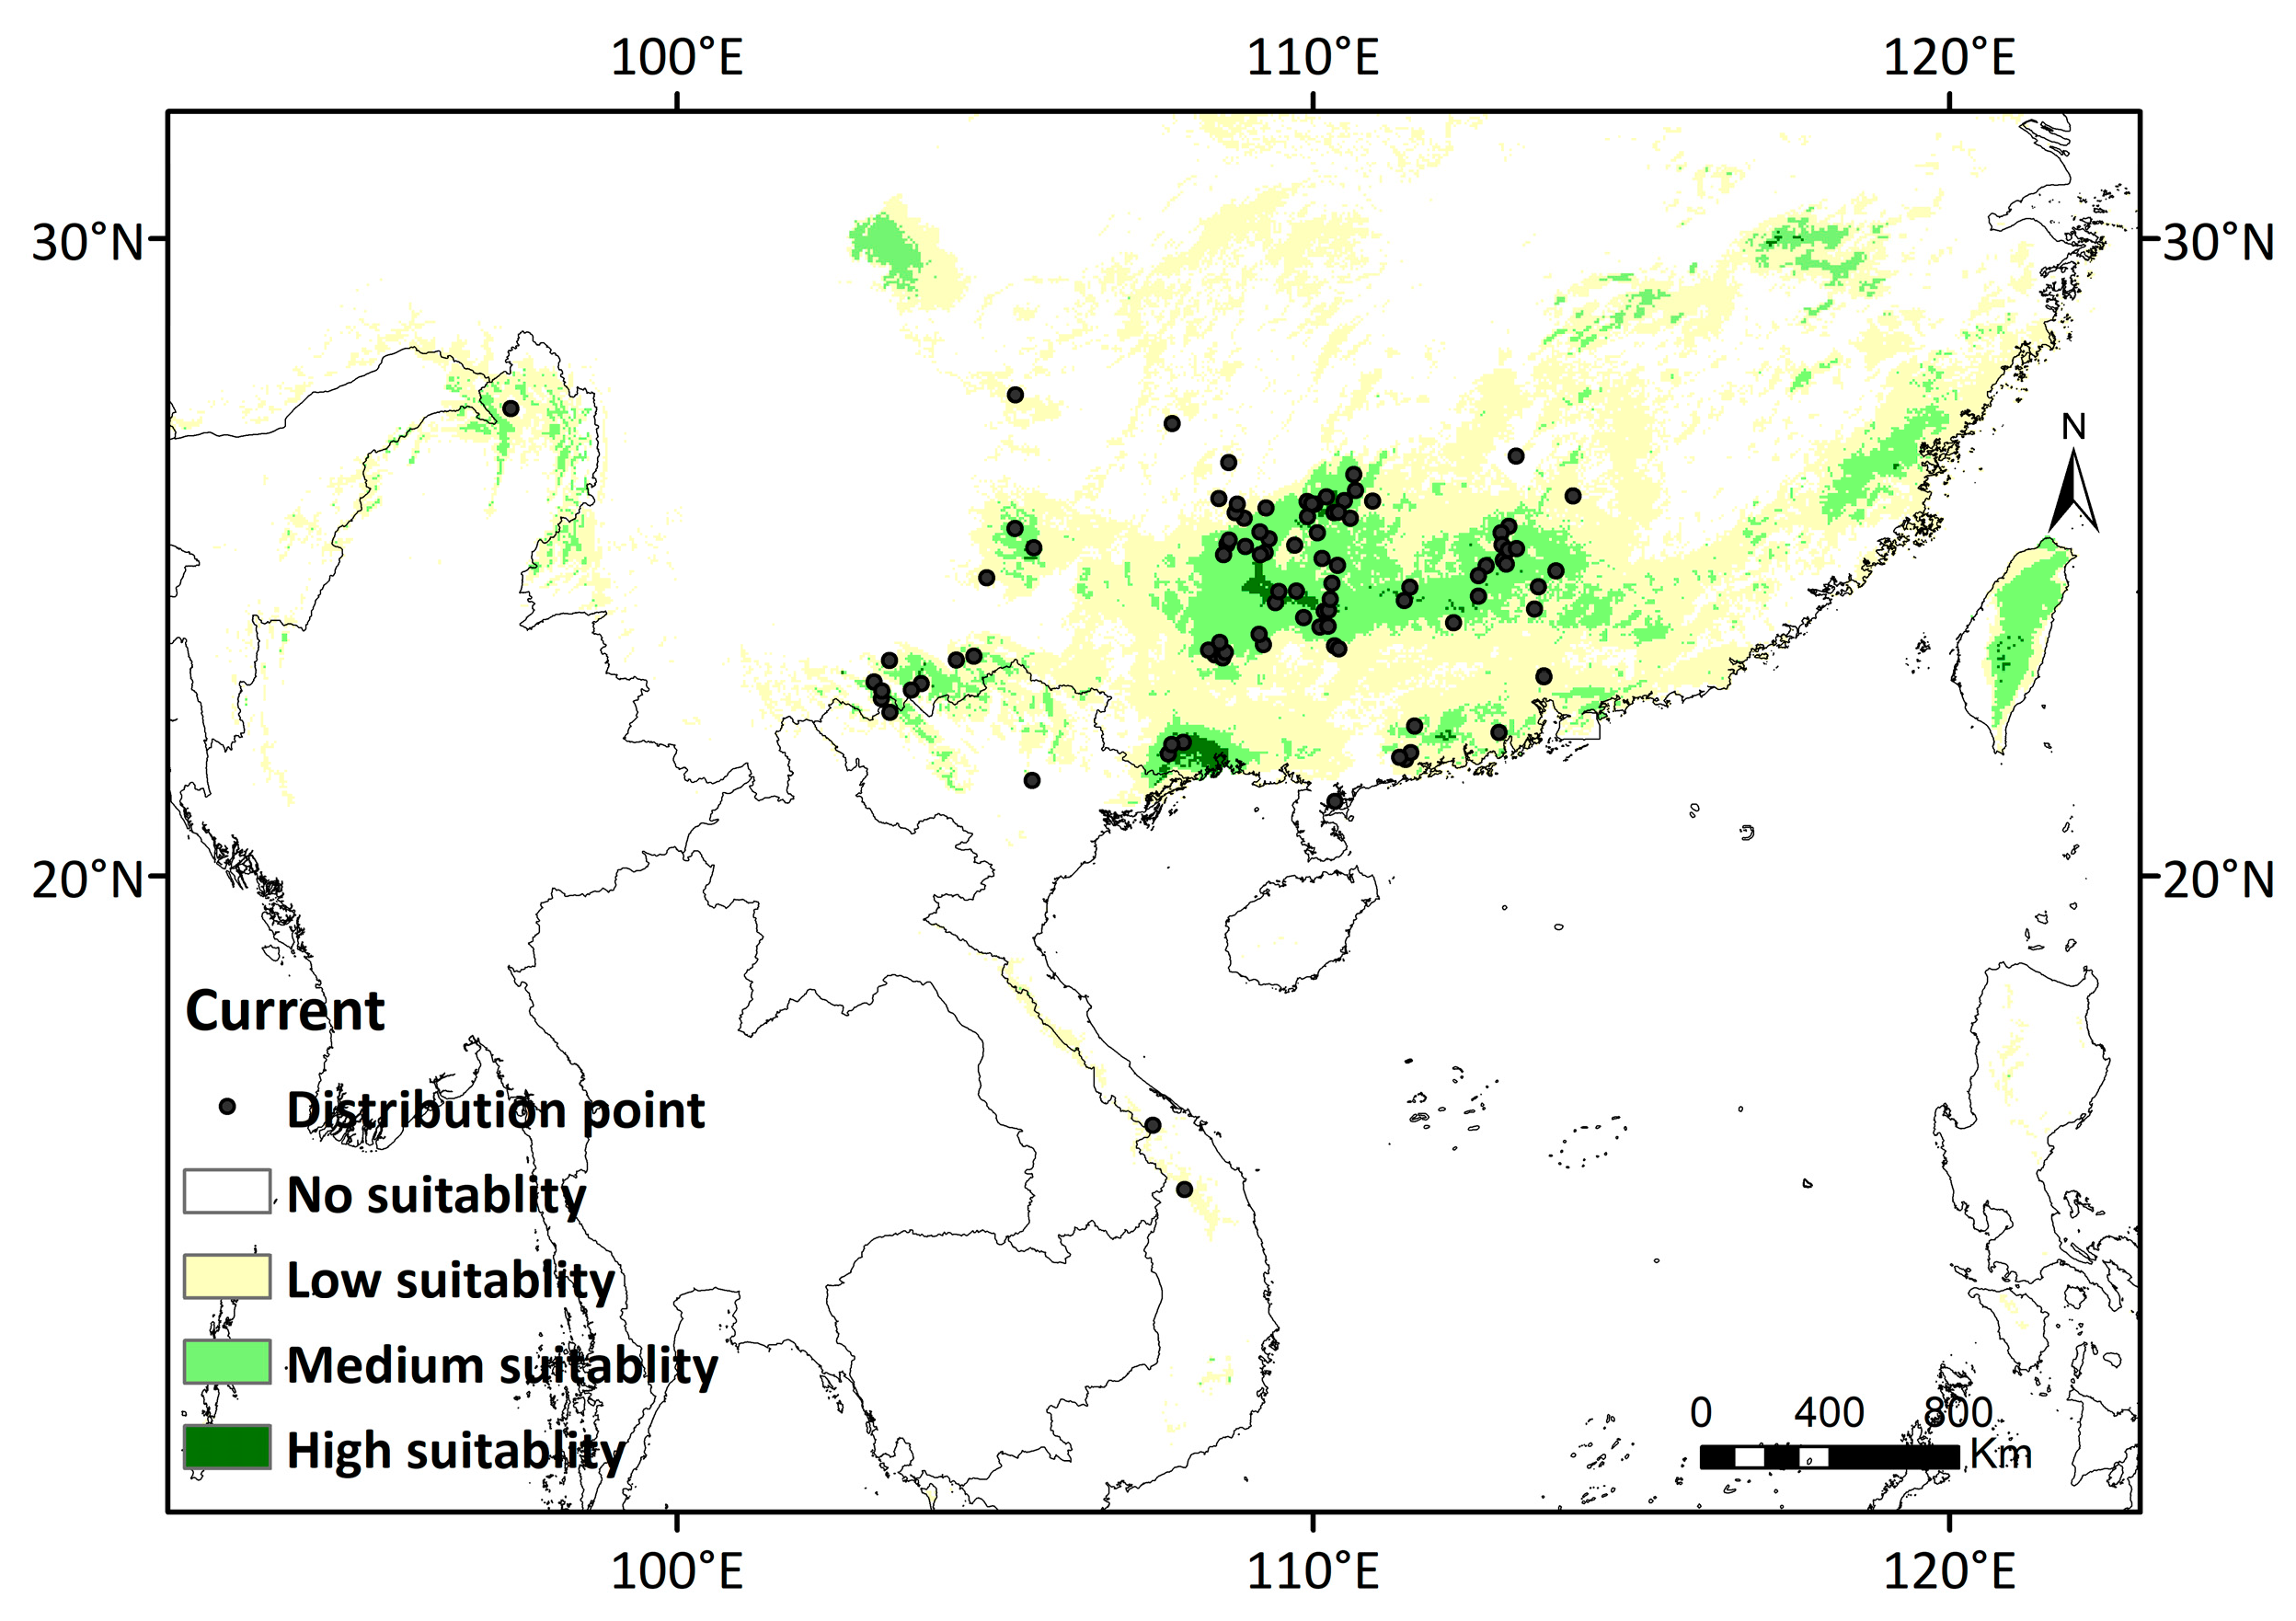
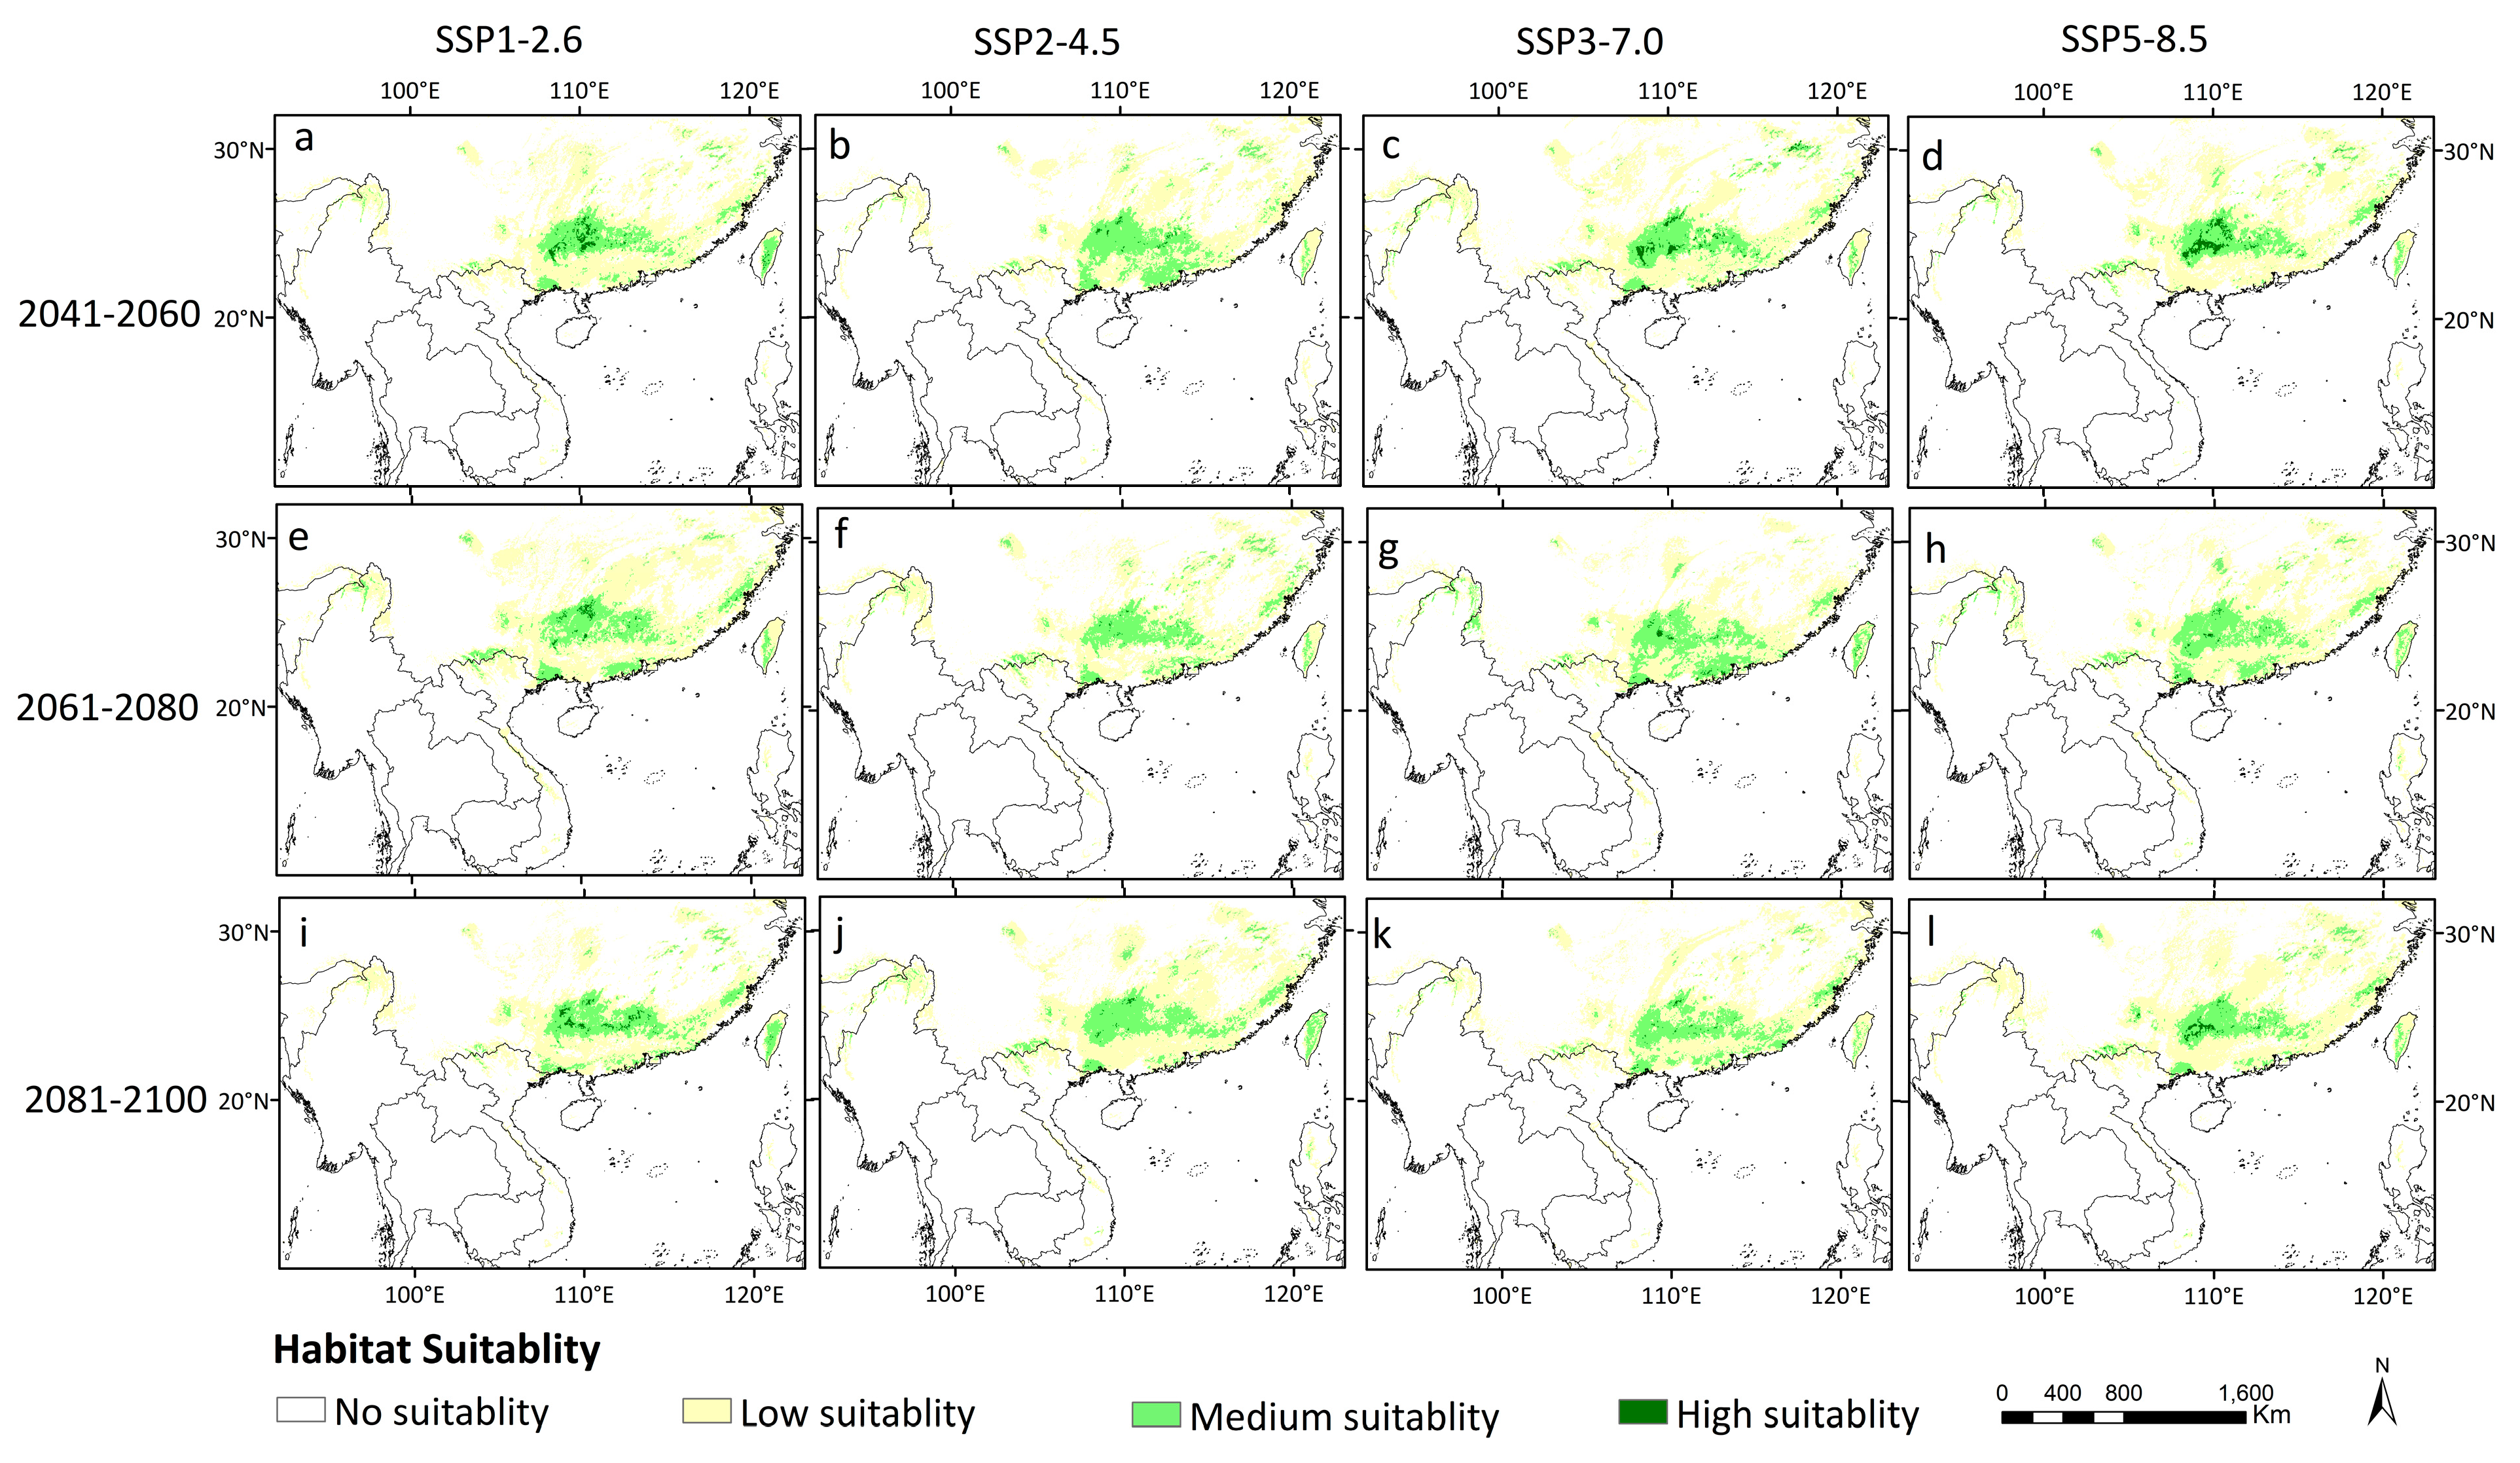
3.3. Potential Distribution of D. stachyanthus under Retrospective, Current and Prospective Climate Conditions

The area of highly suitable habitat for D. stachyanthus was predicted to be 0.779 × 10⁴ km2, mainly in the Guangxi and Guangdong provinces in China during the LGM (Figure 4a).
More than 90% of the highly suitable areas are continuously distributed in the Guangxi province. The potential medium suitable area was 19.807 × 10⁴ km2, which is mainly adjacent to the area of high suitability and mainly covers the Guangdong, Guangxi, and Jiangxi provinces of China (Figure 4a). The predicted potential low suitability areas were 72.477 × 10⁴ km2. The area of potential high suitability sharply increased from the LGM to the MH, which was increased by 134.14% and became 1.824 × 10⁴ km2 (Figure 4b), and was sporadically distributed at the junction of Guangxi, Guangdong, and Hunan provinces in China. The moderately suitable area was 20.668 × 10⁴ km2, mainly located at the periphery of the highly suitable area in Guangxi and the junction area of the Guangxi, Guangdong, and Hunan provinces (Figure 4b and Table 2).
Habitats with potential suitability under current climate conditions are mainly restricted to the mountainous regions along the junction of Guangxi, Guangdong, and Hunan provinces, as well as the southern region of Yunnan (Figure 5).
There was scattered distribution in the Fujian and Zhejiang provinces based on our predictions. The habitats with a potentially high suitability were mainly situated in Northern Indo-China, with a total area of only about 1.113 × 10⁴ km2. The predicted distribution range covered the current occurrence sites, including Taiwan Island (Figure 5 and Table 2). The spatial coverage of the moderately suitable region amounted to 20.391 × 10⁴ km2, bordering the highly suitable area. The low-suitability area spanned an area of 64.470 × 10⁴ km2, primarily located in the regions of Guangxi, Guangdong, Yunnan, Hunan, Chongqing, Fujian and Zhejiang, and extended to northern Vietnam and Myanmar (Figure 5 and Table 2). Overall, the highly suitable and moderately suitable areas were scattered and exhibited an “island-like” discontinuous distribution pattern.
The highly suitable areas under the four climate scenarios showed consistent trends of contraction in the future (Figure 6 and Table 2).
Overall, the potential distribution area of D. stachyanthus was predicted to decrease, with suitable distribution areas mainly concentrated in the Guangdong, Guangxi, Yunnan and Fujian provinces of China, northern Myanma, and Vietnam. In addition, RF analysis predicted that southern China (especially the Guangdong and Guangxi provinces) had especially connected suitable areas for D. stachyanthus (Figure 6).

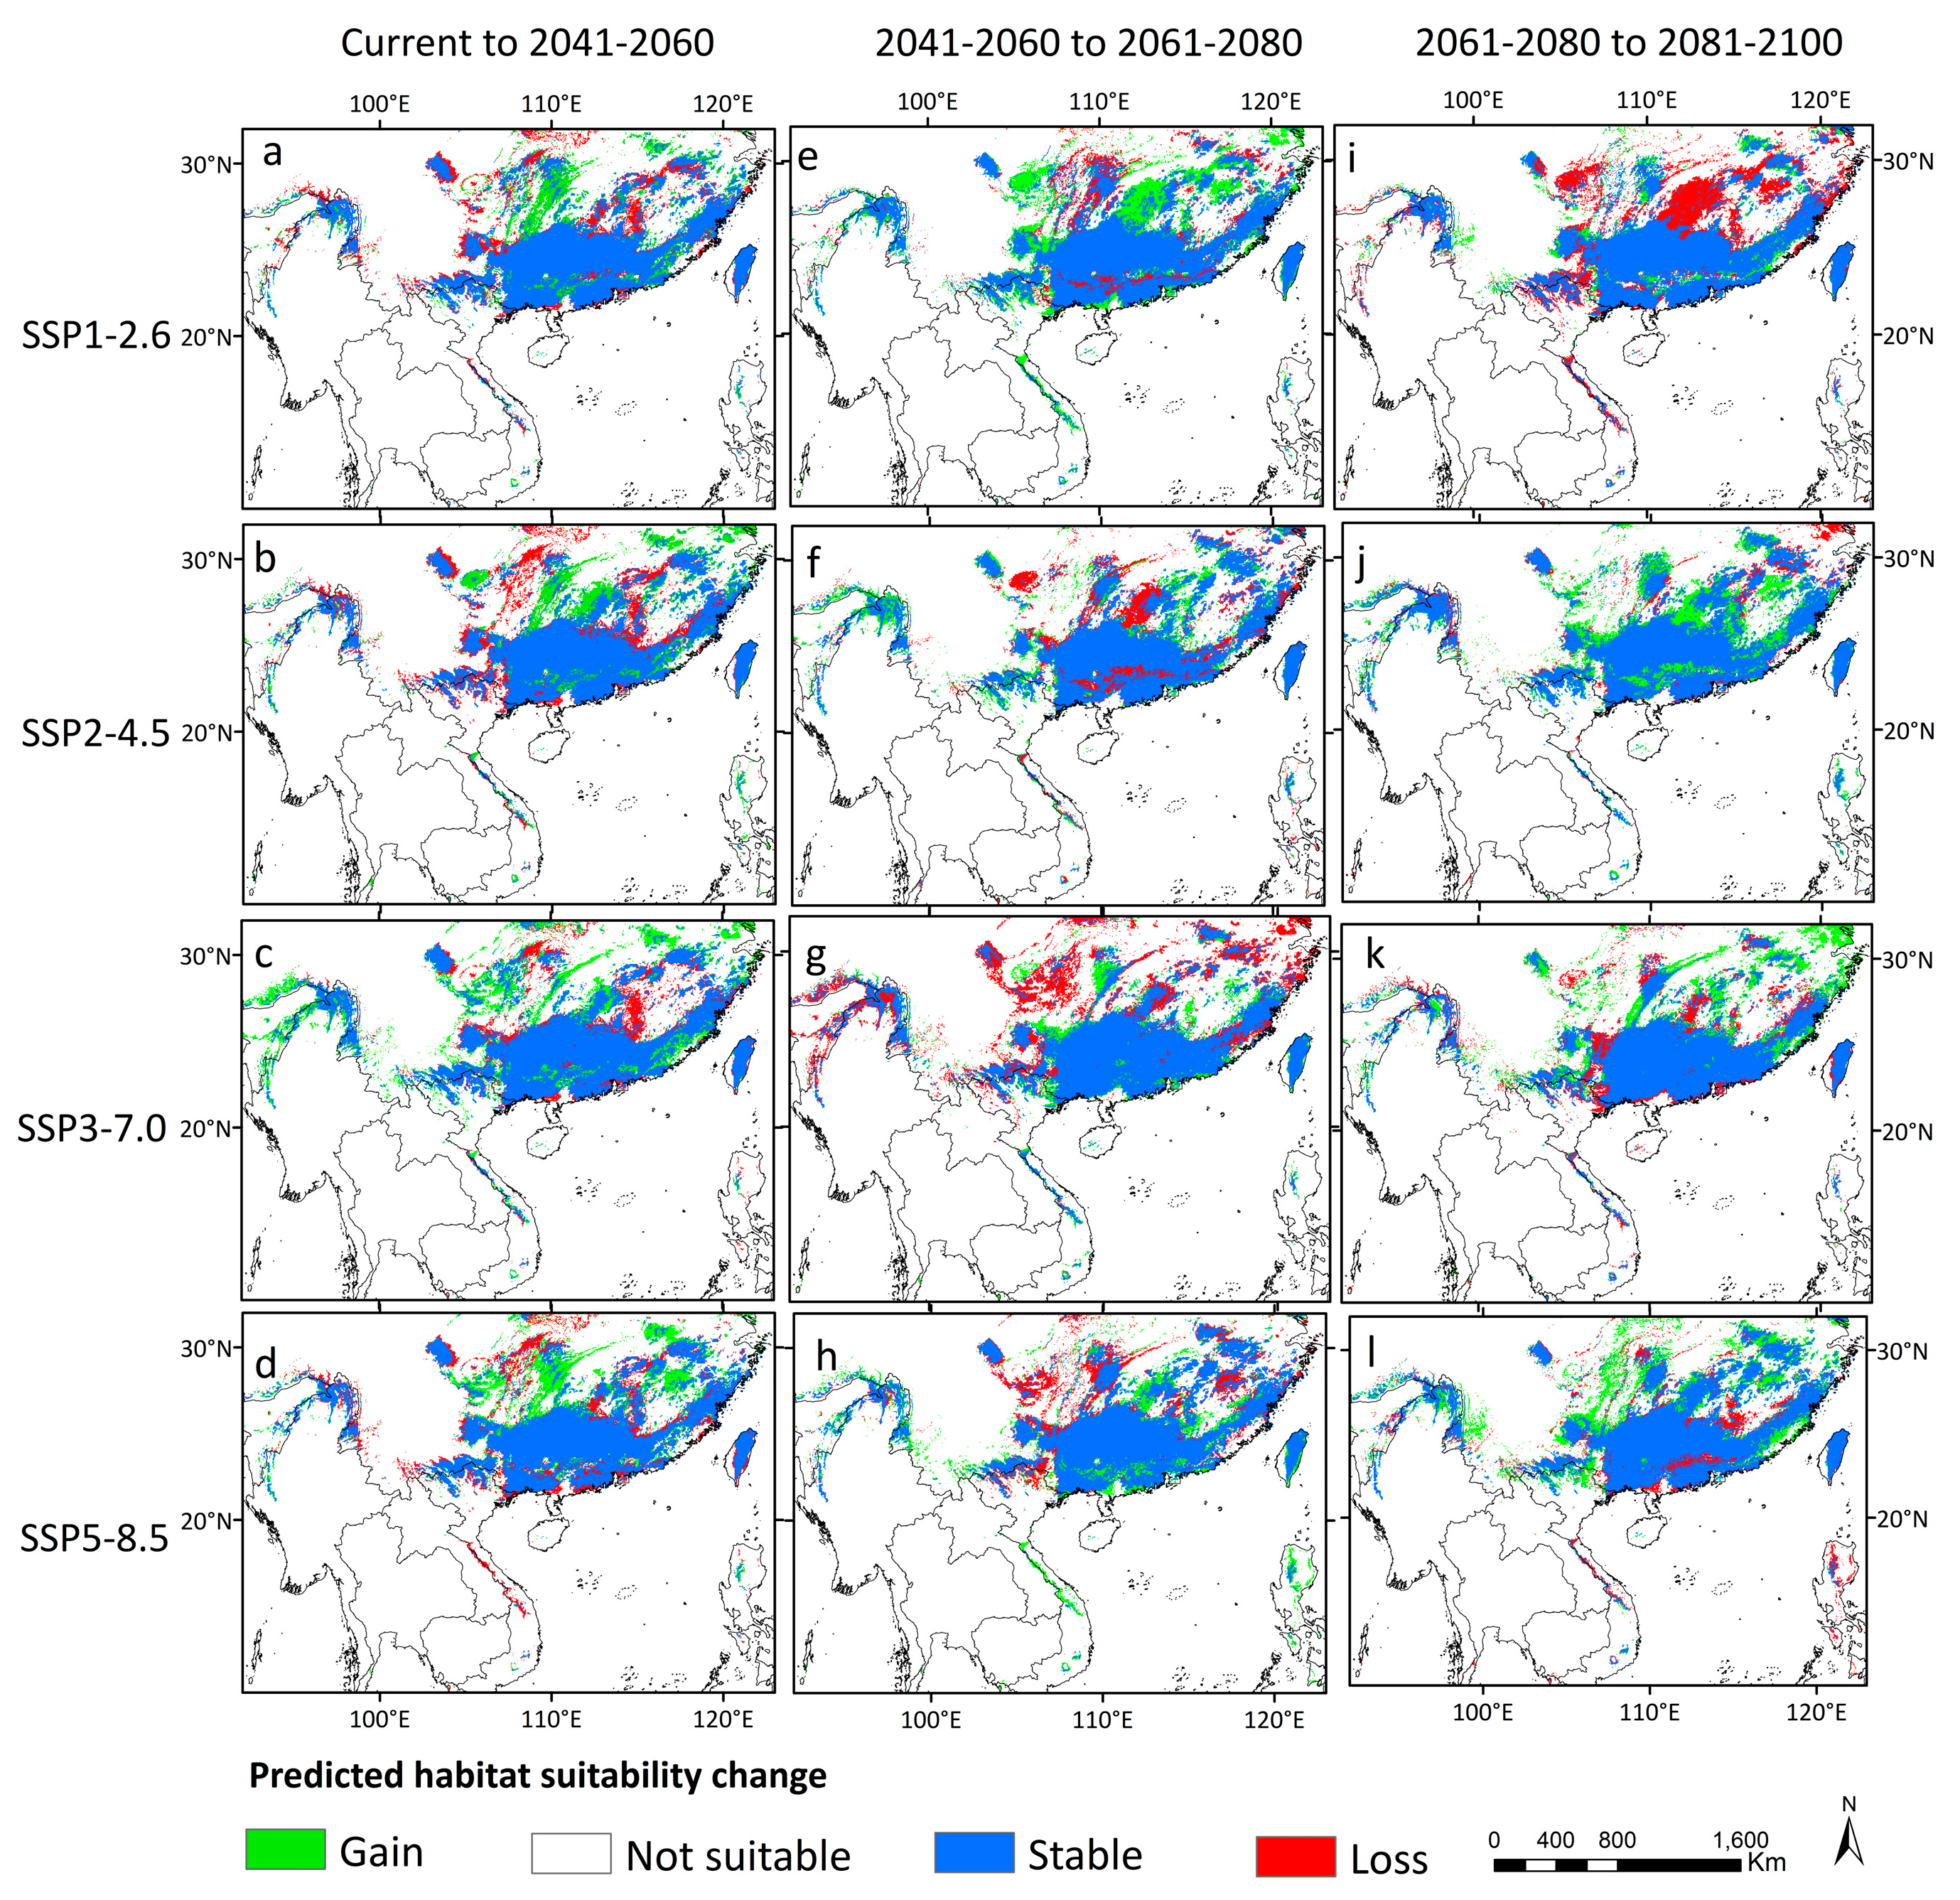
3.4. Distribution Dynamics

By comparing the potential distribution areas from the LGM to the present, our results showed that the total distribution area of D. stachyanthus has shown a trend of first increasing and then decreasing (Figure 7).
The species had experienced severe range contraction during MH to the present, with the potential habitats in the eastern coastal areas, large areas in the north, the southwestern peripheral areas, and northern Myanmar contracted. Comparisons of the predicted areas under different paths of sharing scenarios for the present and future periods revealed that the skeletal distribution areas were also more significant than the expanded areas. The overall distribution dynamics still showed a trend of shrinkage in the future (Figure 8).
The predicted expansion areas are mainly distributed in the adjacent areas of the Guangxi, Guizhou, and Yunnan provinces, between the Guangdong and Hunan provinces, and northern Myanmar. The predicted lost areas were mainly in the Guizhou, Hunan, Guangdong, and Guangxi Provinces, as well as large areas of Vietnam. The detailed predicted distribution areas at different geological eras are summarized in Figure 7 and Figure 8.

3.5. Centroid Shift under the Different Climatic Scenarios

The centroid transfer analysis revealed that the distribution center in Indo-China had minimal migration (Figure S1). Overall, in future scenarios, the center of suitable habitats will initially extend to the southwest. Still, the distance and direction of centroids shift will differ under various CO2 emission scenarios. Under SSP1-2.6 and SSP2-4.5 plans, the centroid first moved to the northeast and then southwest, while under SSP3-7.0 and SSP5-8.5 scenarios, the centroid first moves southwest and then northeast.

4. Discussion

4.1. The Primary Climatic Factors Influencing the Distribution of D. stachyanthus

Temperature and water availability are the fundamental factors for an organism [81,82,83]. According to our results, the distribution of D. stachyanthus is primarily affected by precipitation as the main climate factor, while temperature serves as a secondary influencing factor. The cumulative contribution ratio of precipitation factors was 71.1% (Table 1), indicating that precipitation stands out as the most pivotal variable. D. stachyanthus is distributed in warm and humid mixed evergreens and deciduous broad-leaved forests of mid to high altitude montane areas in southern China [84]. This region is under the Indian summer monsoon regime [85,86]. Summer is warm with sufficient rainfall, which meets the growth needs of D. stachyanthus during its growth period [84]. Field observations revealed that most D. stachyanthus thrived along riverbanks and valleys. Its fruits are large, averaging 47.97 mm in length, 26.64 mm in diameter, and 16.07 g in weight. They are characterized by a prolonged ripening process and seeds with a hard woody shell that inhibits germination [52,86]. Seedlings or young trees are seldom observed in these forests, suggesting the ageing of the population and regeneration difficulties [87]. Seed germination test indicated that the germination rate of D. stachyanthus is only 10% in the wild [84] and only 56% even under controlled conditions (i.e., incubation for 450 days in a humid environment after 165 days of wet sand storage in room temperature) [88]. A long germination period and delayed seed ripening process render this species susceptible to water scarcity. Consequently, drought conditions, likely exacerbated by climate change, may significantly impact the population dynamics and species’ distribution range. Similarly, the seed of Davidia involucrate Baill necessitates a prolonged moist condition to mitigate the physical barrier presented by the thick woody nutshell. This is crucial for ensuring seed moisture during the extended period of embryo ripening and fruit, thereby diluting the fruit’s chemical inhibitors during germination [89,90]. Consequently, optimal humidity levels and a stable environment may be vital for regenerating these Tertiary relict plants of Cornales.
Paleoclimatic reconstructions indicated that the fossils of Diplopanax were predominantly located in areas with warm and humid climates. This stable and humid climate has been sustained in Europe from the Eocene period, until the Pliocene period, and in North America until the late Miocene period [41,91,92,93]. Abundant fossil records have been extensively documented in Europe and North America [29,45,94]. The genus had a broad distribution across North America and Europe during the Paleogene period, coinciding with the warm and humid climate conditions. This was until the late Neogene period, when global climatic cooling and aridification led to habitat fragmentation [13]. Its distribution in Europe persisted until the Pliocene period, as fossils with close affinities to Dioplopanax were still found in S. Pedro da Torre deposits (Portugal) [95] and the fossil flora of Turow near Bogatynia (Poland) [48]. This evidence suggested that a warm and humid climate was still prevalent in these regions during the Late Neogene period, and a semiarid shift in these regions was relatively recent [92].
The analysis of 65 relict families in China and their key distribution restricting factors revealed that precipitation is the predominant factor influencing the distribution of over half of the relict plant lineages in China [12], which aligns with D. stachyanthus. The intensification of seasonality and the enhancement of the East Asian winter monsoon since the Pliocene period [96] were the primary drivers for the replacement of these relict lineages by the dominant tree species (e.g., Fagaceae, Lauraceae, Theaceae, Magnoliaceae) in East Asian subtropical mixed evergreen and deciduous broad-leaved forests (MEDBFs) in the ecosystems. Future global warming and changes in drought conditions in southern China and northern Indo-China will cause the distribution range of D. stachyanthus to shift southwestward into the montane regions. This migration trend is consistent with other relict plants adapted to humid and stable climates, e.g., Metasequoia Hu and W.C.Cheng and Shaniodendron M. B. Deng, H. T. Wei and X. Q. Wang [12,97,98,99], whereas the relict plants sensitive to temperature changes rather than humidity changes will gradually migrate towards higher latitudes in the north [100,101], such as Alsophila spinulosa (Wall. ex Hook.) R. M. Tryon [102], and Metasequoia glyptostroboides Hu and W. C. Cheng [103].
Despite the varying distribution dynamics of the relict plants, their suitable habitats will steadily diminish due to their narrow ecological niches [12,101]. The rapid climate changes make it impossible for these ancient lineages to adapt to the new environments or disperse to recent locations in a short period.
A growing body of evidence suggests that climatic seasonality variations significantly influence the forest structure and function, especially in mountain ecosystems [104,105,106,107]. The importance of temperature seasonality over precipitation seasonality in explaining the total variation of the occurrence of the dominant tree species in East Asian subtropical MEDBFs was detected to be five times greater [108]. The predominant tree species in mixed forests are generally capable of enduring seasonal drought and daily temperature fluctuations [70,109,110,111,112,113]. These dominant species can tolerate a certain degree of low temperatures and possess seasonal drought resistance capability, resulting in a broader distribution range than the relict plants [111]. The increasing and intensified seasonal drought since the late Miocene has driven these dry-tolerant species to become the dominant lineages in MEDBFs [114]. Meanwhile, relict lineages, which exclusively track the warm and humid climates, have been gradually replaced in the forest ecosystem, and their distribution was restricted to very small regions.

4.2. Distribution Dynamics of D. stachyanthus

During the Pleistocene period, there were periodic alternations between the glacial and interglacial periods that greatly affected the distribution of plants [14,47]. The last glacial maximum had the most significant impact on the distribution ranges of plants [16,115,116]. During this period, the temperature dropped sharply, and ice sheets covered a large area of the continents [117], forcing the plants to migrate to the southern low latitudes or retreat to the cryptic refugia for survival [98,118]. Our prediction inferred that D. stachyanthus had a significant continuous suitable habitat in the subtropics of China during the LGM, with limited fragmentation. East Asia did not experience the development of a continental ice sheet during the LGM [119,120,121]. The biota was less affected by the climatic extremes at this time [122,123]. The long-term stable climate in East Asian (sub)tropics made these areas a refugia to preserve these ancient lineages [116]. A recent spatial population genetic study on D. stachyanthus revealed two main refugia in Southwest and South China [57], consistent with our predicted high suitability regional distribution during the LGM period, indicating that our prediction is accurate.
From the LGM to the MH, the range of highly habitats suitable for D. stachyanthus underwent a notable expansion. According to prior research, the extent of monsoon regions and the magnitude of monsoon precipitation in China were both greater during the MH period compared to the LGM. This warmer and wetter climate was more conducive to the survival of D. stachyanthus, aligning well with its ecological preferences [124].
Under the future scenarios, the high suitability area of D. stachyanthus located at the border between Guangdong and northern Guangxi, Guizhou and Hunan will be maintained. Still, the potential habitat in the coastal areas of southeast China and north Indo-China is expected to be lost. Therefore, there is an urgent need for the ex situ conservation of coastal populations to maintain a high level of genetic diversity of this species.

4.3. Conservation and Forestry Management

D. stachyanthus, an endangered species native to China and Northern Vietnam, is currently listed on the IUCN Red List [59]. Our research simulated and predicted the potential distribution of suitable habitats for D. stachyanthus. The results suggest that the currently identified highly suitable habitat area for D. stachyanthus is 10.991 × 10⁴ km2, making up only 7.52% of the overall suitable territory. This area is located at the border between Guangdong, northern Guangxi, and Guizhou, Hunan, and represents a long-term stable distribution area for D. stachyanthus in the future. Population genetic studies revealed that populations in this area possess the highest genetic diversity and most private haplotypes, representing a distinct genetic composition [57]. Therefore, the populations in this area should be prioritized for in situ conservation. However, our predictions revealed that the distribution of D. stachyanthus in the coastal areas of southeast China and northern Indo-China would decrease in the future. These areas are highly urbanized and severely impacted by human interference. Even the moderately suitable area of D. stachyanthus in this region could gradually diminish. Therefore, ex situ conservation is needed to conserve the genetic integrity of D. stachyanthus, introducing the populations to botanical gardens and nurseries and transplanting the germplasm to long-term stable similar habitats.
Other mastixioid flora species, which exhibit similar seed characteristics and habitat preferences to D. stachyanthus [125], possess narrower distribution ranges and smaller population sizes compared to the latter [126]. Mastixia euonymoides Prain, for instance, has been surveyed to reveal merely 10 distinct populations, with its natural population size and scale already falling below the critical threshold of the minimum viable population. Alarmingly, nearly half of its populations lack seedlings, pointing to considerable challenges in natural regeneration. Consequently, these species appear to face a higher level of threat than D. stachyanthus, underscoring the urgent need for intensified research efforts in the future to establish a theoretical framework for devising effective conservation strategies.

5. Conclusions

The Precipitation of the Wettest Quarter, Precipitation of the Driest Quarter and Precipitation of the Coldest Quarter are the three principal climatic factors that account for over 70% of the distribution pattern of D. stachyanthus. This suggests that humidity and stable climate conditions are the significant limiting factors for D. stachyanthus. The main areas with highly suitable habitats for D. stachyanthus are situated in the south and southwest of China. However, the regions highly suitable for D. stachyanthus in the southeast and north are expected to decrease, with the centroids forecasted to shift southwestward. Since D. stachyanthus is adapted to highly humid environments, and its seeds are sensitive to drought, these factors may hinder its population regeneration. Given its limited dispersal ability, habitat fragmentation, and anticipated aridification, the threatened status of mastixioid tree species like D. stachyanthus might be much higher than previously expected. To secure the long-term survival of D. stachyanthus and the ancient mastixioid flora, there are two key strategies suggested: (1) in situ conservation by expanding the protected areas (PA) to cover its future core distribution areas and protecting the long-time stable habitats of D. stachyanthus; and (2) ex situ conservation by establishing germplasm collections and transplanting seedlings to their future high-suitability habitats in the southwest.

Supplementary Materials

The following supporting information can be downloaded at: https://www.mdpi.com/article/10.3390/f15050766/s1, Figure S1. The centroid distribution of D. stachyanthus in different periods. Table S1: Distribution records of Diplopanax stachyanthus; Table S2: Percent contributions of the bioclimatic in the species distribution models for Diplopanax stachyanthus; Table S3: Results of Pearson correlation analysis of 19 bioclimatic variables for Diplopanax stachyanthus; Table S4: Evaluation results of species distribution models for Diplopanax stachyanthus.

Author Contributions

Conceptualization: M.C., Y.Y., L.L., Y.Z., M.D. and Y.T.; data curation: M.C.; formal analysis: M.C.; methodology: M.C., Y.Y., L.L., Y.Z., M.D. and Y.T.; software: M.C., Y.Y. and L.L.; visualization: M.C. and Y.Y.; writing original draft: M.C. and Y.Y.; writing review and editing: M.C., Y.Y., Y.Z., M.D. and Y.T. All authors have read and agreed to the published version of the manuscript.

Funding

This research was funded by the West Light Foundation of the Chinese Academy of Sciences, grant number 2019, National Natural Science Foundation of China, grant numbers 31970223 and 31972858, the Project of the Southeast Asia Biodiversity Research Institute, the Chinese Academy of Sciences, grant number Y4ZK111B01, Transboundary cooperation on biodiversity research and conservation in Gaoligong Mountains, grant number E1ZK251, Yunnan Special Project on Constructing Science and Technology Innovation Center Oriented to South and Southeast Asia, grant number 202303AK140009, the Project of Yunnan Wildlife Conservation, grant number 2023SJ09X-05, the Fund of Key Laboratory for Silviculture and Forest Resources Development of Yunnan Province, Yunnan, Academy of Forestry and Grassland, grant number KFJJ21-05.

Data Availability Statement

The original contributions presented in the study are included in the article/supplementary material, further inquiries can be directed to the corresponding author/s.

Acknowledgments

The author would like to sincerely thank Jian-Wu Li, Bin Yang, Hong-Bo Ding, Xing-Chi Xie, Qiang Zhang, Quan Yang, Yu-Qiang Chen, Si-Rong Yi, De-Ming He, Guo-Yun Li, Guo-Xing Deng, Dong-Li Quan, and others for their assistance in the collection of Diplopanax stachyanthus samples.

Conflicts of Interest

The authors declare no conflicts of interest.

References

  1. Rotllan, P.X.; Traveset, A. Declining relict plants: Climate effect or seed dispersal disruption? A landscape-scale approach. Basic. Appl. Ecol. 2016, 17, 81–91. [Google Scholar] [CrossRef]
  2. Guo, Y.L.; Zhao, Z.F.; Li, X. Moderate warming will expand the suitable habitat of Ophiocordyceps sinensis and expand the area of O. sinensis with high adenosine content. Sci. Total Environ. 2021, 787, 147605. [Google Scholar] [CrossRef]
  3. Doxford, S.W.; Freckleton, R.P. Changes in the large-scale distribution of plants: Extinction, colonisation and the effects of climate. J. Ecol. 2012, 100, 519–529. [Google Scholar] [CrossRef]
  4. Jochum, G.M.; Mudge, K.W.; Thomas, R.B. Elevated temperatures increase leaf senescence and root secondary metabolite concentrations in the understory herb Panax quinquefolius (Araliaceae). Am. J. Bot. 2007, 94, 819–826. [Google Scholar] [CrossRef] [PubMed]
  5. Wei, B.; Wang, R.L.; Hou, K.; Wang, X.Y.; Wu, W. Predicting the current and future cultivation regions of Carthamus tinctorius L. using MaxEnt model under climate change in China. Glob. Ecol. Conserv. 2018, 16, e00477. [Google Scholar] [CrossRef]
  6. Warren, R.; Price, J.; Graham, E.; Forstenhaeusler, N.; VanDerWal, J. The projected effect on insects, vertebrates, and plants of limiting global warming to 1.5 degrees C rather than 2 degrees C. Science 2018, 360, 791–795. [Google Scholar] [CrossRef]
  7. Ali, H.; Din, J.U.; Bosso, L.; Hameed, S.; Kabir, M.; Younas, M.; Nawaz, M.A. Expanding or shrinking? Range shifts in wild ungulates under climate change in Pamir-Karakoram mountains, Pakistan. PLoS ONE 2021, 16, e0260031. [Google Scholar] [CrossRef] [PubMed]
  8. Huang, Z.B.; Xie, L.N.; Wang, H.W.; Zhong, J.B.; Li, Y.C.; Liu, J.L.; Ou, Z.; Liang, X.X.; Li, Y.S.; Huang, H.Y.; et al. Geographic distribution and impacts of climate change on the suitable habitats of Zingiber species in China. Ind. Crops Prod. 2019, 138, 111429. [Google Scholar] [CrossRef]
  9. Shen, Y.F.; Tu, Z.H.; Zhang, Y.L.; Zhong, W.P.; Xia, H.; Hao, Z.Y.; Zhang, C.G.; Li, H.G. Predicting the impact of climate change on the distribution of two relict Liriodendron species by coupling the MaxEnt model and actual physiological indicators in relation to stress tolerance. J. Environ. Manag. 2022, 322, 116024. [Google Scholar] [CrossRef] [PubMed]
  10. Zhao, X.M.; Ren, B.P.; Li, D.Y.; Garber, P.A.; Zhu, P.F.; Xiang, Z.F.; Grueter, C.C.; Liu, Z.J.; Li, M. Climate change, grazing, and collecting accelerate habitat contraction in an endangered primate. Biol. Conserv. 2019, 231, 88–97. [Google Scholar] [CrossRef]
  11. Tiffney, B.H. Perspectives on the origin of the floristic similarity between eastern Asia and eastern North America. J. Arnold Arbor. 1985, 66, 73–94. [Google Scholar] [CrossRef]
  12. Huang, Y.J.; Jacques, F.M.B.; Su, T.; Ferguson, D.K.; Tang, H.; Chen, W.Y.; Zhou, Z.K. Distribution of Cenozoic plant relicts in China explained by drought in dry season. Sci. Rep. 2015, 5, 14212. [Google Scholar] [CrossRef]
  13. Qiu, Y.X.; Lu, Q.X.; Zhang, Y.H.; Cao, Y.N. Phylogeography of East Asia’s Tertiary relict plants: Current progress and future prospects. Biodivers. Sci. 2017, 25, 136–146. [Google Scholar] [CrossRef]
  14. Milne, R.; Abbott, R. The origin and evolution of Tertiary relict flora. Adv. Bot. Res. 2002, 38, 281–314. [Google Scholar] [CrossRef]
  15. Zhekun, Z.; Momohara, A. Fossil history of some endemic seed plants of East Asia and its phytogeographical significance. Acta Bot. Yunnanica 2005, 27, 449–470. [Google Scholar]
  16. Manchester, S.R.; Chen, Z.D.; Lu, A.M.; Uemura, K. Eastern Asian endemic seed plant genera and their paleogeographic history throughout the Northern Hemisphere. J. Syst. Evol. 2009, 47, 1–42. [Google Scholar] [CrossRef]
  17. Eyde, R.H. Fossil record and ecology of Nyssa (Cornaceae). Bot. Rev. 1997, 63, 97–123. [Google Scholar] [CrossRef]
  18. Liu, Y.S.; Basinger, J.F. Fossil Cathaya (Pinaceae) pollen from the Canadian high arctic. Int. J. Plant Sci. 2000, 161, 829–847. [Google Scholar] [CrossRef]
  19. Heinemann, M. Warm and Sensitive Paleocene-Eocene Climate. Ph.D. Thesis, University of Hamburg, Hamburg, Spain, 2009. [Google Scholar]
  20. Chen, Z.L.; Ding, Z.L. A Review on the Paleocene-Eocene Thermal Maximum. Quat. Sci. 2011, 31, 937–950. [Google Scholar] [CrossRef]
  21. Jovane, L.G.; Coccioni, R.; Marsili, A.; Acton, G. The late Eocene greenhouse-icehouse transition: Observations from the Massignano global stratotype section and point (GSSP). Geol. Soc. Am. Spec. Pap. 2009, 452, 149–168. [Google Scholar]
  22. Collinson, M.E.; Hooker, J.J. Paleogene vegetation of Eurasia: Framework for mammalian faunas. Deinsea 2003, 10, 41–84. [Google Scholar]
  23. Ao, H.; Dupont-Nivet, G.; Rohling, E.J.; Zhang, P.; Ladant, J.B.; Roberts, A.P.; Licht, A.; Liu, Q.S.; Liu, Z.G.; Dekkers, M. Orbital climate variability on the northeastern Tibetan Plateau across the Eocene–Oligocene transition. Nat. Commun. 2020, 11, 5249. [Google Scholar] [CrossRef] [PubMed]
  24. Wang, X.M.; Wang, M.Z.; Zhang, X.Q. Palynology Assemblages and Paleoclimatic Character of the Late Eocene to Early Oligocene in China. Earth Sci. 2005, 30, 309–316. [Google Scholar]
  25. Chen, C.; Qi, Z.C.; Xu, X.H.; Comes, H.P.; Koch, M.A.; Jin, X.J.; Fu, C.X.; Qiu, Y.X. Understanding the formation of Mediterranean–African–Asian disjunctions: Evidence for Miocene climate-driven vicariance and recent long-distance dispersal in the Tertiary relict Smilax aspera (Smilacaceae). New Phytol. 2014, 204, 243–255. [Google Scholar] [CrossRef] [PubMed]
  26. Nie, Z.L.; Sun, H.; Manchester, S.R.; Meng, Y.; Luke, Q.; Wen, J. Evolution of the intercontinental disjunctions in six continents in the Ampelopsis clade of the grape family (Vitaceae). BMC Evol. Biol. 2012, 12, 17. [Google Scholar] [CrossRef] [PubMed]
  27. Xie, L.; Wagner, W.L.; Ree, R.H.; Berry, P.E.; Wen, J. Molecular phylogeny, divergence time estimates, and historical biogeography of Circaea (Onagraceae) in the Northern Hemisphere. Mol. Phylogenetics Evol. 2009, 53, 995–1009. [Google Scholar] [CrossRef] [PubMed]
  28. Zhang, Q.Y.; Ree, R.H.; Salamin, N.; Xing, Y.W.; Silvestro, D. Fossil-informed models reveal a boreotropical origin and divergent evolutionary trajectories in the walnut family (Juglandaceae). Syst. Biol. 2022, 71, 242–258. [Google Scholar] [CrossRef] [PubMed]
  29. Tiffney, B.H.; Haggard, K.K. Fruits of Mastixioideae (Cornaceae) from the Paleogene of western North America. Rev. Palaeobot. Palyno 1996, 92, 29–54. [Google Scholar] [CrossRef]
  30. Eyde, R.H.; Xiang, Q.Y. Fossil Mastixioid (Cornaceae) alive in Eastern Asia. Am. J. Bot. 1990, 77, 689–692. [Google Scholar] [CrossRef]
  31. Matthew, K.M. A revision of the genus Mastixia (Cornaceae). Blumea Biodivers. Evol. Biogeogr. Plants 1976, 23, 51–93. [Google Scholar]
  32. He, J.; Zeng, C.J. Flora of China; Science Press: Beijing, China, 1978; Volume 54. [Google Scholar]
  33. Sodhi, N.S.; Posa, M.R.C.; Lee, T.M.; Bickford, D.; Koh, L.P.; Brook, B.W. The state and conservation of Southeast Asian biodiversity. Biodivers. Conserv. 2010, 19, 317–328. [Google Scholar] [CrossRef]
  34. Stibig, H.J.; Achard, F.; Carboni, S.; Raši, R.; Miettinen, J. Change in tropical forest cover of Southeast Asia from 1990 to 2010. Biogeosciences 2014, 11, 247–258. [Google Scholar] [CrossRef]
  35. Deb, J.C.; Phinn, S.; Butt, N.; McAlpine, C.A. Climate change impacts on tropical forests: Identifying risks for tropical Asia. J. Trop. For. Sci. 2018, 30, 182–194. [Google Scholar]
  36. Estoque, R.C.; Ooba, M.; Avitabile, V.; Hijioka, Y.; DasGupta, R.; Togawa, T.; Murayama, Y.J. The future of Southeast Asia’s forests. Nat. Commun. 2019, 10, 1829. [Google Scholar] [CrossRef] [PubMed]
  37. Zhang, X.Y.; Ci, X.Q.; Hu, J.L.; Bai, Y.; Thornhill, A.H.; Conran, J.G.; Li, J. Riparian areas as a conservation priority under climate change. Sci. Total Environ. 2023, 858, 159879. [Google Scholar] [CrossRef]
  38. Stockey, R.A.; LePage, B.A.; Pigg, K.B. Permineralized fruits of Diplopanax (Cornaceae, Mastixioideae) from the middle Eocene Princeton chert of British Columbia. Rev. Palaeobot. Palynol. 1998, 103, 223–234. [Google Scholar] [CrossRef]
  39. Martinetto, E. The first mastixioid fossil from Italy and its palaeobiogeographic implications. Rev. Palaeobot. Palyno 2011, 167, 222–229. [Google Scholar] [CrossRef]
  40. Mai, D.H. Entwicklung und klimatische Differenzierung der Laubwaldflora Mitteleuropas im Tertiär. Flora 1981, 171, 525–582. [Google Scholar] [CrossRef]
  41. Mai, D.H. On the extinct Mastixiaceae (Cornales) in Europe. Geophytology 1993, 23, 53–63. [Google Scholar]
  42. Seward, A.C. British Museum (Natural History) The London Clay Flora. Nature 1934, 134, 6–7. [Google Scholar] [CrossRef]
  43. Graham, A. Late Cretaceous and Cenozoic History of North American Vegetation: North of Mexico; Oxford University Press: Oxford, UK, 1999. [Google Scholar]
  44. Manchester, S.R. Extinct ulmaceous fruits from the Tertiary of Europe and western North America. Rev. Palaeobot. Palynol. 1987, 52, 119–129. [Google Scholar] [CrossRef]
  45. Manchester, S.R. Fruits and seeds of the Middle Eocene nut beds flora, Clarno Formation, Oregon. Paleoutographica Am. 1994, 58, 1–205. [Google Scholar]
  46. Brikiatis, L. Late Mesozoic North Atlantic land bridges. Earth-Sci. Rev. 2016, 159, 47–57. [Google Scholar] [CrossRef]
  47. Tiffney, B.H.; Manchester, S.R. The use of geological and paleontological evidence in evaluating plant phylogeographic hypotheses in the Northern Hemisphere tertiary. Int. J. Plant Sci. 2001, 162, S3–S17. [Google Scholar] [CrossRef]
  48. Czeczott, H.; Skirgiello, A. Dicotyledoneae. Foss. Flora Turów Near Bogatynia Second. Part Syst. Descr. Plant Remain. No. 4 1975, 24, 25–56. [Google Scholar]
  49. Khan, M.A.; Bera, M.; Spicer, R.A.; Spicer, T.E.V.; Bera, S. First occurrence of mastixioid (Cornaceae) fossil in India and its biogeographic implications. Rev. Palaeobot. Palyno 2017, 247, 83–96. [Google Scholar] [CrossRef]
  50. Handel-Mazzetti, H.F.V. Plantae novae Chingianae. Sinensia 1933, 3, 185–198. [Google Scholar]
  51. Li, Y.L.; Zhu, H.; Yang, J.B. Systematic position of the genus Mastixia: Evidence from rbc L gene sequences. Acta Bot. Yunnanica 2002, 24, 352–358. [Google Scholar]
  52. Zhu, W.H.; Xiang, Q.B. The Origin and Distribution of Genus Diplopanax Hand.-Mazz. J. Nanjing For. Univ. 2001, 25, 35. [Google Scholar]
  53. Averyanov, L.V.; Hiep, N.T. Diplopanax vietnamensis, a New Species of Nyssaceae from Vietnam: One More Living Representative of the Tertiary Flora of Eurasia. Novon 2002, 12, 433–436. [Google Scholar] [CrossRef]
  54. Ševčík, J.; Kvaček, Z.; Mai, D.H. A new mastixioid florula from tektite-bearing deposits in South Bohemia, Czech Republic (Middle Miocene, Vrábče Member). Bull. Geosci. 2007, 82, 429–436. [Google Scholar] [CrossRef]
  55. Manchester, S.R.; Collinson, M.E. Mastixioid fruits (Cornales) from the early Eocene London Clay Flora:morphology, anatomy and nomenclatural revision. Foss. Impr. 2022, 78, 310–328. [Google Scholar] [CrossRef]
  56. Manchester, S.R.; McINTOSH, W.C. Late Eocene silicified fruits and seeds from the John Day Formation near Post, Oregon. PaleoBios 2007, 27, 7–17. [Google Scholar]
  57. Feng, L.; Xu, Z.Y.; Wang, L. Genetic diversity and demographic analysis of an endangered tree species Diplopanax stachyanthus in subtropical China: Implications for conservation and management. Conserv. Genet. 2019, 20, 315–327. [Google Scholar] [CrossRef]
  58. Khan, M.A.; Spicer, R.A.; Bera, S.; Ghosh, R.; Yang, J.; Spicer, T.E.V.; Guo, S.X.; Su, T.; Jacques, F.M.B.; Grote, P.J. Miocene to Pleistocene floras and climate of the Eastern Himalayan Siwaliks, and new palaeoelevation estimates for the Namling–Oiyug Basin, Tibet. Glob. Planet. Chang. 2014, 113, 1–10. [Google Scholar] [CrossRef]
  59. IUCN. Diplopanax stachyanthus. The IUCN Red List of Threatened Species 1998: E.T32339A9699334. Available online: https://www.iucnredlist.org/species/32339/9699334 (accessed on 24 March 2024).
  60. Fang, X.M.; Yan, M.D.; Zhang, W.L.; Nie, J.S.; Han, W.X.; Wu, F.L.; Song, C.H.; Zhang, T.; Zan, J.B.; Yang, Y.P. Paleogeography control of Indian monsoon intensification and expansion at 41 Ma. Sci. Bull. 2021, 66, 2320–2328. [Google Scholar] [CrossRef] [PubMed]
  61. Boria, R.A.; Olson, L.E.; Goodman, S.M.; Anderson, R.P. Spatial filtering to reduce sampling bias can improve the performance of ecological niche models. Ecol. Model. 2014, 275, 73–77. [Google Scholar] [CrossRef]
  62. Hijmans, R.J.; Phillips, S.; Leathwick, J.; Elith, J.; Hijmans, M.R. Package ‘dismo’. Circles 2017, 9, 1–68. [Google Scholar]
  63. Hijmans, R.J.; Cameron, S.E.; Parra, J.L.; Jones, P.G.; Jarvis, A. Very high resolution interpolated climate surfaces for global land areas. Int. J. Climatol. 2005, 25, 1965–1978. [Google Scholar] [CrossRef]
  64. Fick, S.E.; Hijmans, R.J. WorldClim 2: New 1-km spatial resolution climate surfaces for global land areas. Int. J. Climatol. 2017, 37, 4302–4315. [Google Scholar] [CrossRef]
  65. Parding, K.M.; Dobler, A.; McSweeney, C.F.; Landgren, O.A.; Benestad, R.; Erlandsen, H.B.; Mezghani, A.; Gregow, H.; Raty, O.; Viktor, E.; et al. GCMeval-An interactive tool for evaluation and selection of climate model ensembles. Clim. Serv. 2020, 18, 100167. [Google Scholar] [CrossRef]
  66. Wu, T.W.; Lu, Y.X.; Fang, Y.J.; Xin, X.G.; Li, L.; Li, W.P.; Jie, W.H.; Zhang, J.; Liu, Y.M.; Zhang, L.; et al. The Beijing Climate Center Climate System Model (BCC-CSM): The main progress from CMIP5 to CMIP6. Geosci. Model. Dev. 2019, 12, 1573–1600. [Google Scholar] [CrossRef]
  67. Chen, G.W.; Ling, J.; Zhang, R.W.; Xiao, Z.N.; Li, C.Y. The MJO From CMIP5 to CMIP6: Perspectives from Tracking MJO Precipitation. Geophys. Res. Lett. 2022, 49, e2021GL095241. [Google Scholar] [CrossRef]
  68. Lin, L.; Jiang, X.L.; Guo, K.Q.; Byrne, A.; Deng, M. Climate change impacts the distribution of Quercus section Cyclobalanopsis (Fagaceae), a keystone lineage in East Asian evergreen broadleaved forests. Plant Divers. 2023, 45, 552–568. [Google Scholar] [CrossRef] [PubMed]
  69. Pearson, R.G.; Raxworthy, C.J.; Nakamura, M.; Peterson, A.T. Predicting species distributions from small numbers of occurrence records: A test case using cryptic geckos in Madagascar. J. Biogeogr. 2007, 34, 102–117. [Google Scholar] [CrossRef]
  70. Yang, Y.J.W.; Lin, L.; Tan, Y.H.; Deng, M. How Climate Change Impacts the Distribution of Lithocarpus hancei (Fagaceae), a Dominant Tree in East Asian Montane Cloud Forests. Forests 2023, 14, 1049. [Google Scholar] [CrossRef]
  71. Cao, Y.T.; Lu, Z.P.; Gao, X.Y.; Liu, M.L.; Sa, W.; Liang, J.; Wang, L.; Yin, W.; Shang, Q.H.; Li, Z.H. Maximum entropy modeling the distribution area of Morchella dill. Ex Pers. species in China under changing climate. Biology 2022, 11, 1027. [Google Scholar] [CrossRef]
  72. Dormann, C.F.; Elith, J.; Bacher, S.; Buchmann, C.; Carl, G.; Carré, G.; Marquéz, J.R.G.; Gruber, B.; Lafourcade, B.; Leitão, P.J. Collinearity: A review of methods to deal with it and a simulation study evaluating their performance. Ecography 2013, 36, 27–46. [Google Scholar] [CrossRef]
  73. Naimi, B.; Araújo, M.B. sdm: A reproducible and extensible R platform for species distribution modelling. Ecography 2016, 39, 368–375. [Google Scholar] [CrossRef]
  74. Allouche, O.; Tsoar, A.; Kadmon, R. Assessing the accuracy of species distribution models: Prevalence, kappa and the true skill statistic (TSS). J. Appl. Ecol. 2006, 43, 1223–1232. [Google Scholar] [CrossRef]
  75. Wang, Y.S.; Wang, Z.H.; Xing, H.F.; Li, J.W.; Sun, S. Prediction of potential suitable distribution of Davidia involucrata Baill in China based on MaxEnt. Chin. J. Ecol. 2019, 38, 1230–1237. [Google Scholar] [CrossRef]
  76. Yang, J.T.; Jiang, P.; Huang, Y.; Yang, Y.L.; Wang, R.L.; Yang, Y.X. Potential geographic distribution of relict plant Pteroceltis tatarinowii in China under climate change scenarios. PLoS ONE 2022, 17, e0266133. [Google Scholar] [CrossRef] [PubMed]
  77. O‘Donnell, J.; Gallagher, R.V.; Wilson, P.D.; Downey, P.O.; Hughes, L.; Leishman, M.R. Invasion hotspots for non-native plants in Australia under current and future climates. Glob. Chang. Biol. 2012, 18, 617–629. [Google Scholar] [CrossRef]
  78. Zeng, C.Y.; Zhong, Q.J.; Wang, C.Y.; Hu, Y.P.; Wu, M.H.; Meng, W.; Peng, M.C. Ecologically suitable habitats and population characteristics of Cercidiphyllum japonicum in China. Chin. J. Ecol. 2020, 39, 2704–2712. [Google Scholar] [CrossRef]
  79. Liu, Y.; Huang, P.; Lin, F.R.; Yang, W.Y.; Gaisberger, H.; Christopher, K.; Zheng, Y.Q. MaxEnt modelling for predicting the potential distribution of a near threatened rosewood species (Dalbergia cultrata Graham ex Benth). Ecol. Eng. 2019, 141, 105612. [Google Scholar] [CrossRef]
  80. Brown, J.L.; Bennett, J.R.; French, C.M. SDMtoolbox 2.0: The next generation Python-based GIS toolkit for landscape genetic, biogeographic and species distribution model analyses. PeerJ 2017, 5, e4095. [Google Scholar] [CrossRef] [PubMed]
  81. Guo, Y.K.; Wei, H.Y.; Lu, C.Y.; Gao, B.; Gu, W. Predictions of potential geographical distribution and quality of Schisandra sphenanthera under climate change. PeerJ 2016, 4, e2554. [Google Scholar] [CrossRef] [PubMed]
  82. Callaway, R.M.; Cipollini, D.; Barto, K.; Thelen, G.C.; Hallett, S.G.; Prati, D.; Stinson, K.; Klironomos, J. Novel weapons: Invasive plant suppresses fungal mutualists in America but not in its native Europe. Ecology 2008, 89, 1043–1055. [Google Scholar] [CrossRef] [PubMed]
  83. Callaway, R.M.; Mahall, B.E.; Wicks, C.; Pankey, J.; Zabinski, C. Soil fungi and the effects of an invasive forb on grasses: Neighbor identity matters. Ecology 2003, 84, 129–135. [Google Scholar] [CrossRef]
  84. Wang, L.; You, Z.P.; Xu, Y.; Zhang, D.H. Research Status and Endangered Causes of Diplopanax stachyanthus. Bull. Bot. Res. 2010, 30, 344–348. [Google Scholar]
  85. Liu, X.D.; Yin, Z.Y. Sensitivity of East Asian monsoon climate to the uplift of the Tibetan Plateau. Palaeogeogr. Palaeoclimatol. Palaeoecol. 2002, 183, 223–245. [Google Scholar] [CrossRef]
  86. Zhou, Z.K.; Huang, J.; Ding, W.N. The impact of major geological events on Chinese flora. Biodivers. Sci. 2017, 25, 123–135. [Google Scholar] [CrossRef]
  87. Yang, Q.; Yuan, M.Q.; Feng, B.X. Study on Community Structure and Resources of Rare Species Diplopanax stachyanthus on the Moon Mountain, Rongjiang. Seed 2013, 32, 55–59. [Google Scholar] [CrossRef]
  88. Zhu, W.H. Systematic Position and Evolution of Genus Diplopanax stachyanthus Hand.-Mazz. Doctoral Dissertation, Nanjing Forestry University, Nanjing, China, 1998. [Google Scholar]
  89. Lei, N.F.; Su, Z.X.; Chen, J.S.; Guo, J.H. Germination inhibitors in fruit of rare and endangered Davidia involucrata. Chin. J. Appl. Environ. Biol. 2003, 9, 607–610. [Google Scholar]
  90. Qian, C.M.; Jiang, Z.; Zhou, J.H.; Dai, S.; Su, Y.Y.; Li, S.X. Changes of inhibitory activity during stratification in Davidia involucrata seeds. J. Nanjing For. Univ. Nat. Sci. Ed. 2016, 40, 188–192. [Google Scholar]
  91. Mosbrugger, V.; Utescher, T.; Dilcher, D.L. Cenozoic continental climatic evolution of Central Europe. Proc. Natl. Acad. Sci. USA 2005, 102, 14964–14969. [Google Scholar] [CrossRef] [PubMed]
  92. Eronen, J.T.; Fortelius, M.; Micheels, A.; Portmann, F.T.; Puolamaki, K.; Janis, C.M. Neogene aridification of the Northern Hemisphere. Geology 2012, 40, 823–826. [Google Scholar] [CrossRef]
  93. Sunderlin, D.; Loope, G.; Parker, N.E.; Williams, C.J. Paleoclimatic and Paleoecological implications of a Paleocene-Eocene fossil leaf assemblage, Chickaloon formation, Alaska. Palaios 2011, 26, 335–345. [Google Scholar] [CrossRef]
  94. Taylor, D.W. Paleobiogeographic relationships of angiosperms from the Cretaceous and early Tertiary of the North American area. Bot. Rev. 1990, 56, 279–417. [Google Scholar] [CrossRef]
  95. Vieira, M.; Poças, E.; Pais, J.; Pereira, D. Pliocene flora from S. Pedro da Torre deposits (Minho, NW Portugal). Geodiversitas 2011, 33, 71–85. [Google Scholar] [CrossRef]
  96. Zhou, P.; Li, X.Z.; Shi, Z.G.; Sha, Y.Y.; Lei, J.; An, Z.S. Strengthened East Asian Winter Monsoon Regulated by Insolation and Arctic Sea Ice Since the Middle Holocene. Geophys. Res. Lett. 2023, 50, e2023GL105440. [Google Scholar] [CrossRef]
  97. LePage, B.A.; Yang, H.; Matsumoto, M. The evolution and biogeographic history of Metasequoia in the geobiology and ecology of Metasequoia. Geobiol. Ecol. Metasequoia 2005, 22, 3–114. [Google Scholar] [CrossRef]
  98. Lai, W.F.; Shi, C.Y.; Wen, G.W.; Ln, Z.W.; Ye, L.Q.; Huang, Q.L.; Zhang, G.F. Potential impacts of climate change on the distribution of the relict plant Shaniodendron subaequale. Heliyon 2023, 9, e14402. [Google Scholar] [CrossRef] [PubMed]
  99. Tang, C.Q.; Dong, Y.F.; Herrando-Moraira, S.; Matsui, T.; Ohashi, H.; He, L.Y.; Nakao, K.; Tanaka, N.; Tomita, M.; Li, X.S.; et al. Potential effects of climate change on geographic distribution of the Tertiary relict tree species Davidia involucrata in China. Sci. Rep. 2017, 7, 43822. [Google Scholar] [CrossRef] [PubMed]
  100. Wu, J.G.; Lu, J.J. Potential Effects of Climate Change on the Distribution of Dove Trees (Davidia Involucrata Baill) in China. Res. Environ. Sci. 2009, 22, 1371–1381. [Google Scholar]
  101. Wu, X.T.; Wang, M.Q.; Li, X.Y.; Yan, Y.D.; Dai, M.J.; Xie, W.Y.; Zhou, X.F.; Zhang, D.L.; Wen, Y.F. Response of distribution patterns of two closely related species in Taxus genus to climate change since last inter-glacial. Ecol. Evol. 2022, 12, e9302. [Google Scholar] [CrossRef] [PubMed]
  102. Zhang, H.; Zhao, H.X.; Xu, C.G. The potential geographical distribution of Alsophila spinulosain under climate change in China. Chin. J. Ecol. 2021, 40, 968–979. [Google Scholar] [CrossRef]
  103. Zhang, X.Y.; Wei, H.Y.; Zhang, X.H.; Liu, J.; Zhang, Q.Z.; Gu, W. Non-pessimistic predictions of the distributions and suitability of Metasequoia glyptostroboides under climate change using a random forest model. Forests 2020, 11, 62. [Google Scholar] [CrossRef]
  104. Alexander, J.M.; Chalmandrier, L.; Lenoir, J.; Burgess, T.I.; Essl, F.; Haider, S.; Kueffer, C.; McDougall, K.; Milbau, A.; Nuñez, M.A.; et al. Lags in the response of mountain plant communities to climate change. Glob. Chang. Biol. 2018, 24, 563–579. [Google Scholar] [CrossRef] [PubMed]
  105. Seddon, A.W.R.; Macias, F.M.; Long, P.R.; Benz, D.; Willis, K.J. Sensitivity of global terrestrial ecosystems to climate variability. Nature 2016, 531, 229–232. [Google Scholar] [CrossRef] [PubMed]
  106. Ernakovich, J.G.; Hopping, K.A.; Berdanier, A.B.; Simpson, R.T.; Kachergis, E.J.; Steltzer, H.; Wallenstein, M.D. Predicted responses of arctic and alpine ecosystems to altered seasonality under climate change. Glob. Chang. Biol. 2014, 20, 3256–3269. [Google Scholar] [CrossRef] [PubMed]
  107. Rudgers, J.A.; Chung, Y.A.; Maurer, G.E.; Moore, D.I.; Muldavin, E.H.; Litvak, M.E.; Collins, S.L. Climate sensitivity functions and net primary production: A framework for incorporating climate mean and variability. Ecology 2018, 99, 576–582. [Google Scholar] [CrossRef] [PubMed]
  108. Ge, J.L.; Berg, B.; Xie, Z.Q. Climatic seasonality is linked to the occurrence of the mixed evergreen and deciduous broad—Leaved forests in China. Ecosphere 2019, 10, e02862. [Google Scholar] [CrossRef]
  109. Song, C.Y.; Liu, H.M.; Gao, J.X. Habitat preference and potential distribution of Magnolia officinalis subsp. officinalis and M. o. subsp. biloba in China. Nat. Conserv. Bulg. 2019, 36, 93–111. [Google Scholar] [CrossRef]
  110. Guan, X.Y.; Shi, W.; Cao, K.F. Effect of Climate Change in Future on Geographical Distribution of Widespread Quercus acutissima and Analysis of Dominant Climatic Factors. J. Trop. Subtrop. Bot. 2018, 26, 661–668. [Google Scholar] [CrossRef]
  111. Shi, X.D.; Yin, Q.; Sang, Z.Y.; Zhu, Z.L.; Jia, Z.K.; Ma, L.Y. Prediction of potentially suitable areas for the introduction of Magnolia wufengensis under climate change. Ecol. Indic. 2021, 127, 107762. [Google Scholar] [CrossRef]
  112. Xu, J.; Deng, M.; Jiang, X.L.; Westwood, M.; Song, Y.G.; Turkington, R. Phylogeography of Quercus glauca (Fagaceae), a dominant tree of East Asian subtropical evergreen forests, based on three chloroplast DNA interspace sequences. Tree Genet. Genomes 2015, 11, 805. [Google Scholar] [CrossRef]
  113. Song, C.Y.; Liu, H.M. Habitat differentiation and conservation gap of Magnolia biondii, M. denudata, and M. sprengeri in China. PeerJ 2019, 6, e6126. [Google Scholar] [CrossRef]
  114. Holbourn, A.E.; Kuhnt, W.; Clemens, S.C.; Kochhann, K.G.D.; Jöhnck, J.; Lübbers, J.; Andersen, N. Late Miocene climate cooling and intensification of southeast Asian winter monsoon. Nat. Commun. 2018, 9, 1584. [Google Scholar] [CrossRef] [PubMed]
  115. Willis, K.J.; Niklas, K.J. The role of Quaternary environmental change in plant macroevolution: The exception or the rule? Philos. Trans. R. Soc. London B Biol. Sci. 2004, 359, 159–172. [Google Scholar] [CrossRef] [PubMed]
  116. Ye, J.W.; Zhang, Y.; Wang, X.J. Phylogeographic history of broad-leaved forest plants in subtropical China. Acta Ecol. Sin. 2017, 37, 5894–5904. [Google Scholar] [CrossRef]
  117. Hewitt, G.M. Genetic consequences of climatic oscillations in the Quaternary. Philos. T R. Soc. B 2004, 359, 183–195. [Google Scholar] [CrossRef] [PubMed]
  118. Qian, H.; Ricklefs, R.E. Diversity of temperate plants in east Asia. Nature 2001, 413, 130. [Google Scholar] [CrossRef]
  119. Shi, Y. Characteristics of late Quaternary monsoonal glaciation on the Tibetan Plateau and in East Asia. Quat. Int. 2002, 97–98, 79–91. [Google Scholar] [CrossRef]
  120. Shi, Y.F.; Ren, B.H.; Wang, J.T.; Edward, D. Quaternary glaciation in China. Quat. Sci. Rev. 1986, 5, 503–507. [Google Scholar] [CrossRef]
  121. Tian, Z.; Jiang, D.B. Revisiting last glacial maximum climate over China and East Asian monsoon using PMIP3 simulations. Palaeogeogr. Palaeoclimatol. Palaeoecol. 2016, 453, 115–126. [Google Scholar] [CrossRef]
  122. Qian, H.; Ricklefs, R.E. Large-scale processes and the Asian bias in species diversity of temperate plants. Nature 2000, 407, 180–182. [Google Scholar] [CrossRef] [PubMed]
  123. Ricklefs, R.E. A comprehensive framework for global patterns in biodiversity. Ecol. Lett. 2004, 7, 1–15. [Google Scholar] [CrossRef]
  124. Tian, Z.P.; Jiang, D.B. Mid-Holocene and last glacial maximum changes in monsoon area and precipitation over China. Chin. Sci. Bull. 2015, 60, 400–410. [Google Scholar] [CrossRef]
  125. Zhang, Y.K.; Zhang, S.S. Effects of seed soaking with salicylic acid on seed germination and early seeding growth of Mastixia euonymoides under drought stress. Hunan For. Sci. Technol. 2022, 49, 24–29. [Google Scholar]
  126. Zhang, S.S.; Yuan, C.M.; Chen, J.; Zhang, Y.K. Population Status of Wild Mastixia euonymoides as an Extremely Small Population. For. Inventory Plan. 2020, 45, 82–87. [Google Scholar]
Figure 1. (a). D. Stachyanthus habitat (subtropical evergreen broad-leaved forest); (b). D. Stachyanthus fruit; (c). D. Stachyanthus inflorescence (conical inflorescence).
Forests 15 00766 g001
Figure 2. Research area and distribution records of D. stachyanthus. Black dots represent all the distribution points, and green dots represent distribution points after filtering.
Forests 15 00766 g002
Figure 3. Research area and distribution records of D. stachyanthus. Black dots represent distribution points after filtering.
Forests 15 00766 g003
Figure 4. The simulated potential distribution areas of D. stachyanthus at the geological times. (a) At the LGM; (b) at the MH.
Forests 15 00766 g004
Figure 5. Potential distribution map under current climate conditions (1970–2000).
Forests 15 00766 g005
Figure 6. Potentially suitable habitats of D. stachyanthus under the four shared socioeconomic pathways in the future three periods. (a) SSP1-2.6 2041–2060; (b) SSP2-4.5 2041–2060; (c) SSP3-7.0 2041–2060; (d) SSP5-8.5 2041–2060; (e) SSP1-2.6 2061–2080; (f) SSP2-4.5 2061–2080; (g) SSP3-7.0 2061–2080; (h) SSP5-8.5 2061–2080; (i) SSP1-2.6 2081–2100; (j) SSP2-4.5 2081–2100; (k) SSP3-7.0 2081–2100; (l) SSP5-8.5 2081–2100, respectively.
Forests 15 00766 g006
Figure 7. Dynamic change map of the potentially suitable area of D. stachyanthus at the geological times. (a) at the LGM; (b) at the MH.
Forests 15 00766 g007
Figure 8. Changes in distribution areas of D. stachyanthus under different climate scenarios in the next three time periods. (a) current to 2041–2060 SSP1-2.6; (b) current to 2041–2060 SSP2-4.5; (c) current to 2041–2060 SSP3-7.0; (d) current to 2041–2060 SSP5-8.5; (e) 2041–2060 to 2061–2080 SSP1-2.6; (f) 2041–2060 to 2061–2080 SSP2-4.5; (g) 2041–2060 to 2061–2080 SSP3-7.0; (h) 2041–2060 to 2061–2080 SSP5-8.5; (i) 2061–2080 to 2081–2100 SSP1-2.6; (j) 2061–2080 to 2081–2100 SSP2-4.5; (k) 2061–2080 to 2081–2100 SSP3-7.0; (l) 2061–2080 to 2081–2100 SSP5-8.5.
Forests 15 00766 g008
Table 1. The contribution of environmental variables for predicting the distribution of D. stachyanthus.
NameRelative Contribution Rate (%)Description
Bio1632.6Precipitation of Wettest Quarter (mm)
Bio1721.2Precipitation of Driest Quarter (mm)
Bio1917.3Precipitation of Coldest Quarter (mm)
Bio113.5Annual Mean Temperature(°C)
Bio213.4Mean Diurnal Range (Mean of monthly
(max temp–min temp)) (°C)
Bio119.5Mean Temperature of Coldest Quarter (°C)
Table 2. The suitable habitats of D. stachyanthus predicted by the RF model at different time periods.
Climate ScenarioTimeHigh SuitableMedium SuitableLow SuitableTotal
(104 km2)(104 km2)(104 km2)(104 km2)
LGM0.77919.80772.47790.063
MH1.82420.66867.32689.818
Current1.113 20.391 64.470 85.974
SSP1-2.62041–20601.161 16.292 66.477 83.931
2061–20800.564 19.427 79.066 99.057
2081–21000.816 18.335 57.361 76.512
SSP2-4.52041–20600.269 20.146 64.641 85.056
2061–20800.092 18.035 63.076 81.203
2081–21000.170 21.175 74.519 95.865
SSP3-7.02041–20601.248 18.589 76.691 96.528
2061–20800.389 20.503 57.205 78.097
2081–21000.234 18.170 66.457 84.861
SSP5-8.52041–20601.625 16.359 69.005 86.990
2061–20800.229 20.821 64.898 85.948
2081–21000.719 16.875 78.139 95.733
Disclaimer/Publisher’s Note: The statements, opinions and data contained in all publications are solely those of the individual author(s) and contributor(s) and not of MDPI and/or the editor(s). MDPI and/or the editor(s) disclaim responsibility for any injury to people or property resulting from any ideas, methods, instructions or products referred to in the content.

