Article

Predicting the Spatial Distribution of the Mangshan Pit Viper (Protobothrops mangshanensis) under Climate Change Scenarios Using MaxEnt Modeling

1
Institute of Wildlife Conservation, Central South University of Forestry and Technology, Changsha 410004, China
2
Administration Bureau of Hunan Mangshan National Nature Reserve, Chenzhou 423000, China
*
Author to whom correspondence should be addressed.
Forests 2024, 15(4), 723; https://doi.org/10.3390/f15040723
Submission received: 29 March 2024 / Revised: 16 April 2024 / Accepted: 18 April 2024 / Published: 20 April 2024

Abstract

:
This study explores the critical issue of understanding the potential impacts of climate change on the habitat suitability of the highly endangered forest-dwelling Mangshan pit viper (Protobothrops mangshanensis) in China. Through the application of the MaxEnt model, high-resolution bioclimatic datasets, and species occurrence data, the research aims to elucidate the spatial and temporal dynamics of P. mangshanensis distribution from the present to the years 2050 and 2070. Through the integration of three climate models from the Coupled Model Intercomparison Project Phase 6 (CMIP6) and exploring different shared socioeconomic pathway (SSP) scenarios (SSP126, SSP370, and SSP585), the study seeks to provide comprehensive insights into the potential variations in habitat suitability under diverse future climate conditions. The methodology employed involves the construction of the MaxEnt model utilizing the BioClim dataset and 83 species occurrence points. The SSP scenarios mentioned above represent future climate change scenarios, and the accuracy of the model is evaluated using the area under the receiver-operating characteristic (ROC) curve (AUC). Key findings reveal that the MaxEnt model exhibits high accuracy (AUC = 0.998), pinpointing the current suitable habitat for P. mangshanensis to be confined to the Mangshan area within the Nanling Mountains, covering an approximate area of 1023.12 km2. However, projections based on future climate scenarios suggest notable shifts in habitat suitability dynamics. While potential suitable habitats may emerge in the northwest of the current range, the existing suitable habitats are anticipated to undergo significant reduction or even complete disappearance. Notably, precipitation during the driest month emerges as a critical determinant influencing the distribution of the species. In conclusion, the study underscores the exacerbating impact of climate change on habitat deterioration and survival risks for P. mangshanensis, emphasizing the urgent need for conservation measures to safeguard the remaining suitable habitats for this endangered species. The implications of these findings are far-reaching, with the anticipated contraction of the snake’s range potentially leading to its disappearance and increased habitat fragmentation. By shedding light on the potential distributional changes of P. mangshanensis in Mangshan, the research provides valuable insights for informing targeted conservation strategies and policy interventions aimed at mitigating the adverse effects of climate change on endangered species.

1. Introduction

An undisputed fact facing all organisms is the inevitability of climate change. Climate change is a major threat to global biodiversity, leading to the changing formation of the modern global distribution of species patterns [1]. Climate change on a global scale currently poses a formidable challenge to humanity and ecological systems. Compared to 1970, the present-day concentration of greenhouse gases, especially carbon dioxide (CO2), has surged by 70%. Projections indicate that global warming will persist, with an expected rise in average surface temperature ranging from 0.3 to 4.5 °C by the year 2100 in comparison to the 1986–2005 timeframe. This temperature increase represents a severe threat to the long-term viability of global ecosystems, and has already sparked changes in biodiversity patterns across the world [2]. Numerous studies have uncovered a trend: in response to the warming climate, species are relocating to higher altitudes or different latitudes [3]. One example is the large viper, which primarily inhabits the understory of both broad-leaved forests and mixed coniferous–broad-leaved forests [4]. The contraction of species distributions may be due to associated changes in climatic conditions that may not meet the species’ niche requirements. Therefore, some species may suffer local or global extinction [5]. If future climate warming leads to the disappearance of suitable habitats or geographical obstacles hinder the dispersal of certain species, those with slow dispersal rates may face endangerment.
The Mangshan pit viper, Protobothrops mangshanensis (Figure 1), belongs taxonomically to Reptilia, Squamata, Serpentes, Viperidae, Crotalinae [6]. In 2016, Guo et al. discovered that this species was the earliest differentiated species in the genus Protobothrops [7]. It is a sizable viper that is at present only found in the Mangshan region of Hunan, China due to habitat scarcity, human hunting, and habitat destruction. Listed as critically endangered (CR) on both the IUCN Red List and Appendix II of the Convention on International Trade in Endangered Species (CITES), it was also designated as critically endangered on the 2016 Red List of China’s Vertebrates, with a documented population of fewer than 500 in 2013 [8]. Based on surveys conducted to evaluate visitor motivations within the protected area, it has been observed that the Mangshan pit viper, serving as a flagship species within the Hunan Mangshan Nature Reserve, consistently draws a substantial number of tourists each year. Notably, this species holds considerable economic significance for the local community, contributing to the growth in the region’s tourism industry and generating notable economic benefits. The conservation of the Mangshan pit viper habitat is a matter of urgency, and the current state of wild resources of the species remains uncertain. Nonetheless, there is limited understanding of the spatiotemporal distribution patterns and suitable habitats of the Mangshan pit viper in China under the influence of climate change. As previously mentioned, this knowledge gap poses a challenge to the evaluation and resource management of this species. Therefore, preserving snake habitats becomes vital in the face of changing climatic conditions.
The fecal matter of wild Mangshan pit vipers has been found to contain hair from rodents, feathers from small birds, and undigested bones. This provides evidence that adult Mangshan pit vipers primarily feed on mice and birds in the wild. Similarly, in captivity, these snakes mainly consume brown rats, small birds, and rabbits [9].
The diurnal activity patterns and time allocation of Mangshan pit vipers exhibit distinct rhythmicity. Significant differences in their behavioral time allocation are observed between summer and autumn. Specifically, there is an increase in resting and sunbathing time in autumn compared to summer, accompanied by reduction in time spent on activities such as movement and foraging. Mangshan pit vipers exhibit both terrestrial and arboreal habits, with notable behavioral differences under these conditions. On the ground, they primarily engage in resting, sunbathing, and crawling, whereas in trees, they mainly rest and crawl. Notably, in both summer and autumn, the movement frequency of Mangshan pit vipers is significantly correlated with the movement frequency of mice. Among abiotic factors, temperature and rainfall significantly influence the activity of these snakes. Observations of Mangshan pit viper eggs under natural conditions reveal several factors contributing to the vulnerability of this species during the reproductive stage, including egg damage by ants, low hatching rates, and difficulty in survival for young snakes [10].
Regarding their movement patterns, the monthly total movement distance of this species varies from a minimum of 64.5 m to a maximum of 212.9 m, with individual movements reaching up to 72.7 m. In summer, the displacement distance ranges from 219 m to a maximum of 431.5 m, with a home range radius of approximately 300 m. Furthermore, significant differences are observed in various habitat characteristics between the areas utilized by Mangshan pit vipers and random sites, including the percentage of broad-leaved forest, coniferous forest, landscape patch richness, edge density, average tree height, and average tree diameter. This species prefers natural broad-leaved and mixed coniferous–broad-leaved forests, specifically habitats rich in fallen leaves, shrubs, and rocky areas (Figure 2). However, the migration patterns of this species remain largely unexplored [11].
Ecological niche modeling (ENM) is a mathematical modeling approach rooted in ecological niche theory, aiming to predict species distribution. Presently, it serves as the predominant method in biogeographical studies across various time scales. Furthermore, ENM find extensive application in research on individual ecology and assessing the potential geographic suitability of species amidst climate change [12]. Numerous studies have established that the maximum entropy model (MaxEnt) exhibits high accuracy in predicting potential distributions, making it a popular tool in conservation biology, ecology, and other fields [13,14]. The model has proven instrumental in forecasting the spatiotemporal distribution of a wide array of species [15].
The exploration of spatial distribution shifts in species provides profound insights into their adaptive strategies and survival mechanisms. Anticipating the significant impact of impending climate change on the distribution patterns of diverse species [16,17], we have strategically selected both current and future climate models. This approach enables us to meticulously investigate the projected paths influencing the evolution of species’ upcoming habitats. This knowledge does not just deepen our comprehension of the species’ ecological needs; it also aids in pinpointing critical conservation zones and shaping proactive strategies to safeguard their long-term survival in the midst of ongoing climate change.

2. Materials and Methods

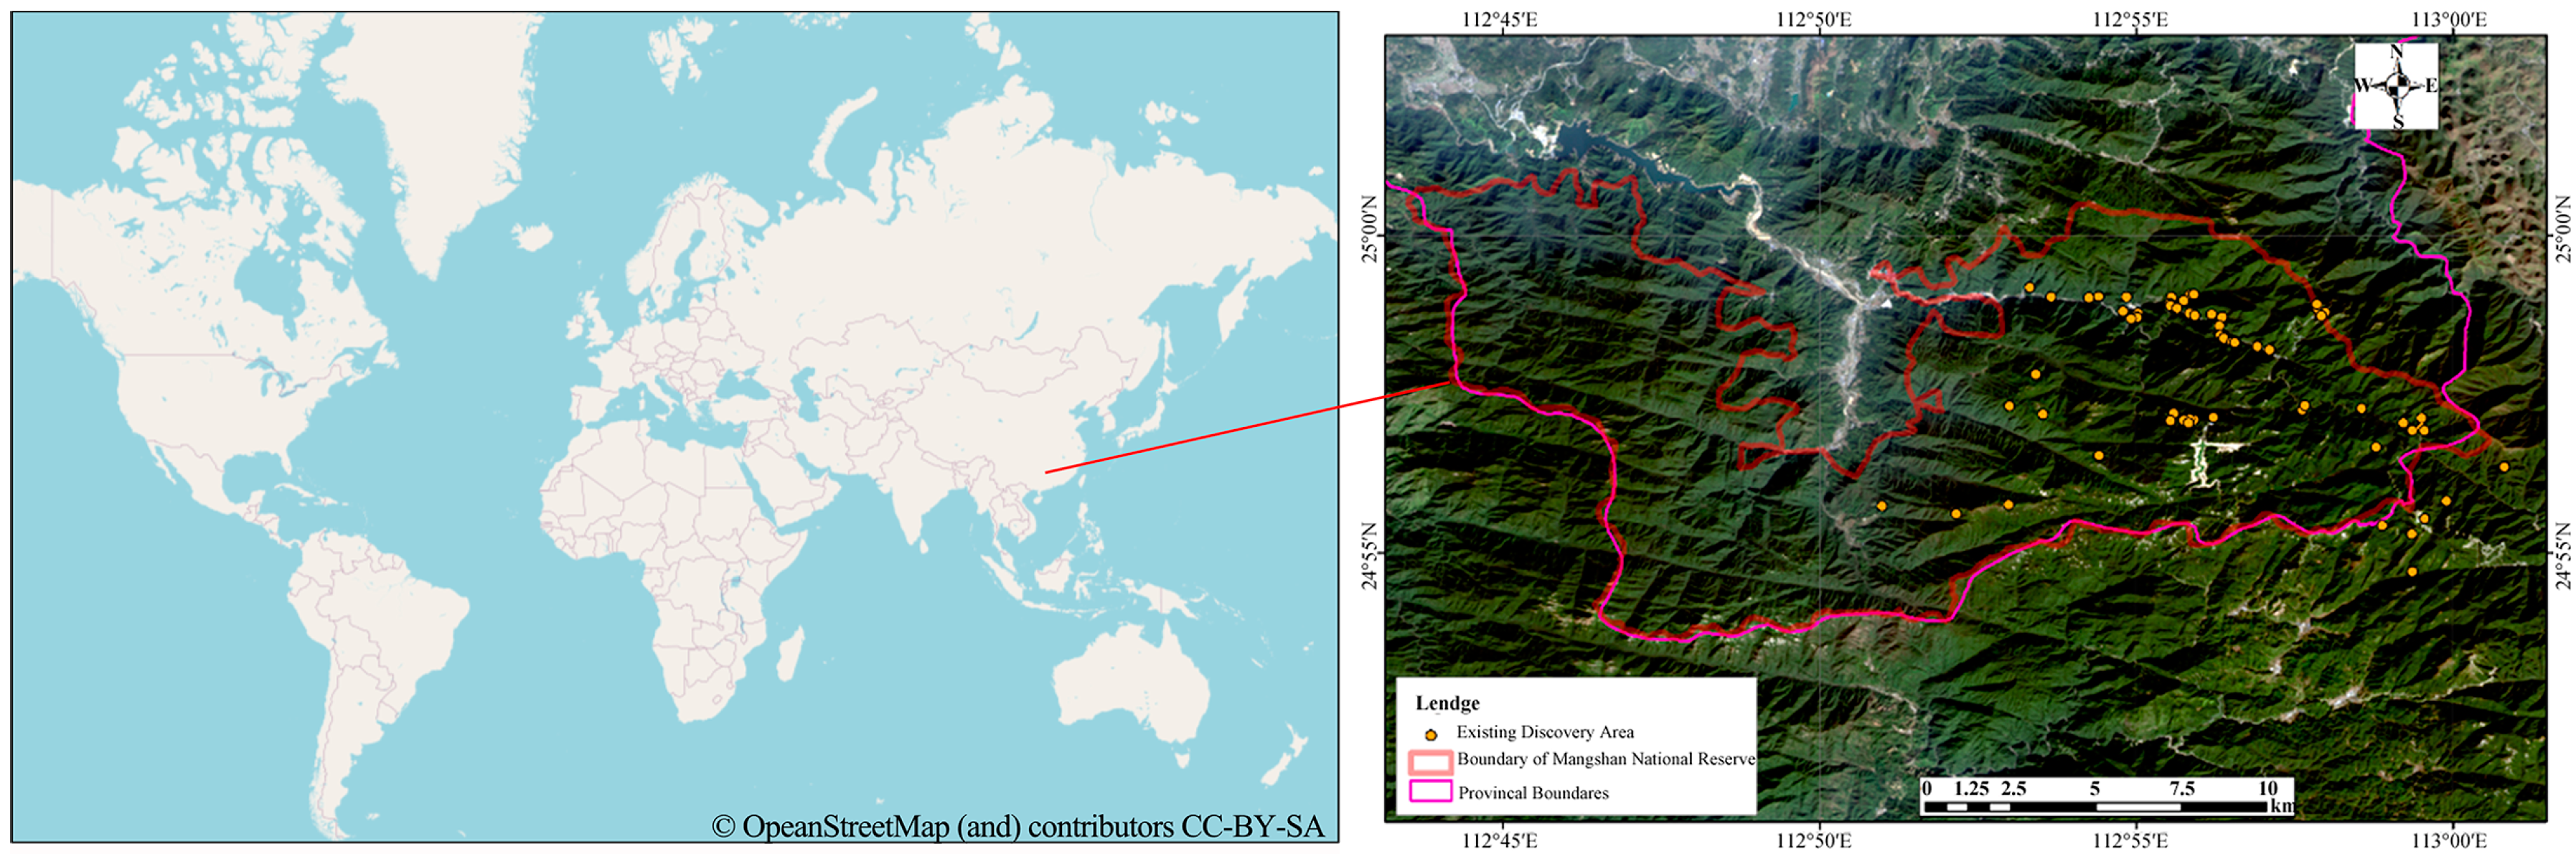
2.1. Habitat Coordinates of the Mangshan Pit Viper

Occurrence data were obtained from published [18,19] and unpublished (chronology of the survey records of Mangshan National Nature Reserve, Hunan Province) sources, yielding 83 occurrence points of P. mangshanensis (Figure 3). Utilizing the “remove duplicates” method, any duplicate presence points located within the same grid cell were eliminated [20,21]. Consequently, only one site per 1 km × 1 km grid was chosen, resulting in a total of 68 sites employed for the current modeling endeavor.
From 2012 to 2023, we conducted transect surveys to seek out P. mangshanensis individuals, adhering to the methodology established as Zhang B, 2020 [19]. Across areas of P. mangshanensis habitats, we randomly set up 261 transects, with an averaging length of 277 m each. In situations where a chosen transect fell in an inaccessible zone for snakes, such as open water, heavily trafficked routes, or steep cliffs, an alternate transect was selected. The combined length of all transects amounted to 72 km. Each transect underwent two daylight surveys (between 12:00 and 15:00) and one nocturnal survey (between 20:00 and 23:00). This procedure was repeated from March to October annually from 2012 and 2023. Our observers were organized into three groups, with five observers in each group. During surveying, all five observers progressed along a single transect line at approximately 0.3 km per hour, maintaining a 5 m distance between each pair. They documented all sighted individuals within a 10 m-wide transect, extending 5 m on each side. Upon encountering a snake, we precisely logged its GPS location using a device from Beijing UniStrong Science and Technology Co., Ltd. Furthermore, we relied on the distinctive head patch pattern as a dependable identifier for Mangshan pit viper individuals, as noted by Zhang B, 2020 [19] and assigned a unique ID to each individual. Additionally, data from 2008 to 2013 were sourced from the Administration Bureau of the Hunan Mangshan National Nature Reserve, primarily relying on the discovery of nests of this species. Due to protection policies, this information has not been made public.

2.2. Environmental Variables

The potentially suitable areas for modeling were determined using climate data (Table 1) sourced from the WorldClim Global Climate Database (version 2.1, accessible at https://worldclim.org/, accessed on 6 May 2021) [22]. To define the study area, raster data were clipped to the boundaries of China using officially published maps. The future data incorporated in this study derive from three representative shared socioeconomic pathways (SSPs): SSP126, indicating low greenhouse gas emissions, SSP370, signifying moderate greenhouse gas emissions, and SSP585, representing high greenhouse gas emissions scenarios where nations utilize fossil fuels freely in the absence of international agreements. These data were analyzed for two time horizons: the near term (2050, 2041–2060) and the far term (2070, 2061–2080) within the framework of the CMCC-ESM2 global climate model.
The NDVI (normalized difference vegetation index) and China’s vegetation zoning data were sourced from a geographic remote sensing ecological network platform (www.gisrs.cn, accessed on 24 November 2023). Additionally, DEM (digital elevation model) data were sourced from GeoSpatial Cloud (https://www.gscloud.cn/, accessed on 24 November 2023).
To comply with the prerequisites of the MaxEnt software, all environmental variables underwent conversion to the ASCII format.

2.3. Environmental Variable Processing

In our study, we chose to investigate the impact of 22 factors, encompassing climate data, NDVI, vegetation zoning and DEM, on the distribution of the Mangshan pit viper. Due to the significant collinearity among these environmental variables [23], our initial step involved extracting relevant environmental variables from the known habitat locations of the Mangshan pit viper. We then utilized ArcGIS raster analysis tools to perform a Spearman correlation analysis [24,25]. This analysis helped us determine the correlation coefficients between variables across all SSP models and time periods. Whenever a correlation exceeded 0.8 between any two variables (Figure 4), we gave preference to the factor that exhibited a stronger influence on the species, while eliminating other environmental variables from consideration [26]. Following this, we focused on key factors that significantly affect the Mangshan pit viper. These included temperatures of the coldest and hottest months, precipitation during the driest and wettest months, as well as temperature stability indicators such as average diurnal temperature range and precipitation stability indicators such as precipitation seasonality, specifically BIO13, BIO14, BIO15, BIO2, BIO5, and BIO6.

Map Vector Data and Software

The 1 km-precision regionalization map of China was sourced from the National Catalogue Service for Geographic Information, accessible at http://www.webmap.cn/main.do?method=index (accessed on 2 December 2023).
ArcGIS10.3, a geographic information system platform, was acquired from the Environmental Systems Research Institute based in the United States. Additionally, MaxEnt 3.4.1 k software was downloaded from the Princeton University website (http://www.cs.princeton.edu, accessed on 1 July 2023).

2.4. MaxEnt Parameter Optimization

The MaxEnt model was utilized to predict the potential distribution of P. mangshanensis in China. We randomly selected 75% of occurrence records as training data for model construction and the remaining 25% served as testing data for model evaluation. The jackknife techniquewas used to evaluate variable contributions, and the “create response curves” option was chosen. The model process was iterated 10 times, with a maximum iteration of 2000. Other parameters adhered to MaxEnt default values.

2.5. Calculating the Shifts in the Distribution Area

Model calibration, creation, and evaluation were conducted using the “kuenm” program (https://github.com/marlonecobos/kuenm, accessed on 24 December 2023), an R (V 4.3.2) package with MaxEnt integrated as the modeling engine that utilizes MaxEnt’s modeling algorithm. For the MaxEnt 3.4.1 software, the two most pivotal parameters are feature combination (FC) and regularization multiplier (RM). By optimizing these parameters via the “kuenm” R package, we can effectively minimize model overfitting and intricacy, thereby enhancing the model’s predictive precision considerably. FC consists of 5 features: linear (L), quadratic (Q), product (P), threshold (T), and hinge (H). Nine parameter combinations (l, lq, lqp, lqh, lqph, lqpth, h, qph, qpth) were set for model testing. The RM parameter was set to a range of 0.1 to 4.0 (in increments of 0.1), resulting in 40 RM values.
The precision of the simulated outcomes was assessed through the utilization of the area under the curve (AUC) derived from the receiver-operating characteristic (ROC) curve. If we acknowledge that AUC values span from 0 to 1.0, and higher AUC values denote exceptional model accuracy and trustworthiness, it is evident that the model’s efficacy escalates as the species distribution increasingly diverges from a random state. The evaluation criteria were divided into four levels: when 0 < AUC ≤ 0.5, the result was classified as “invalid”; when 0.5 < AUC ≤ 0.7, it was classified as “acceptable”; when 0.7 < AUC ≤ 0.9, it was classified as “good”; and when AUC > 0.9, it was classified as “excellent.” Using Jenks natural breaks classification as a foundation and leveraging the Reclassify tool within ArcMap, we determined the likelihood of occurrence through a complementary log–log (cloglog) valuation. The final model’s optimal threshold for maximum true skill statistic (TSS) and the true positive threshold (TPT) balance, referred to as the balance training omission, predicted area, and threshold, were used as breakpoints. The model results were then reclassified into three categories: unsuitable, moderately suitable, and suitable habitats [27,28]. Subsequently, the areas of each habitat category were computed individually.

2.6. Analysis of Habitat Landscape Pattern Changes

The habitat suitability results produced by MaxEnt were transformed into a binary format, creating a binary map. Fragstats was then used for calculations, specifically evaluating using these indices: number of patches (NPs), largest patch index as a proportion of the total area (LPI), mean patch size (MPS), shape index (SHAPE_AM), and proximity index (PROX) [29]. When computing PROX, a search radius of 300 m was set [4], matching the home range radius of the Mangshan pit viper.
Based on the MaxEnt outputs, ArcGIS was employed to extract suitable habitats, which were then stored as polygon layers. These layers were further analyzed in Confer software V2.6 (http://www.conefor.org/coneforsensinode.html, accessed on 28 March 2024) to determine probability of connectivity (PC) and dPC (differentials of PC). Given the absence of a precise diffusion rate for the Mangshan pit viper, we assumed a movement distance equal to its average monthly displacement (147 m) [10], associated with a 50% probability. The dPC values were then categorized using the natural breaks method into three groups: very important patches (VIPs), important patches (IPs), and unimportant patches (UPs). The count of patches in each group was documented.

3. Results

3.1. Accuracy Evaluation of the MaxEnt Niche Model

The proximity of the training omission rate to the predicted rate in the overall context implied a well-constructed model (Figure 5). Additionally, the ROC mean AUC value, which stood at 0.998 ± 0.001, signified exceptional predictive performance by the MaxEnt model across the entire scenario [22].

3.2. Critical Environmental Factors

To evaluate the influence of various environmental factors on predicting the current and future distributions of P. mangshanensis, we employed the MaxEnt jackknife test instrument. MaxEnt automatically outputs the contribution rate of each variable. The final analysis included the variables BIO14, BIO10, BIO15, BIO3, BIO18, BIO4 and BIO2. The contribution rates, from the highest to the lowest, were as follows: BIO14 (56.5%), BIO5 (22.9%), BIO15 (15.5%), BIO13 (2.9%), BIO6 (1.2%) and BIO2 (1.1%). (Table 2).
In the study, environmental response curves were utilized to explore the relationship between the likelihood of Mangshan pit viper occurrence and diverse environmental factors (Figure 6). Detailed single-factor analyses were performed on seven variables to ascertain their respective impacts. Adopting the maximum training sensitivity plus specificity logistic threshold (MTSS) of 0.3972 as the benchmark, values exceeding this threshold were deemed conducive to the survival of the Mangshan pit viper.
Based on the environmental response curves, the optimal range of precipitation for the Mangshan pit viper’s habitat during the driest season was determined to be 37–44 mm. Additionally, the maximum temperature in the warmest month should lie between 24 °C and 28 °C, while precipitation seasonality should be in the range of 60–62 mm. The wettest season’s precipitation should be 260–311 mm, the coldest season’s temperature between −2 °C and 4 °C, and the mean diurnal range between 7.2 °C and 7.7 °C for optimal conditions supporting the survival of the Mangshan pit viper.

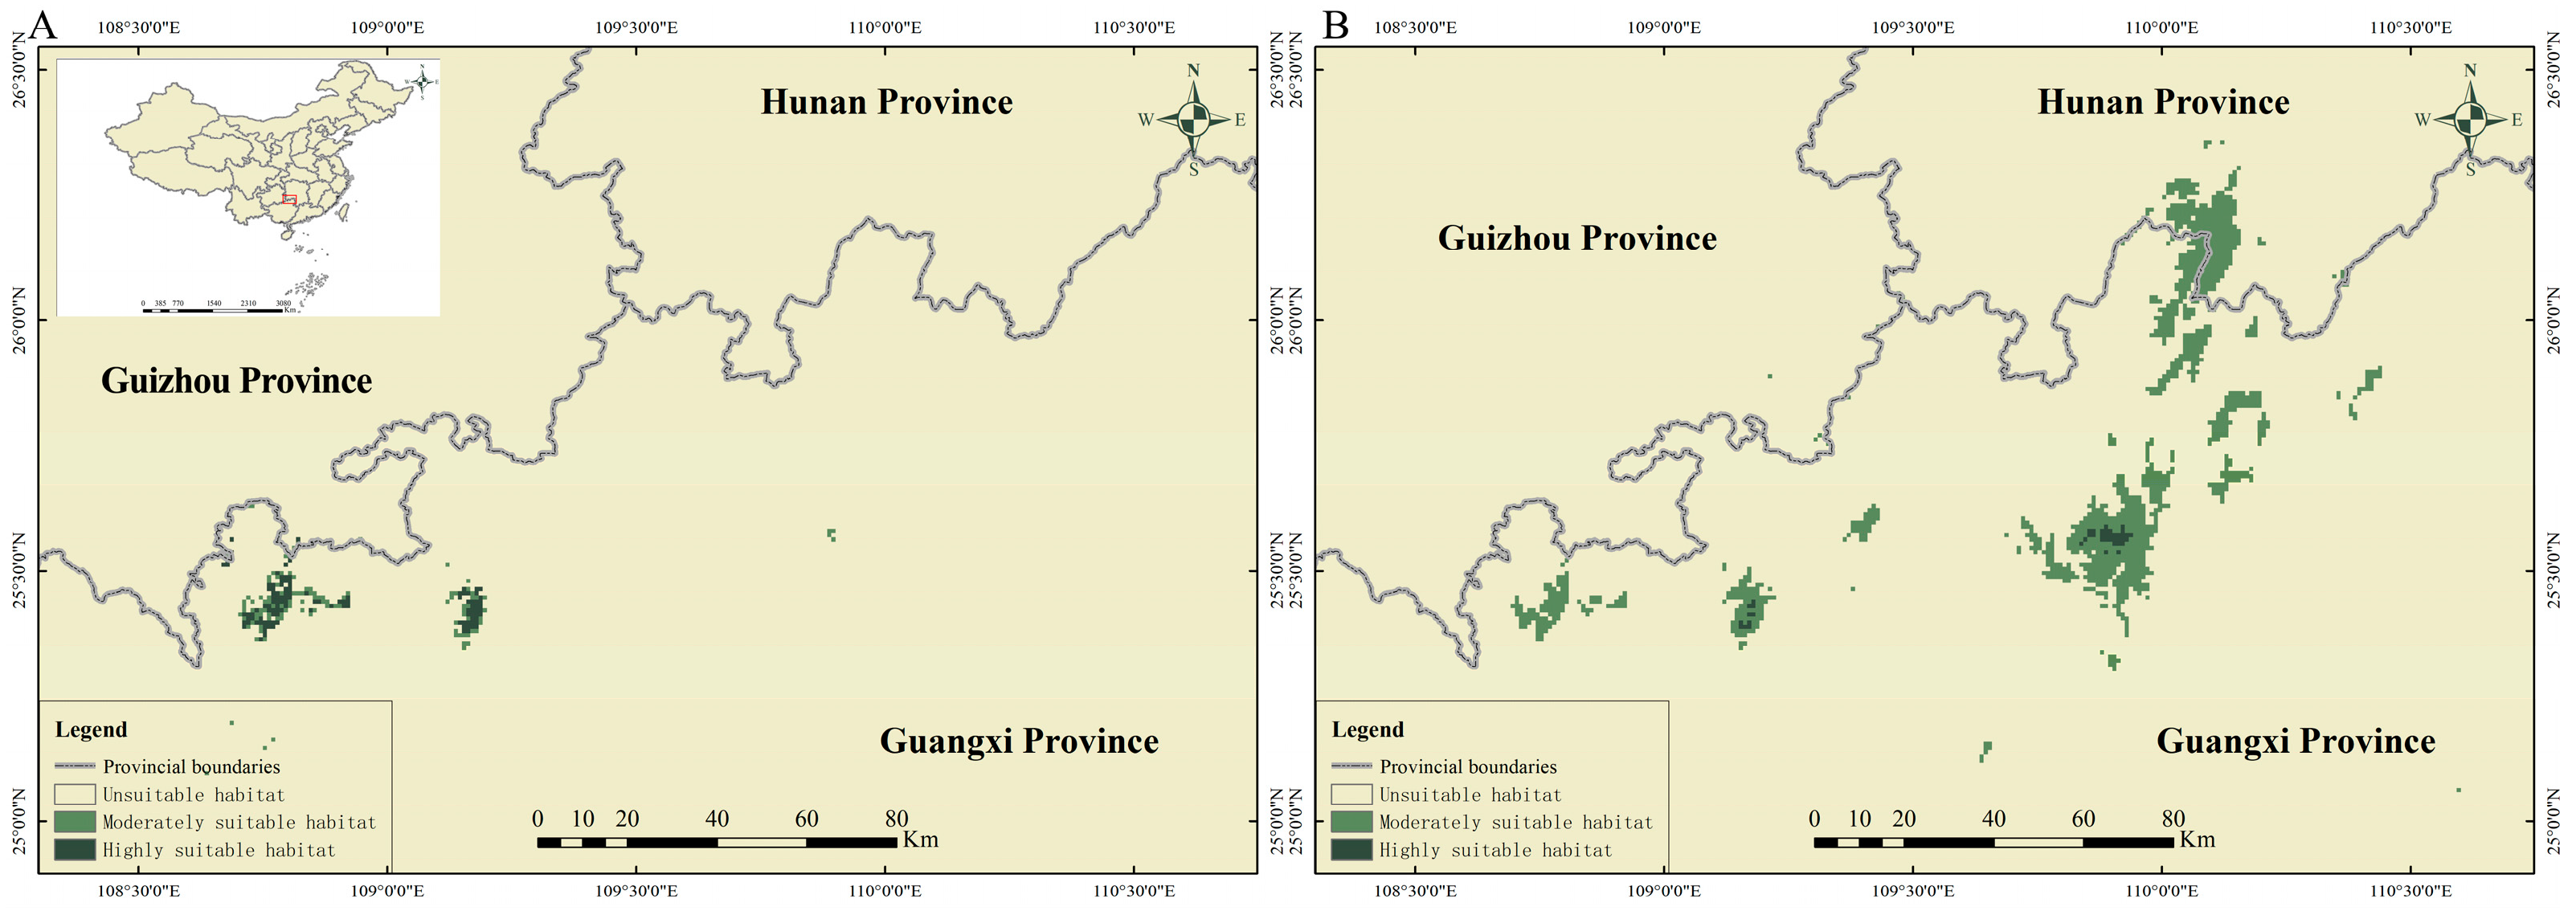
3.3. Current Potential Distribution of P. mangshanensis (2020)

Taking into account the specified model and historical environmental variables, a predictive analysis was undertaken to ascertain the potential habitat of the Mangshan pit viper in China. Given historical climatic conditions, the snake’s potential habitat was predominantly situated in the Nanling region straddling the Hunan and Guangdong province borders, aligning closely with actual distribution patterns. The estimated suitable habitat encompassed a total area of 1023.12 km2, equivalent to 1.07‰ of the country’s landmass. The highly suitable areas were predominantly nested within moderately hospitable environments spanning 491.99 km2, which represented 48.09% of the overall viable habitat area (Figure 7).

3.4. Future Geographic Range (2040–2060 and 2060–2080)

Across the various scenarios, the habitat of the Mangshan pit viper’s habitat experiences notable degrees of reduction in both future timeframes. Under SSPs126 (Figure 8), there is a 145.91 km2 decrease in the overall favorable area by 2050, signifying an approximate 14.26% reduction, predominantly affecting the high-suitability areas (diminished by 144.13 km2). By 2070, the high-suitability areas are almost entirely depleted, with only 33.10 km2 remaining (Table 3). Under SSPs370 and SSPs585, the original suitable areas along the Hunan–Guangdong border vanish completely. Instead, new suitable areas emerge in the northwest, specifically at the intersection of Guangxi and Hunan. These areas gradually expand from 2050 to 2070 in SSPs370, but shrink further and shift northward in SSPs585 by 2070 (Figure 9 and Figure 10). Despite habitat relocations, the suitable habitat area for the Mangshan pit viper contracts in all three scenarios (Figure 11). This underscores the profound impact of climate warming on the Mangshan pit viper’s habitat area over time, especially considering escalating carbon levels across these climate scenarios.

3.5. Alteration in Habitat Landscape Patterns

From now until 2050 and 2070, the habitat of the Mangshan pit viper will demonstrate increasing loss and isolation (Table 4). MPS gradually decreases, indicating the breaking down of larger habitat patches into smaller ones. Under SSPs126 and SSPs370 scenarios, there is minimal change in the average size by 2050. However, under SSPs585, the MPS first decreases and then increases, reflecting the disappearance of suitable habitats from their original locations. Additionally, the LPI significantly decreases across all three scenarios from the present to 2050 and 2070, indicating the loss of core habitat areas, with only small peripheral regions remaining. NP steadily decrease under SSPs126, highlighting the disappearance of habitat patches due to fragmentation. Under SSPs370, NPs first decline and then rise, while under SSPs585, they initially increase and then decrease, illustrating the dynamic process of habitat loss and emergence in new locations. PROX, measuring isolation [22], decreases to varying extents from now to 2050 and 2070 across all scenarios. Likewise, the SHAPE_AM index reflects the impact on habitat, where patches with a greater impact exhibit more regular shapes and lower shape values. SHAPE_AM consistently decreases, indicating fragmentation of the Mangshan pit viper population’s habitat.
VIPs remained at the heart of the core distribution area throughout 2020 to 2070. IPs were positioned to the south of VIPs, while UPs lay to the north (Figure 12). Under the SSPs126 scenario, as habitat suitability (PC values) decreased, habitats fragmentation progressed, resulting in fewer types of important patch types. By 2050, southern IPs had transitioned into UPs, and by 2070, UPs in the north and central VIPs had vanished entirely. For SSPs370 and SSPs585, all crucial patches within the original core distribution area disappeared. In the newly emerging locations, except for SSPs370 in 2070, both PC values and the diversity of patch types decreased across scenarios. Notably, under SSPs585, all patch types except UPs had vanished by 2070 (Table 5).

4. Discussion

Research has shown that the seasonality of precipitation stands out as the most significant factor influencing the distribution of certain snake species, such as Echis carinatus, Macrovipera lebetinus, and Pseudocerastes persicus. Specifically, for M. lebetinus and Naja Oxiana, the amount of precipitation during the driest month proves to be the most crucial predictor of habitat suitability. Studies indicate that each snake species exhibits an optimal range and variability in precipitation deemed most conducive for their survival [30]. Research by José P et al. in 2022 [31] uncovered a correlation between the ecological niche breadth of Atlantic Forest snakes and both temperature and precipitation. The ecological niche related to precipitation seems evolutionarily conserved in the Atlantic Forest. Precipitation is believed to be a pivotal ecological factor shaping the geographical distribution of specific lineages, potentially due to environmental diversity. Climatic factors influencing the distribution of L. dilepis are primarily linked to precipitation. For snakes, precipitation affects the availability of prey, especially small mammals and reptiles crucial to their diet. Moreover, water sources influenced by precipitation directly affect the habitat suitability for Lygophis dilepis. This species tends to prefer regions with moderate rainfall, which supports a diverse prey population [32]. Sunny A et al.s’ study on Conopsis biserialis, C. lineata and C. nasus revealed that C. biserialis and C. lineata are primarily limited by the highest temperatures [33], while C. nasus is constrained by the lowest temperatures. Another study observed that the highest temperature in the hottest month (BIO05) is a critical factor for most snake species, except for Erythrolamprus albertguentheri and Philodryas baroni, for which seasonality of precipitation (BIO15) and diurnal temperature range (BIO02) are more significant [34]. Consequently, the Mangshan pit viper might be similarly influenced, potentially restricting its suitable habitat range and affecting behaviors like molting, hibernation, and food sources.
However, besides the current known distribution areas, the MaxEnt model has also revealed numerous undisclosed regions where this species may exist, particularly along the border of Hunan and Guangxi provinces. Existing potential distribution maps indicate that the suitable habitat for this species appears significantly fragmented, even within the Nanling region of Mangshan at the Hunan–Guangdong border. Hence, verifying the species’ presence in these undiscovered suitable habitats and determining methods to connect these fragmented areas will be pivotal in future conservation endeavors. The predicted increases in temperature and precipitation associated with climate change in southern China appear to have had a profound effect on the habitat of P. mangshanensis. As the intensification of global warming increases, we anticipate a reduction or even complete loss of optimal habitat areas for P. mangshanensis in the Nanling region. Similarly to amphibians and reptiles with limited distributions, Protobothrops mangshanensis faces the challenge of narrow distributions, migrating further north and to higher elevations as global temperatures rise [35]. Furthermore, given that the Nanling region boasts one of the highest mountain ranges in the area, it is questionable whether the species can successfully migrate to new habitats in its natural state [36]. Comprehensive data analysis suggests that it is highly unlikely for the species under investigation to spontaneously abandon its current habitat and relocate to a simulated one in the foreseeable future, except in the unique SSP126 scenario. This conclusion is supported by the fact that—excluding the SSP126 situation, where the new habitat is in close proximity to the original—all other hypothetical scenarios involve separations exceeding 300 km between the current and prospective habitats. Biologically speaking, such a significant migration is improbable for this species, considering its documented migratory patterns and capabilities. Observations indicate that the species exhibits a monthly total movement ranging from a minimum of 64.5 m to a maximum of 212.9 m, with the highest recorded single movement spanning 72.7 m. Additionally, observations over a three-month summer period reveal a cumulative minimum displacement of 219 m and a maximum displacement of 431.5 m, suggesting a home range radius of approximately 300 m [11]. When habitats are displaced, most species are unable to disperse rapidly enough, and their natural dispersal abilities alone may prove insufficient [37]. Additionally, from a population density perspective, species that migrate long distances tend to have higher mortality rates than those that survive by predation and occupy small, fixed ranges [38,39]. Given that P. mangshanensis is a large venomous snake, this poses a severe threat to its survival, making the conservation of this rare species deserving of heightened attention. The Mangshan pit viper predominantly selects natural broad-leaved forests and mixed coniferous–broadleaved forests as its natural habitat, showing a preference for densely vegetated areas rich in fallen leaves [4,11]. In constructing our model, we chose precipitation as a key variable based on its correlation coefficient, rather than NDVI or vegetation zone. This decision was influenced by the current lack of comprehensive models predicting future vegetation zones and NDVI patterns in southern China under three distinct climate scenarios.
Moreover, we acknowledge the complex interplay between vegetation zone, NDVI, and precipitation. As a crucial component of any ecosystem, the vegetation zone is significantly shaped by local climatic conditions, with precipitation being a determining factor. Different vegetation zones have varying water requirements, closely linking their distribution to precipitation patterns and amounts [40]. The NDVI score is intricately tied to factors such as chlorophyll content, leaf area index, and overall vegetation cover. Studies have revealed a significant impact of precipitation on the NDVI, especially in arid and semiarid environments. An increase in precipitation often leads to a commensurate elevation in the NDVI score, as ample moisture fosters vegetative growth and chlorophyll synthesis [41]. It is worth noting that precipitation not only directly influences critical vegetative processes, including photosynthesis and transpiration, but also indirectly affects vegetative growth by modulating soil moisture levels. In arid climates, precipitation emerges as a primary limiting factor for vegetative growth. Consequently, fluctuations in precipitation levels have a direct bearing on the distribution and growth patterns of vegetation, ultimately reflected in variations in the NDVI [42].
Additionally, it is important to consider that distinct vegetation zones exhibit differential responses to precipitation, implying that alterations in precipitation patterns can significantly reshape the distribution of various plant species [43]. Different zones of vegetation respond differently to precipitation, and changes in precipitation can alter the distribution of different plants [44].
In predicting species distribution amidst climate change, we neglected direct human interventions such as fire, logging, changes in land use, or alien species and pathogens. These factors may have affected the population in the past [45,46,47]. By establishing the Hunan Mangshan National Nature Reserve, the human disturbances in the area are now less severe than in the past. However, with the changes in habitat range due to climate change, only decisive action by the agencies responsible for the environment and biodiversity, active conservation, and awareness raising among the local population can counteract the phenomenon of species extinction caused by human pressure.

5. Conclusions

Due to the synchronous hydrothermal conditions prevalent in China’s climate [48], the Mangshan pit viper is significantly influenced by two key climatic factors: the precipitation in the driest month, typically occurring in winter, and the maximum temperature the warmest month, representing the highest temperature in summer. According to our research, precipitation during the driest period has a significant impact on the distribution and survival conditions of Protobothrops mangshanensis. Specifically, when precipitation falls below the range of 37 mm to 44 mm, we observed a decrease in the occurrence rate of Protobothrops mangshanensis, possibly due to unfavorable overwintering conditions caused by low- or high-humidity environments. Conversely, during moderately dry periods with adequate precipitation, the species’ activity level and reproductive success rate increase. These factors have the potential to impact the species’ choice of hiding places. Mangshan pit vipers generally prefer microhabitats with abundant fallen leaves, shrubs, and rubble piles [11]. According to the World Climate future climate models selected in the study, the summer temperatures in the region are expected to rise, while winter precipitation will increase, particularly in the southern areas. Consequently, even under the SSP126 scenario, the suitable habitats in the southern regions will disappear. Under other SSPs, the habitats in these areas will be completely eliminated. Therefore, it is necessary to artificially construct shelters suitable for the species to survive both summer and winter. These shelters should be equipped with appropriate temperature and humidity control devices to ensure a favorable environment for Mangshan pit vipers throughout the year.
Under the current climate conditions, the potential geographical distribution of the Mangshan pit viper is primarily concentrated in the Nanling Mangshan region straddling the border of Hunan and Guangdong. However, climate change indicates as a significant reduction trend in the potentially suitable habitat for the Mangshan pit viper. Sui et al.’s study found that over the past 50 years [49], the spatial distribution of precipitation in the South China and the middle–lower reaches of the Yangtze River regions has exhibited a pattern of heavier precipitation in the southeast and lesser in the northwest. The diminishing high-suitability areas and the westward shift of suitable areas for the Mangshan pit viper correlate with these precipitation changes. This alignment may be attributed to precipitation during the driest season being the primary limiting factor influencing the distribution of the Mangshan pit viper. Future increases in precipitation during the driest season in South China and the middle–lower reaches of the Yangtze River regions could potentially result in habitat loss for the Mangshan pit viper.
Drawing from this study, previous research conducted by Bing Zhang et al. in 2022, and China’s ongoing 14th Five-Year Plan for Forestry and Grassland Protection and Development, the Mangshan pit viper emerges as one of the 48 key species targeted for conservation and population restoration efforts. Special funding opportunities can be explored through the China National Forestry and Grassland Administration and Hunan Provincial Forestry Bureau. Fieldwork can be provided by Mangshan Forest Administration and Mangshan Nature Reserve Administration, with technical support from experienced teams such as those from Central South University of Forestry and Technology, Hunan Normal University, and Central South University, who have long been conducting wildlife research in this area. Comprehensive surveys should be conducted once a month, except during the hibernation months of snakes, to ascertain the specific population size of the species. Additionally, based on existing research, it is recommended to primarily prevent forest degradation and maintain the area of broad-leaved forests and mixed coniferous and broad-leaved forests. Furthermore, considering the study’s finding that Mangshan pit vipers are sensitive to rainfall during the driest month (winter), it is necessary to establish more suitable shelters with appropriate temperature and humidity to ensure the species’ successful overwintering. The future of this species under changing climate conditions remains a concern, and we propose measures for conserving P. mangshanensis. (1) It is advisable to protect the ecological environment of high-suitability areas, reduce human activities and encroachment, strengthen patrols in high-suitability areas where tourism development has been carried out, and prevent the destruction of snake habitats. (2) Field population surveys: based on the spatial distribution of snake habitat suitability levels obtained in this study, we will focus on deploying surveys in high-suitability areas and conduct population and habitat surveys for P. mangshanensis to determine the current population density. (3) Relevant departments should increase investment in scientific research to successfully achieve artificial breeding of snakes as early as possible [8], and field releases must be performed in the high-suitability areas and habitats identified in this study. Another crucial aspect of conservation efforts for Mangshan pit vipers involves the establishment of artificial structures, such as shelters and food support systems. In addition, amphibians are crucial for the ecological balance of the ecosystem [50]. By providing suitable habitats and food sources, we can help ensure the survival and reproduction of Mangshan pit vipers, even in the face of changing climatic conditions. Therefore, it is imperative to invest in the construction and maintenance of these artificial structures to support the conservation of this endangered species.
Our study used a large-scale bioclimatic environmental dataset for quantitative modeling of habitat change affecting the Mangshan pit viper and constructed the results in spatial and temporal contexts. The method is feasible and practical for evaluating habitat. The maps show a concentrated species distribution with few areas of suitable habitat, occurring only in the Nanling–Mangshan area. Environmental factors influenced habitat suitability, with precipitation being the most important determinant. Apart from climatic factors, various other elements such as soil composition, altitude, topography, and interactions among different communities also exert influence. This study solely employed climate factors to simulate and predict the potential distribution of the Mangshan pit viper, indicating certain limitations. Subsequent research should comprehensively incorporate diverse factors to derive more accurate and reliable results, thereby providing a theoretical basis for the conservation of the Mangshan pit viper. Additionally, every effort should be made to prevent human-induced destruction of habitats suitable for the survival of the Mangshan pit viper.

Author Contributions

Z.D. and X.X. cowrote the first draft of the paper, with X.X. primarily responsible for writing the background introduction and conclusion sections, while Z.D. wrote the remaining content and undertook the task of reviewing relevant literature. D.Y. proposed the concept and research design of this study and provided necessary funding support. From 2015 to 2020, M.Z., B.Z. and X.D. were responsible for collecting data on species occurrences during this period. Additionally, X.C. and G.D. provided us with historical data from 2010 to 2015, with X.C. now managing the data and G.D. being the original collector. All coauthors actively participated in the review of the first draft and provided valuable feedback for revision. All authors have read and agreed to the published version of the manuscript.

Funding

This work was supported by the National Natural Science Foundation of China (31472021), the Project for Endangered Wildlife Investigation, Supervision and Industry Regulation of the National Forestry and Grassland Bureau of China (202207-HN-001), and the Project for Endangered Wildlife Protection of Hunan Forestry Bureau of China (HNYB-2023001).

Data Availability Statement

The data presented in this study are available on request from the corresponding author due to legal Wildlife Protection Law of the People’s Republic of China.

Acknowledgments

We express our gratitude to Yao Luo, Shousheng Hu, Jianguo Tan, Xiujun Zhang, Xiujun Liu, Gensheng Tan, Desheng Chen, and Yuanhui Chen from the Administration Bureau of Hunan Mangshan National Nature Reserve for their assistance and valuable advice in the field work. We thank LetPub (www.letpub.com, accessed on 17 April 2024) for its linguistic assistance during the preparation of this manuscript.

Conflicts of Interest

The authors declare no conflicts of interest.

References

  1. Cong, M.; Xu, Y.; Tang, L.; Yang, W.; Jian, M. Predicting the dynamic distribution of Sphagnum bogs in China under climate change since the last interglacial period. PLoS ONE 2020, 15, e0230969. [Google Scholar] [CrossRef] [PubMed]
  2. Chen, K.; Wang, B.; Chen, C.; Zhou, G. MaxEnt Modeling to Predict the Current and Future Distribution of Pomatosace filicula under Climate Change Scenarios on the Qinghai–Tibet Plateau. Plants 2022, 11, 670. [Google Scholar] [CrossRef] [PubMed]
  3. Wiens, J.J. Climate-Related Local Extinctions Are Already Widespread among Plant and Animal Species. PLoS Biol. 2016, 14, e2001104. [Google Scholar] [CrossRef] [PubMed]
  4. Gong, S.; Chen, Y.; Lau, M.; Wang, F. Population status, distribution and conservation needs of the Endangered Mangshan pit viper Protobothrops mangshanensis of China. Oryx 2013, 4, 122–127. [Google Scholar] [CrossRef]
  5. Duarte, M.; Guerrero, P.C.; Arroyo, M.T.; Bustamante, R.O. Niches and climate-change refugia in hundreds of species from one of the most arid places on Earth. PeerJ 2019, 7, e7409. [Google Scholar] [CrossRef] [PubMed]
  6. Orlov, N.; Ryabov, S.; Nguyen, T. Two new species of Genera Protobothrops Hoge et Romano-Hoge, 1983 and Viridovipera Malhotraet Thorpe. 2004 (Ophidia, Viperidae, Crotalinae) from Karst Region in Northeastern Vietnam. Part I. Description of a new species of Protobothrops Genus. Russ. J. Herpetol. 2009, 16, 69–82. [Google Scholar] [CrossRef]
  7. Guo, P.; Liu, Q.; Wen, T.; Xiao, R.; Fang, M.; Zhong, G.; Truong, N.Q.; Zhu, F.; Jadin, R.C.; Li, C. Multilocus phylogeny of the Asian Lance-headed pitvipers (Squamata, Viperidae, Protobothrops). Zootaxa 2016, 4093, 382–390. [Google Scholar] [CrossRef] [PubMed]
  8. IUCN (International Union for Conservation of Nature) Red List Committee. The IUCN Red List of Threatened Species™ Strategic Plan 2017–2020; IUCN: Gland, Switzerland, 2016. [Google Scholar] [CrossRef]
  9. Li, S.; Lei, S.; Ren, X.; Liu, L.; Li, Q. Study on the incubation and rearing of eggs of the critically endangered pit viper Protobothrops mangshanensis. J. For. Environ. Sci. Chin. 2018, 34, 120–123. [Google Scholar] [CrossRef]
  10. Ding, X. Behavioral Rhythm of a Critically Endangered and Endemic Pitviper, Protobothrops mangshanensis. Master’s Thesis, Central South University of Forestry and Technology, Changsha, China, 2020; pp. 37–38. [Google Scholar] [CrossRef]
  11. Zhang, B. Multilevel Multiscale Habitat Selection Mechanisms of the Critically Endangered Mangshan Pit Viper (Protobothrops mangshanensis). Ph.D. Thesis, Central South University of Forestry and Technology, Changsha, China, 2021; pp. 38–39. [Google Scholar] [CrossRef]
  12. Ahmadi, M.; Hemami, M.R.; Kaboli, M.; Shabani, F. MaxEnt brings comparable results when the input data are being completed; Model parameterization of four species distribution models. Ecol. Evolution 2023, 13, e9827. [Google Scholar] [CrossRef]
  13. Zhang, J.; Jiang, F.; Li, G.; Qin, W.; Li, S.; Gao, H.; Cai, Z.; Lin, G.; Zhang, T. Maxent modeling for predicting the spatial distribution of three raptors in the Sanjiangyuan National Park, China. Ecol. Evol. 2019, 9, 6643–6654. [Google Scholar] [CrossRef]
  14. Qin, A.; Jin, K.; Batsaikhan, M.-E.; Nyamjav, J.; Li, G.; Li, J.; Xue, Y.; Sun, G.; Wu, L.; Indree, T.; et al. Predicting the current and future suitable habitats of the main dietary plants of the Gobi Bear using MaxEnt modeling. Glob. Ecol. Conserv. 2020, 22, e01032. [Google Scholar] [CrossRef]
  15. Li, M.; He, J.; Zhao, Z.; Lyu, R.; Yao, M.; Cheng, J.; Xie, L. Predictive modelling of the distribution of Clematis sect. Fruticella s. str. under climate change reveals a range expansion during the Last Glacial Maximum. PeerJ 2020, 8, e8729. [Google Scholar] [CrossRef] [PubMed]
  16. Prakash, S. Impact of Climate change on Aquatic Ecosystem and its Biodiversity: An overview. Int. J. Biol. Innov. 2021, 3. [Google Scholar] [CrossRef]
  17. Resano-Mayor, J.; Korner-Nievergelt, F.; Vignali, S.; Horrenberger, N.; Barras, A.G.; Braunisch, V.; Pernollet, C.A.; Arlettaz, R. Snow cover phenology is the main driver of foraging habitat selection for a high-alpine passerine during breeding: Implications for species persistence in the face of climate change. Biodivers. Conserv. 2019, 28, 2669–2685. [Google Scholar] [CrossRef]
  18. Zhang, M. Potential Distribution Prediction and Habitat Suitability Evaluation of Mangshan Pit Vipers. Master’s Thesis, Central South University of Forestry and Technology, Hunan, China, 2018. [Google Scholar] [CrossRef]
  19. Zhang, B.; Wu, B.; Yang, D.; Tao, X.; Zhang, M.; Hu, S.; Chen, J.; Zheng, M. Habitat association in the critically endangered Mangshan pit viper (Protobothrops mangshanensis), a species endemic to China. PeerJ 2020, 8, e9439. [Google Scholar] [CrossRef]
  20. Carne, C. Predicting habitat suitability for the wart-biter bush cricket (Decticus verrucivorus) in Europe. J. Insect Conserv. 2017, 21, 287–295. [Google Scholar] [CrossRef]
  21. Mafuwe, K.; Broadley, S.; Moyo, S. Use of maximum entropy (Maxent) niche modelling to predict the occurrence of threatened freshwater species in a biodiversity hotspot of Zimbabwe. Afr. J. Ecol. 2021, 60, 557–565. [Google Scholar] [CrossRef]
  22. Zhang, L.; Huang, S.; Yuan, Y.; Wu, X.; Tan, Z.; Yao, L.; Hong, Z.; Cai, Q.; Wang, Y.; Xiang, H. Geographical distribution and predict potential distribution of Cerasus serrulata. Environ. Sci. Pollut. Res. 2023, 30, 43369–43376. [Google Scholar] [CrossRef]
  23. Peterson, A.T. perspective: Phylogeography is not enough: The need for multiple lines of evidence. Front. Biogeogr. 2012, 1, 19–25. [Google Scholar] [CrossRef]
  24. Li, Q.; Ren, H.; Zheng, L.; Cao, W.; Zhang, A.; Zhuang, D.; Lu, L.; Jiang, H. Ecological Niche Modeling Identifies Fine-Scale Areas at High Risk of Dengue Fever in the Pearl River Delta, China. Int. J. Environ. Res. Public Health 2017, 14, 619. [Google Scholar] [CrossRef]
  25. Wang, R.; Li, Q.; He, S.; Liu, Y.; Wang, M.; Jiang, G. Modeling and mapping the current and future distribution of Pseudomonas syringae pv. actinidiae under climate change in China. PLoS ONE 2018, 13, e0192153. [Google Scholar] [CrossRef] [PubMed]
  26. Feng, X.; Park, D.S.; Liang, Y.; Pandey, R.; Papeş, M. Collinearity in ecological niche modeling: Confusions and challenges. Ecol. Evol. 2019, 9, 10365–10376. [Google Scholar] [CrossRef] [PubMed]
  27. Liu, C.; White, M.; Newell, G. Selecting thresholds for the prediction of species occurrence with presence-only data. J. Biogeogr. 2013, 40, 778–789. [Google Scholar] [CrossRef]
  28. Freeman, E.A.; Moisen, G.G. A comparison of the performance of threshold criteria for binary classification in terms of predicted prevalence and kappa. Ecol. Model. 2008, 217, 48–58. [Google Scholar] [CrossRef]
  29. Wang, M.; Chen, H.; Lei, M. Identifying potentially contaminated areas with MaxEnt model for petrochemical industry in China. Environ. Sci. Pollut. Res. 2022, 29, 54421–54431. [Google Scholar] [CrossRef] [PubMed]
  30. Yousefi, M.; Kafash, A.; Khani, A.; Nabati, N. Applying species distribution models in public health research by predicting snakebite risk using venomous snakes’ habitat suitability as an indicating factor. Sci. Rep. 2020, 10, 18073. [Google Scholar] [CrossRef] [PubMed]
  31. Portillo, J.T.d.M.; Barbo, F.E.; Sawaya, R.J. Climatic niche breadths of the Atlantic Forest snakes do not increase with increasing latitude. Curr. Zool. 2021, 68, 535–540. [Google Scholar] [CrossRef] [PubMed]
  32. Ceron, K.; Mângia, S.; Guedes, T.B.; Alvares, D.J.; Neves, M.O.; Moroti, M.D.T.; Torello, N.; Borges-Martins, M.; Ferreira, V.L.; Santana, D.J. Ecological Niche Explains the Sympatric Occurrence of Lined Ground Snakes of the Genus Lygophis (Serpentes, Dipsadidae) in the South American Dry Diagonal. Herpetologica 2021, 77, 239–248. [Google Scholar] [CrossRef]
  33. Sunny, A.; Manjarrez, J.; Caballero-Viñas, C.; Bolom-Huet, R.; Gómez-Ortiz, Y.; Domínguez-Vega, H.; Heredia-Bobadilla, R.L.; Torres-Romero, E.J.; González-Fernández, A. Modelling the effects of climate and land-cover changes on the potential distribution and landscape connectivity of three earth snakes (Genus Conopsis, Günther 1858) in central Mexico. Sci. Nat. 2023, 110, 52. [Google Scholar] [CrossRef]
  34. Andrade, S.; Sarquis, A.; Loiselle, A.; Giraudo, A.R.; Díaz-Gómez, J.M. Expansion of the agricultural frontier in the largest South American Dry Forest: Iden-tifying priority conservation areas for snakes before everything is lost. PLoS ONE 2019, 14, e0221901. [Google Scholar] [CrossRef]
  35. Pyron, R.A.; Burbrink, F.T. Early origin of viviparity and multiple reversions to oviparity in squamate reptiles. Ecol. Lett. 2013, 17, 13–21. [Google Scholar] [CrossRef] [PubMed]
  36. Walther, G.-R.; Post, E.; Convey, P.; Menzel, A.; Parmesan, C.; Beebee, T.J.C.; Fromentin, J.-M.; Hoegh-Guldberg, O.; Bairlein, F. Ecological responses to recent climate change. Nature 2002, 416, 389–395. [Google Scholar] [CrossRef] [PubMed]
  37. Pearson, R.G. Climate change and the migration capacity of species. Trends Ecol. Evol. 2006, 21, 111–113. [Google Scholar] [CrossRef] [PubMed]
  38. Marshall, B.M.; Strine, C.T. Exploring snake occurrence records: Spatial biases and marginal gains from accessible social media. PeerJ 2019, 7, e8059. [Google Scholar] [CrossRef] [PubMed]
  39. Román-Palacios, C.; Wiens, J.J. Recent responses to climate change reveal the drivers of species extinction and survival. Proc. Natl. Acad. Sci. USA 2020, 117, 4211–4217. [Google Scholar] [CrossRef]
  40. Li, Y.; Xie, Z.; Qin, Y.; Zheng, Z. Estimating Relations of Vegetation, Climate Change, and Human Activity: A Case Study in the 400 mm Annual Precipitation Fluctuation Zone, China. Remote Sens. 2019, 11, 1159. [Google Scholar] [CrossRef]
  41. Pei, F.; Zhou, Y.; Xia, Y. Application of Normalized Difference Vegetation Index (NDVI) for the Detection of Extreme Precipitation Change. Forests 2021, 12, 594. [Google Scholar] [CrossRef]
  42. Chen, Z.; Wang, W.; Fu, J. Vegetation response to precipitation anomalies under different climatic and biogeographical conditions in China. Sci. Rep. 2020, 10, 830. [Google Scholar] [CrossRef]
  43. Liu, H.; Jia, J.; Lin, Z.; Wang, Z.; Gong, H. Relationship between net primary production and climate change in different vegetation zones based on EEMD detrending—A case study of Northwest China. Ecol. Indic. 2020, 122, 107276. [Google Scholar] [CrossRef]
  44. Kong, D.; Miao, C.; Wu, J.; Zheng, H.; Wu, S. Time lag of vegetation growth on the Loess Plateau in response to climate factors: Estimation, distribution, and influence. Sci. Total. Environ. 2020, 744, 140726. [Google Scholar] [CrossRef]
  45. Bonnet, X.; Naulleau, G.; Shine, R. The dangers of leaving home: Dispersal and mortality in snakes. Biol. Conserv. 1999, 89, 39–50. [Google Scholar] [CrossRef]
  46. Shiferaw, H.; Bewket, W.; Alamirew, T.; Zeleke, G.; Teketay, D.; Bekele, K.; Schaffner, U.; Eckert, S. Implications of land use/land cover dynamics and Prosopis invasion on ecosystem service values in Afar Region, Ethiopia. Sci. Total. Environ. 2019, 675, 354–366. [Google Scholar] [CrossRef] [PubMed]
  47. Kelly, L.T.; Giljohann, K.M.; Duane, A.; Aquilué, N.; Archibald, S.; Batllori, E.; Bennett, A.F.; Buckland, S.T.; Canelles, Q.; Clarke, M.F.; et al. Fire and biodiversity in the Anthropocene. Science 2020, 370, 929. [Google Scholar] [CrossRef] [PubMed]
  48. Lian, X.; Jiao, L.; Liu, Z.; Jia, Q.; Zhong, J.; Fang, M.; Wang, W. Multi-spatiotemporal heterogeneous legacy effects of climate on terrestrial vegetation dynamics in China. GIScience Remote Sens. 2022, 59, 164–183. [Google Scholar] [CrossRef]
  49. Sui, Y.; Huang, W.; Yang, X.; Li, M. Characteristics adaptation of seasonal drought in southern China under the background of climate change: I. Evolution of precipitation resources. Chin. J. Appl. Ecol. 2012, 23, 1875–1882. [Google Scholar] [CrossRef]
  50. Valencia-Aguilar, A.; Cortés-Gómez, A.M.; Ruiz-Agudelo, C.A. Ecosystem services provided by amphibians and reptiles in Neotropical ecosystems. Int. J. Biodivers. Sci. Ecosyst. Serv. Manag. 2013, 9, 257–272. [Google Scholar] [CrossRef]
Figure 1. Mangshan pit viper in its natural habitat within the broad-leaved forest of Mangshan (Naling region, photo by Xiangyun Ding).
Forests 15 00723 g001
Figure 2. Habitat environment and species morphology of the Mangshan pit viper. (AC) The natural habitat of the Mangshan pit viper; (DF) various species morphologies of Mangshan pit vipers (photos by Bing Zhang and Zeshuai Deng).
Forests 15 00723 g002
Figure 3. Detailed map and photographic overview of the habitat and discovery locations of Protobothrops mangshanensis in China.
Forests 15 00723 g003
Figure 4. Pearson correlation heatmap analysis based on 19 climatic factors, vegetation types, NDVI, and DEM.
Forests 15 00723 g004
Figure 5. Validation charts of model performance. (A) Receiver-operating characteristic curve: average sensitivity vs. 1-specificity for P. mangshanensis. (B) Training omission rate graph: average omission and predicted area for Protobothrops mangshanensis.
Forests 15 00723 g005
Figure 6. Response curves for key environmental predictors in the species distribution model for P. mangshanensis. (A) BIO14; (B) BIO5; (C) BIO15; (D) BIO13; (E) BIO6; (F) BIO2. (The red line represents the average value of all candidate models, and the blue range indicates the standard deviation).
Forests 15 00723 g006
Figure 7. Current suitable habitat distribution map of Mangshan pit viper at the Hunan–Guangdong border in the Nanling region based on MaxEnt modeling.
Forests 15 00723 g007
Figure 8. Predicted suitable habitat distribution of the Mangshan pit viper in China for 2050 (A) and 2070 (B) based on MaxEnt modeling under SSPs126 scenarios.
Forests 15 00723 g008
Figure 9. Predicted suitable habitat distribution of the Mangshan pit viper in China for 2050 (A) and 2070 (B) based on MaxEnt modeling under SSPs370 scenarios.
Forests 15 00723 g009
Figure 10. Predicted suitable habitat distribution of the Mangshan pit viper in China for 2050 (A) and 2070 (B) based on MaxEnt modeling under SSPs585 scenarios.
Forests 15 00723 g010
Figure 11. Bubble chart of changes in highly and moderately suitable habitats and total suitable habitats for Mangshan pit viper under different climate scenarios based on the MaxEnt model (1970–2070).
Forests 15 00723 g011
Figure 12. Mangshan pit viper potential habitat patch importance using dPC under different climate data. (A) Historical climate data; (B) SSPs126 in the year 2050; (C) SSPs126 in the year 2070; (D) SSP370 scenario in the year 2050; (E) SSP370 scenario in the year 2070; (F) SSP585 scenario in the year 2050; (G) SSP585 scenario in the year 2070.
Forests 15 00723 g012
Table 1. Overview of climate factors.
Definitions of the 19 Bioclimatic Variables
BIO1 = Annual Mean Temperature
BIO2 = Mean Diurnal Range [Mean of monthly (max temp–min temp)]
BIO3 = Isothermality [(BIO2/BIO7) × 100]
BIO4 = Temperature Seasonality (standard deviation × 100)
BIO5 = Max Temperature in the Warmest Month
BIO6 = Min Temperature in the Coldest Month
BIO7 = Temperature Annual Range (BIO5–BIO6)
BIO8 = Mean Temperature in the Wettest Quarter
BIO9 = Mean Temperature in the Driest Quarter
BIO10 = Mean Temperature in the Warmest Quarter
BIO11 = Mean Temperature in the Coldest Quarter
BIO12 = Annual Precipitation
BIO13 = Precipitation in the Wettest Month
BIO14 = Precipitation in the Driest Month
BIO15 = Precipitation Seasonality (Coefficient of Variation)
BIO16 = Precipitation in the Wettest Quarter
BIO17 = Precipitation in the Driest Quarter
BIO18 = Precipitation in the Warmest Quarter
BIO19 = Precipitation in the Coldest Quarter
Table 2. Climatic factors and their contribution rates.
VariablesPercentage ContributionPermutation Importance
BIO1456.557.0
BIO522.93.7
BIO1515.56.4
BIO132.91.2
BIO61.231.2
BIO21.10.5
Table 3. Changes in the possible habitat area of Protobothrops mangshanensis across various climatic conditions.
PeriodClimate
Model
Suitable RangeTotal (km2)
Moderately (km2)Highly
(km2)
1970–2023 531.14 491.99 1023.12
2050 SSPs126529.36 347.86 877.22
2050 SSPs370459.44 34.26 459.44
2050SSPs585107.05 99.02 107.05
2070SSPs126241.4533.101174.55
2070SSPs370506.672.93509.60
2070SSPs585235.330235.33
Table 4. Landscape pattern index during the period from now to 2070 in 3 Shared socioeconomic pathways (SSPs).
Model SSPs126SSPs370SSPs585
Year1970–2023205020702050207020502070
NP484033231316737
MPS21.31521.9318.32021.4653.8903.0766.36
LPI0.6310.1000.4610.0600.2320.1350.094
SHAPE_MN1.2491.2431.2421.1601.1491.1481.059
PROX12.16712.14411.2034.7166.8872.4631.034
Table 5. Habitat functional connectivity during the period from now to 2070 in 3 shared socioeconomic pathways (SSPs).
Model SSPs126SSPs370SSPs585
Year1970–2023205020702050207020502070
PC0.0980.0720.0360.0200.1750.0570.014
Number of VIPs1631174630314580
Number of IPs102462623131310
Number of UPs198165984134015717
Disclaimer/Publisher’s Note: The statements, opinions and data contained in all publications are solely those of the individual author(s) and contributor(s) and not of MDPI and/or the editor(s). MDPI and/or the editor(s) disclaim responsibility for any injury to people or property resulting from any ideas, methods, instructions or products referred to in the content.

