
Morphological Characteristics and Water-Use Efficiency of Siberian Elm Trees (Ulmus pumila L.) within Arid Regions of Northeast Asia


Abstract
:1. Introduction
2. Experimental Section
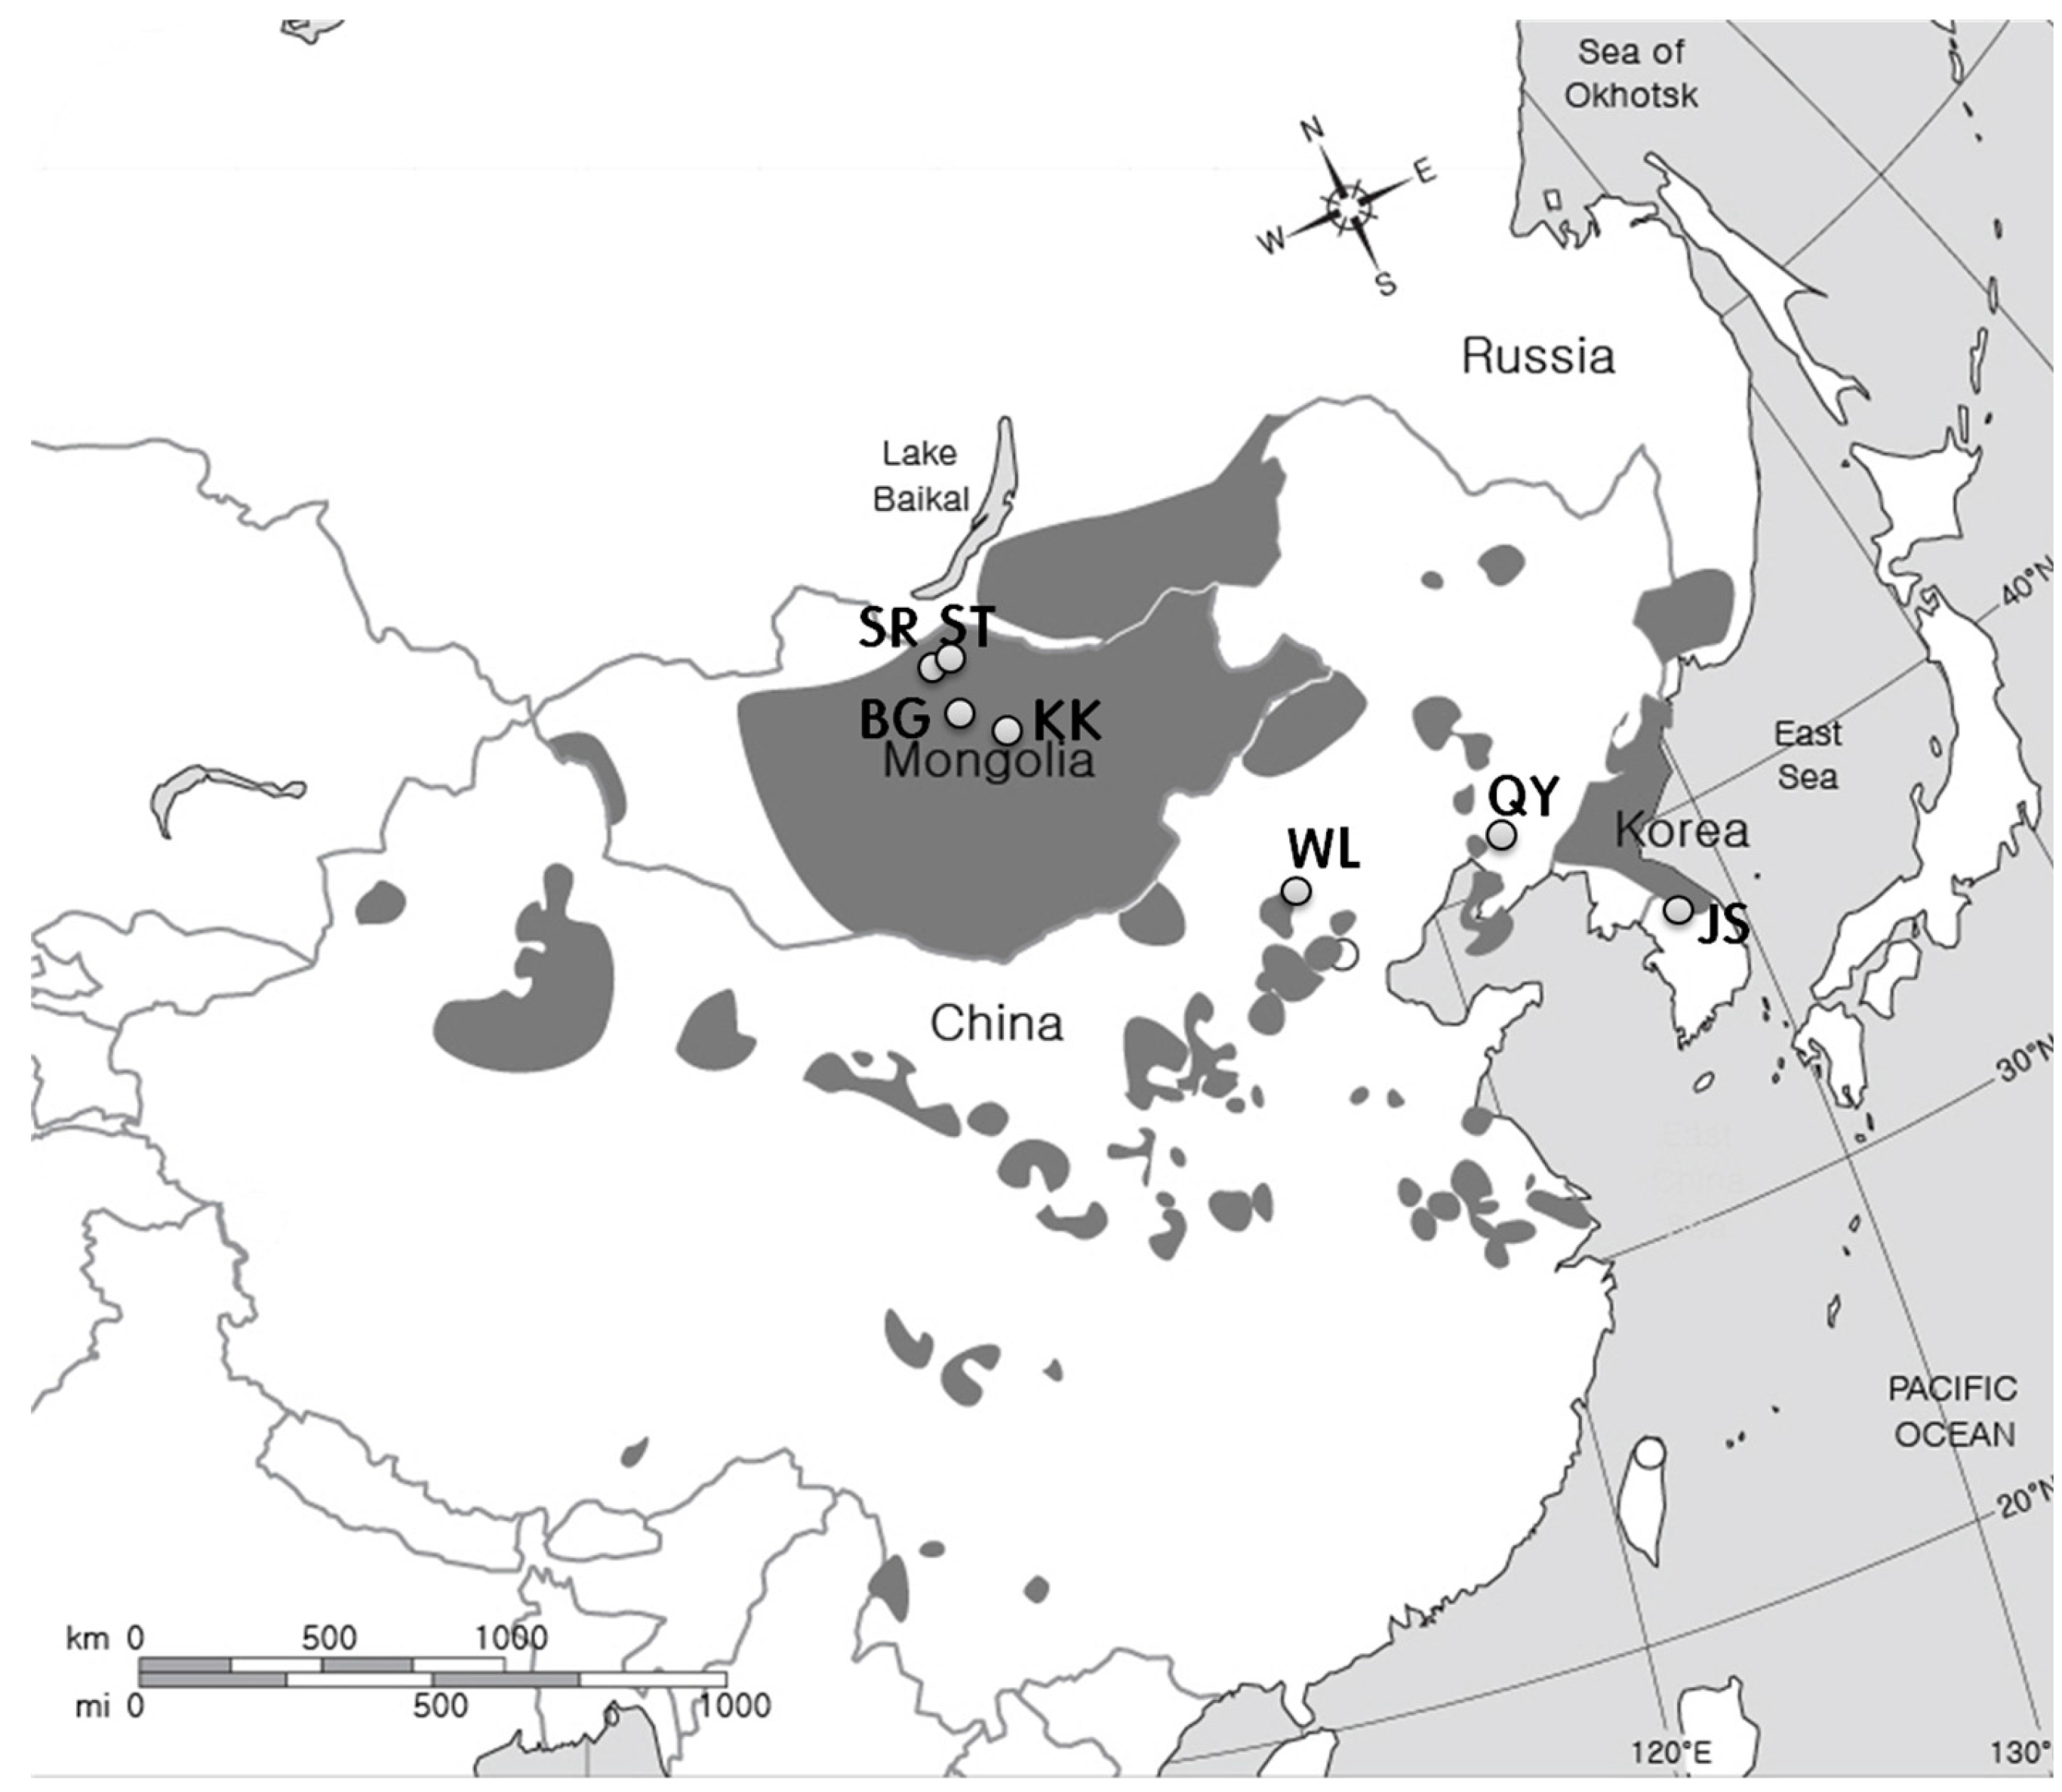
2.1. Study Sites
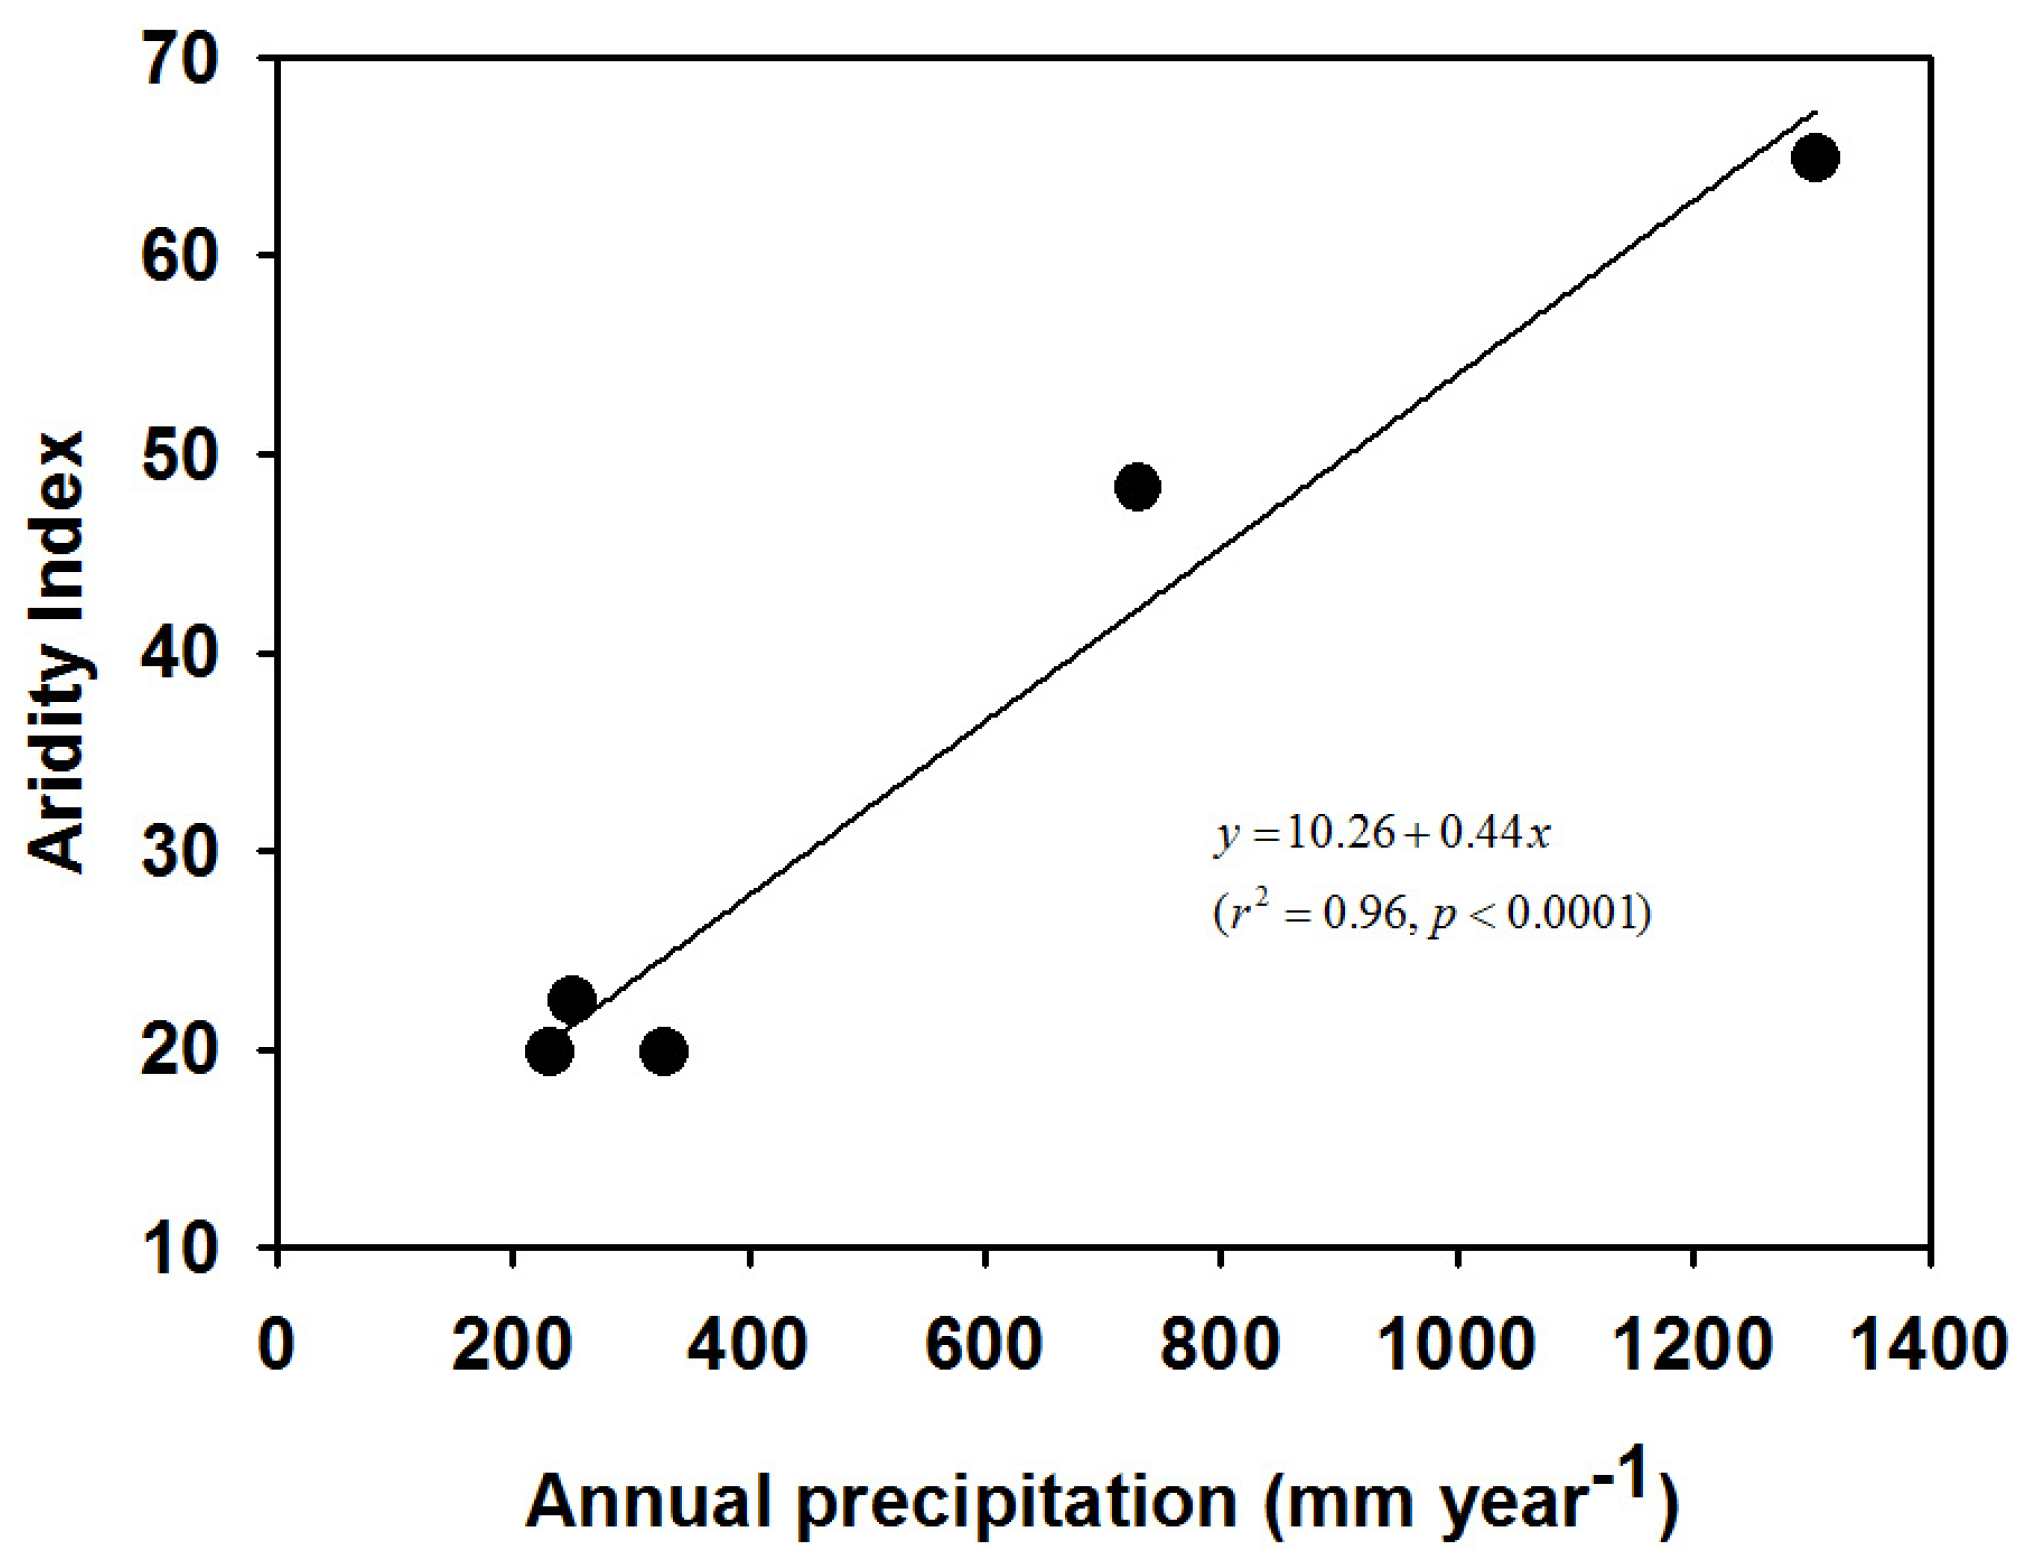
2.2. Aridity Index
2.3. Sample Collection
2.4. Leaf Mass per Leaf Unit Area (LMA)
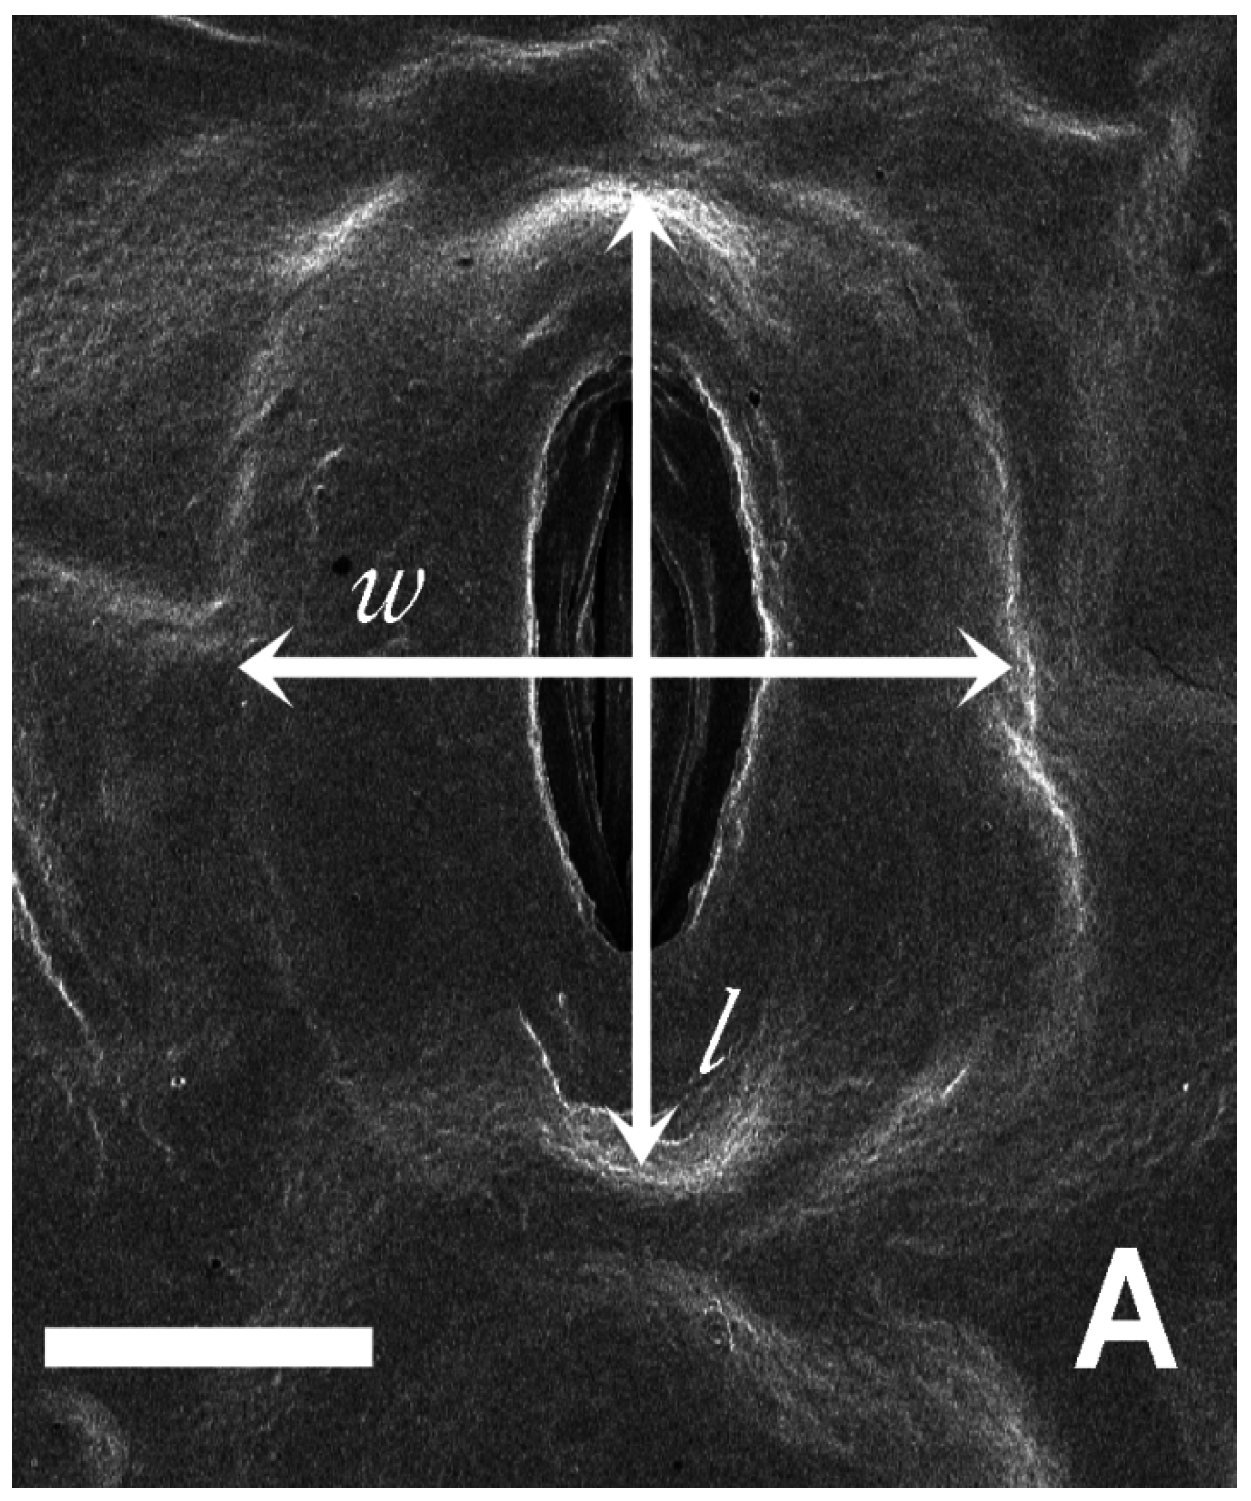
2.5. Leaf Thickness and Stomatal Size, Density and Area per Unit Leaf Area
2.6. Intrinsic WUE
2.7. Statistical Analysis
3. Results and Discussion
3.1. Environment and Aridity Index
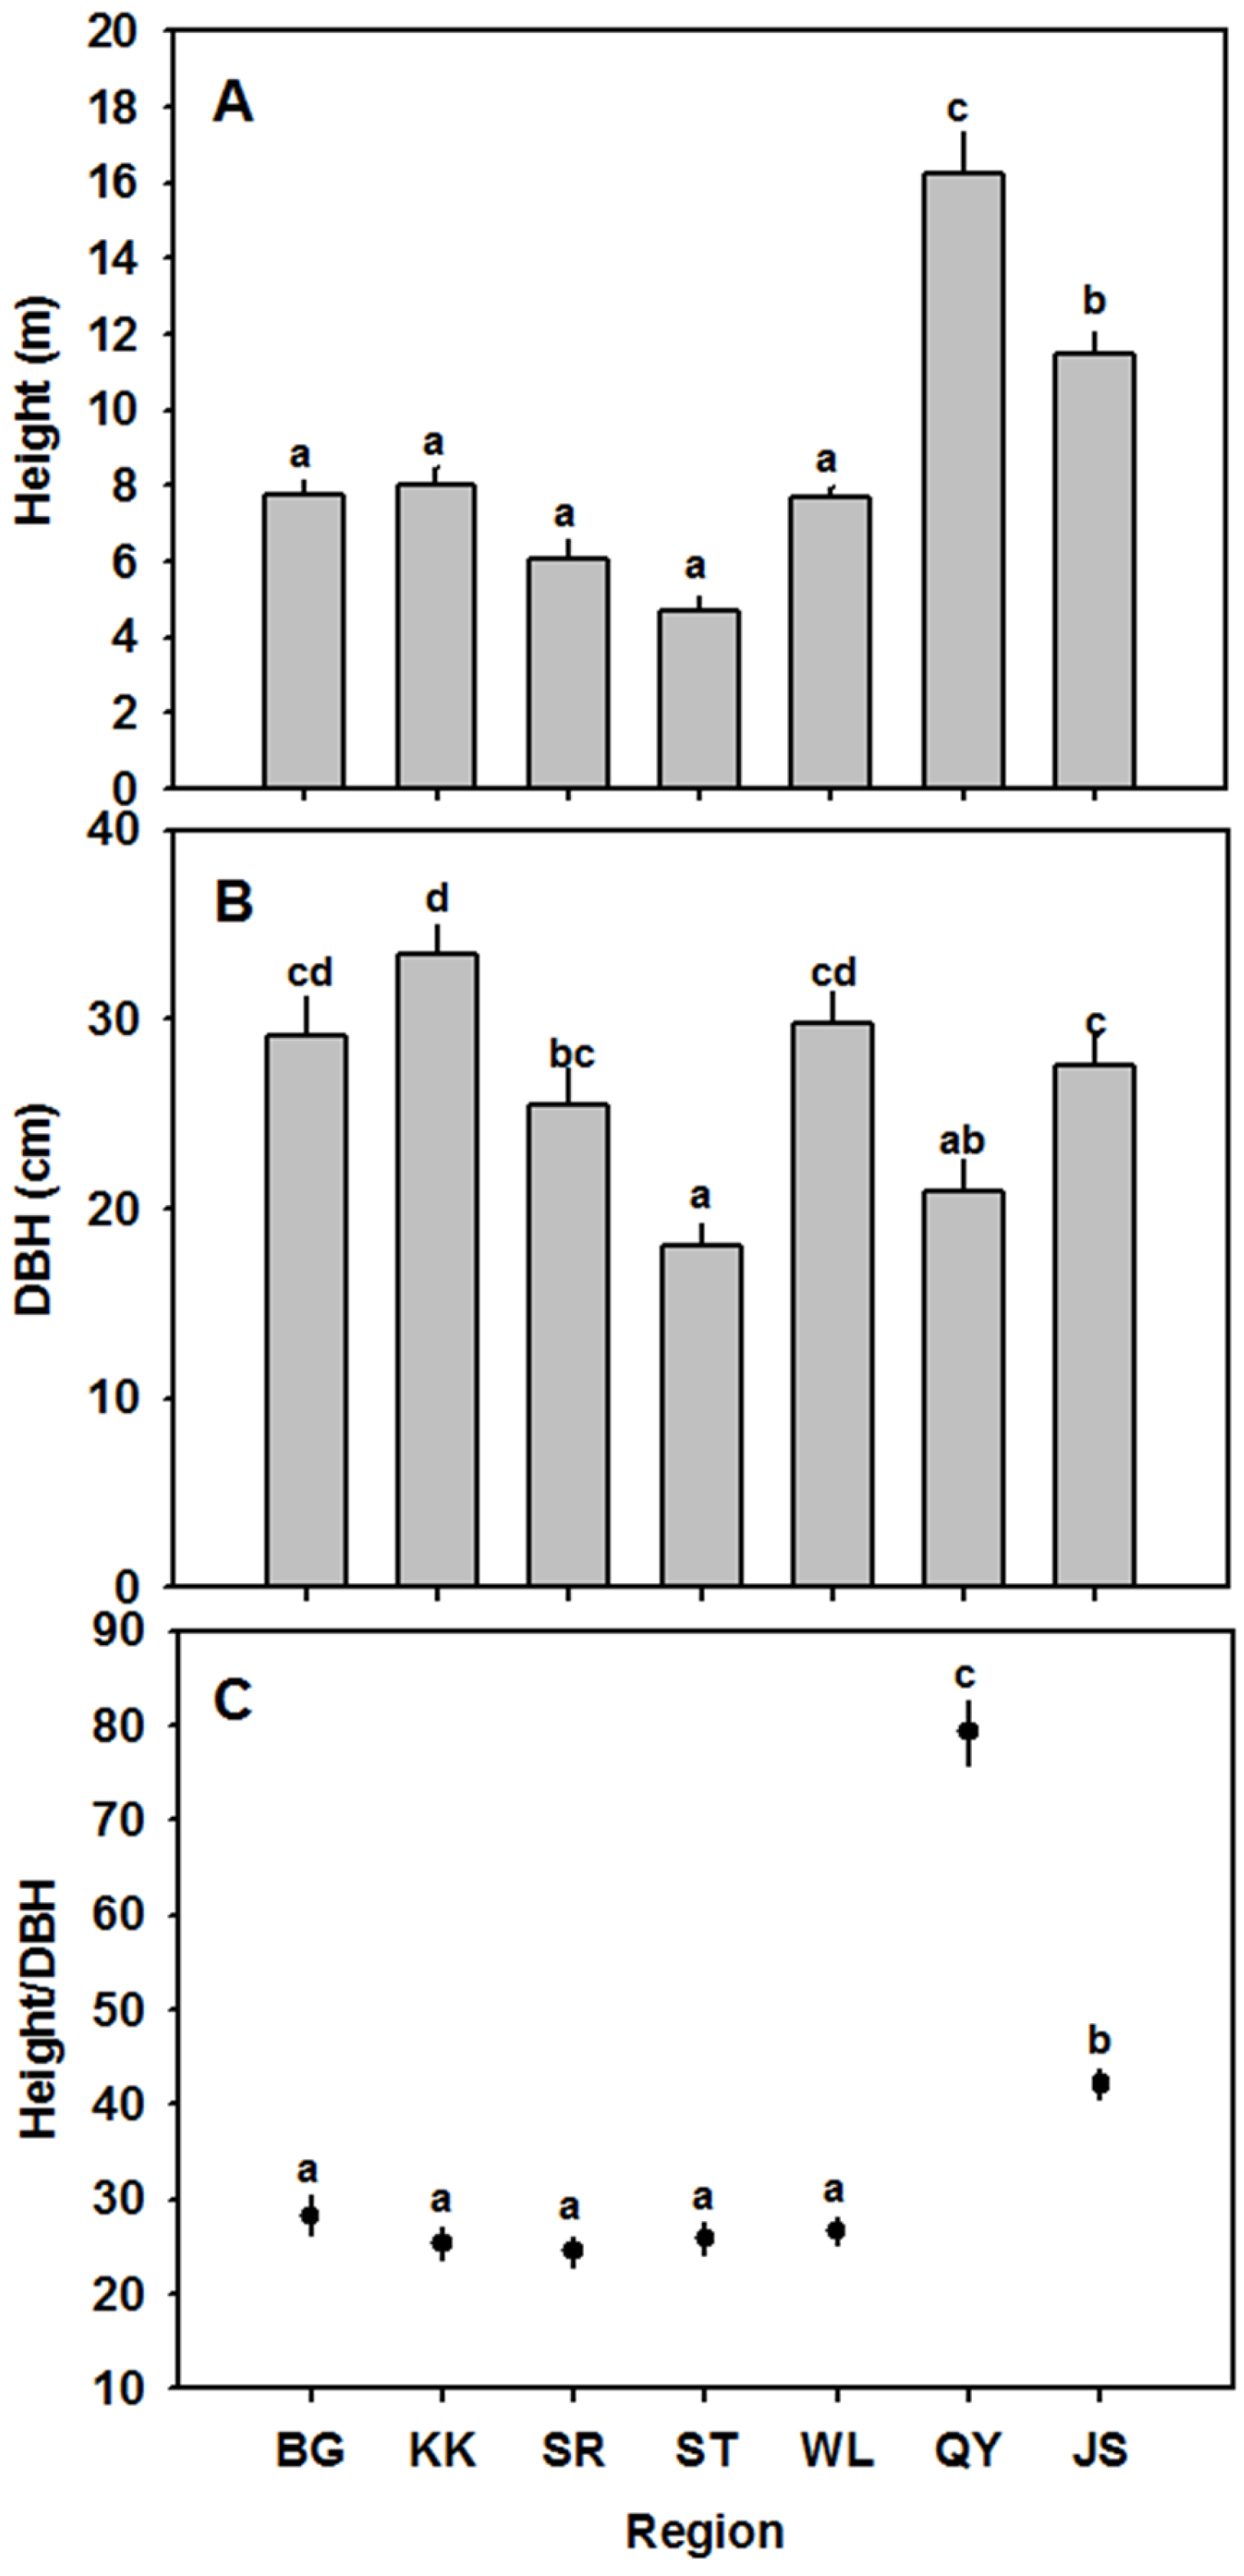
3.2. Height and DBH
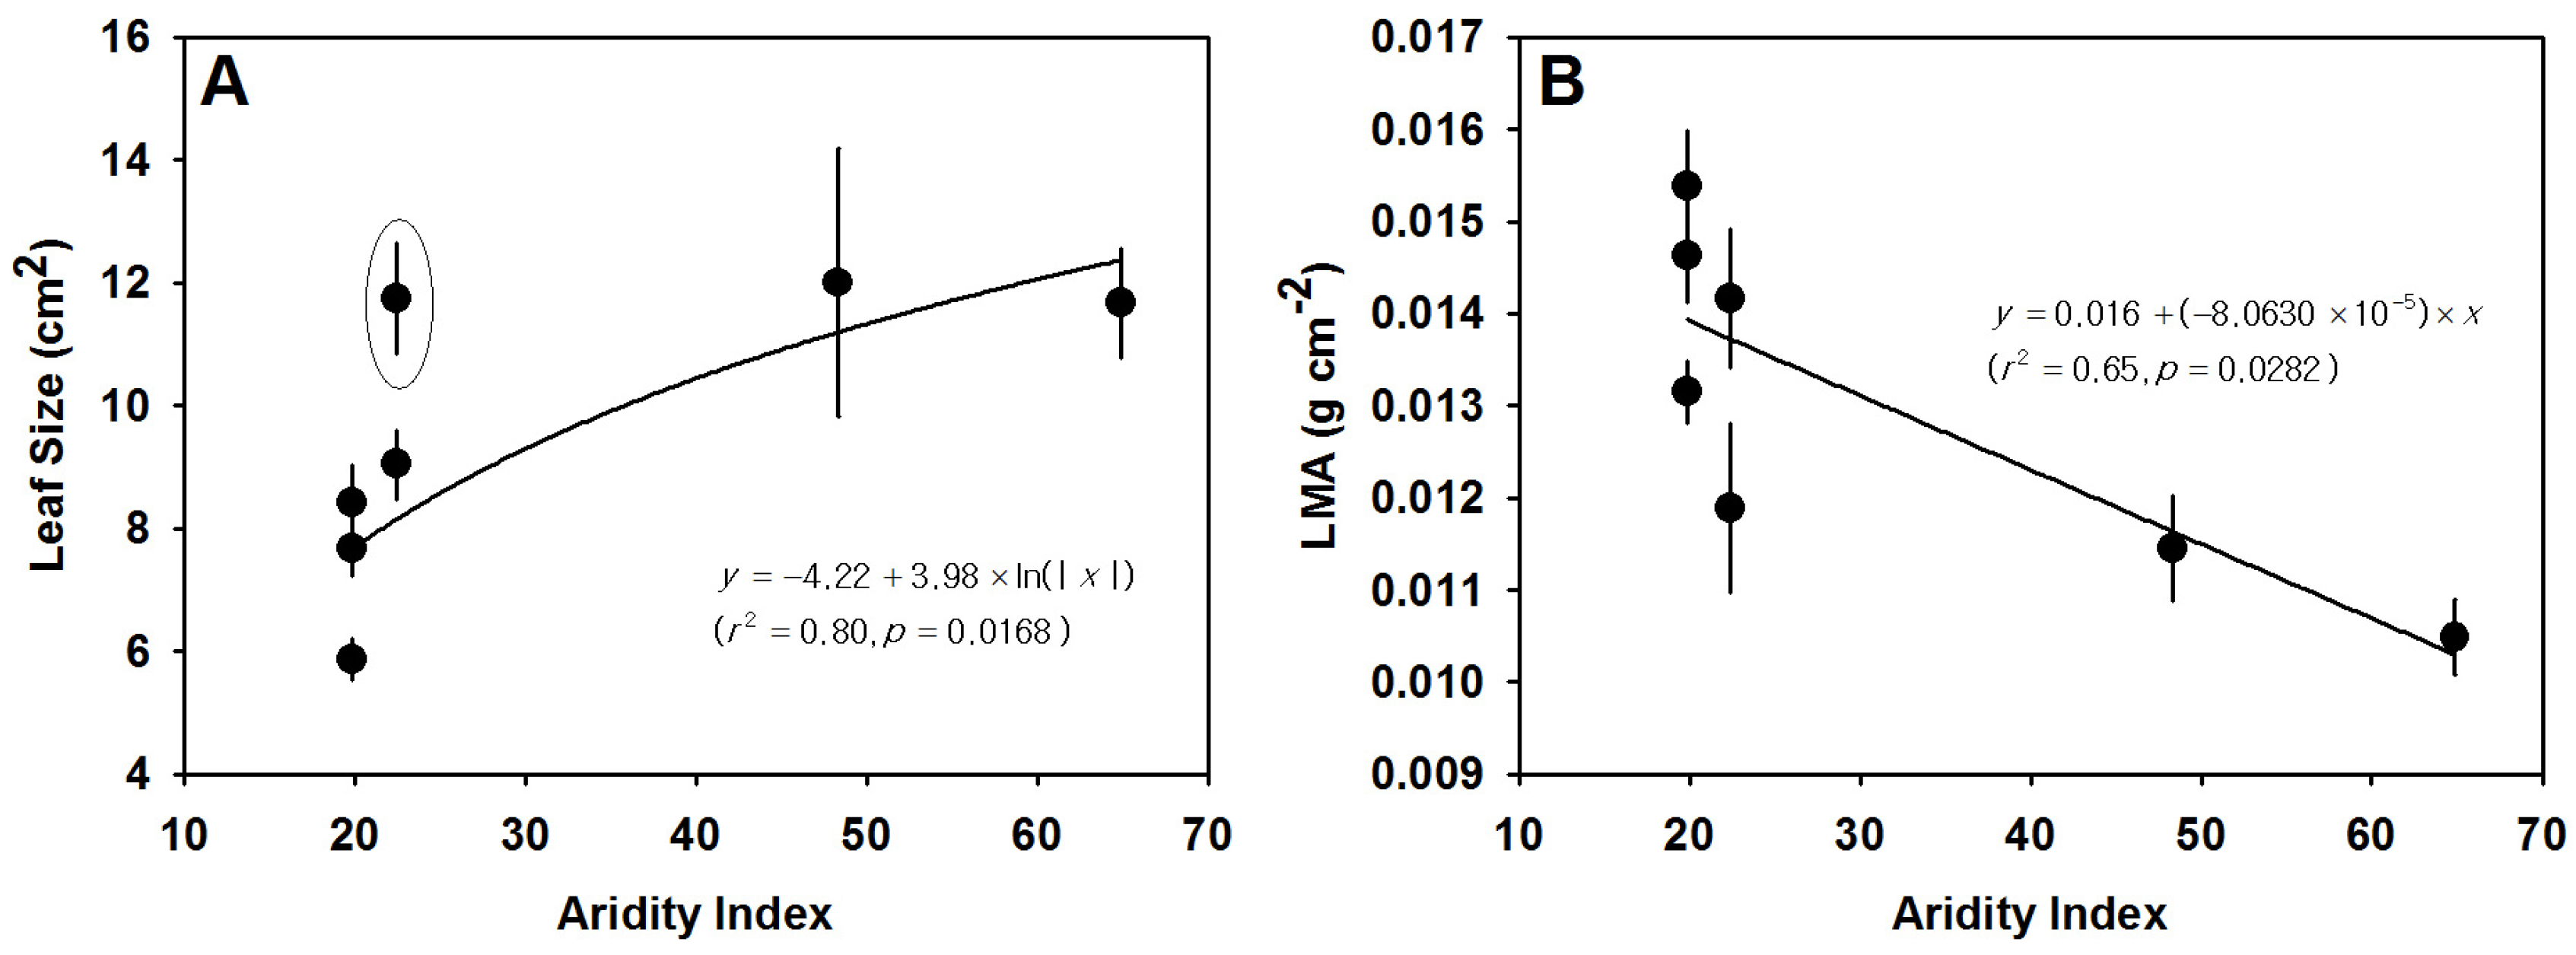
3.3. Variation in Leaf Size, LMA and Leaf Thickness
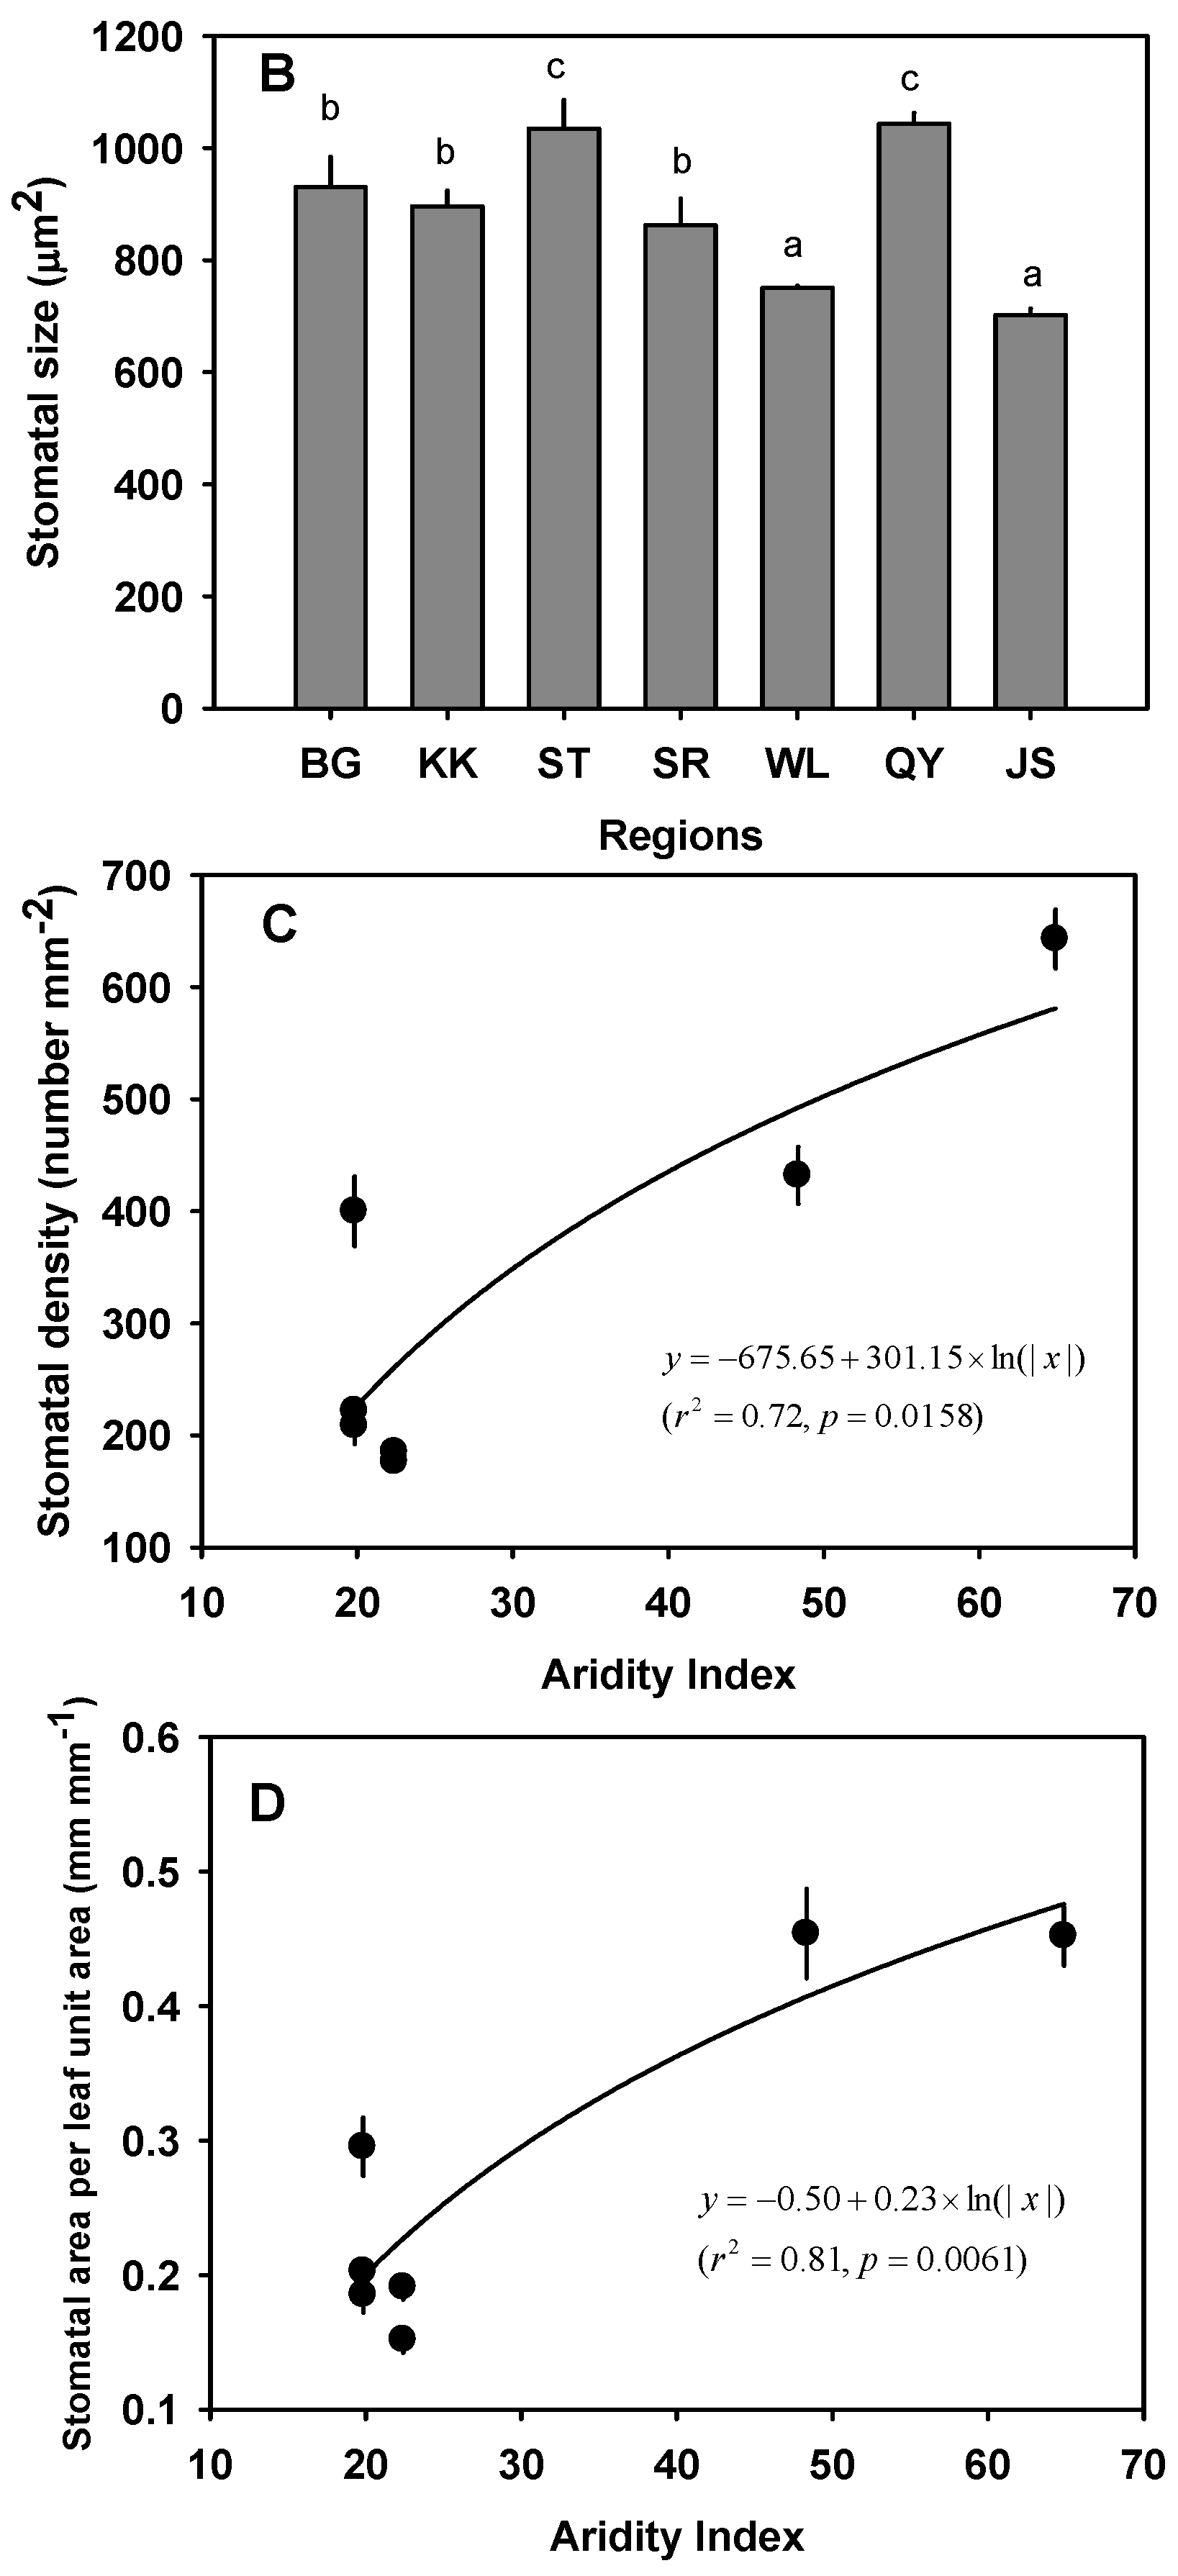
3.4. Variation in AS/AL
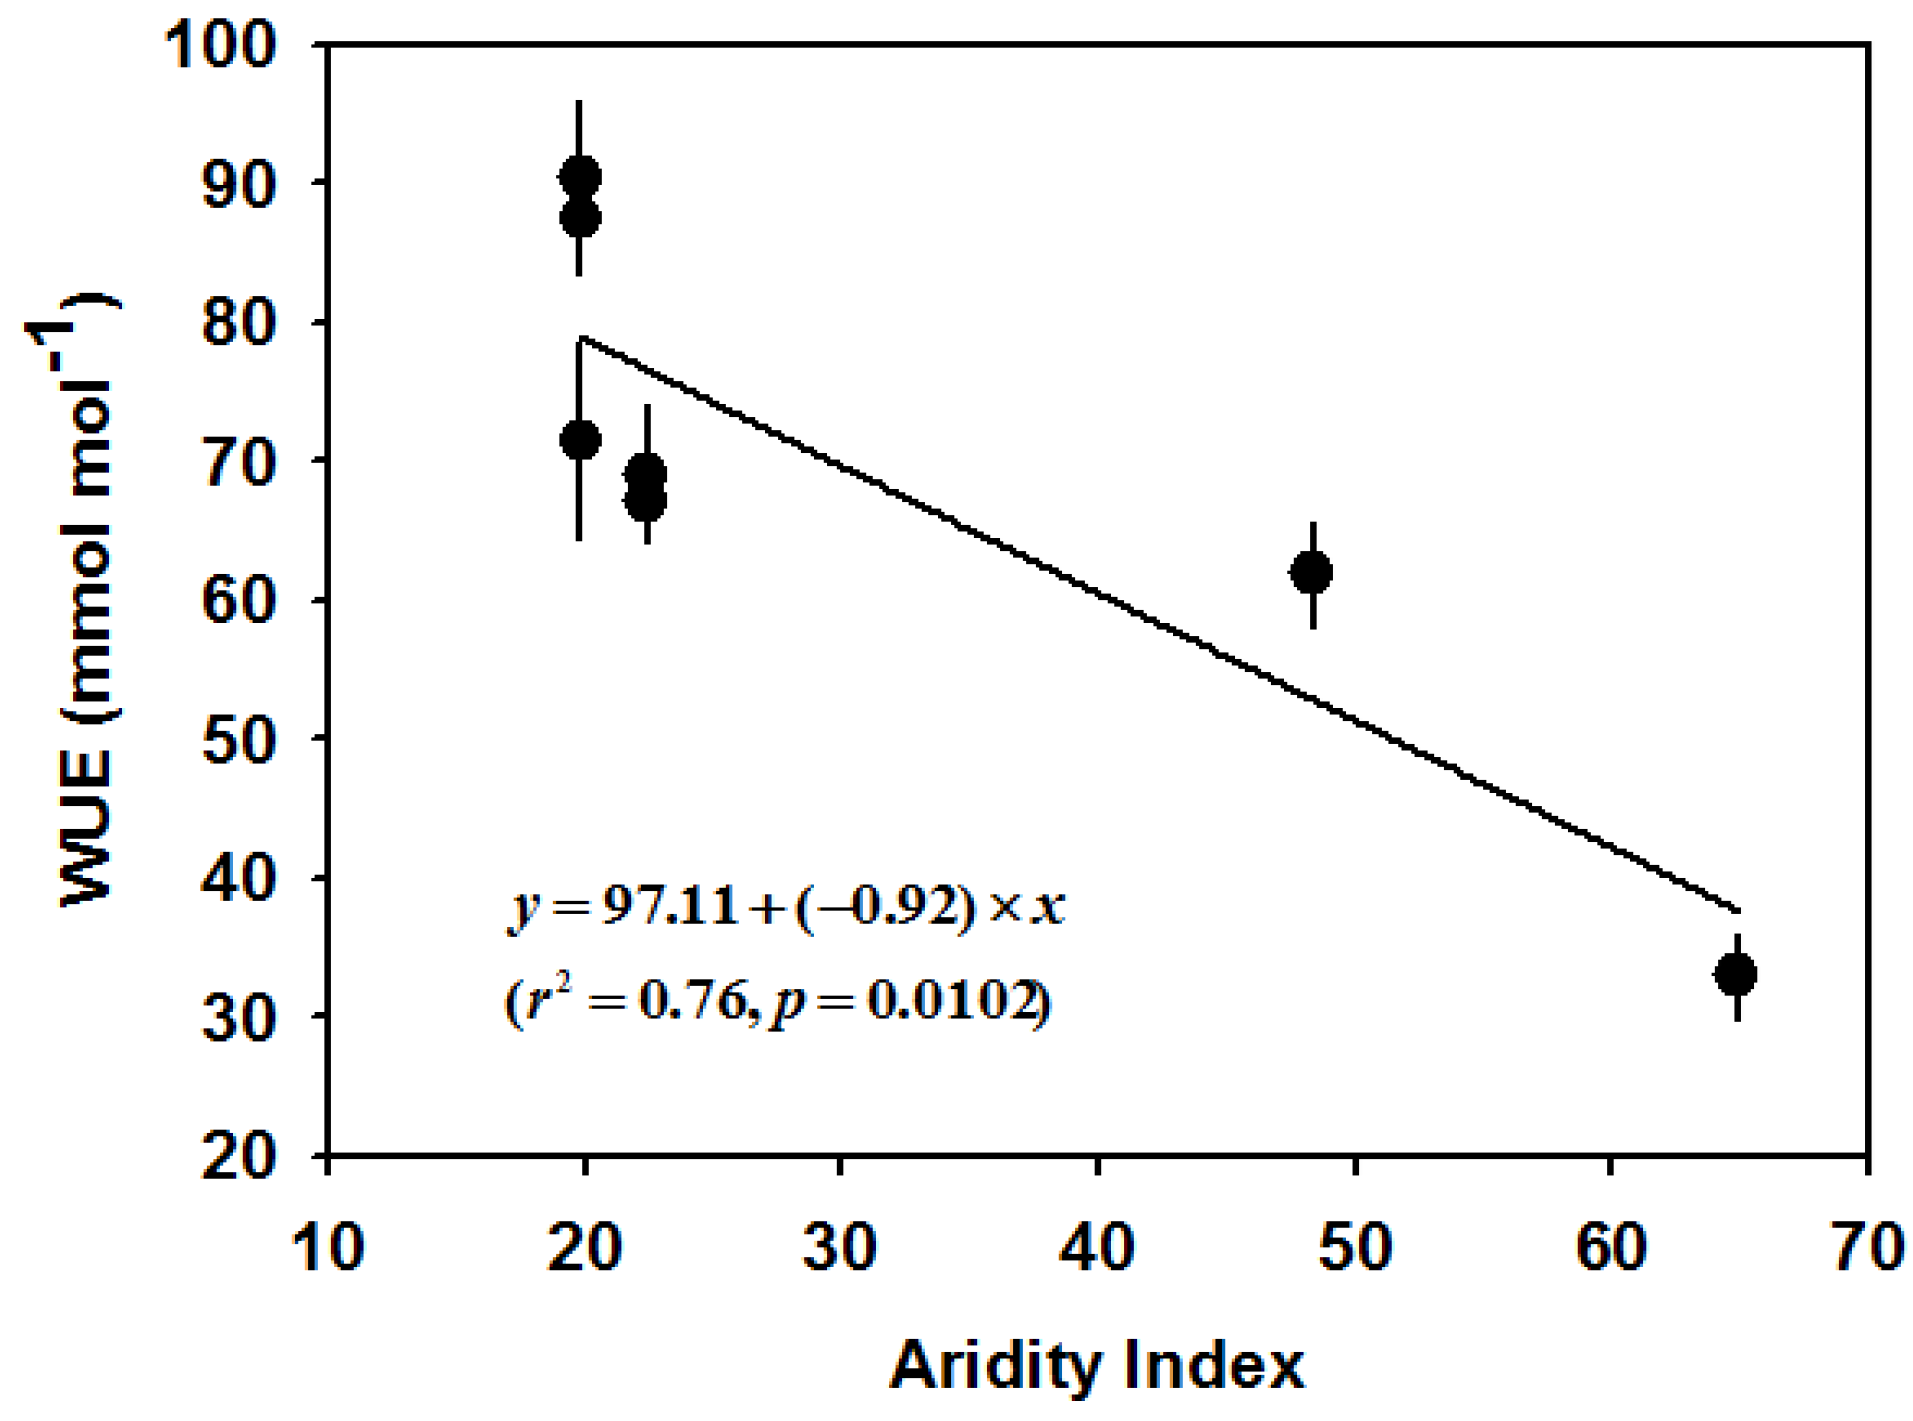
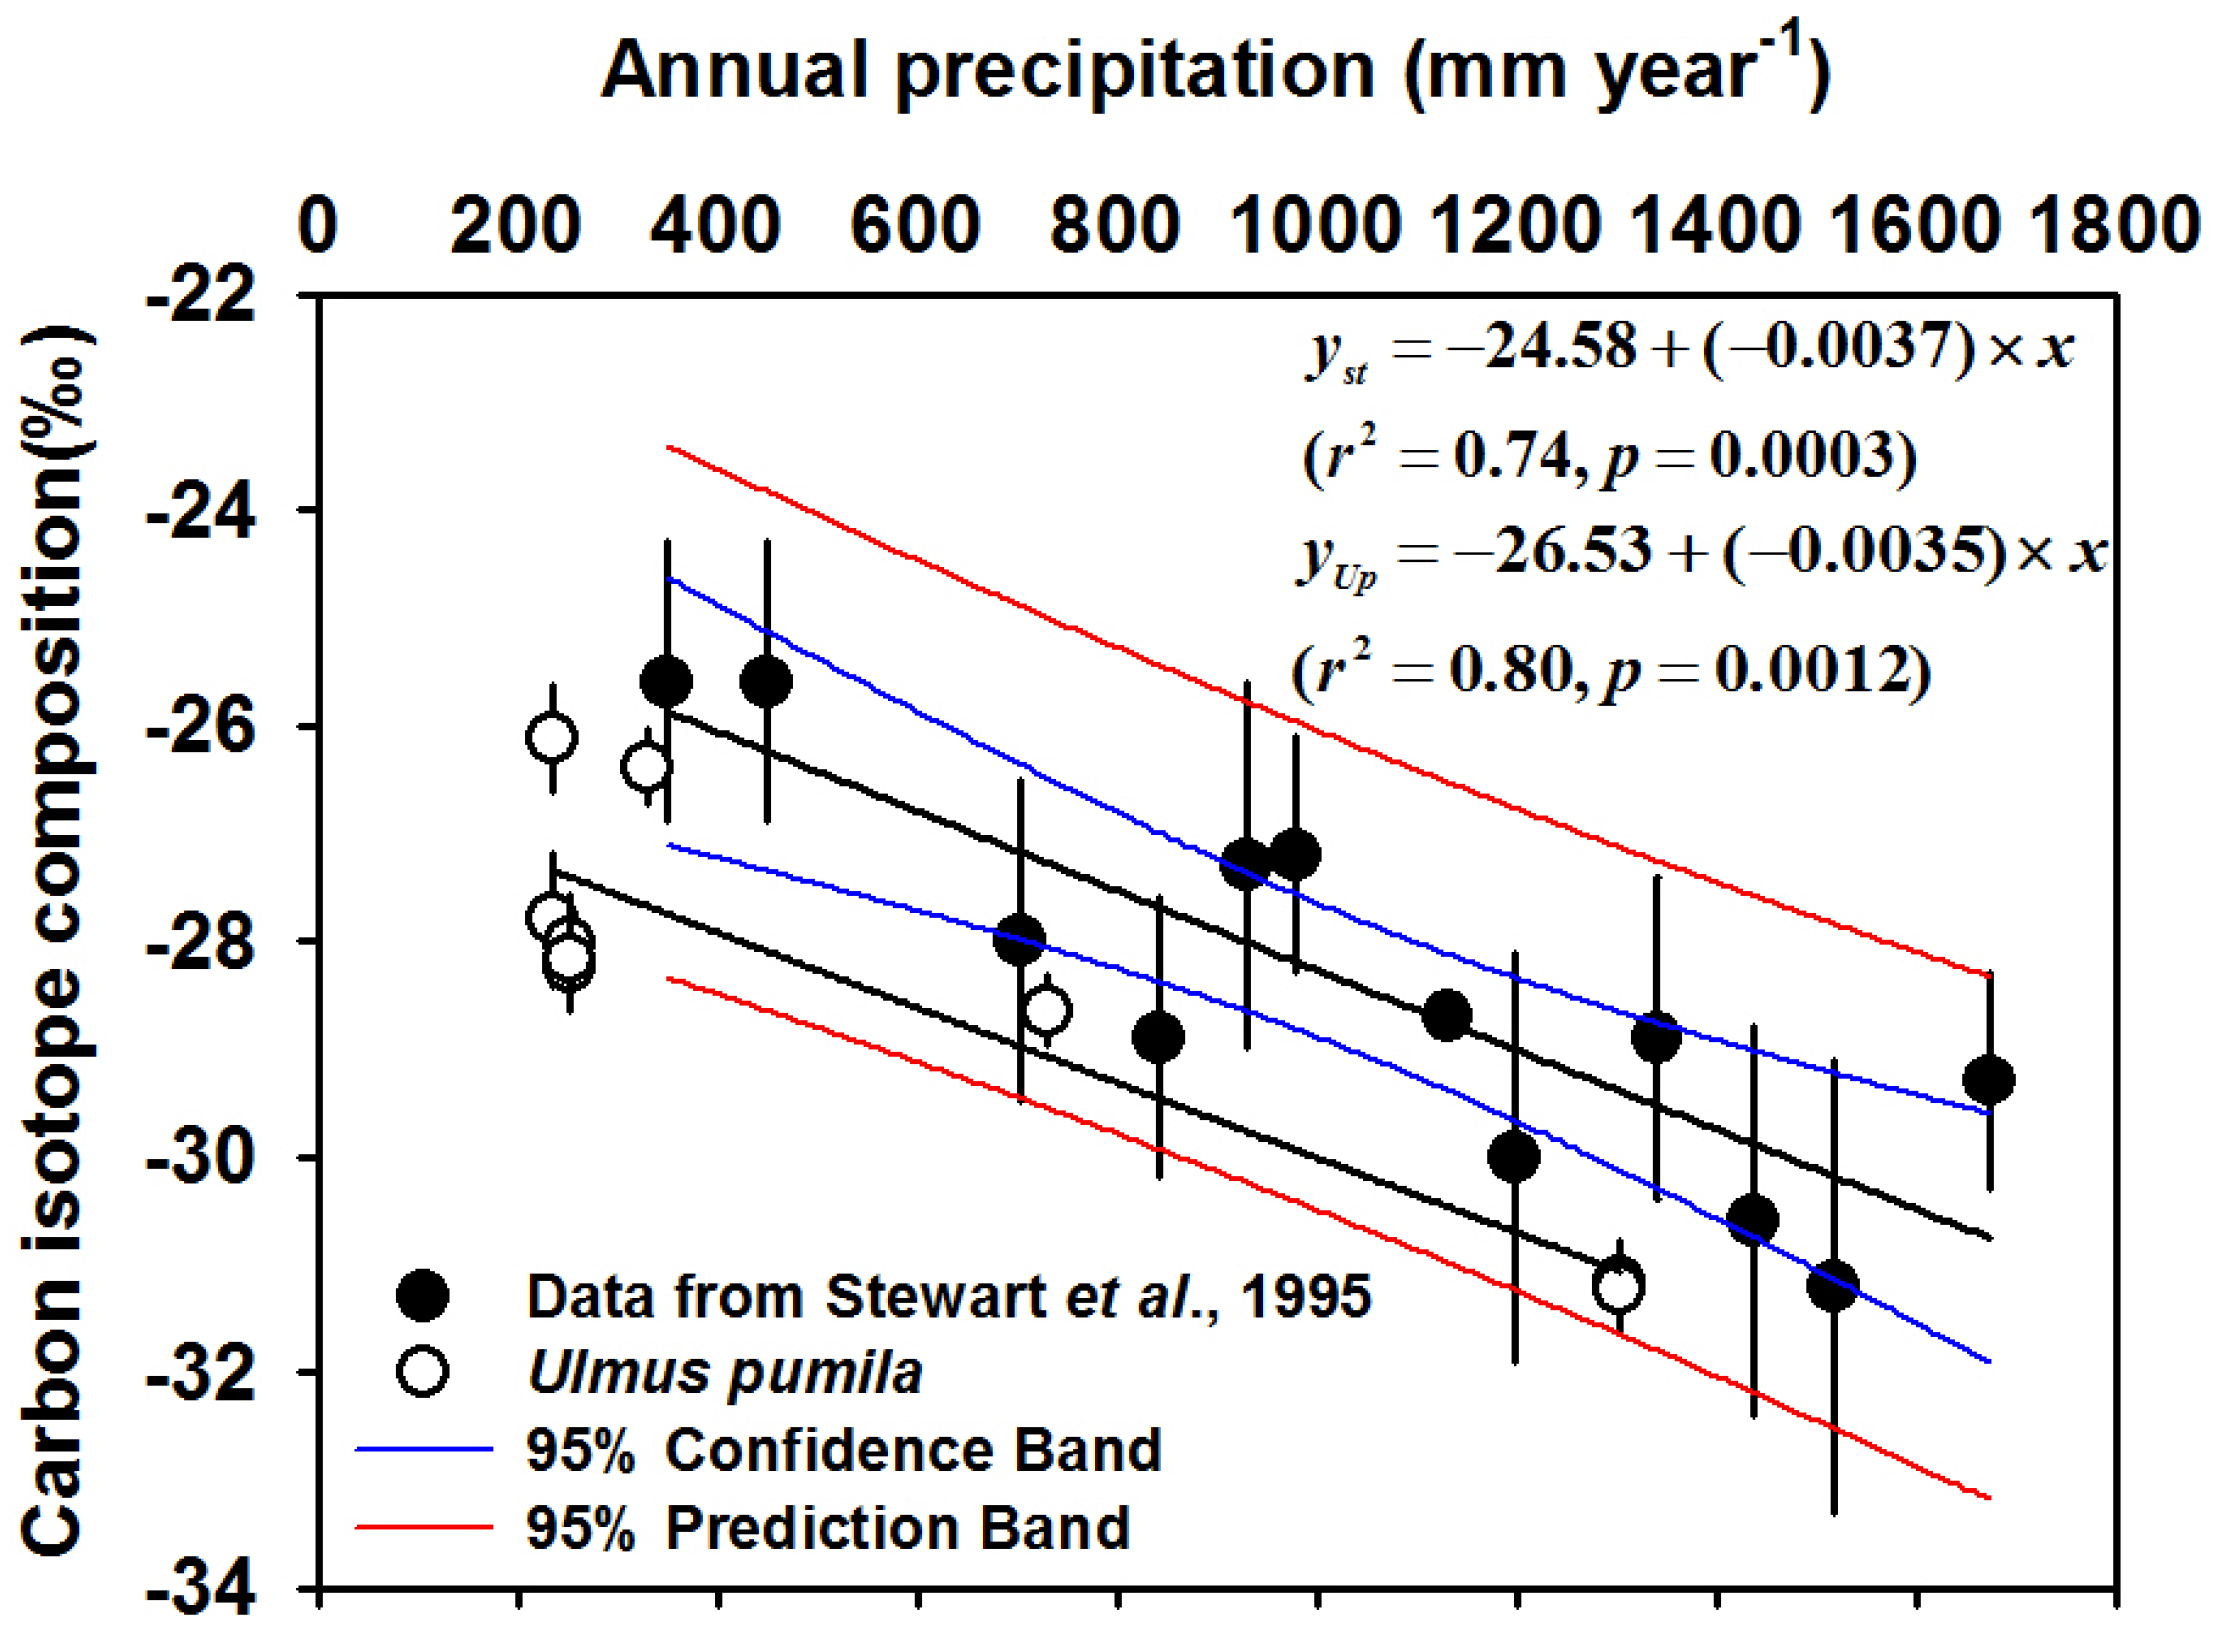
3.5. Variation of Intrinsic WUE
4. Conclusions
Acknowledgments
Author Contributions
Conflicts of Interest
References
- Adeel, Z.; Safriel, U.; Niemeijer, D.; White, R. Millennium Ecosystem Assessment: Ecosystems and Human Well-Being: Desertification Synthesis; World Resource Institute: Washington, DC, USA, 2005. [Google Scholar]
- Schlesinger, W.H.; Reynolds, J.F.; Cunningham, G.L.; Hyenneke, L.F.; Jarrell, W.M.; Virginia, R.A.; Whitford, W.G. Biological feedbacks in global desrtification. Science 1990, 247, 1043–1048. [Google Scholar] [CrossRef] [PubMed]
- Reynolds, J.F.; Smith, D.M.S.; Lambin, E.F.; Turner, B.L., II; Mortimore, M.; Batterbury, S.P.J.; Downing, T.E.; Dowlatabadi, H.; Fernández, R.J.; Herrick, J.E. Global desertification: Building a science for dryland development. Science 2007, 316, 847–851. [Google Scholar] [CrossRef] [PubMed]
- Intergovernmental Panel on Climate Change (IPCC). Climate Change 2007: Synthesis Report; The Core Writing Team, Pachauri, R.K., Reisinger, A., Eds.; Intergovernmental Panel on Climate Change: Geneva, Switzerland, 2007. [Google Scholar]
- United Nations Convention to Combat Desertification (UNCCD). Desertification: A Visual Synthesis; UN Convention to Combat Desertification (UNCCD) Secretariat: Bonn, Germany, 2011; p. 50. [Google Scholar]
- Gray, D.H.; Sotir, R. Biotechnical and Soil Bioengineering Slope Stabilization; John Wiley & Sons: New York, NY, USA, 1996. [Google Scholar]
- Cao, S.X. Why large-scale afforestation efforts in China have failed to solve the desertification problem. Environ. Sci. Technol. 2008, 42, 1826–1831. [Google Scholar] [CrossRef] [PubMed]
- Tsogtbaatar, J. Forest rehabilitation in Mongolia. In Keep Asia Green Volume II “Northeast Asia”; Lee, D.K., Ed.; International Union of Forest Research Organizations (IUFRO): Vienna, Austria, 2007; pp. 91–116. [Google Scholar]
- Bray, E.A. Plant responses to water deficit. Trends Plant Sci. Rev. 1997, 2, 48–54. [Google Scholar] [CrossRef]
- Heschel, M.S.; Sultan, S.E.; Glover, S.; Sloan, D. Population differentiation and plastic responses to drought stress in the generalist annual Polygonum persicaria. Int. J. Plant Sci. 2004, 165, 817–824. [Google Scholar] [CrossRef]
- Yin, C.; Wang, X.; Duana, B.; Luob, J.; Li, C. Early growth, dry matter allocation and water use efficiency of two sympatric Populus species as affected by water stress. Environ. Exp. Bot. 2005, 53, 315–322. [Google Scholar] [CrossRef]
- Jacobsen, A.L.; Agenbag, L.; Esler, K.J.; Pratt, R.B.; Ewers, F.W.; Davis, S.D. Xylem density, biomechanics and anatomical traits correlate with water stress in 17 evergreen shrub species of the Mediterranean-type climate region of South Africa. J. Ecol. 2007, 95, 171–183. [Google Scholar] [CrossRef]
- Jacobsen, A.L.; Pratt, R.B.; Davis, S.D.; Ewers, F.W. Cavitation resistance and seasonal hydraulics differ among three arid Californian plant communities. Plant Cell Environ. 2007, 30, 1599–1609. [Google Scholar] [CrossRef] [PubMed]
- Valladares, F.; Gioanoli, E.; Gòmez, J.M. Ecological limits to plant phenotypic plasticity. New Phytol. 2007, 176, 749–763. [Google Scholar] [CrossRef] [PubMed]
- Farquhar, G.D.; Sharkey, T.D. Stomatal conductance and photosynthesis. Annu. Rev. Plant Biol. 1982, 33, 317–345. [Google Scholar] [CrossRef]
- Lambers, H.; Chapin, F.S.; Pons, T.L. Plant Physiological Ecology, 2nd ed.; Springer: New York, NY, USA, 2008; p. 604. [Google Scholar]
- Aber, J.D.; Driscoll, C.T. Effects of land use, climate variation and N deposition on N cycling and C storage in northern hardwood forests. Glob. Biogeochem. Cycles 1997, 11, 639–648. [Google Scholar] [CrossRef]
- Stewart, G.R.; Turnbull, M.H.; Schmidt, S.; Erskine, P.D. 13C natural abundance in plant communities along a rainfall gradient: A biological integrator of water availability. Aust. J. Plant Physiol. 1995, 22, 51–55. [Google Scholar] [CrossRef]
- Schulze, E.D.; Williams, R.J.; Farquhar, G.D.; Schulze, W.; Langridge, J.; Miller, J.M.; Walker, B.H. Carbon and nitrogen isotope discrimination and nitrogen nutrition of trees along a rainfall gradient in northern Australia. Aust. J. Plant Physiol. 1998, 25, 413–425. [Google Scholar] [CrossRef]
- Chaves, M.M.; Osorio, J.; Pereira, J.S. Water use efficiency and photosynthesis. In Water Use Efficiency in Plant Biology; Bacon, M.A., Ed.; Blackwell Publishing: Hoboken, NJ, USA, 2004. [Google Scholar]
- Zhao, L.; Xiao, H.; Liu, X.; Li, J.; Xiao, S. Foliar stable carbon isotope discrimination and nutrients contents in two desert plant species. Pol. J. Ecol. 2007, 55, 57–66. [Google Scholar]
- Yanqi, S.; Fei, Y.; Xiaoyong, C.; Fulai, L. Plasticity in stomatal size and density of potato leaves under different irrigation and phosphorus regimes. J. Plant Physiol. 2014, 171, 1248–1255. [Google Scholar]
- Tomlinson, K.W.; Poorter, L.; Sterck, F.J.; Borghetti, F.; Ward, D.; Bie, S.; Langevelde, F. Leaf adaptations of evergreen and deciduous trees of semi-arid and humid savannas on three continents. J. Ecol. 2013, 101, 430–440. [Google Scholar] [CrossRef]
- Street, N.R.; Skogström, O.; Sjödin, A.; Tucker, J.; Rodrı´guez-Acosta, M.; Nilsson, P.; Jansson, S.; Taylor, G. The genetics and genomics of the drought response in Populus. Plant J. 2006, 48, 321–341. [Google Scholar] [CrossRef] [PubMed]
- Ryan, M.G.; Yoder, B.J. Hydraulic limits to tree height and tree growth. Bioscience 1997, 47, 235–242. [Google Scholar] [CrossRef]
- Mencuccini, M. The ecological significance of long-distance water transport: Short-term regulation, long-term acclimation and the hydraulic costs of stature across plant life forms. Plant Cell Environ. 2003, 26, 163–182. [Google Scholar] [CrossRef]
- Addington, R.N.; Donovan, L.A.; Mitchell, R.J.; Vose, J.M.; Pecot, S.D.; Jack, S.B.; Hacke, U.G.; Sperry, J.S.; Oren, R. Adjustments in hydraulic architecture of Pinus palustris maintain similar stomatal conductance in xeric and mesic habitats. Plant Cell Environ. 2006, 29, 535–545. [Google Scholar] [CrossRef] [PubMed]
- Poorter, H.; Niinemets, U.; Poorter, L.; Wright, I.J.; Villar, R. Causes and consequences of variation in leaf mass per area (LMA): A meta-analysis. New Phytol. 2009, 182, 565–588. [Google Scholar] [CrossRef] [PubMed]
- Mao, P.; Zang, R.; Shao, H.; Yu, J. Functional trait trade-offs for the tropical montane rain forest species responding to light from simulating experiments. Sci. World J. 2014, 2014, 1–9. [Google Scholar] [CrossRef] [PubMed]
- Ennajeh, M.; Vadel, A.M.; Cochard, H.; Khemira, H. Comparative impacts of water stress on the leag anatomy of a drought-resistant and a drought-sensitive olive cultivar. J. Hortic. Sci. Biotechnol. 2010, 85, 289–294. [Google Scholar] [CrossRef]
- Zhang, J.L.; Poorter, L.; Cao, K.F. Productive leaf functional traits of Chinese savanna species. Plant Ecol. 2012, 213, 1449–1460. [Google Scholar] [CrossRef]
- Abrams, M.D.; Kubiske, M.E.; Mostoller, S.A. Relating wet and dry year ecophysiology to leaf structure in contrasting temperate tree species. Ecology 1994, 75, 123–133. [Google Scholar] [CrossRef]
- Wright, I.J.; Reich, P.B.; Westoby, M. Strategy-shifts in leaf physiology, structure and nutrient content between species of high and low rainfall, and high and low nutrient habitats. Funct. Ecol. 2001, 15, 423–434. [Google Scholar] [CrossRef]
- Santiago, L.S.; Kitajima, K.; Wright, S.J.; Mulkey, S.S. Coordinated changes in photosynthesis, water relations and leaf nutrional traits of canopy trees along a precipitation gradient in lowland tropical forest. Oecologia 2004, 4, 495–502. [Google Scholar] [CrossRef] [PubMed]
- Schulze, E.D.; Turner, N.C.; Nicolle, D.; Schumacher, J. Species differences in carbon isotope ratios, specific leaf area and nitrogen concentrations in leaves of Eucalyptus growing in a common garden compared with along an aridity gradient. Physiol. Plant. 2006, 127, 434–444. [Google Scholar] [CrossRef]
- Willmer, C.; Fricker, M. Stomata, 2nd ed.; Chapman and Hall: London, UK, 1996; p. 375. [Google Scholar]
- Franks, P.J.; Drake, P.L.; Beerling, D.J. Plasticity in maximum stomatal conductance constrained by negative correlation between stomatal size and density: An analysis using Eucalyptus globulus. Plant Cell Environ. 2009, 32, 1737–1748. [Google Scholar] [CrossRef] [PubMed]
- Zhang, Q.; Xu, C.-Y.; Zhang, Z. Observed changes of drought/wetness episodes in the Pearl River basin, China, using the standardized precipitation index and aridity index. Theor. Appl. Climatol. 2009, 98, 89–99. [Google Scholar] [CrossRef]
- Franca, M.G.C.; Prados, L.M.Z.; Lemos-Filho, J.P.; Ranieri, B.D.; Vale, F.H.A. Morphological differences in leaves of Lavoisiera campos-portoana (Melastomataceae) enhance higher drought tolerance in water shortage events. J. Plant Res. 2012, 125, 85–92. [Google Scholar] [CrossRef] [PubMed]
- Zhang, Y.; Equiza, M.A.; Zheng, Q.; Tyree, M.T. Factors controlling plasticity of leaf morphology in Robinia pseucoacacia L. II: The impact of water stress on leaf morphology of seedlings grown in a controlled environment chamber. Ann. For. Sci. 2012, 69, 39–47. [Google Scholar] [CrossRef]
- Park, G.E.; Kim, K.W.; Lee, D.K.; Hyun, J.O. Adaptive phenotypic plasticity of Siberian elm in response to drought stress: Increased stomatal pore depth. Microsc. Microanal. 2013, 19 (Suppl. S5), 178–181. [Google Scholar] [CrossRef] [PubMed]
- Herrera, A.; Cuberos, M. Stomatal size, density and conductance in leaves of some xerophytes from a thorn scrub in Venezuela differing in carbon fixation pathway. Ecotropicos 1990, 3, 67–76. [Google Scholar]
- Venora, G.; Calcagno, F. Study of stomatal parameters for selection of drought resistant varieties in Triticum durum DESF. Euphytica 1991, 57, 275–283. [Google Scholar] [CrossRef]
- Wesche, K.; Walther, D.; von Wehrden, D.; Hesen, I. Trees in the desert: Reproduction and genetic structure of fragmented Ulmus pumila forests in Mongolian drylands. Flora 2011, 206, 91–99. [Google Scholar] [CrossRef]
- Dulamsuren, C.; Kamelin, R.V.; Cvelev, N.N.; Hauck, M.; Mühlenberg, M. Additions to the flora of the Khentej, Mongolia, Part 2. Willdenowia 2004, 34, 505–510. [Google Scholar] [CrossRef]
- Shi, L.; Zhang, Z.J.; Zhang, C.Y.; Zhang, J.Z. Effects of sand burial on survival, growth, gas exchange and biomass allocation of Ulmus pumila seedlings in the Hunshandak Sandland, China. Ann. Bot. 2004, 94, 553–560. [Google Scholar] [CrossRef] [PubMed]
- Dulamsuren, C.; Hauck, M.; Nyambayar, S.; Osokhjargai, D.; Leuschner, C. Establishment of Ulmus pumila seedlings on steppe slopes of the northern Mongolian mountain taiga. Acta Oecol. 2009, 35, 563–572. [Google Scholar] [CrossRef]
- Jiang, C.; Jian, G.; Wang, X.; Li, L.; Biswas, D.K.; Li, Y. Increased photosynthetic activities and thermost ability of photosystem II with leaf development of elm seedlings (Ulmus pumila) probed by the fast fluorescence rise OJIP. Environ. Exp. Bot. 2006, 58, 261–268. [Google Scholar] [CrossRef]
- Song, F.; Yang, C.; Liu, X.; Li, G. Effect of salt stress on activity of superoxide dismutase (SOD) in Ulmus pumila L. J. For. Res. 2006, 17, 13–16. [Google Scholar] [CrossRef]
- Li, Y.G.; Jiang, G.M.; Liu, M.Z.; Niu, S.L.; Gao, L.M.; Cao, X.C. Photosynthetic response to precipitation/rainfall in predominant tree (Ulmus pumila) seedlings in Hunshandak Sandland, China. Photosynthetica 2007, 45, 133–138. [Google Scholar] [CrossRef]
- Tanaka-Oda, A.; Kenzo, T.; Koretsune, S.; Sasaki, H.; Fukuda, K. Ontogenetic changes in water-use efficiency (δ13C) and leaf traits differ among tree species growing in a semiarid region of the Loess Plateau, China. For. Ecol. Manag. 2010, 259, 953–957. [Google Scholar] [CrossRef]
- Yang, W.Q.; Murthy, R.; King, P.; Topa, M.A. Diurnal changes in gas exchange and carbon partitioning in needles of fast- and slow-growing families of loblolly pine (Pinus taeda). Tree Physiol. 2002, 22, 489–498. [Google Scholar] [CrossRef] [PubMed]
- Yan, Q.L.; Zhu, J.J.; Hu, Z.B.; Sun, O.J. Environmental impacts of the Shelter Forests in Horqin Sandy Land, Northeast China. J. Environ. Qual. 2011, 40, 815–824. [Google Scholar] [CrossRef] [PubMed]
- Ma, J.; Liu, Z.; Zeng, D.; Liu, B. Aerial seed bank in Artemisia species: how it responds to sand mobility. Trees 2010, 24, 435–441. [Google Scholar] [CrossRef]
- Choung, H.L.; Kim, C.H.; Yang, K.C.; Chun, J.I.; Roh, H.C. Structural characteristics and maintenance mechanism of Ulmus pumila community at the Dong River, Gangwon-do, South Korea. J. Ecol. Field Biol. 2003, 26, 255–261. [Google Scholar] [CrossRef]
- Gitz, D.C.; Baker, J.T. Methods for creating stomatal impressions directly onto archivable slides. Agron. J. 2009, 101, 232–236. [Google Scholar] [CrossRef]
- Farquhar, G.D.; O’Leary, M.H.; Berry, J.A. On the relationship between carbon isotope discrimination and the intercellular carbon dioxide concentration in leaves. Aust. J. Plant Physiol. 1982, 9, 121–137. [Google Scholar] [CrossRef]
- Korol, R.L.; Kirschbaum, M.U.F.; Farquar, G.D.; Jeffreys, M. Effects of water status and soil fertility on the C-isotope signature in Pinus radiata. Tree Physiol. 1999, 19, 551–562. [Google Scholar] [CrossRef] [PubMed]
- Saurer, M.; Siegwolf, R.W.; Schweinfruber, F.H. Carbon isotope discrimination indicates improving water-use effieicncy of trees in northern Eurasia over the last 100 years. Glob. Chang. Biol. 2004, 10, 2109–2120. [Google Scholar] [CrossRef]
- Duncan, D.B. Multiple range and multiple F test. Biometrics 1955, 11, 1–42. [Google Scholar] [CrossRef]
- World Meteorological Organization. Drought and Agriculture; WMO Note 138 Publications WMO-392; WMO: Geneva, Switzerland, 1975; p. 127. [Google Scholar]
- Sperry, J.S.; Pockman, W.T. Limitation of transpiration by hydraulic conductance and xylem cavitation in Betula occidentalis. Plant Cell Environ. 1993, 16, 279–287. [Google Scholar] [CrossRef]
- Saliendra, N.Z.; Sperry, J.S.; Comstock, J.P. Influence of leag water status on stomatal response to humidity, hydraulic conductance, and soil drought in Betula occidentalis. Planta 1995, 196, 357–366. [Google Scholar] [CrossRef]
- Bond, B.J.; Kavanagh, K.L. Stomatal behavior of four woody species in relation to leaf-specific hydraulic conductance and threshold water potential. Tree Physiol. 1999, 19, 503–510. [Google Scholar] [CrossRef] [PubMed]
- Schäfer, K.V.R.; Oren, R.; Tenhunen, J.D. The effect of tree height on crown level stomatal conductance. Plant Cell Environ. 2000, 23, 365–375. [Google Scholar] [CrossRef]
- Duan, B.; Yin, C.; Li, C. Responses of conifers to drought stress. Chin. J. Appl. Environ. Biol. 2005, 11, 115–122. [Google Scholar]
- Sterk, F.H.; Zweifel, R.; Sass-Klaassen, U.; Chowdury, Q. Persisting soil drought reduces leaf specific conductiveity in Scots pine (Pinus sylvestris) and pubescent oak (Quercus pubescen). Tree Physiol. 2008, 28, 529–536. [Google Scholar] [CrossRef]
- Martı´nez-Vilalta, J.; Prat, E.; Oliveras, I.; Piñol, J. Xylem hydraulic properties of roots and stems of nine Mediterranean woody species. Ecophygiology 2002, 133, 19–29. [Google Scholar]
- Katul, G.; Leuning, R.; Oren, R. Relationship between plant hydraulic and biochemical properties derived from a steady-state coupled water and carbon transport model. Plant Cell Environ. 2003, 26, 339–350. [Google Scholar] [CrossRef]
- Hacke, U.G.; Sperry, J.S.; Wheeler, J.K.; Castro, L. Scaling of angiosperm xylem structure with safety and efficiency. Tree Physiol. 2006, 26, 689–701. [Google Scholar] [CrossRef] [PubMed]
- Sperry, J.S.; Hacke, U.G.; Pittermann, J. Size and function in conifer tracheids and angiosperm vessels. Am. J. Bot. 2006, 93, 1490–1500. [Google Scholar] [CrossRef] [PubMed]
- Micco, V.; Aronne, G.; Baas, P. Wood anatomy and hydraulic architecture of stems and twigs of some Mediterranean trees and shrubs along a mesic-xeric gradient. Trees 2008, 22, 643–655. [Google Scholar] [CrossRef]
- Givnish, T.J. Comparative studies of leaf form: Assessing the relative roles of selective pressures and phylogenetic constrains. New Phytol. 1987, 106, 131–160. [Google Scholar] [CrossRef]
- Campbell, G.S.; Norman, J.M. The light environment of plant canopies. In An Introduction to Environmental Physics; Springer: New York, NY, USA, 1998; pp. 247–278. [Google Scholar]
- McDwell, N.; Pockman, W.T.; Allen, C.D.; Breshears, D.D.; Cobb, S.; Kolb, T.; Plaut, J.; Sperry, J.; West, A.; Williams, D.G.; Yepez, E.A. Mechanisms of plant survival and mortality during drought: why do some plants survive while others succumb to drought? New Phytol. 2008, 178, 719–739. [Google Scholar] [CrossRef] [PubMed]
- Montpied, P.; Granier, A.; Dreyer, E. Seasonal time-course of gradients of photosynthetic capacity and mesophyll conductance to CO2 across a beech (Fagus sylvatica L.) canopy. J. Exp. Bot. 2009, 60, 2407–2418. [Google Scholar] [CrossRef] [PubMed]
- Sack, L.; Holbrook, N.M. Leaf hydraulics. Annu. Rev. Plant Biol. 2006, 57, 361–381. [Google Scholar] [CrossRef] [PubMed]
- Murphy, M.R.C.; Jordan, G.J.; Brodribb, T.J. Differential leaf expansion can enable hydraulic acclimation to sun and shade. Plant Cell Environ. 2012, 35, 1407–1418. [Google Scholar] [CrossRef] [PubMed]
- Brèda, N.; Huc, R.; Granier, A.; Dreyer, E. Temperate forest trees and stands under severe drought: A review of ecophysiological responses, adaptation processes and long-term consequences. Ann. For. Sci. 2006, 63, 625–644. [Google Scholar] [CrossRef]
- Reich, P.B.; Ellsworth, D.S.; Walters, M.B. Leaf structure (specific leaf area) modulates photosynthesis-nitrogen relations: evidence from within and across species and functional groups. Funct. Ecol. 1998, 12, 948–958. [Google Scholar] [CrossRef]
- Tarémolières, M.; Schnitzler, A.; Sánchez-Pérez, J.M.; Sachmitt, D. Changes in foliar nutrient content and respiration in Fraxinus excelsior L., Ulmus minor Mill. and Clematis vitalba L. after prevention of floods. Ann. For. Sci. 1999, 56, 641–650. [Google Scholar] [CrossRef] [Green Version]
- Mediavilla, S.; Gallardo-López, V.; González-Zurdo, P.; Escudero, A. Patterns of leaf morphology and leaf N content in relation to winter temperatures in three evergreen tree species. Int. J. Biometeorol. 2012, 56, 915–926. [Google Scholar] [CrossRef] [PubMed]
- Lamont, B.B.; Groom, P.K.; Cowling, R.M. High leaf mass per area of related species assemblages may reflect low rainfall and carbon isotope discrimination rather than low phosphorus and nitrogen concentrations. Funct. Ecol. 2002, 16, 403–412. [Google Scholar] [CrossRef]
- Poorter, H.; DeJong, R. Specific leaf area, chemical composition and leaf construction costs of plant species from productive and unproductive habitats. New Phytol. 1999, 143, 163–176. [Google Scholar] [CrossRef]
- Villar, R.; Robleto, J.R.; De Jong, Y.; Poorter, H. Differences in construction costs and chemical composition between deciduous and evergreen woody species are small as compared to differences among families. Plant Cell Environ. 2006, 29, 1629–1643. [Google Scholar] [CrossRef] [PubMed]
- Wilson, J.R.; Ludlow, M.M.; Fisher, M.J.; Schulze, E.D. Adaptation to water stress of the leaf water relations of four tropical forage species. Aust. J. Plant Physiol. 1980, 7, 207–220. [Google Scholar] [CrossRef]
- Turner, N.C.; Begg, J.E. Plant-water relations and adaptation to stress. Plant Soil 1981, 58, 97–131. [Google Scholar] [CrossRef]
- Morgan, J.M. Osmoregulation and water stress in higher plants. Annu. Rev. Plant Phys. 1984, 35, 299–319. [Google Scholar] [CrossRef]
- Alvarez-Clare, S.; Kitajima, K. Physical defence traits enhance seedling survival of neotropical tree species. Funct. Ecol. 2007, 21, 1044–1054. [Google Scholar] [CrossRef]
- Hetherington, A.M.; Woodward, F.I. The role of stomata in sensing and driving environmental change. Nature 2003, 424, 901–908. [Google Scholar] [CrossRef] [PubMed]
- Drake, P.L.; Froend, R.H.; Franks, P.J. Smaller, faster stomata: Scaling of stomatal size, rate of response, and stomatal conductance. J. Exp. Bot. 2013, 64, 495–505. [Google Scholar] [CrossRef] [PubMed]
- Brodribb, T. Dynamics of changing intercellular CO2 concentration during drought and determination of minimum functional Ci. Plant Physiol. 2006, 111, 179–185. [Google Scholar] [CrossRef]
- Savage, J.A.; Cavender-Bares, J.A. Contrasting drought survival strategies of sympatric willows (genus: Salix): Consequences for coexistence and habitat specialization. Tree Physiol. 2011, 31, 604–614. [Google Scholar] [CrossRef] [PubMed]


| Country | Sampling Site | Geographical Location | Altitude (m) | Climate and Site Type | Annual Precipitation (mm) | Mean Annual Temperature (°C) | Maximum Monthly Temperature (°C) | Minimum Monthly Temperature (°C) | Aridity Index |
|---|---|---|---|---|---|---|---|---|---|
| Mongolia | Bayan Gobi (5) | 47°17′16.5″ N 103°44′46.1″ E | 1283 | Arid climate and sand dune | 232 ± 30 ** d *** | 1.7 ± 0.6 d | 19.7 ± 0.8c | −16.0 ± 1.0 a | 19.83 |
| Khugnukhan (5) | 47°26′01.7″ N 103°40′40.1″ E | 1342 | Arid climate and wood land | 232 ± 30 d | 1.7 ± 0.6 d | 19.7 ± 0.8 c | −16.0 ± 1.0 a | 19.83 | |
| Selenge steppe (4) | 50°09′03.6″ N 106°12′37.4″ E | 630 | Semi-arid climate and wood land | 251 ± 17 | 1.2 ± 0.2 | 22.1 ± 0.3 | −24.5 ± 0.3 | 22.41 | |
| Selenge riverside (4) | 50°03′54.7″ N 106°09′02.3″ E | 614 | Semi-arid climate and riverside | 251 ± 17 | 1.2 ± 0.2 | 22.1 ± 0.3 | −24.5 ± 0.3 | 22.41 | |
| China | Wulanaodu (3) | 43°04′53.8″ N 119°36′33.2″ E | 537 | Semi-arid climate and sand dune | 329 ± 35 c | 6.6 ± 0.6 b | 25.9 ± 3.2 b | −14.4 ± 1.3 ab | 19.82 |
| Qingyuan (2) | 41°54′57.2″ N 124°55′13.1″ E | 607 | Warm temperate climate and valley in forest | 730 ± 123 b | 5.1 ± 0.5 c | 23.9 ± 5.7 a | −11 ± 1.7 b | 48.34 | |
| Korea | Jeongseon (1) | 37°16′16.6″ N 128°35′31.0″ E | 242 | Warm temperate climate and valley in forest | 1304 ± 103 a | 10.1 ± 0.1 a | 23.2 ± 0.8 a | −4.3 ± 0.7 c | 64.88 |
| Sampling Site | Climate Type | H | DBH | H/DBH | LMA | LS | LT | CT | PT | SS | SD | AS/AL | WUE |
| (m) | (cm) | (g·cm−2) | (cm2) | (μm) | (μm) | (μm) | (μm2) | (numbers mm−2) | (mm·mm−1) | (μmol·mol−1) | |||
| BG | Arid | 7.73 ± 0.42 a | 29.16 ± 1.99 cd | 28.27 ± 2.09 a | 0.015 ± 0.00051 cd | 5.87 ± 0.34 a | 342.76 ± 5.53 | 9.29 ± 0.30 ab | 234.67 ± 6.85 | 930.30 ± 54.16 b | 221.77 ± 11.16 a | 0.20 ± 0.0089 a | 71.57 ± 7.00 b |
| KK | Arid | 8.01 ± 0.44 a | 33.38 ± 1.61 d | 25.33 ± 1.72 a | 0.013 ± 0.00034 bc | 8.42 ± 0.63 ab | 294.11 ± 9.44 | 8.78 ± 9.44 ab | 179.47 ± 8.21 | 895.62 ± 28.52 b | 208.48 ± 16.24 a | 0.19 ± 0.013 a | 90.48 ± 5.49 c |
| ST | Semi-arid | 6.07 ± 0.50 a | 25.46 ± 1.94 bc | 24.52 ± 1.60 a | 0.014 ± 0.00075 cd | 11.74 ± 0.90 bc | 325.73 ± 73.02 | 7.63 ± 0.37 a | 171.96 ± 31.27 | 1034.94 ± 51.33 c | 185.15 ± 4.91 a | 0.19 ± 0.0094 a | 69.08 ± 4.96 b |
| SR | Semi-arid | 4.67 ± 0.45 a | 17.99 ± 1.26 a | 25.90 ± 1.72 a | 0.012 ± 0.00092 ab | 9.04 ± 0.57 c | 306.69 ± 22.02 | 10.26 ± 1.40 b | 207.44 ± 18.38 | 861.80 ± 48.03 b | 176.47 ± 6.37 a | 0.15 ± 0.0096 a | 67.16 ± 1.35 b |
| WL | Semi-arid | 7.67 ± 0.90 a | 29.79 ± 1.62 cd | 26.65 ± 1.40 a | 0.015 ± 0.00059 d | 7.67 ± 0.43 ab | - | - | - | 749.97 ± 3.87 a | 399.78 ± 30.90 b | 0.30 ± 0.022 b | 87.50 ± 3.90 c |
| QY | Mesic | 16.23 ± 1.09 c | 20.91 ± 1.69 ab | 79.24 ± 3.42 c | 0.012 ± 0.00058 ab | 12.00 ± 2.18 c | - | - | - | 1043.28 ± 19.34c | 431.92 ± 25.63 b | 0.45 ± 0.033 c | 61.91 ± 3.73 b |
| JS | Mesic | 11.89 ± 0.42 b | 27.55 ± 1.54 c | 42.15 ± 1.45 b | 0.011 ± 0.00039 a | 11.67 ± 0.90 c | 292.45 ± 9.05 | 7.03 ± 0.38a | 187.48 ± 24.32 | 701.79 ± 11.78 a | 642.87 ± 26.11 c | 0.45 ± 0.022 c | 32.90 ± 3.06 a |
| p-value | <0.0001 | <0.0001 | <0.0001 | <0.0001 | <0.0001 | 0.194 | 0.046 | 0.14 | <0.0001 | <0.0001 | <0.0001 | <0.0001 | |
| Microenvironment | H | DBH | H/DBH | LMA | LS | LT | CT | PT | SS | SD | AS/AL | WUE | |
| (m) | (cm) | (g·cm−2) | (cm2) | (μm) | (μm) | (μm) | (μm2) | (numbers mm−2) | (mm·mm−1) | (μmol·mol−1) | |||
| Sand dune | 7.70 ± 0.25 b | 29.48 ± 1.27 | 27.46 ± 1.25 | 0.015 ± 0.00039 c | 6.75 ± 0.31 a | 342.76 ± 5.53 | 9.29 ± 0.30 | 234.67 ± 6.85 b | 835.63 ± 34.20 a | 310.78 ± 25.93 b | 0.22 ± 0.017 b | 79.48 ± 4.51 | |
| Steppe area | 6.61 ± 0.40 ab | 26.97 ± 0.40 | 25.57 ± 1.22 | 0.013 ± 0.00031 a | 8.53 ± 0.52 b | 311.67 ± 18.49 | 8.14 ± 0.41 | 175.29 ± 16.87 a | 965.28 ± 32.74 b | 196.82 ± 8.68 a | 0.19 ± 0.0080 b | 78.82 ± 4.43 | |
| River side | 6.07 ± 0.50 a | 25.46 ± 0.50 | 24.52 ± 1.60 | 0.012 ± 0.00012 a | 11.74 ± 0.90 c | 306.69 ± 9.56 | 10.26 ± 3.13 | 207.44 ± 18.38 ab | 861.80 ± 48.03 ab | 176.47 ± 6.37 a | 0.15 ± 0.0096 a | 69.08 ± 4.96 | |
| p-value | 0.018 | 0.25 | 0.35 | <0.0001 | <0.0001 | 0.328 | 0.138 | 0.061 | 0.025 | <0.0001 | 0.003 | 0.35 | |
© 2016 by the authors; licensee MDPI, Basel, Switzerland. This article is an open access article distributed under the terms and conditions of the Creative Commons Attribution (CC-BY) license (http://creativecommons.org/licenses/by/4.0/).
Share and Cite
Park, G.E.; Lee, D.K.; Kim, K.W.; Batkhuu, N.-O.; Tsogtbaatar, J.; Zhu, J.-J.; Jin, Y.; Park, P.S.; Hyun, J.O.; Kim, H.S. Morphological Characteristics and Water-Use Efficiency of Siberian Elm Trees (Ulmus pumila L.) within Arid Regions of Northeast Asia. Forests 2016, 7, 280. https://doi.org/10.3390/f7110280
Park GE, Lee DK, Kim KW, Batkhuu N-O, Tsogtbaatar J, Zhu J-J, Jin Y, Park PS, Hyun JO, Kim HS. Morphological Characteristics and Water-Use Efficiency of Siberian Elm Trees (Ulmus pumila L.) within Arid Regions of Northeast Asia. Forests. 2016; 7(11):280. https://doi.org/10.3390/f7110280
Chicago/Turabian StylePark, Go Eun, Don Koo Lee, Ki Woo Kim, Nyam-Osor Batkhuu, Jamsran Tsogtbaatar, Jiao-Jun Zhu, Yonghuan Jin, Pil Sun Park, Jung Oh Hyun, and Hyun Seok Kim. 2016. "Morphological Characteristics and Water-Use Efficiency of Siberian Elm Trees (Ulmus pumila L.) within Arid Regions of Northeast Asia" Forests 7, no. 11: 280. https://doi.org/10.3390/f7110280