Article

Deforestation Effects on Soil Erosion in the Lake Kivu Basin, D.R. Congo-Rwanda

1
Xinjiang Institute of Ecology and Geography, Chinese Academy of Sciences, Urumqi 830011, China
2
University of Chinese Academy of Sciences, Beijing 100049, China
3
Faculty of Environmental Studies, University of Lay Adventists of Kigali, P.O. 6392, Kigali, Rwanda
4
College of Life Science, Shihezi University, Shihezi 832000, China
*
Author to whom correspondence should be addressed.
Forests 2016, 7(11), 281; https://doi.org/10.3390/f7110281
Submission received: 29 August 2016 / Revised: 4 November 2016 / Accepted: 9 November 2016 / Published: 17 November 2016

Abstract

:
Deforestation and natural grassland conversion to agricultural land use constitute a major threat to soil and water conservation. This study aimed at assessing the status of land cover and land use (LCLU) in the Lake Kivu basin, and its related impacts in terms of soil erosion by water using the Universal Soil Erosion Equation (USLE) model. The results indicated that the Lake Kivu basin is exposed to soil erosion risk with a mean annual rate of 30 t·ha−1, and only 33% of the total non-water area is associated with a tolerable soil loss (≤10 t·ha−1·year−1). Due to both natural factors (abundant tropical precipitation and steep slopes) and anthropogenic activities without prior appropriate conservation practices, all land-use types—namely settlement, cropland, forestland, and grassland—are exposed to a severe mean erosion rate of 41 t·ha−1·year−1, 31 t·ha−1·year−1, 28 t·ha−1·year−1, and 20 t·ha−1·year−1, respectively. The cropland that occupied 74% of the non-water area in 2015 was the major contributor (75%) to the total annual soil loss in the Lake Kivu basin. This study showed that conservation practices in the cropland cells would result in a mean erosion rate of 7 t·ha−1·year−1, 18 t·ha−1·year−1, and 35 t·ha−1·year−1 for terracing, strip-cropping, and contouring, respectively. The adoption of terracing would be the best conservation practice, among others, that could reduce soil erosion in cropland areas up to about 23%. The erosion risk minimization in forests and grasslands implies an increase in overstorey canopy and understorey vegetation, and control of human activities such as fires, mining, soil compaction from domestic animals grazing, and so on. Soil erosion control in settled areas suggests, among other things, the revegetation of construction sites, establishment of outlet channels, rainfall water harvesting systems, and pervious paving block with grass.

1. Introduction

Forest clearance on slopes, accompanying the introduction of widespread agriculture, appears to be the most likely cause of the first landscape instability [1]. These unsustainable land-use activities, together with natural factors such as abundant tropical rainfall and steep topography, increase soil erosion rates in the highland of tropical areas [2,3]. In most of sub-Saharan African countries more than 50% of the population depends on agriculture for their livelihood [4]. It has been forecasted that 1 × 10⁹ ha of natural ecosystems will be converted to agriculture by 2050 [5], and this would be harmful to freshwater and near-shore marine ecosystems due to 2.4- to 2.7-fold increases in nitrogen and phosphorus, respectively [5]. Agricultural intensification without soil conservation practices can have significant detrimental effects on soil, such as increased erosion and lower fertility, further leading to groundwater pollution and eutrophication of rivers and lakes [6,7]. For instance, Mediterranean lands have suffered from changes in land uses that resulted in organic matter exhaustion, inappropriate ploughing, deforestation, erosion, soil degradation, salinization, and crusting. Both traditional land use and human activities such as agriculture, grazing, mining, and charcoal and biomass production resulted in low soil fertility and highly eroded terrain [8,9]. Across the Lake Kivu zone, approximately 346,000 ha of forest cover were lost between 1988 and 2011 [10]. Since the 1960s, nutrient fluxes and soil mineral inputs have increased considerably, and diatom assemblages have altered the Kivu lake water [11,12,13]. Inland waters and freshwater biodiversity constitute a valuable resource, in economic, cultural, aesthetic, scientific, and educational terms. Their conservation and management are critical to the interests of humans, nations, and governments [14,15]. One of the major threats to freshwater ecosystems is the habitat degradation associated with changes within the basin, such as forest clearance that increases surface runoff and river sediment loads that lead to habitat alterations (i.e., shoreline erosion, smothering of littoral habitats, clogging of river bottoms, or floodplain aggradation) [14].
Lake Kivu’s degradation was suggested to be related with intensified cropland expansion, deforestation, and urbanisation, which enhanced soil erosion, caused landslides, and increased the influx of minerals and nutrients [11,12,13]. In face of the problem, various studies have focused on the density stratification and the gas concentrations in Lake Kivu and their influence on the safety of the lake [16]; the structure, chemistry, and biology of the Lake [17]; phytoplankton ecology; and other factors [18]. However, the relationship between land use and related soil erosion risk are not clear for the Lake Kivu basin, while the estimation of soil loss is essential for the adoption of proper land-use planning and development strategies [19,20].
Therefore, the objectives of this study are to: (1) assess the current status of land cover and land use (LCLU) in the Lake Kivu basin; (2) estimate the potential and soil erosion risk; and (3) predict the rates of soil erosion in cropland areas under various conservation practices (i.e., terracing, strip-cropping, and contouring). To achieve these goals, we used the Universal Soil Erosion Equation (USLE) model, developed by the United States Department of Agriculture (USDA), to (1) identify situations where erosion is serious under various influences, such as land use, relief, soil properties, and climate, and (2) guide the development of conservation plans to control erosion [21]. The input datasets used in this study are the Landsat 8 images, precipitation dataset, soil properties, digital elevation model (DEM), and the normalised difference vegetation index (NDVI).

2. Materials and Methods

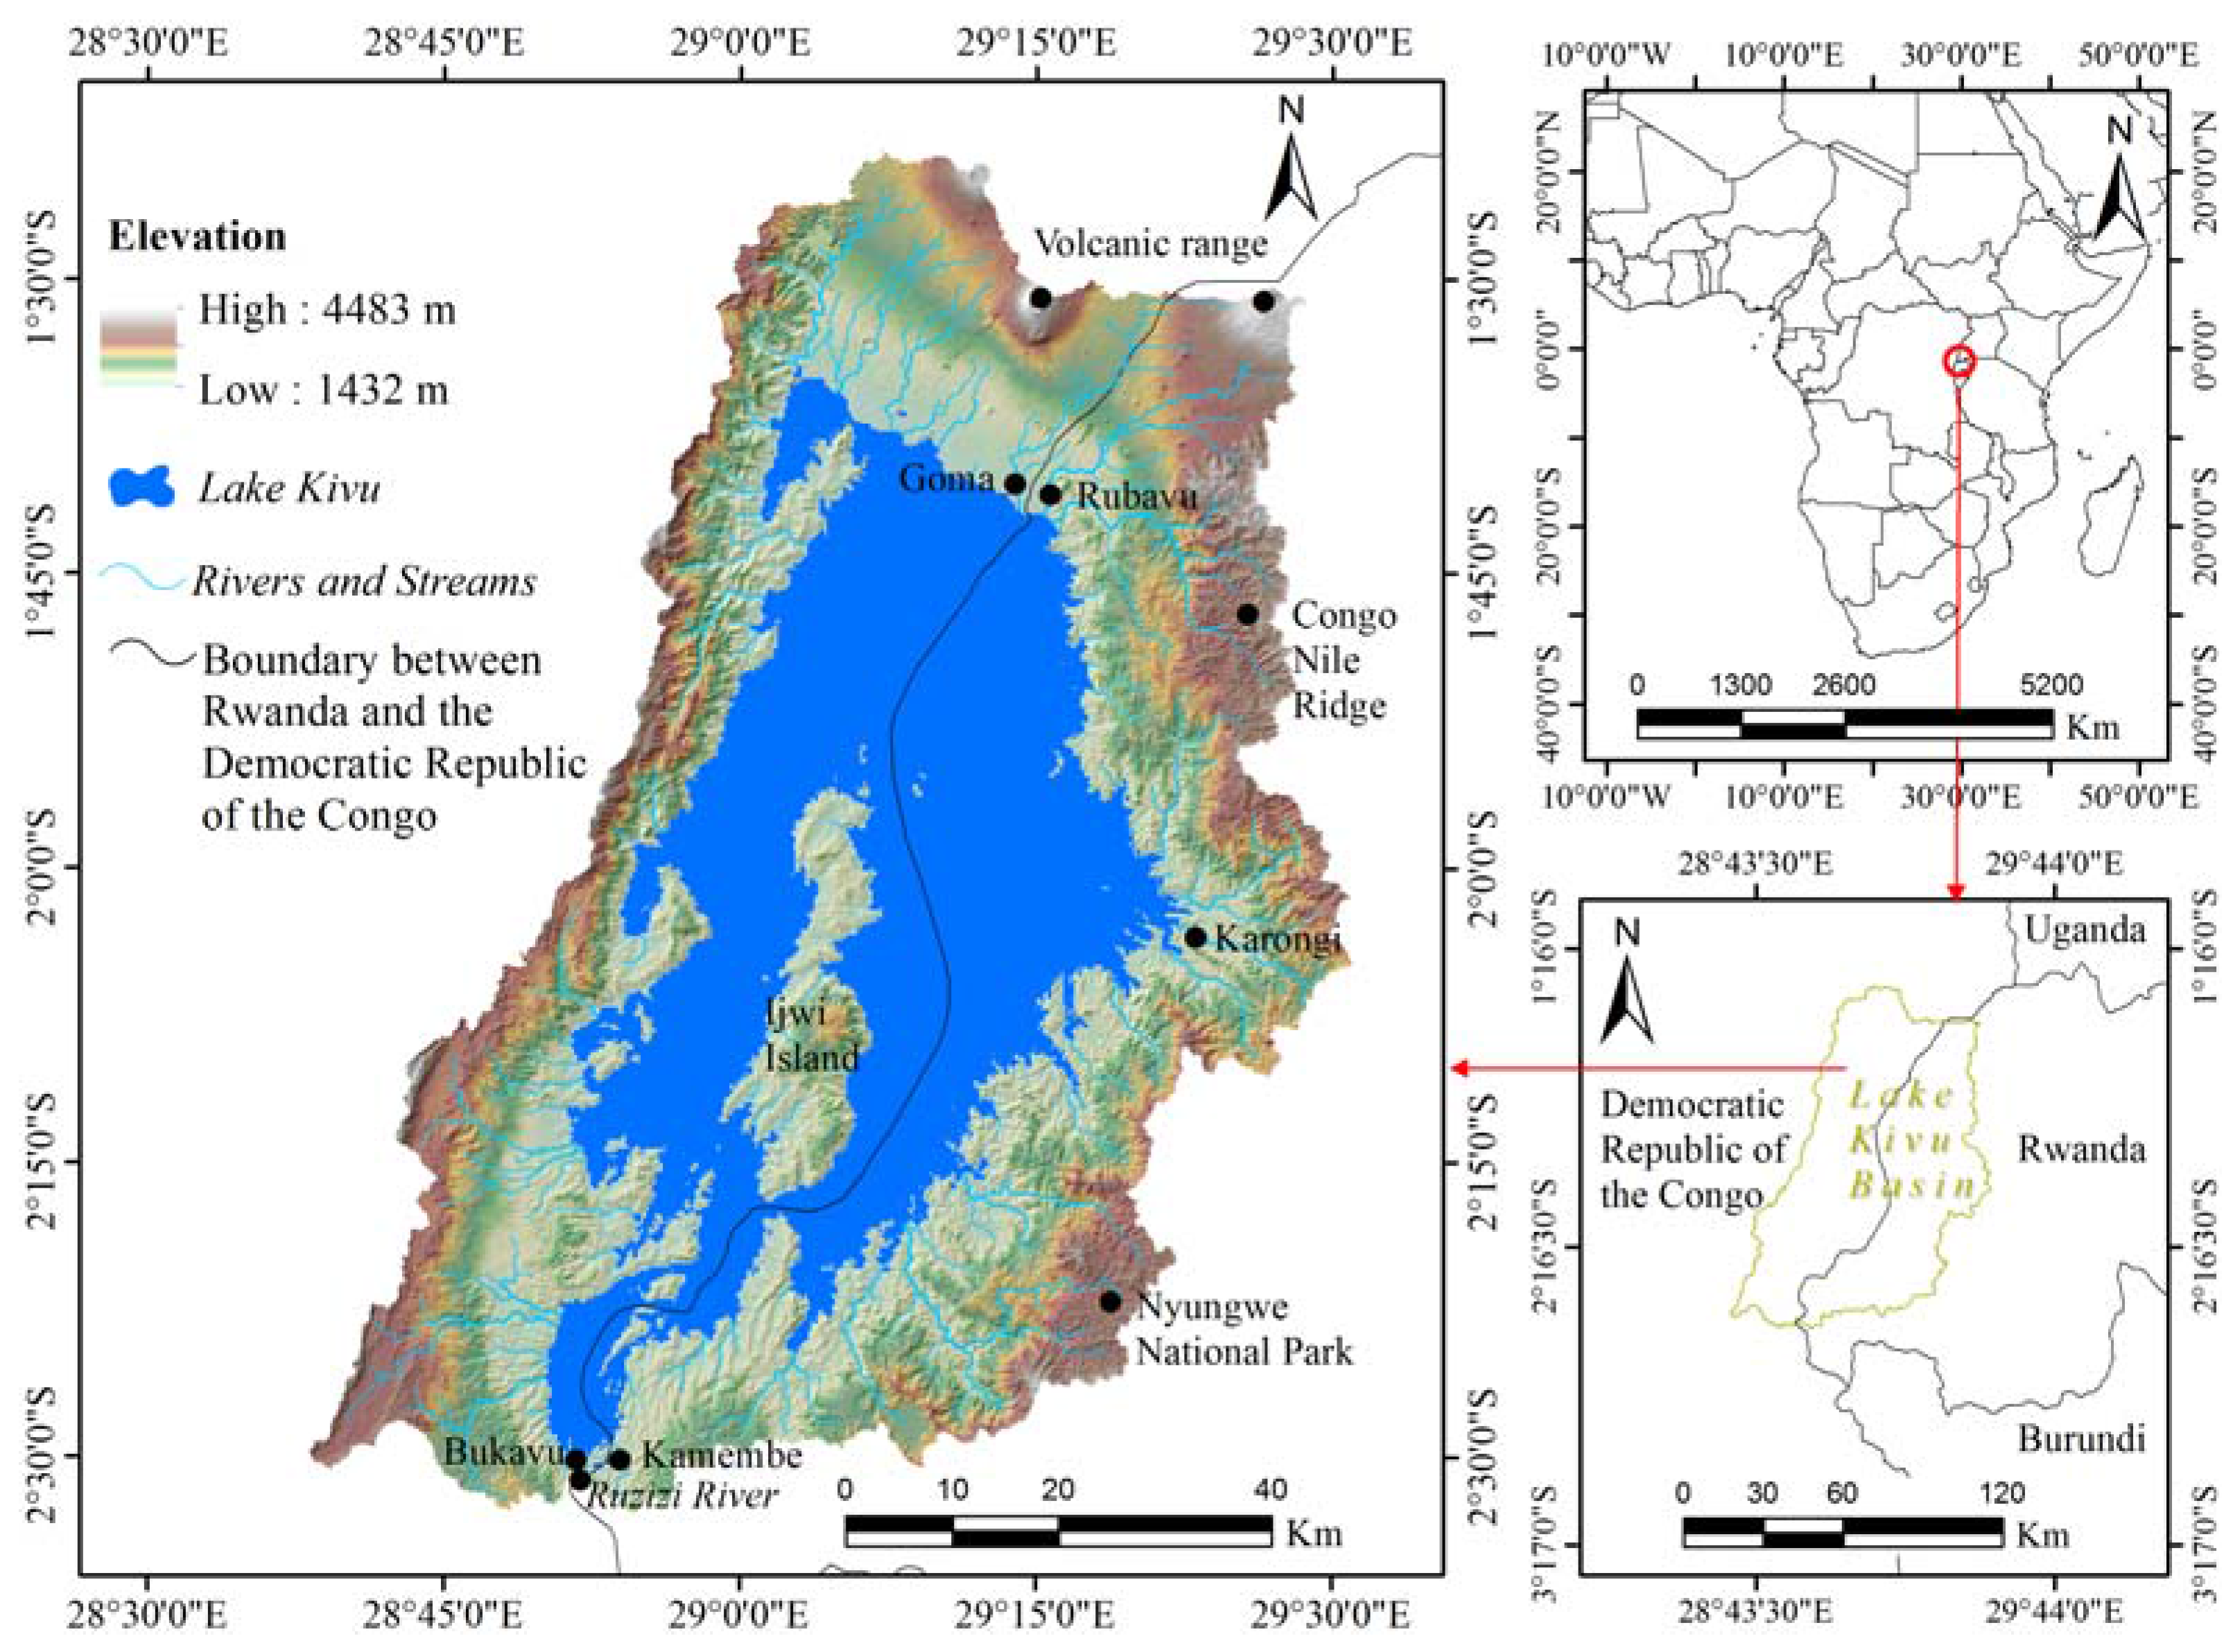
2.1. Description of the Study Area

The Lake Kivu basin (Figure 1) is located in the tropical zone, East African Rift Valley, between the Democratic Republic of the Congo and Rwanda. The basin covers an area of about 7392.09 km2 (32% or 2365.47 km2 and 68% or 5026.62 km2 of the Lake Kivu surface and land coverage, respectively). Elevation varies from 4483 m in the east catchment on the Congo Nile Ridge and volcanic range, decreasing towards Lake Kivu to 1432 m with a mean slope of 27% (Figure 1). Lake Kivu has a volume of about 560 km3 and a maximum depth of 485 m [16]. This basin experiences tropical climate with a mean annual rainfall of 1285 mm, a mean annual temperature of 18 °C, and two rainfall seasons per year (March to May and September to December) [22]. Lake Kivu occupies a deep and steep-sided basin, divided into two parts by the large Ijwi Island (279.32 km2). Aside from its very shallow and broad aspect ratios [23], more than 127 rivers enter the lake (2.4 km3·year−1) from the catchment, and the Ruzizi River (3.6 km3·year−1) is its outflow [12]. Precipitation (3.3 km3·year−1) is nearly equal to lake surface evaporation (3.4 km3·year−1). The water inputs and outputs (7 km3·year−1) are thus in equilibrium [11]. Geologically, the basin comprises acrisols (33%), andosols (16%), ferralsols (11%), cambisols (6%), and regosols (2%), with the remainder (32%) covered by water [24]. Average population density in the Lake Kivu basin was more than 400 inhabitants/km2 in 2008 [12].
The Lake Kivu basin (Figure 1) was delineated from the Advanced Spaceborne Thermal Emission and Reflection Radiometer (ASTER) global digital elevation model (GDEM) version 2 (30 m resolution) acquired from the United States Geological Survey (U.S.G.S.) EarthExplorer (EE) database [25], using the hydrology toolset of the ArcGIS software version 10.2 (Environmental Systems Research Institute (Esri) Inc., Redlands, CA, USA).

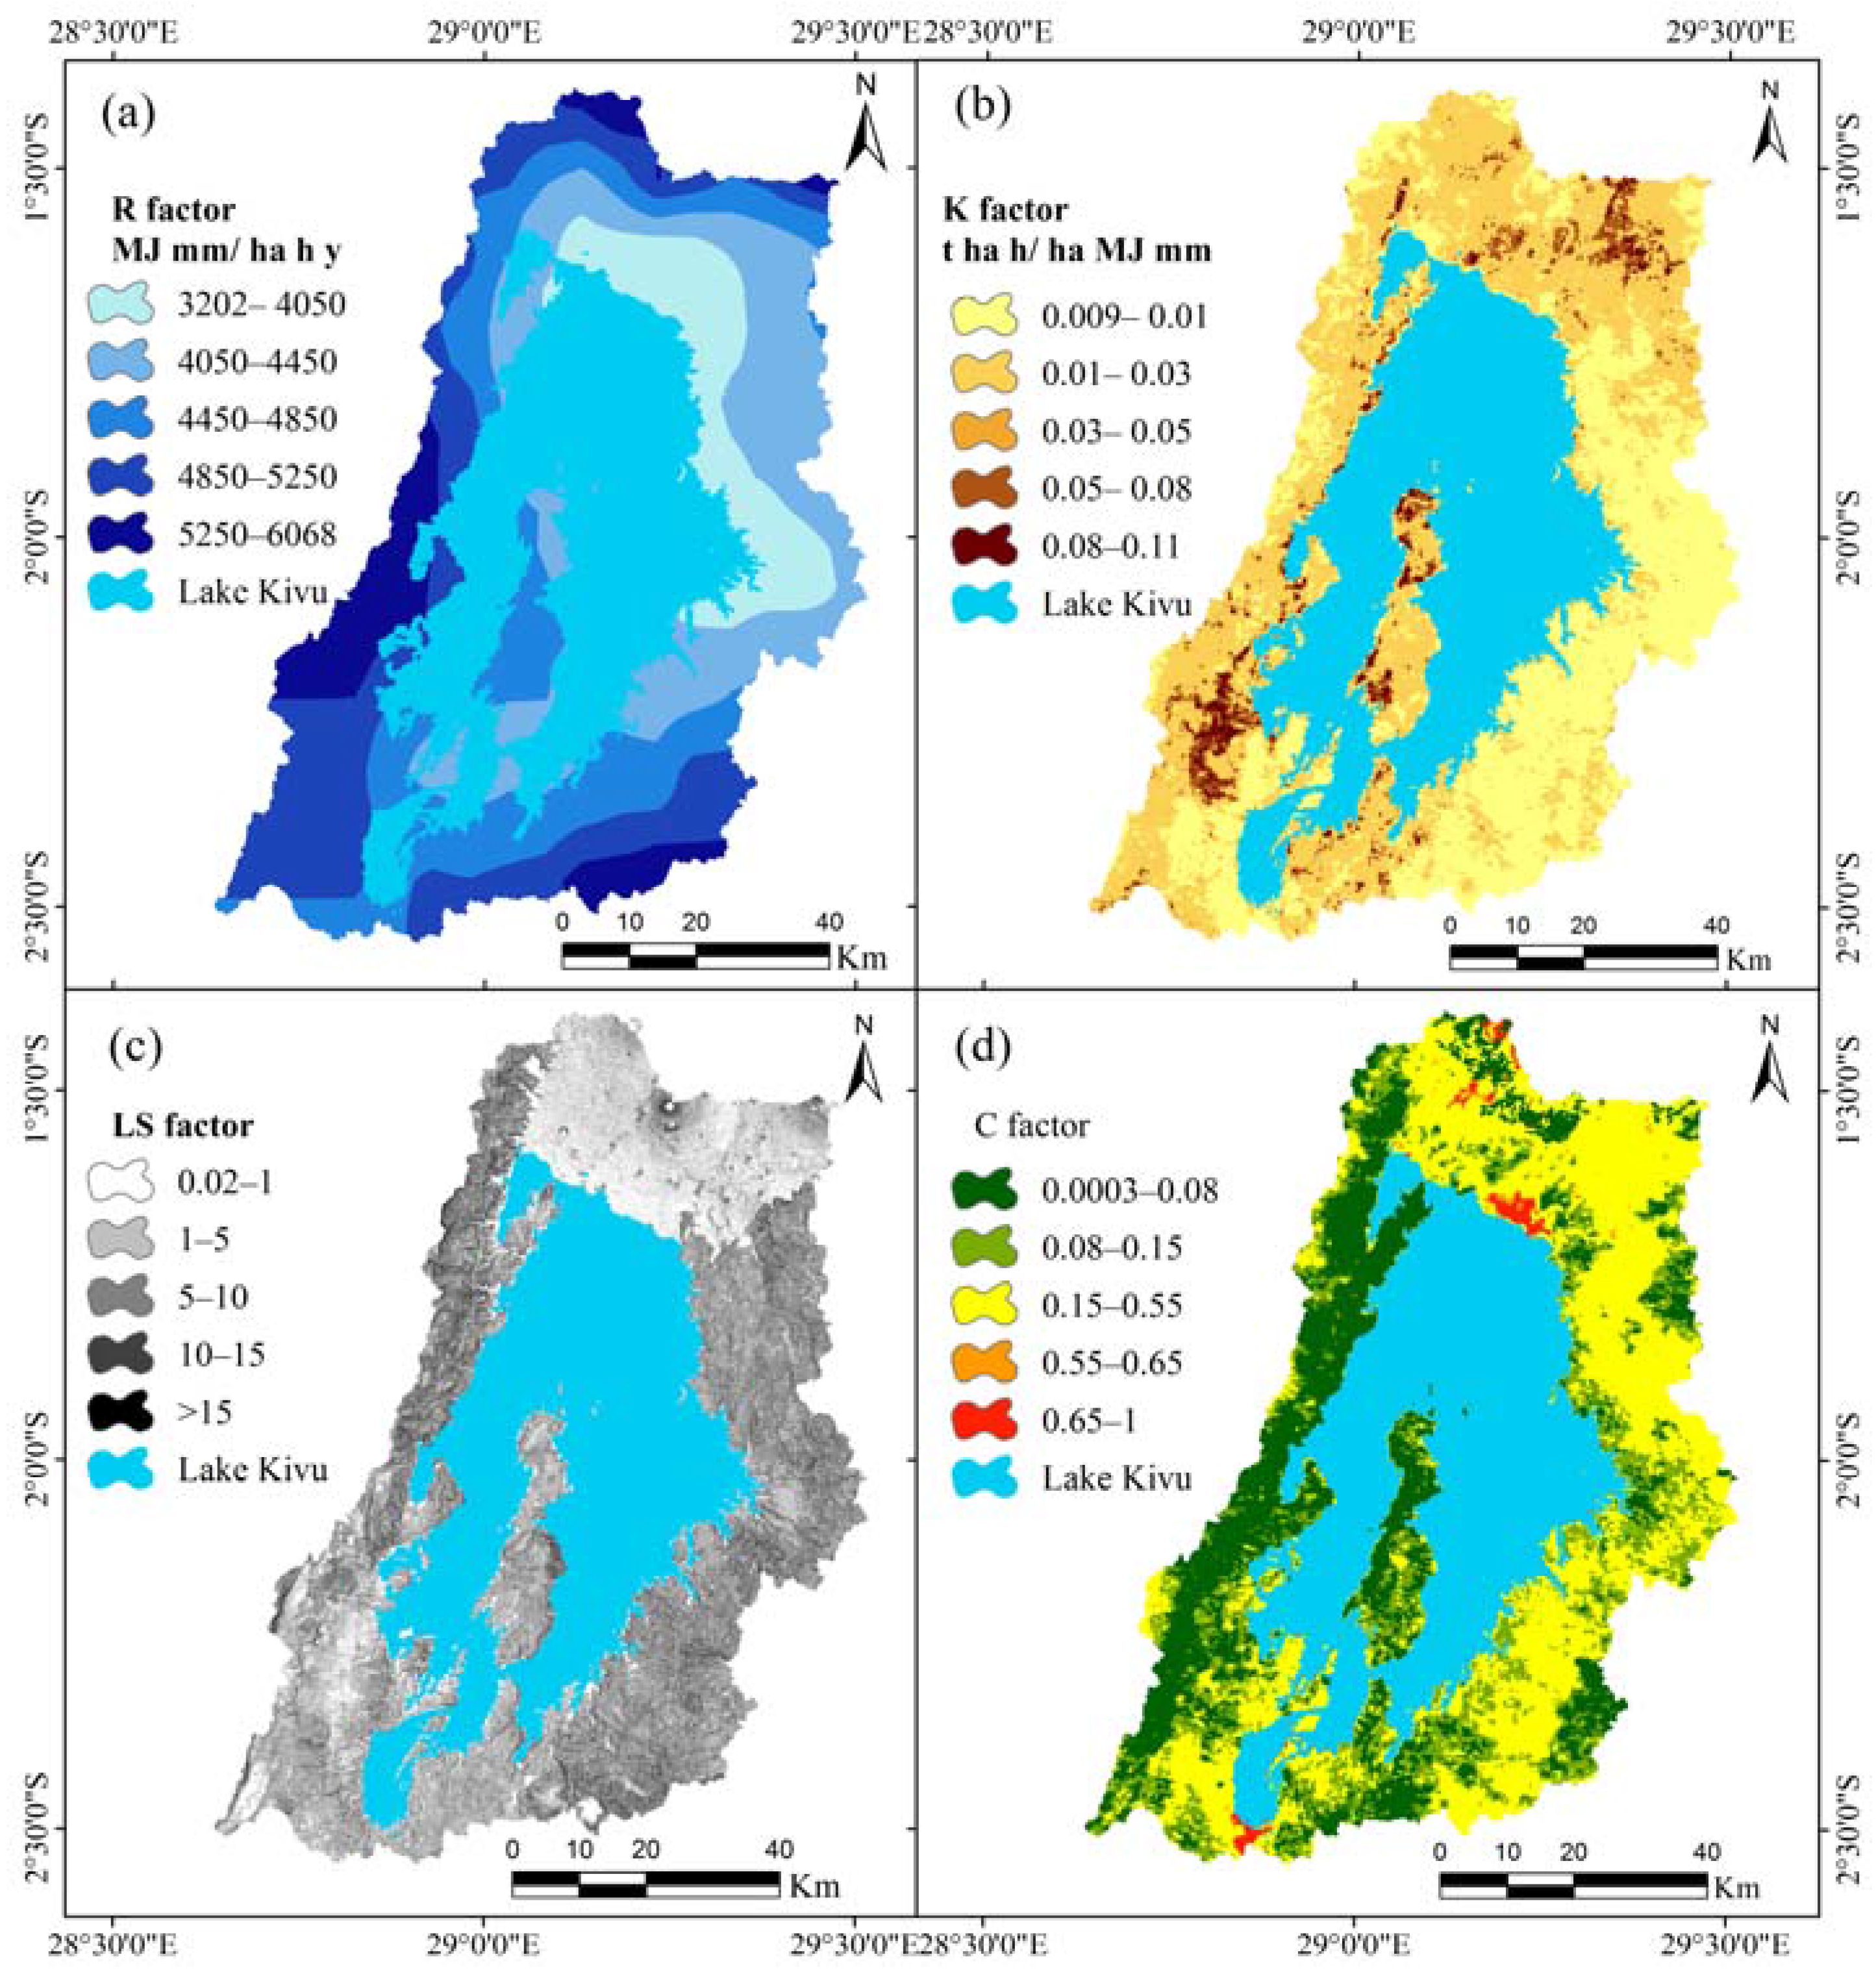
2.2. Parameterisation of the USLE Factors

All necessary datasets for the USLE model were resampled to the common spatial resolution of 30 m. The statistics of soil erosion rates were computed using the Zonal Statistics as a Table Tool available in the Spatial Analyst Zonal Toolset of the ArcGIS software version 10.2 (Environment Systems Research Institute (Esri) Inc., Redlands, CA, USA).
The estimation of soil erosion based on the USLE model (Equation (1)) counts five input parameters derivable from precipitation, soil properties, topography, cover and crop management, and conservation practices [21,26].
A   =   R   ×   K   ×   LS   ×   C   ×   P
where A = annual soil loss (t·ha−1·year−1); R = rainfall erosivity factor (MJ·mm·ha−1·h−1·year−1); K = soil erodibility factor (t·ha·h·ha1·MJ1·mm1); LS = slope length factor and slope steepness factor (unitless); C = crop and cover management factor (unitless); and P = conservation supporting practices factor (unitless).
Because extensive measurement of soil erosion is expensive and time consuming [19], erosion models that make use of secondary data available in a geographic information system (GIS) can offer a useful alternative. Data on climate, soils, topography, and land cover are derived from the existing secondary data sources [27,28,29].

2.2.1. Rainfall-Runoff Erosivity Factor (R)

Rainfall erosivity factor (R) has significant impacts on soil erosion due to its contribution to about 80% of soil loss [30,31]. The R factor is usually calculated as an average of kinetic energy intensity (EI) values estimated over 20 years to accommodate apparent cyclical rainfall patterns [26,32,33]. Since these data are generally not available worldwide [30,34]—including the area under investigation, where long-term rainfall records are quasi-inexistent due to the destruction of meteorological stations by the 1994 genocide against Tutsi in Rwanda [35]—we calculated R factor (Figure 2a) using an alternative empirical regression (Equation (2)) proposed by Lo et al. (1985) [3,36].
R   =   38.46   +   3.48   ×   P
where P is the mean annual precipitation in mm
This equation was obtained based on well-estimated R factors for various meteorological stations using Wischmeier and Smith’s (1978) method and the mean annual precipitation [3,30]. This approach has been adopted by the Land Degradation Assessment in Drylands (LADA) project while assessing the global land degradation [37]. The present project estimated the mean annual precipitation for a period of 35 years (1981–2015) using monthly average precipitation provided by the Climate Hazards Group InfraRed Precipitation with Station (CHIRPS) data. CHIRPS incorporates 0.05° resolution satellite imagery with in situ station data to create gridded rainfall time series for trend analysis and seasonal drought monitoring [38].

2.2.2. Soil Erodibility Factor (K)

Soil erodibility factor (K) describes soil susceptibility to detachment and transport of soil particles under an amount and rate of runoff for a specific storm event, predicted under the standard plot [26,33]. The present study utilised the K factor (Figure 2b) estimated using soil properties (sand, clay, silt, and organic carbon fractions) compiled by the Africa Soil Information Service (AfSIS) with a spatial resolution of 250 m [39], and the following Equation (3) as proposed by Williams (1995) [40,41,42].
K U S L E   =   f c s a n d   ×   f c l s i   ×   f o r g c   ×   f h i s a n d
where f c s a n d (Equation (4)) is a factor that gives low soil erodibility factors for soils with high-coarse sand contents and high values for soils with little sand, f c l s i (Equation (5)) is a factor that gives low soil erodibility factors for soils with high clay-to-silt ratios, f o r g c (Equation (6)) is a factor that reduces soil erodibility for soils with high organic carbon content, and f h i s a n d (Equation (7)) is a factor that reduces soil erodibility for soils with extremely high sand content.
f c s a n d   =   0.2 + 0.3   ×   e x p [ 0.256 × m s × ( 1 m s i l t 100 ) ]
f c l s i   = ( m s i l t m c + m s i l t ) 0.3
f o r g c   = 1 0.0256 × o r g C o r g C + e x p [ 3.72 ( 2.95 × o r g C ) ]
f h i s a n d   = 1 0.7 × ( 1 m s 100 ) ( 1 m s 100 ) + e x p [ 5.51 + 22.9 × ( 1 m s 100 ) ]
where m s is the percent sand content (0.05–2.00 mm diameter particles), m s i l t is the percent silt content (0.002–0.05 mm diameter particles), m c is the percent clay content (<0.002 mm diameter particles), and o r g C is the percent organic carbon of the layer (%).

2.2.3. Slope Length and Steepness Factors (LS)

The effect of topographic factors on soil erosion rates is dependent on slope length (L), slope steepness (S), and slope morphology on rill and interrill erosion and sediment production. As the slope length increases (L), the total soil erosion loss per unit increases as a result of progressive accumulation of runoff in downslope. As the slope steepness increases, the soil erosion also increases as a result of the increasing velocity and erosivity of runoff [26,33]. LS factor layer (Figure 2c) was derived from the Advanced Spaceborne Thermal Emission and Reflection Radiometer (ASTER) global digital elevation Model (GDEM) version 2 (30 m resolution) acquired from the United States Geological Survey (U.S.G.S.) EarthExplorer (EE) database [25]. The slope length factor (L) was estimated using the Desmet and Govers (1996) algorithm (Equations (8)–(10)), improved from the USLE calculation methodology. It considers the upstream contribution area, where the slope length effect is a function of the erosion ratio of rill to interrill, and has better accuracy for the areas with complex slopes [43,44].
m = β 1 + β
where the slope-length exponent m is related to the ratio β of rill erosion (caused by flow) to interrill erosion (principally caused by raindrop impact); and β is the ratio of rill-to-interrill erosion for conditions when the soil is moderately susceptible to both rill and interrill erosion [21,44].
β = sin  θ / 0.0896 3 ( sin  θ ) 0.8 + 0.56
where θ is the slope angle in (degrees).
L i . j = ( A i . j i n + D 2 ) m + 1 A i . j i n m + 1 D m + 2 . x i . j m . ( 22.13 ) m
where L i . j = slope length factor for the grid cell with coordinates (i.j); D = the grid cell size (m); x i . j = ( sin  a i . j + cos  a i . j ) ; a i . j = aspect direction for the grid cell with coordinates ( i . j ) ; A i . j i n = flow accumulation or contributing area at the inlet of a grid cell with coordinates (i.j) (m2). The mean values of the slope angle ( θ ) , F factor, the slope length exponent (m), flow accumulation, L factor, and slope steepness factor (S) were 14.26 degrees, 1.59, 0.57, 1717.7, 1.33, and 3.63, respectively. The slope steepness factor (S) that reflects the influence of slope gradient on erosion (ranges from 0.03 to 15.57 for the Lake Kivu basin) has been estimated using Equation (11), developed by McCool et al. [44,45,46,47].
S i . j = { 10.8 sin  θ i . j + 0.03 ,   tan  θ i . j < 9   % 16.8 sin  θ i . j 0.50 ,   tan  θ i . j 9   %
The LS factor for the Lake Kivu basin has been obtained by the multiplication of L and S factors using the Raster Calculator tool from the Spatial Analyst extension of ArcMap 10.2 (Environment Systems Research Institute (Esri) Inc., Redlands, CA, USA).

2.2.4. Crop and Cover Management Factor (C)

The C factor reflects the effects of cropping and cover management practices on soil erosion rates in agricultural lands, and the effects of vegetation canopy and ground covers on reducing the soil erosion in forested regions [21]. Vegetation cover dissipates the kinetic energy of the raindrops before impacting the soil surface. Thus, proper management of vegetation cover and cropping systems significantly reduces runoff and erosion rates [33,48]. Normalised difference vegetation index (NDVI) (Equation (12)) is positively correlated with the amount of green biomass. Its value varies between −1 and 1, where low values can be found at water bodies, bare soil, and built-up areas [49,50,51].
N D V I = N I R + I R N I R
where NIR is near-infrared wavelength and IR is infrared. NDVI can been used to estimate the C factor using Equation (13) [51,52].
C = e x p [ a   × N D V I β N D V I ]
where α = 2 and β = 1 are the parameters that determine the shape of the NDVI–C curve.
As it has been recommended to utilise the NDVI image acquired during rainfall season when soil erosion is strongly active [53,54], the C factor layer (Figure 2d) utilised in our study has been generated using the biweekly mean Moderate Resolution Imaging Spectroradiometer (MODIS) NDVI acquired by the NASA’s Terra satellite [55] for the rainy seasons (March to May and September to November, 2014–2015), using Equation (13) [51].

2.2.5. Support Practice Factor (P)

Erosion control practices (P) factor expresses the effects of conservation practices that reduce the amount and rate of water runoff, which reduce erosion due to agricultural management practices such as contour tillage and planting, strip-cropping, terracing, and subsurface drainage [26,56]. Unfortunately, due to the lack of financial means, these conservation practices are still undeveloped in developing countries, including the area of interest in this study [28,57,58]. Furthermore, establishment of a P factor map at the large watershed scale with a land-use complex system is nearly impossible to be assessed using the Wischmeier and Smith [26] method, in which P factor is estimable based on the slope gradient and different support practices (such as terracing, contour tillage, etc.) [51,59,60].
Alternatively, the Land Degradation Assessment in Drylands (LADA) project estimated P factor using a management index related to overall crop performance, and developed a global map for the parameter [3]. First, LADA estimated the cropland management index by comparison of downscaled crop yields with potential crop yields under a low cropland management scenario. A management index of less than 1.0 represents areas where current yield levels are below its potential at low-level input and management circumstances. Then, LADA transformed the management index to P factor by considering that areas with very low management are less protected than those that are well managed—as conservation practices are not applied—and over-management also decreases soil protection. Based on quartile classification, the management index was converted as follows: 0–0.97 range was converted to P factor 0.75, 0.97–1.93 to 0.25, above 1.92 to 0.5 [3]. According to the LADA project, the lands of Rwanda as well as most African countries (except for Egypt and South Africa) were poorly managed (i.e., management index < 0.97) and were assigned a high P factor value of 0.75 [3]. Since the Lake Kivu basin is one of the most poorly managed land areas in the Democratic Republic of the Congo and Rwanda [3,28], we assigned it a high P factor value of 0.75 following the LADA project.
The mean values of the R factor, K factor, LS factor, C factor, and P factor were 4623 MJ·mm·ha−1·h−1·year−1, 0.02 t·ha·h·ha−1·MJ−1·mm−1, 4.79, 0.15, and 0.75, respectively (Figure 2).

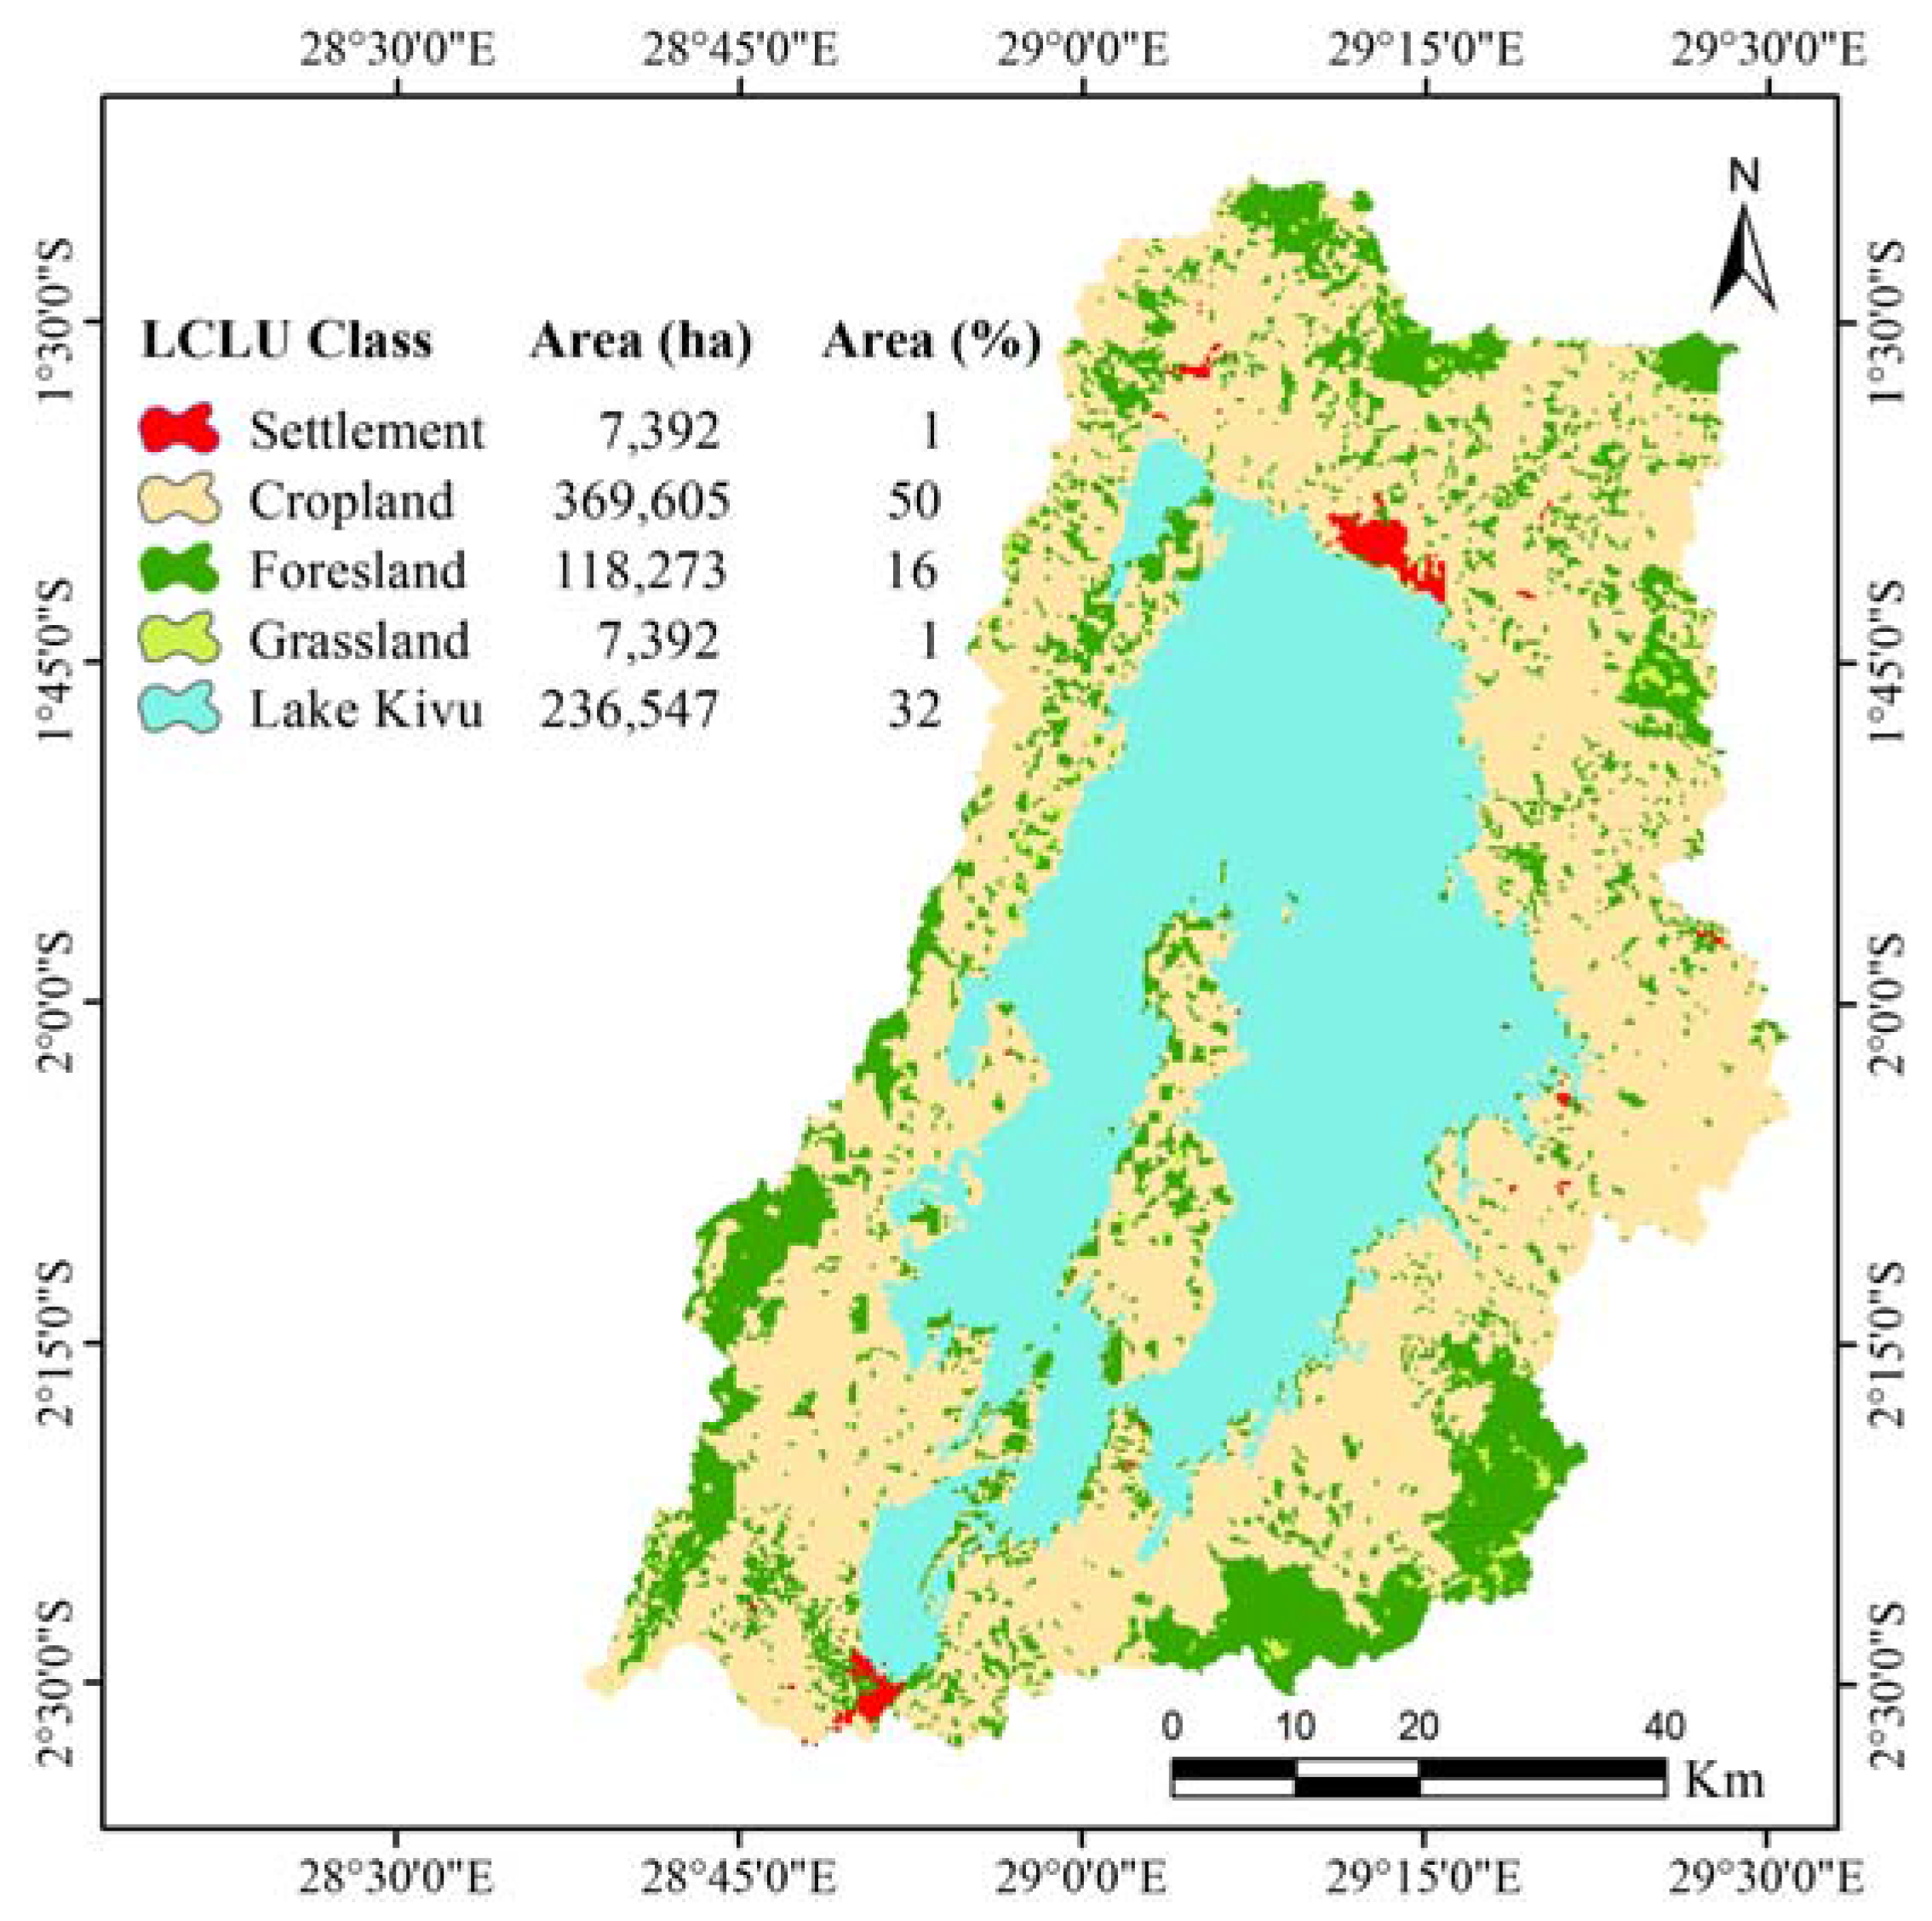
2.3. Land Cover and Land Use

Usually, soil erosion rates are different for various land cover/use types [20,61]. However, in some locations, including that of the present study, it is nearly impossible to distinguish crop types by means of moderate remote sensing imagery due to complex agricultural land use (crop diversity per plot), subsistence farming systems in rough hilly areas, and land segmentation of less than 1 ha per household that has been accelerated by rapidly increasing population density [28]. Consequently, the analysis of soil erosion rates according to land cover/use categories has been limited to four LCLU classes (settlement, cropland, forestland, and grassland). Land cover/use information for the catchment was obtained from two Landsat 8 images (path; row: 173/61; 173/62 acquired on 21 September 2015) delivered by the U.S.G.S. global visualisation [62]. These images were radiometrically corrected, the cloud shadows were masked, and the gap-filling algorithm was used to obtain a cloud-free image using ENVI software version 5.2 (Exelis Visual Information Solutions, Inc., a subsidiary of Harris Corporation, Boulder, CO, USA) [10]. This software was also used for the classification of the LCLU map of the Lake Kivu basin (Figure 3) using the supervised maximum likelihood classification method [63], which is the most commonly used supervised classification method with remote sensing image data, due to its applicability and reliability for satellite image classification purposes [63,64]. The LCLU map was classified into five classes (settlement, cropland, forestland, grassland, and water/Lake Kivu) according to the U.S.G.S. classification system category one [65]. Based on the accuracy assessment methods [66,67] and the rule of thumb [68], 50 points were randomly sampled for each land cover/use class using the primary Landsat image used to generate the classified image. Then, the accuracy verification was achieved by Google Earth Pro (Google Inc., Amphitheatre Parkway Mountain View, CA, USA) [33,69]. In this study, the classification was successfully achieved with an acceptable overall accuracy of 90.4% (Table 1) compared to the recommended overall accuracy of at least 85% [65,70,71] and 70% for each land cover/use class [70].

2.4. Conservation Practice Methods

Soil loss prediction under various conservation practices is primordial for policy makers in agricultural land management and ecosystem protection [28,29]. P factor values for agricultural land use on slopes greater than 25% are important for subsistence farmland located in hilly tropical regions with rapidly increasing population density [72]. This study predicted the rate of soil loss for the 2015 cropland cells in the Lake Kivu basin under three assumed conservation practices (contouring, strip-cropping, and terracing) using slope ranges and their corresponding P factor values proposed by Shin (1999) (Table 2) [56,73].

3. Results

Figure 4a presents the potential soil erosion map for the Lake Kivu basin that is usually under high vulnerability based on natural factors such as precipitation, soil properties, and topography (R ×   K   ×   LS ) which cannot be easily controlled [26,74], while Figure 4b illustrates that the area is also greatly exposed to soil erosion risk (R ×   K   ×   LS   ×   C   ×   P ) because of intensive agricultural land use and urbanisation without prior land conservation practices in an area that is naturally vulnerable to soil erosion by water due to high rainfall intensity and steep slopes.
Figure 5 indicates that the cropland occupied the largest part of the non-water area (74%), with a mean steep slope of 27% in the Lake Kivu basin, and is the major land-use category that greatly (75%) contributed to the total soil loss, with a mean soil erosion risk of 31 t·ha−1·year−1.
The topographic factor has a significant impact on soil erosion likelihood in the Lake Kivu basin. Based on four categories of slope gradient: very gentle to flat (<5%), gentle (5%–15%), steep (15%–30%), and very steep (>30%) [75], this basin comprised only a small fraction (8%) of very gentle to flat slope associated with a tolerable mean soil erosion rate of 5 t·ha−1·year−1, and the highest mean erosion rate of 44 t·ha−1·year−1 occurred on very steep slopes (>30%) that cover 39% of the total non-water area in the basin (Figure 6).

4. Discussion

The Lake Kivu basin is greatly vulnerable to potential soil erosion by water with a rate of 360 t·ha−1·year−1 (Figure 4a) due to two main natural factors, including a high mean tropical precipitation of 1285 mm/y and a mean steep slope of 27%. When land-use factors are considered, this basin is still exposed to a severe mean soil erosion rate of 30 t·ha−1·year−1, with only 33% of the area associated with tolerable soil loss (Figure 4b) based on the maximum threshold of soil loss tolerance of 10 t·ha−1·year−1 for highlands of tropical areas [76,77]. Estimated mean soil erosion rates for settlement, cropland, forestland, and grassland in the Lake Kivu basin are 41 t·ha−1·year−1, 31 t·ha−1·year−1, 28 t·ha−1·year−1, and 20 t·ha−1·year−1, respectively (Figure 5). Mean soil erosion rates in the Lake Kivu basin range from 5 t·ha−1·year−1 to 44 t·ha−1·year−1 for very gentle slopes (<5%) and very steep slopes (>30%), respectively (Figure 6). The severe erosion rates occur especially on marginal and steep lands which have been converted from forests to agriculture to replace the already eroded and unproductive cropland [78,79]. These results are congruent with the erosion estimates for other tropical areas with similar topographic and climate condition. For instance, the estimated soil erosion rate in the Chemoga watershed, Blue Nile Basin in Ethiopia ranged from 0 in the downstream part of the watershed to over 80 t·ha−1·year−1 in much of the midstream and upstream parts, and to well over 125 t·ha−1·year−1 in some erosion hotspot areas [80]. Soil losses predicted for different land-use types within a microcatchment of the Lake Victoria basin were 93 t·ha−1·year−1 cropland, followed by rangeland (52 t·ha−1·year−1), banana–coffee (47 t·ha−1·year−1), and banana (32 t·ha−1·year−1). In the terrain units, high soil loss was within the back slopes (48 t·ha−1·year−1) followed by the summits (42 t·ha−1·year−1) and valleys (0 t·ha−1·year−1) [2]. Land-use types with crop cultivation are much more exposed to soil loss than land-use types under semi or natural vegetation such as grassland, rangeland, shrubland, forest, and post-fire; however, there are large variations within each of these land-use types due to topographic differences [20].
The erosion rate on undisturbed forestland is usually very low. These severe erosion rates observed in the forestland and grassland areas located in the Lake Kivu basin are the evidence of increased ecosystem disturbance, as previous studies indicated that the reduction of overstorey canopy; removal or alteration of vegetation; mining, destruction of forest, human-caused fires, and soil compaction from domestic animals grazing significantly increase soil erosion risk [20,26]. The study of Panagos et al. (2015) has shown that in southern Spain, very high soil loss rates (40.16 t·ha−1·year−1) existed mainly in high attitudes with scattered vegetation [81]. The highest soil erosion rate of 41 t·ha−1·year−1 estimated in a settled area of the Lake Kivu basin falls within the erosion rates that occur in construction sites, which can vary from 20 to 500 t·ha−1·year−1 due to land surface disturbance without biomass coverage [78]. In Utah and Montana, as the amount of ground cover decreased from 100% to less than 1%, erosion rates increased by approximately 200-fold [78,82]. In 2015, due to cropland expansion, the forest covered a small space (24%) of the non-water area in the Lake Kivu basin, while a minimum of 60% forest cover is necessary to prevent serious soil erosion and landslides [78].
The present study examined the status of soil erosion rates in cropland areas under some conservation practices (i.e., contouring, strip-cropping, and terracing) and found that terracing is the best method that could reduce soil erosion up to 23% in the study area (Figure 7). Cover and crop management factor (C factor), can also reduce soil erosion by water in arable lands, hence preventing the loss of nutrients and preserving soil organic carbon [74]. The increase of grass margins, the maintenance of stone walls, and the application of contour farming foreseen by the common agricultural policy can further reduce soil loss rates in arable lands [81].
Usually, conservation practices are not profitable when market prices are applied in low-income countries [83]. For example, in Rwanda, bench terracing investment costs were estimated at 800,000 Rwandan Francs (RWF) per hectare; the net present value (NPV) is negative (loss of FRW 47,384); and the internal rate of return (IRR) (11%) is lower than the discount rate of 13%, during a period of 20 years [58].
Planners should be aware that soil loss control involves both land owners and their governments because the benefits from soil erosion control increase food security, and sustain social and ecological services (i.e., water quality protection and flood prevention). For example, the total investment for U.S. erosion control was estimated at around $8.4 billion per year. Given that erosion causes about $44 billion in damages each year, it would seem that the investment is a small price to pay: for every $1 invested, $5.24 would be saved. This small investment would reduce U.S. agricultural soil loss by about 4 × 10⁹ tons, and help in protecting their water and soil resources, as well as in ensuring current and future food supply [28,84]. Many efforts have been made in 2003 at the European level to promote a more environmentally friendly agriculture, and results show a 10.8% decrease, from 8.33 t·ha−1·year−1 to 7.43 t·ha−1·year−1, in soil loss potential due to the adoption of the good agricultural and environmental conditions conservation practices [9].

5. Conclusions

The USLE model and GIS are prominent tools for soil erosion modelling with available geospatial data. This study highlighted the relationships between cropland expansion on steep slopes and extreme soil erosion risk by water and identified erosion hotspots that require significant management efforts. The results indicated that the Lake Kivu basin is exposed to severe overall mean soil erosion risk of 30 t·ha−1·year−1 and comprises a small fraction (33%) of now-water area associated with a tolerable soil loss ranging from 0 to 10 t·ha−1·year−1. Based on the findings of this study, it is suggested to increase terracing in cropland areas, since it could reduce soil erosion by up to about 23%, and further conservation practices are recommended—such as increase of the overstorey canopy and understorey vegetation, and control of human activities such as fires, mining, soil compaction from domestic animals grazing, and so on. Soil erosion control in settled areas consists of revegetation of construction sites, establishment of outlet channels, installation of rainfall water harvesting systems, and pervious paving block with grass among others.

Acknowledgments

The authors would like to thank the anonymous reviewers and the Editor whose constructive comments and suggestions have helped improve the quality of this manuscript. This study was supported by the National Natural Scientific Foundation of China (#U1503301) and the State Key Laboratory of Desert and Oasis Ecology (#Y471163).

Author Contributions

Fidele Karamage, Hua Shao, Chi Zhang, Felix Ndayisaba and Lamek Nahayo processed the USLE model and wrote the manuscript. Xi Chen, Alphonse Kayiranga, James Kehinde Omifolaji and Tong Liu participated in the discussion.

Conflicts of Interest

The authors declare no conflict of interest.

Abbreviations

The following abbreviations are used in this manuscript:
ftfoot
hahectare
hhour
tton
yyear
g gram
MJMegajoule
mmmillimeter
KmKilometer

References

  1. Bell, M.; Boardman, J. Past and Present Soil Erosion (Oxbow Monograph); Oxbow Books: Oxford, UK, 1992. [Google Scholar]
  2. Lufafa, A.; Tenywa, M.; Isabirye, M.; Majaliwa, M.; Woomer, P. Prediction of soil erosion in a Lake Victoria basin catchment using a GIS-based universal soil loss model. Agric. Syst. 2003, 76, 883–894. [Google Scholar] [CrossRef]
  3. Nachtergaele, F.; Petri, M.; Biancalani, R.; Van Lynden, G.; Van Velthuizen, H.; Bloise, M. Global Land Degradation Information System (Gladis); Beta Version. An Information Database for Land Degradation Assessment at Global Level. Land Degradation Assessment in Drylands Technical Report; Food and Agriculture Organization of the United Nations (FAO), 2010; Volume 17, Available online: http://www.fao.org/nr/lada/index.php?option=com_docman&task=doc_download&gid=773&Itemid=165&lang=en (accessed on 17 June 2015).
  4. Van Straaten, P. Rocks for Crops: Agrominerals of Sub-Saharan Africa. Icraf: Nairobi, Kenya, 2002; Volume 407. [Google Scholar]
  5. Tilman, D.; Fargione, J.; Wolff, B.; D’Antonio, C.; Dobson, A.; Howarth, R.; Schindler, D.; Schlesinger, W.H.; Simberloff, D.; Swackhamer, D. Forecasting agriculturally driven global environmental change. Science 2001, 292, 281–284. [Google Scholar] [CrossRef] [PubMed]
  6. Matson, P.A.; Parton, W.J.; Power, A.; Swift, M. Agricultural intensification and ecosystem properties. Science 1997, 277, 504–509. [Google Scholar] [CrossRef] [PubMed]
  7. Nahayo, L.; Li, L.; Kayiranga, A.; Karamage, F.; Mupenzi, C.; Ndayisaba, F.; Nyesheja, E.M. Agricultural impact on environment and counter measures in Rwanda. Afr. J. Agric. Res. 2016, 11, 2205–2212. [Google Scholar]
  8. Cerdà, A.; Lavee, H.; Romero-Díaz, A.; Hooke, J.; Montanarella, L. Preface. Land Degrad. Dev. 2010, 21, 71–74. [Google Scholar] [CrossRef]
  9. Borrelli, P.; Paustian, K.; Panagos, P.; Jones, A.; Schütt, B.; Lugato, E. Effect of good agricultural and environmental conditions on erosion and soil organic carbon balance: A national case study. Land Use Policy 2016, 50, 408–421. [Google Scholar] [CrossRef]
  10. Basnet, B.; Vodacek, A. Tracking land use/land cover dynamics in cloud prone areas using moderate resolution satellite data: A case study in central Africa. Remote Sens. 2015, 7, 6683–6709. [Google Scholar] [CrossRef]
  11. Pasche, N.; Alunga, G.; Mills, K.; Muvundja, F.; Ryves, D.B.; Schurter, M.; Wehrli, B.; Schmid, M. Abrupt onset of carbonate deposition in Lake Kivu during the 1960s: Response to recent environmental changes. J. Paleolimnol. 2010, 44, 931–946. [Google Scholar] [CrossRef] [Green Version]
  12. Muvundja, F.A.; Pasche, N.; Bugenyi, F.W.; Isumbisho, M.; Müller, B.; Namugize, J.-N.; Rinta, P.; Schmid, M.; Stierli, R.; Wüest, A. Balancing nutrient inputs to Lake Kivu. J. Gt. Lakes Res. 2009, 35, 406–418. [Google Scholar] [CrossRef]
  13. Moeyersons, J.; Tréfois, P.; Lavreau, J.; Alimasi, D.; Badriyo, I.; Mitima, B.; Mundala, M.; Munganga, D.; Nahimana, L. A geomorphological assessment of landslide origin at Bukavu, Democratic Republic of the Congo. Eng. Geol. 2004, 72, 73–87. [Google Scholar] [CrossRef]
  14. Dudgeon, D.; Arthington, A.H.; Gessner, M.O.; Kawabata, Z.-I.; Knowler, D.J.; Lévêque, C.; Naiman, R.J.; Prieur-Richard, A.-H.; Soto, D.; Stiassny, M.L. Freshwater biodiversity: Importance, threats, status and conservation challenges. Biol. Rev. 2006, 81, 163–182. [Google Scholar] [CrossRef] [PubMed]
  15. Karamage, F.; Zhang, C.; Ndayisaba, F.; Nahayo, L.; Kayiranga, A.; Omifolaji, J.K.; Shao, H.; Umuhoza, A.; Nsengiyumva, J.B.; Liu, T. The need for awareness of drinking water loss reduction for sustainable water resource management in Rwanda. J. Geosci. Environ. Prot. 2016, 4, 74–87. [Google Scholar] [CrossRef]
  16. Schmid, M.; Tietze, K.; Halbwachs, M.; Lorke, A.; Mcginnis, D.F.; Wüest, A. How hazardous is the gas accumulation in Lake Kivu? Arguments for a risk assesment in light of the Nyiragongo volcano eruption of 2002. Acta Vulcanol. 2002, 14, 115–122. [Google Scholar]
  17. Degens, E.T.; von Herzen, R.P.; Wong, H.-K.; Deuser, W.G.; Jannasch, H.W. Lake kivu: Structure, chemistry and biology of an east African Rift Lake. Geol. Rundsch. 1973, 62, 245–277. [Google Scholar] [CrossRef]
  18. Sarmento, H.; Isumbisho, M.; Descy, J.-P. Phytoplankton ecology of Lake Kivu (Eastern Africa). J. Plankton Res. 2006, 28, 815–829. [Google Scholar] [CrossRef]
  19. Biswas, S.S.; Pani, P. Estimation of soil erosion using RUSLE and GIS techniques: A case study of Barakar river basin, Jharkhand, India. Model. Earth Syst. Environ. 2015, 1, 1–13. [Google Scholar] [CrossRef]
  20. Maetens, W.; Vanmaercke, M.; Poesen, J.; Jankauskas, B.; Jankauskien, G.; Ionita, I. Effects of land use on annual runoff and soil loss in Europe and the Mediterranean: A meta—Analysis of plot data. Prog. Phys. Geogr. 2012. [Google Scholar] [CrossRef]
  21. Renard, K.G.; Foster, G.; Weesies, G.; McCool, D.; Yoder, D. Predicting Soil Erosion by Water: A Guide to Conservation Planning with the Revised Universal Soil Loss Equation (Rusle); United States Department of Agriculture: Washington DC, USA, 1997; Volume 703.
  22. Ntwali, D.; Ogwang, B.A.; Ongoma, V. The impacts of topography on spatial and temporal rainfall distribution over Rwanda based on WRF model. Atmos. Clim. Sci. 2016, 6, 145. [Google Scholar] [CrossRef]
  23. Spigel, R.; Coulter, G. Comparison of hydrology and physical limnology of the east African great lakes: Tanganyika, Malawi, Victoria, Kivu And Turkana (with reference to some north American great lakes). Limnol. Climatol. Paleoclimatol. East Afr. Lakes 1996, 103–139. [Google Scholar]
  24. Van Engelen, V.; Verdoodt, A.; Dijkshoorn, K.; Van Ranst, E. Soil and Terrain Database of Central Africa-Dr of Congo, Burundi and Rwanda (Sotercaf, Version 1.0); ISRIC-UGent-FAO: Wageningen, The Netherlands, 2006; Available online: http://www.isric.org/isric/webdocs/docs/ISRIC_Report_2006_07.pdf (accessed on 28 July 2016).
  25. United States Geological Survey (USGS). U.S. Geological Survey Earthexplorer (ee) Tool. Available online: http://www.earthexplorer.usgs.gov/ (accessed on 20 September 2015).
  26. Wischmeier, W.H.; Smith, D.D. Predicting Rainfall Erosion Losses—A Guide to Conservation Planning; U.S. Department of Agriculture, Science and Education Administration: Hyattsville, MD, USA, 1978; p. 62. [Google Scholar]
  27. Claessens, L.; Van Breugel, P.; Notenbaert, A.; Herrero, M.; Van De Steeg, J. Mapping potential soil erosion in east Africa using the universal soil loss equation and secondary data. IAHS Publ. 2008, 325, 398. [Google Scholar]
  28. Karamage, F.; Zhang, C.; Ndayisaba, F.; Shao, H.; Kayiranga, A.; Fang, X.; Nahayo, L.; Muhire Nyesheja, E.; Tian, G. Extent of cropland and related soil erosion risk in Rwanda. Sustainability 2016, 8, 609. [Google Scholar] [CrossRef]
  29. Karamage, F.; Zhang, C.; Kayiranga, A.; Shao, H.; Fang, X.; Ndayisaba, F.; Nahayo, L.; Mupenzi, C.; Tian, G. Usle-based assessment of soil erosion by water in the Nyabarongo River Catchment, Rwanda. Int. J. Environ. Res. Public Health 2016, 13, 835. [Google Scholar] [CrossRef] [PubMed]
  30. Renard, K.G.; Freimund, J.R. Using monthly precipitation data to estimate the R-factor in the revised USLE. J. Hydrol. 1994, 157, 287–306. [Google Scholar] [CrossRef]
  31. Yu, B.; Rosewell, C. Technical notes: A robust estimator of the R-factor for the universal soil loss equation. Trans. ASAE 1996, 39, 559–561. [Google Scholar] [CrossRef]
  32. Angima, S.; Stott, D.; O’neill, M.; Ong, C.; Weesies, G. Soil erosion prediction using RUSLE for central Kenyan highland conditions. Agric. Ecosyst. Environ. 2003, 97, 295–308. [Google Scholar] [CrossRef]
  33. Farhan, Y.; Nawaiseh, S. Spatial assessment of soil erosion risk using RUSLE and GIS techniques. Environ. Earth Sci. 2015, 74, 4649–4669. [Google Scholar] [CrossRef]
  34. Chris Funk, P.P.; Landsfeld, M.; Pedreros, D.; Verdin, J.; Shukla, S.; Husak, G.; Rowland, J.; Harrison, L.; Hoell, A.; Michaelsen, J. The climate hazards infrared precipitation with stations—A new environmental record for monitoring extremes. Sci. Data 2015, 8, 150066. [Google Scholar] [CrossRef] [PubMed]
  35. Ndayisaba, F.; Guo, H.; Bao, A.; Guo, H.; Karamage, F.; Kayiranga, A. Understanding the spatial temporal vegetation dynamics in Rwanda. Remote Sens. 2016, 8, 129. [Google Scholar] [CrossRef]
  36. Lo, A.; El-Swaify, S.A.; Dangler, E.W.; Shinshiro, L. Effectiveness of El30 as an erosivity index in Hawaii. In Soil Erosion and Conservation; E1-Swaify, S.A., Moldenhauer, W.C., Lo, A., Eds.; Soil Conservation Society of America: Ankeny, IA, USA, 1985; pp. 384–392. [Google Scholar]
  37. Nachtergaele, F.O.; Petri, M.; Biancalani, R.; Lynden, G.V.; Velthuizen, H.V.; Bloise, M. Global Land Degradation Information System (Gladis). An Information Database for Land Degradation Assessment at Global Level. Technical Working Paper of the Lada FAO/Unep Project. Available online: http://www.fao.org/nr/lada/gladis/gladis_db/ (accessed on 15 October 2015).
  38. Funk, C.; Peterson, P.; Landsfeld, M.; Pedreros, D.; Verdin, J.; Shukla, S.; Husak, G.; Rowland, J.; Harrison, L.; Hoell, A.; et al. The climate hazards infrared precipitation with stations-a new environmental record for monitoring extremes. Sci. Data 2015, 2, 150066. [Google Scholar] [CrossRef]
  39. Hengl, T.; Heuvelink, G.B.; Kempen, B.; Leenaars, J.G.; Walsh, M.G.; Shepherd, K.D.; Sila, A.; MacMillan, R.A.; de Jesus, J.M.; Tamene, L. Mapping soil properties of Africa at 250 m resolution: Random forests significantly improve current predictions. PLoS ONE 2015, 10, e0125814. [Google Scholar] [CrossRef] [PubMed]
  40. Williams, J.R. The EPIC model. In Computer Models of Watershed Hydrology; Water Resources Publications: Highlands Ranch, CO, USA, 1995; pp. 909–1000. [Google Scholar]
  41. Arnold, J.G.; Kiniry, J.R.; Srinivasan, R.; Williams, J.R.; Haney, E.B.; Neitsch, S.L. Soil & Water Assessment Tool: Input/Output Documentation Version. 2012. Available online: http://www.swat.tamu.edu/media/69296/SWAT-IO-Documentation-2012.pdf (accessed on 15 May 2016).
  42. Nam, P.T.; Yang, D.; Kanae, S.; Oki, T.; Musiake, K. Global soil loss estimate using RUSLE model: The use of global spatial datasets on estimating erosive parameters. Geol. Data Process. 2003, 14, 49–53. [Google Scholar] [CrossRef]
  43. Desmet, P.; Govers, G. A GIS procedure for automatically calculating the USLE LS factor on topographically complex landscape units. J. Soil Water Conserv. 1996, 51, 427–433. [Google Scholar]
  44. Foster, G.; Meyer, L.; Onstad, C. A runoff erosivity factor and variable slope length exponents for soil loss estimates. Trans. ASAE 1977, 20, 0683–0687. [Google Scholar] [CrossRef]
  45. McCool, D.; Brown, L.; Foster, G.; Mutchler, C.; Meyer, L. Revised slope steepness factor for the universal soil loss equation. Trans. ASAE 1987, 30, 1387–1396. [Google Scholar] [CrossRef]
  46. McCool, D.K.; Foster, G.R.; Mutchler, C.; Meyer, L. Revised slope length factor for the universal soil loss equation. Trans. ASAE 1989, 32, 1571–1576. [Google Scholar] [CrossRef]
  47. Barrios, A.G.; Quiñónez, E. Evaluación de la erosión utilizando el modelo (r) usle, con apoyo de sig. Aplicación en una microcuenca de los andes venezolanos. Rev. For. Venez. 2000, 44, 2000. [Google Scholar]
  48. Lee, S. Soil erosion assessment and its verification using the universal soil loss equation and geographic information system: A case study at Boun, Korea. Environ. Geol. 2004, 45, 457–465. [Google Scholar] [CrossRef]
  49. Mather, P.; Koch, M. Computer Processing of Remotely-Sensed Images: An Introduction; John Wiley & Sons: Hoboken, NJ, USA, 2011. [Google Scholar]
  50. Lin, C. A study on the width and placement of vegetated buffer strips in a mudstone-distributed watershed. J. China Soil Water Conserv. 1997, 29, 250–266. (In Chinese) [Google Scholar]
  51. Van der Knijff, J.; Jones, R.; Montanarella, L. Soil Erosion Risk Assessment in Europe; European Soil Bureau, European Commission Belgium, 2000; Available online: https://www.researchgate.net/profile/Luca_Montanarella/publication/237727657_Soil_erosion_risk_assessment_in_Europe_EUR_19044_EN/links/55d1c0f208ae2496ee6580ca.pdf (accessed on 16 August 2016).
  52. Oliveira, J.D.A.; Dominguez, J.M.L.; Nearing, M.A.; Oliveira, P.T. A GIS-based procedure for automatically calculating soil loss from the universalsoil loss equation: Gisus-m. Appl. Eng. Agric. 2015, 31, 907. [Google Scholar]
  53. Mhangara, P.; Kakembo, V.; Lim, K.J. Soil erosion risk assessment of the Keiskamma catchment, South Africa using GIS and remote sensing. Environ. Earth Sci. 2012, 65, 2087–2102. [Google Scholar] [CrossRef]
  54. Alexandridis, T.K.; Sotiropoulou, A.M.; Bilas, G.; Karapetsas, N.; Silleos, N.G. The effects of seasonality in estimating the c-factor of soil erosion studies. Land Degrad. Dev. 2015, 26, 596–603. [Google Scholar] [CrossRef]
  55. NASA Goddard Space Flight Center. MOD13Q1-MODIS/Terra Vegetation Indices 16-Day l3 Global 250m Sin Grid. Available online: http://ladsweb.nascom.nasa.gov/data/html (accessed on 18 May 2016).
  56. Kim, H.S. Soil Erosion Modeling Using Rusle and Gis on the Imha Watershed, South Korea; Colorado State University: Fort Collins, CO, USA, 2006. [Google Scholar]
  57. De la Paix, M.J.; Lanhai, L.; Jiwen, G.; De Dieu, H.J.; Gabriel, H.; Jean, N.; Innocent, B. Radical terraces in Rwanda. East Afr. J. Sci. Technol. 2012, 1, 53–58. [Google Scholar]
  58. Bizoza, A.; De Graaff, J. Financial cost-benefit analysis of bench terraces in Rwanda. Land Degrad. Dev. 2012, 23, 103–115. [Google Scholar] [CrossRef]
  59. Panagos, P.; Borrelli, P.; Meusburger, K.; Van Der Zanden, E.H.; Poesen, J.; Alewell, C. Modelling the effect of support practices (P-factor) on the reduction of soil erosion by water at european scale. Environ. Sci. Policy 2015, 51, 23–34. [Google Scholar] [CrossRef] [Green Version]
  60. Kim, J.B.; Saunders, P.; Finn, J.T. Rapid assessment of soil erosion in the Rio Lempa basin, central America, using the universal soil loss equation and geographic information systems. Environ. Manag. 2005, 36, 872–885. [Google Scholar] [CrossRef] [PubMed]
  61. Maetens, W.; Poesen, J.; Vanmaercke, M. How effective are soil conservation techniques in reducing plot runoff and soil loss in europe and the Mediterranean? Earth Sci. Rev. 2012, 115, 21–36. [Google Scholar] [CrossRef]
  62. United States Geological Survey (USGS). USGS Global Visualization Viewer: Earth Resources Observation and Science Center (Eros). Available online: http://www.glovis.usgs.gov/index.shtml (accessed on 20 September 2015).
  63. Otukei, J.R.; Blaschke, T. Land cover change assessment using decision trees, support vector machines and maximum likelihood classification algorithms. Int. J. Appl. Earth Obs. Geoinf. 2010, 12, S27–S31. [Google Scholar] [CrossRef]
  64. Akgün, A.; Eronat, A.H.; Türk, N. Comparing different satellite image classification methods: An application in ayvalik district, Western Turkey. In Proceedings of the 4th International Congress for Photogrammetry and Remote Sensing, Istanbul, Turkey, 12–23 July 2004.
  65. Anderson, J.R. A Land Use and Land Cover Classification System for Use with Remote Sensor Data; US Government Printing Office: Washington DC, USA, 1976; Volume 964.
  66. Long, J.B.; Giri, C. Mapping the Philippines’ mangrove forests using Landsat imagery. Sensors 2011, 11, 2972–2981. [Google Scholar] [CrossRef] [PubMed]
  67. Bishop, Y.M.; Fienberg, S.E.; Holland, P.W. Discrete Multivariate Analysis: Theory and Practice; Massachusetts Institute of Technology Press: Cambridge, MA, USA, 1975. [Google Scholar]
  68. Mather, P.M. Computer Processing of Remotely-Sensed Images, 3rd ed.; Wiley: Chichester, UK, 2004. [Google Scholar]
  69. Tilahun, A.; Teferie, B. Accuracy assessment of land use land cover classification using google earth. Am. J. Environ. Prot. 2015, 4, 193–198. [Google Scholar] [CrossRef]
  70. Thomlinson, J.R.; Bolstad, P.V.; Cohen, W.B. Coordinating methodologies for scaling landcover classifications from site-specific to global: Steps toward validating global map products. Remote Sens. Environ. 1999, 70, 16–28. [Google Scholar] [CrossRef]
  71. Manandhar, R.; Odeh, I.O.; Ancev, T. Improving the accuracy of land use and land cover classification of Landsat data using post-classification enhancement. Remote Sens. 2009, 1, 330–344. [Google Scholar] [CrossRef]
  72. EI-Swaify, S.A.; Dangler, E.W.; Armstrong, C.L. Soil Erosion by Water in the Tropics. Available online: http://www.ctahr.hawaii.edu/oc/freepubs/pdf/RES-024.pdf (accessed on 17 October 2016).
  73. Shin, G. The Analysis of Soil Erosion Analysis in Watershed Using Gis. Ph.D. Dissertation, Department of Civil Engineering, Gang-Won National University, Chuncheon, Korea, 1999. [Google Scholar]
  74. Panagos, P.; Borrelli, P.; Meusburger, K.; Alewell, C.; Lugato, E.; Montanarella, L. Estimating the soil erosion cover-management factor at the European scale. Land Use Policy 2015, 48, 38–50. [Google Scholar] [CrossRef]
  75. Briggs, D.; Giordano, A.; Cornaert, M.; Peter, D.; Maes, J. Corine Soil Erosion Risk and Important Land Resources in the Southern Regions of the European Community; Commission of the European Communities Publication EUR, 1992; p. 13233. Available online: http://www.eea.europa.eu/publications/COR0-soil (accessed on 20 May 2016).
  76. Morgan, R.P.C. Soil Erosion and Conservation; John Wiley & Sons: Hoboken, NJ, USA, 2009. [Google Scholar]
  77. Bamutaze, Y. Revisiting socio-ecological resilience and sustainability in the coupled mountain landscapes in Eastern Africa. Curr. Opin. Environ. Sustain. 2015, 14, 257–265. [Google Scholar] [CrossRef]
  78. Pimentel, D. Soil erosion: A food and environmental threat. Environ. Dev. Sustain. 2006, 8, 119–137. [Google Scholar] [CrossRef]
  79. Lal, R. Soil erosion and land degradation: The global risks. In Advances in Soil Science; Springer: Berlin, Germany, 1990; pp. 129–172. [Google Scholar]
  80. Bewket, W.; Teferi, E. Assessment of soil erosion hazard and prioritization for treatment at the watershed level: Case study in the Chemoga watershed, Blue Nile Basin, Ethiopia. Land Degrad. Dev. 2009, 20, 609–622. [Google Scholar] [CrossRef]
  81. Panagos, P.; Borrelli, P.; Poesen, J.; Ballabio, C.; Lugato, E.; Meusburger, K.; Montanarella, L.; Alewell, C. The new assessment of soil loss by water erosion in Europe. Environ. Sci. Policy 2015, 54, 438–447. [Google Scholar] [CrossRef]
  82. Trimble, S.W.; Mendel, A.C. The cow as a geomorphic agent—a critical review. Geomorphology 1995, 13, 233–253. [Google Scholar] [CrossRef]
  83. Barbier, E.B. The farm-level economics of soil conservation: The uplands of Java. Land Econ. 1990, 66, 199–211. [Google Scholar] [CrossRef]
  84. Pimentel, D.; Harvey, C.; Resosudarmo, P.; Sinclair, K. Environmental and economic costs of soil erosion and conservation benefits. Science 1995, 267, 1117. [Google Scholar] [CrossRef] [PubMed]
Figure 1. The Lake Kivu basin.
Forests 07 00281 g001
Figure 2. The Universal Soil Erosion Equation (USLE) factor maps: (a) rainfall-runoff erosivity factor; (b) soil erodibility factor; (c) slope length and slope steepness factor; and (d) crop and cover management factor.
Forests 07 00281 g002
Figure 3. Land cover and land use map for the Lake Kivu basin in 2015.
Forests 07 00281 g003
Figure 4. Maps of the soil erosion by water in the Lake Kivu basin (502,662 ha): (a) potential soil erosion; and (b) soil erosion risk (2015).
Forests 07 00281 g004
Figure 5. Estimated soil erosion risk according to 2015 land cover/use map of the Lake Kivu basin.
Forests 07 00281 g005
Figure 6. Slope gradient and estimated rates of soil erosion risk in the Lake Kivu basin.
Forests 07 00281 g006
Figure 7. Maps of soil erosion risk by water for 2015 cropland cell in the Lake Kivu basin under assumed different conservation practices: (a) current minor conservation practice (P = 0.75); (b) contouring; (c) strip-cropping; and (d) terracing.
Forests 07 00281 g007
Table 1. Error matrix of the 2015 land cover and land use map (Figure 2) for the Lake Kivu basin.
(1)(2)(3)(4)(5)User AccuracyCommission Error
Settlement (1)4730005094%6%
Cropland (2)3432505381%19%
Forestland (3)0144304892%8%
Grassland (4)0344204986%14%
Lake Kivu (5)00005050100%0%
5050505050250
Producer accuracy94%86%88%84%100%
Omission error6%14%12%16%0%
Overall accuracy90.4%
Kappa88%
Table 2. P factor values under different conservation support practices.
Slope (%)Conservation Support Practices (P Factor)
ContouringStrip-CroppingTerracing
0.0–7.00.550.270.10
7.0–11.30.600.300.12
11.3–17.60.800.400.16
17.6–26.80.900.450.18
>26.8 10.500.20

