1. Introduction
Historically, forestry has been an important industry in Norway, both for value creation and for employment. Back in 1845, it accounted for 10.4% of the GDP in Norway [
1]. However, the rise of new industries has lead, obviously, to a decline of forestry’s importance, and one and a half centuries later, the sectors “Wood products” and “Pulp, paper and paper products” together constituted only 0.76% of the GDP [
2]. On the other hand, with most resources and businesses located in or close to rather peripheral areas, forestry and related sectors still represent an important rural employer in Norway. For example, in the northern Norwegian municipality Grane, 19% of the employees work in forest-based industries.
Forestry is a long-perspective industry: today’s harvesting potential hinges upon decisions made decades ago. Extensive afforestation activities started in Norway in the 1950s created a high potential for increased value creation in the near future [
3], and current logging activities are outpaced by the growth of mature forest resources. Potential harvesting volumes in coastal Norway increased from 85 million m
in 1925 to 300 million m
in 2015 with a sales potential of 60 billion NOK [
4]. This is mirrored by an ever increasing demand for wood and related products world wide; EU’s demand is expected to grow by 35% by the year 2020 [
5]. Official goals are to quadruple the Norwegian wood sector’s value creation by 2045, compared to 2012 values [
6], for example, through more efficient and comprehensive resource usage and through more regional wood conversion and processing rather than direct export. Taking a value-chain perspective, a report to the Norwegian Parliament [
7] points out the need for sustainable use of forest resources, for efficient transport from forest to industry and for a competitive processing industry. Norwegian district and regional policies seek to provide good conditions for natural-resource based industries to achieve maximal possible national value creation [
8]. Rural coastal regions such as the northern part of the country where much of the afforestation activities took place are, hence, expected to play a central role with respect to the anticipated increase in value creation from forestry.
Transport infrastructure is one of many potential bottlenecks on this way. Especially in coastal areas, transportation of timber and wood products is a complex task and finding cost-efficient solutions is challenging [
5,
9]. Fjords, mountains and forest properties without access to infrastructure lead to long transportation distances. Still, the majority of log transportation is carried out by trucks all the way from harvest areas to customers. Even more, a considerable amount of timber used in central and northern Norwegian coastal regions today is imported from Sweden by truck. So far, the large potential of northern Norway’s long coastline to contribute to efficient transport solutions including transport by sea and the availability and efficient operation of appropriate quay facilities has not been exploited sufficiently. Consequently, optimizing and streamlining the wood value chain (VC), including investments, harvesting, transportation, demand-side operations and its impacts on the regional economy, is of outmost importance. This is a complex system, resulting in large integrated transportation and production planning problems. However, in a high-volume sector such as forestry, even small efficiency improvements can result in large economic gains [
10].
Typically, VC actors seek to improve efficiency independently of each other. Combined with insufficient information sharing and coordination, this often causes inefficient overall logistics and, in turn, inefficient use of local and regional timber resources and increasing standing stock. Moreover, it will lead to lower profits for the whole VC and lower economic output in the region. To optimize this system, robust and efficient models with a holistic perspective are called for, balancing industry goals with society’s concerns such as value creation and how the wood VC affects other sectors, both regional and national, through their industrial interdependencies. These ripple effects (REs) outside the VC are measured in an Input-Output (I-O) analysis. (While the terms ripple effects and spillover effects are used synonymously in the I-O literature and have a very similar meaning, we chose the term ripple effects in this paper.)
These challenges motivated the development of a mathematical business economic model addressing aggregated harvesting plans, cost-efficient transportation, resource usage, production of wood and timber products, and industry development in combination with effects on the wider economy. The mixed-integer linear programming (MILP) model is capable of optimizing both the profit within the VC and ripple effects from logging and processing. With a holistic view on the wood value chain, it reflects regional industry structures, forest resources and infrastructure, ensuring applicability and local relevance of the found insights. Developed in close cooperation with partners from industry, business networking forums and government (Moelven Van Severen AS, Arbor AS, Statskog SF, Allskog SA, Mosjøen Havn KF, Skognæringa Kyst SA, Nordland county administration and Nordland county authority) the model helps to answer questions on how the Norwegian forestry industry may contribute to stimulating regional growth or how trade-offs between profits in the wood VC and REs outside this VC may be assessed. While, globally, the forestry business environment is quite dynamic and volatile [
10], this is, by and large, not the case for the decisions and, in particular, the region considered here. Hence, our model is strategically-tactically oriented, albeit with a flexible time horizon, and disregards uncertainty. Our model constitutes one of the first approaches combining value chain optimization and regional macro-economic theory by way of I-O analysis methods. For a related approach in the bio-energy sector, see You et al. [
11].
The objective of this paper is to demonstrate concepts of this approach, outlining the common mathematical optimization model. A case study shows how it may be used to support regional authorities’ decision making and help balancing between regional political and industry interests.
In the following section, we discuss relevant research from these disciplines, focussing on the forestry and wood processing sectors and on approaches taking an integrated view on the VC or bridging the gap between business and policy goals.
Section 3 is dedicated to methodological aspects, outlining the wood value chain studied here, explaining details of the I-O analysis and describing the integrated VC optimization model. Some of the model’s capabilities are demonstrated by way of a case study examining a coastal region in northern Norway. Details of this case are given in
Section 4 while
Section 5 discusses selected results and outlines wider perspectives. This leads to summarizing and concluding remarks in
Section 6.
2. Literature Review
In countries endowed with large forest resources, the forestry sector has a significant impact on the regional economy [
12] and, obviously, policy makers or other stakeholders are interested in assessing the sectors’ contribution to, e.g., employment or gross output. Ripple effects help to quantify the value added by the sector’s activities including its interactions with the wider economy. An often used methodology is I-O models, dating back to a model by Leontief in the 1930s [
13]. The model assesses the macro-economic connections between sectors in the economy (industries, households and government) and is discussed in detail in, e.g., Miller and Blair [
14]. Building on Leontief’s basic model, many variants have been developed. For example, single-region I-O models capture sectoral relationships within a given regional dimension in a country. The IMPLAN model system [
15], used in several US forestry analyses [
16], is flexible with respect to geographical structures with corresponding regional I-O tables and multipliers. Psaltopoulos and Thomson [
17] investigate the economic role of forestry in rural Scotland, finding, in general, limited backward linkages to other rural industries, with the exception of wood-processing industries. Scottish forestry is also in focus in Eiser and Roberts [
18] who use disaggregated I-O tables to quantify economy-wide effects of planting strategies on industry output and employment. Rimmler et al. [
19] use I-O analysis to evaluate outcomes of five national forest policies in Finland, Teischinger [
20] discusses several forest-based value chains and how to estimate the gross value added by the sector while Sikanen [
21] describes value-adding processes in a forest-based bioenergy value chain.
Naturally, publicly available I-O tables are limited with respect to industry detail. To obtain I-O models for several production lines in a specific sector, the tables must be disaggregated, e.g., by using additional survey data. Eiser and Roberts [
18] collected survey data on outputs and financial flows differentiated by woodland type. Bösch et al. [
22] show how to disaggregate physical forestry-based industry I-O data by tracking how forestry inputs are used in production processes and matching them with outputs. We construct I-O multipliers on national and regional levels, extending publicly available data for the Norwegian economy such as Regional Accounts [
23] and the regional I-O model PANDA (developed by SINTEF, Trondheim, Norway,
www.pandagruppen.no) by survey data gathered from the industry.
The forestry sector with its variety of activities and types of actors involved has been topic for optimization for a while. A large number of models has been developed and, partly, commercially deployed. For example, Motsa [
24] focusses on forest harvesting operations and their impact on the whole value chain. Carlsson and Rönnqvist [
25] discuss cases improving a forest company’s supply chain management through optimization approaches to coordinate the wood flow along the chain. Both Rönnqvist [
26] and D’Amours et al. [
27] give an overview of actors, value chains, typical decisions on the various planning levels and time horizons as well as challenges for modelling and optimization. Rönnqvist [
26] presents examples of optimization problems, often restricted to single stages in the value chain: harvesting/afforestation, production, transportation or markets. Most problems focus on costs or profits of one or a few actors. Following up on this, D’Amours et al. [
27] discuss challenges when integrating several planning levels or coordinating between independent actors. They point out that value chain design rarely studies alternative production processes (“recipes”) or the integration of various forestry value chains to utilizate raw materials more efficiently. Coining the term “supply chain network”, Shahi and Pulkki [
10] shed light on the complex structure of the sector with many relations between various product chains. Being able to utilize the “complete tree” is one of the concerns of our industry partners and our optimization model allows an optimal choice of production processes and combinations of product chains.
The majority of optimization models for the wood VC is tailored to a single company, sometimes in connection with their immediate VC predecessors or successors. They can, hence, be seen as decentralized approaches, optimizing the considered company’s decisions from their point of view to gain a competitive advantage. Equilibrium models [
28] may preserve this decentralized perspective, yet take a more holistic view on the VC and a region’s economics. Centralized VC planning approaches coordinate independent actors’ decisions across the whole chain to improve some common objective. Obviously, they are not sufficient for analyses of several companies in the same value chain—as also pointed out by Shahi and Pulkki [
10]—in particular, when focussing on company profits or costs. They are, however, well-suited when lifting the model perspective to regional value creation and industry development, i.e., to policy aspects concerning the whole society. Few approaches take such a point of view. Frisk et al. [
29] analyze models stimulating collaborative transport planning between forest companies operating in the same region. Developing an optimization problem to coordinate supply chain actors’ procurement decisions, Kong et al. [
30] find a trade-off between alternative uses of forest products in an integrated market. Likewise, Kaut et al. [
31] take a holistic point of view, albeit on a bioenergy supply chain, combining strategic and tactical planning under uncertainty. Also the work presented here integrates strategic and tactical decisions, finding harvesting volumes and locations, transportation and production choices and investments which are the best for the whole value chain.
Drivers for cluster formation—and, hence, value chain design—in wood-based industries are investigated by Viitamo [
32], focussing on business-to-business relations, information exchange and other tangible and intangible linkages affecting transaction costs. Hagadone and Grala [
33] examine the impact of transportation infrastructure and availability of raw materials or labour force on forest industry clusters. Analyzing efficient timber transport and optimal quay localisation, Nørstebø and Johansen [
34] take into account co-utilization effects with other local industry in the form of economic (profitability) and non-economic (local workforce) characteristics. Clustering can also be addressed by our approach, including interrelations between companies and investments in companies and production technologies and evaluating cluster effects on the economy.
This extends the scope of typical value chain optimization by features other than macro-economic aspects. Often, sustainability is assessed along economical, social and environmental dimensions, and numerous impact indicator sets have been developed for the forestry sector. For example, Voces et al. [
35] and Diaz-Balteiro et al. [
36] show how to address sustainability issues with a composite index of various country-level statistical indicators. Indicators can also be combined in multi-criteria or sustainability impact analyses to compare, e.g., different policy choices or technological change [
37]. Post-optimization steps to optimization models accommodate such assessments as demonstrated by, e.g., von Geibler et al. [
38] for a wood usage VC in the building sector. Also the benchmark run in
Section 5 includes a post-optimization evaluation of regional and national value creation. In a review of studies assessing or optimizing forest biomass supply chains with respect to sustainability, Cambero and Sowlati [
39] found that they typically address either economic (through techno-economic or optimization approaches) or environmental (through assessments) aspects. The authors identified a trend towards integration, often by combining multi-objective optimization and life-cycle assessment methods, and call for further development of decision support tools incorporating all three sustainability dimensions. A full integration of sustainability aspects into an optimization model is challenging and supposes, for example, that impact factors and their relations to the model decisions can be described functionally, preferably by continuous and linear functions. Only few indicators lend themselves to this. Quantifying value creation and similar ripple effects, for example, by way of I-O tables and multipliers as demonstrated in our model, appears to be one of the most accessible options.
To integrate multiple aspects in an optimization framework, one may, for example, try to find a balanced combination of all aspects in one objective function or explore their trade-off by tracing a Pareto-efficient frontier. You et al. [
11] integrate life-cycle assessment and social aspects such as local job creation due to supply chain activities in a multi-objective framework, solved by a Pareto-optimality approach. Carvalho et al. [
40] present a multi-objective linear programming model based on an I-O framework, which balances gross domestic product, employment and energy use (emissions). Obviously, the various approaches will yield different insights to be used in different analyses as discussed in
Section 5.
4. Case Study—Coastal Northern Norway
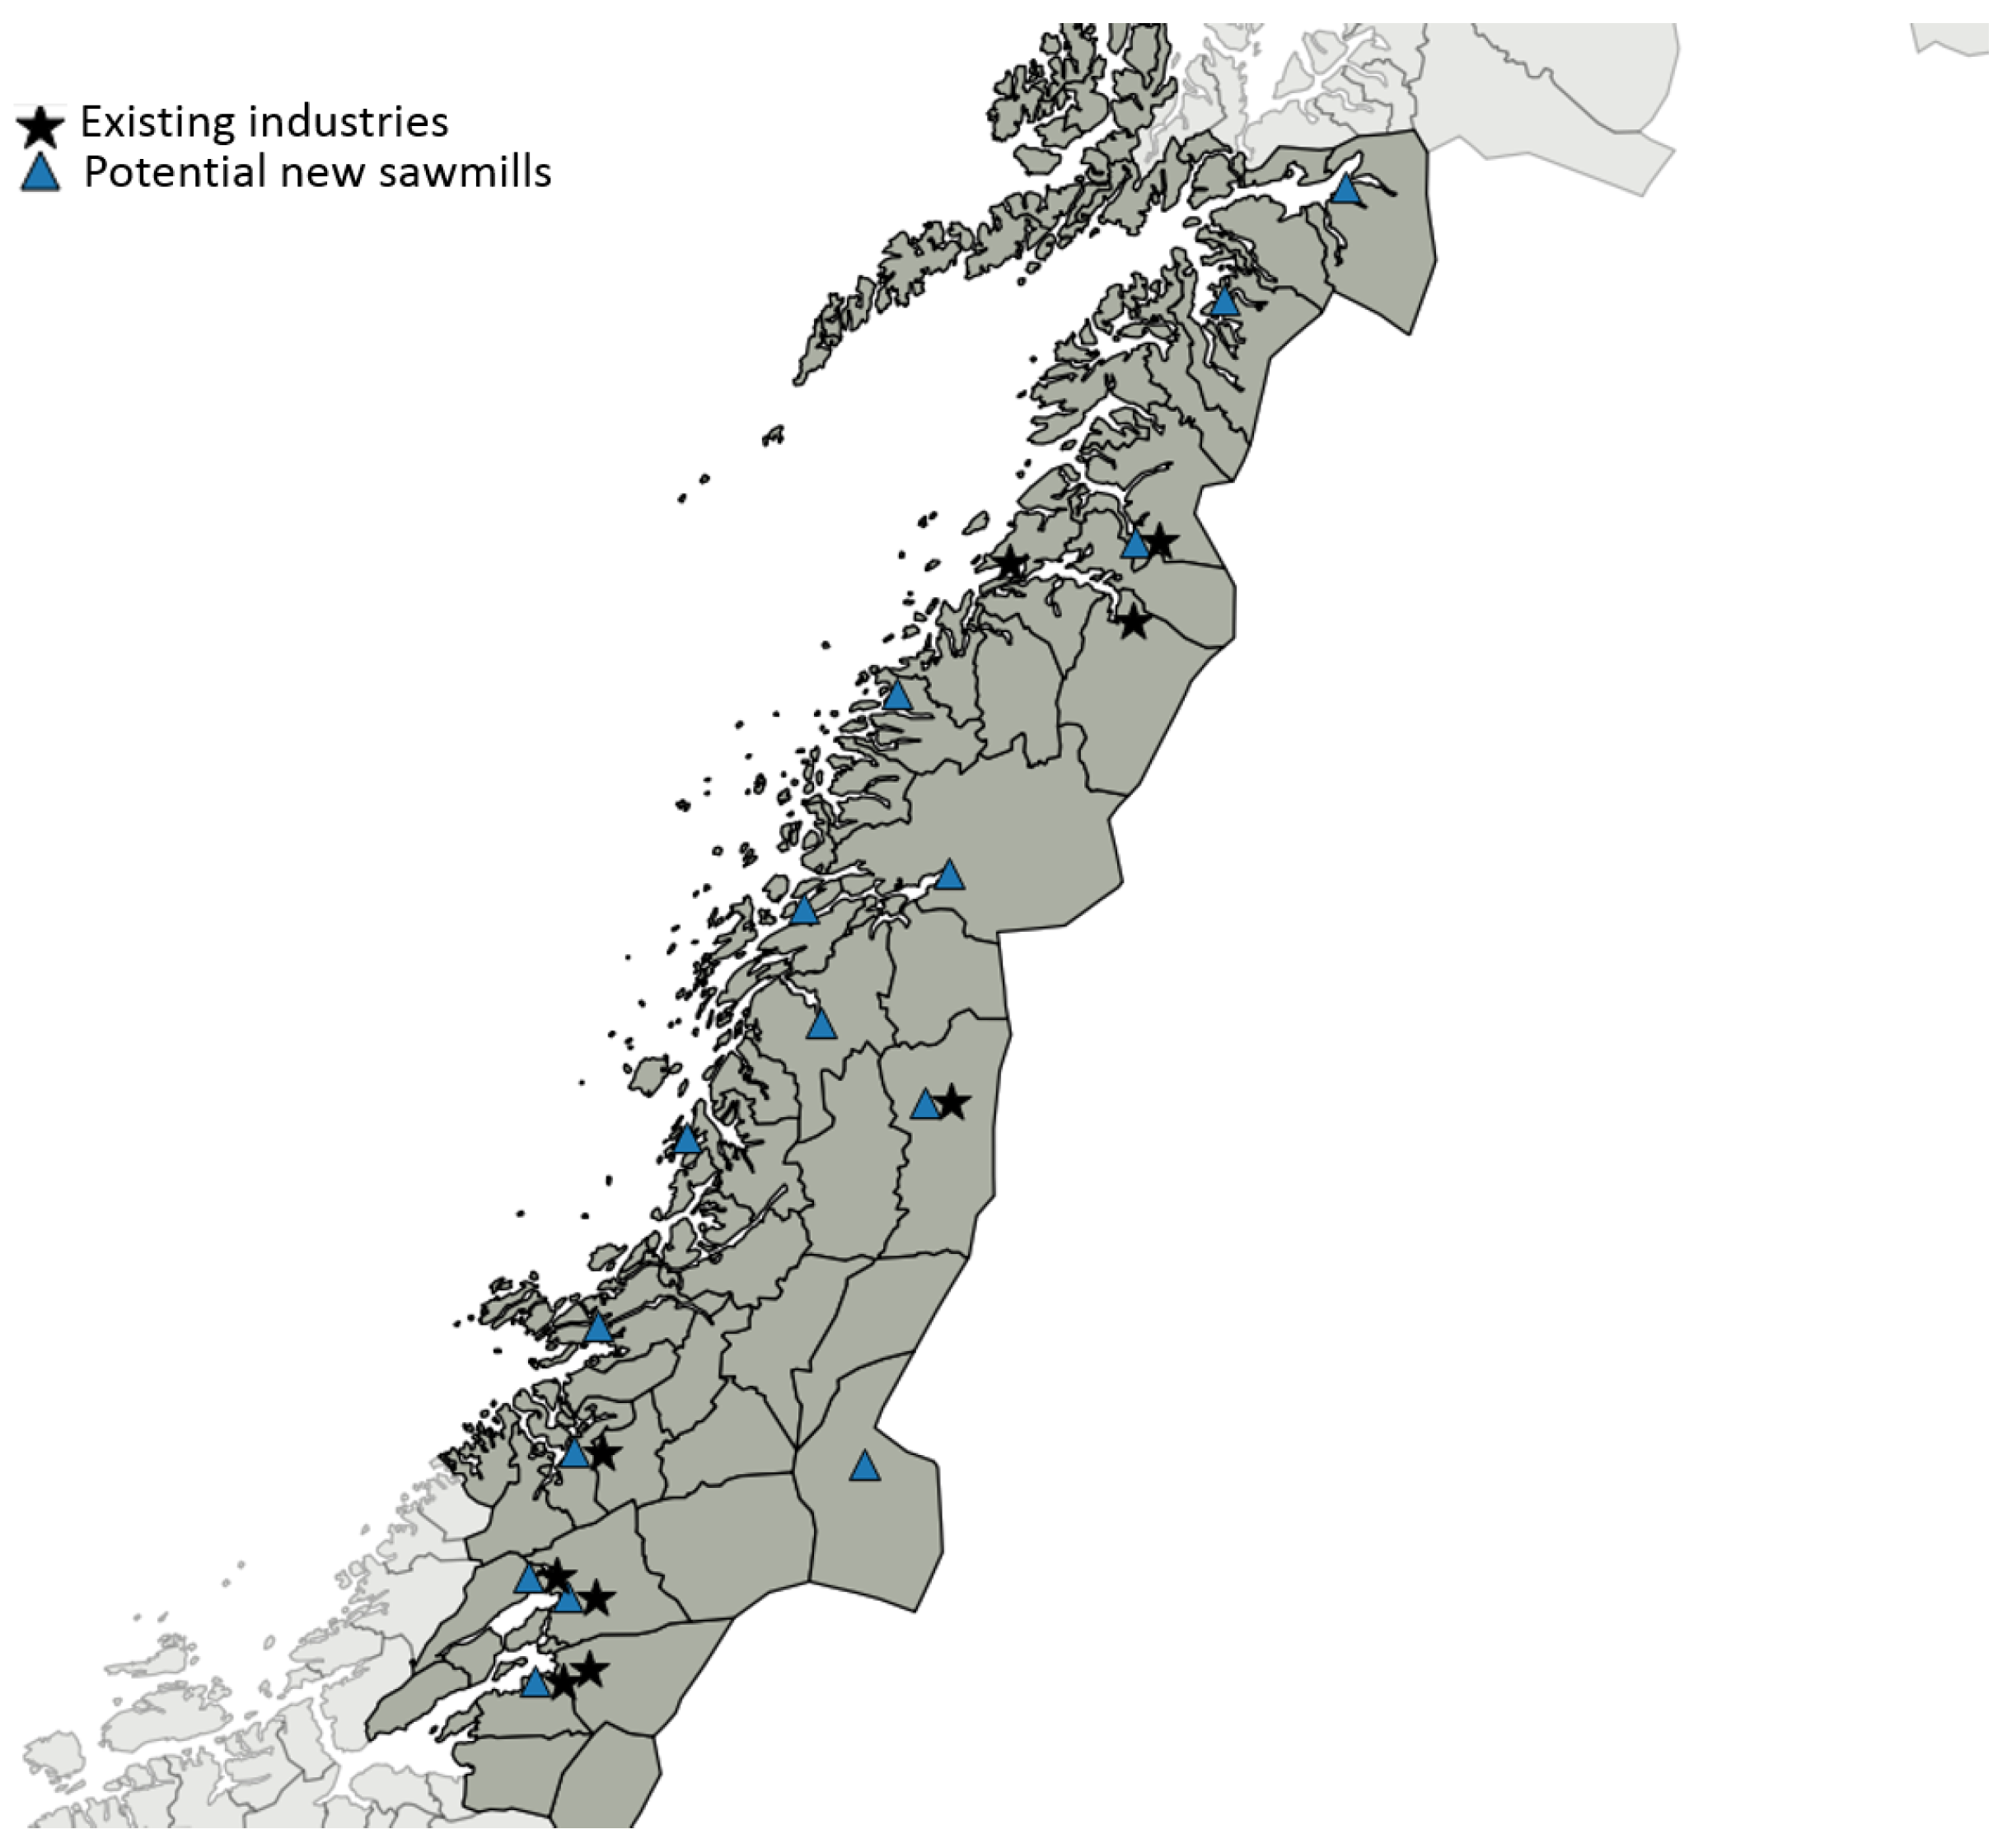
We demonstrate features and capabilities of the integrated optimization model by way of a realistic case inspired by our partners from industry and government. The case region comprises counties Nord-Trøndelag and Nordland in coastal northern Norway. We study nine companies which use forest resources as raw materials for their production: three sawmills, one particle board producer, two bioenergy plants and three other processing facilities. To demonstrate effects of different optimization perspectives on investment and localization and ensuing changes in regional resource use and production, we investigate options to invest in new sawmills at 15 locations evenly distributed over the region. This case is then extended to analyze the establishment of industry clusters.
Figure 3 illustrates the considered region and locations of all existing and potential new companies.
Forest resources available for logging are spread out over all 48 municipalities in the region and consist of three different types of wood (spruce, pine and birch), which may be used as saw timber or pulpwood. The resources in the region cannot satisfy all industry demand, the remainder being imported from other parts of Norway. In order to keep the problem size manageable, only few, mostly generic, product types were included, totalling 23 different products. The market for final products consists of customers in northern Norway, the rest of Norway and abroad. The region comprises 15 harbours relevant for the case and some companies and customers are located in proximity to a harbour, while others are located inland.
The VC is optimized from several points of view: only value chain profits, only national or regional ripple effects from VC activities, or a combination of both. For each model run, we examine aspects of the solution such as profits achieved for the whole VC or for selected groups of participants (e.g., regional forest owners, regional companies), created ripple effects, usage of regional resources or investment behaviour. These analyses are carried out over a 25-year horizon divided into five time periods of five years each.
The model was implemented in the Xpress-Mosel modelling language (FICO, San Jose, CA, USA). In the analyses for this case, at most two objectives were set up against each other. It was, hence, not necessary to implement specific multi-criteria methods such as heuristics exploring the solution space systematically to find all Pareto optimal solutions. A weighted combination of objective functions, the calculation of a two-dimensional Pareto front or post-optimization calculations proved sufficient. A typical problem for the considered case contained about constraints and million variables and was solved by standard MILP solvers within five to ten minutes.
4.1. Case Data
The case study depicts the current situation and we aimed at utilizing as realistic input data as possible. The location of the existing nine companies corresponds to their actual position while the fictive locations for potential sawmills and industry clusters reflect a wide range of options with respect to proximity to transportation infrastructure, resources, other industry and customers. Forest resources, transportation distances, road capacities and related costs and parameters were calculated using models developed by SINTEF (Trondheim, Norway) [
3,
44] and real data. Other transportation and harbour costs were collected from, mainly, Grønland [
45] and other public regulations and reports. Data on company and technology investment, operations and storage are real data supplemented, where necessary, by synthetic ones. Product prices were derived from publicly available market analyses (e.g., Pøyry [
46]) or fictive data while customer demand is synthetic data harmonized with actual production volumes and capacities. The multipliers estimating ripple effects from VC activities were derived from publicly available I-O tables, supplemented by empirics. National tables were obtained from Statistics Norway, covering the year 2013. Regional tables were generated using the PANDA model with base year 2010. All synthetic and fictive data were verified by our project partners to be in the correct order of magnitude.
4.2. Calculation of Input-Output Multipliers
Publicly available I-O tables often cover industry sectors in a rather aggregated way and do not distinguish between different production lines [
18,
19,
47]. To add more detail, additional data are employed, e.g., by obtaining detailed I-O multipliers for each VC participant. We carried out a survey among the concerned companies, collecting their account current books. For each sub-supplier listed, we identified location and industry type. Double counting was controlled for by removing all intermediate demand sent as internal deliveries within the VC. Typically, this concerned raw or processed forest products. Moreover, the optimization model considers transported volumes and, hence, transportation costs as decision variables. This means that one production input factor is treated as endogenous, which is in conflict with the standard fixed input coefficient assumption for I-O models. For that reason, all intermediate demand for timber transport services was excluded and, instead, treated as an independent part of the wood VC. Adjusting the intermediate demand this way significantly reduces input volumes. For example, particle board production is left with only 28% of the initial intermediate demand, while sawmills are left with 50% and paper production with 68%.
With these adjustments, we obtained vectors
describing the intermediate demand of company
c from industry
i with geographical scope
r (regional or national). Then, using the relations in Equations (
4)–(
6), national and regional type I output, value-added and adjusted value-added multipliers
,
and
were estimated as shown in
Table 2. The survey data indicated that for harbours in the region only one tenth of the output was related to forestry products and we reduced the obtained multipliers accordingly. No survey data were available for timber transporters and paper producers. For these, we estimated multipliers from the comparable industries land and air transport and paper production, respectively.
Output multipliers
and value added multipliers
are a common way to present multipliers from I-O models. Using Finnish data, Rimmler et al. [
19] obtain national type I output multipliers of
for sawmilling industries and
for market pulp, paper and paper board manufacturing. For Norway, Lindberg et al. [
48] show type II output multipliers for forestry and logging of
. As
Table 2 indicates, we obtained lower multiplier estimates,
for timber logging,
for sawmilling and
for paper production. However, our calculations do not include induced effects. Moreover, for sawmilling and paper production, we excluded two large inputs, forest products and transportation services, such that the values are not directly comparable. Studying rural Scotland, Psaltopoulos and Thomson [
17] calculated regional type I output multipliers
of
and
for timber processing and paper and board production, respectively. Our corresponding multipliers are of similar magnitude with a somewhat higher value for timber producers,
, while paper production has a lower multiplier,
. Several reasons for these differences are conceivable. The multipliers refer to different economies with, obviously, different traditions and industry structures such as prevalence of larger or smaller company sizes or local business relations.
5. Results and Discussion
We will now discuss results of applying the generalized optimization model to the case described above. First, we assess the model’s validity by way of statistical data for a given year. Next, we consider a longer time horizon and optimize from different perspectives and, hence, under different objective functions. We explore investments, resource utilization, value creation and VC profitability. Taking a step further, we then investigate effects of balancing between VC profits and national or regional value creation, reflecting, partly, conflicting interests of politics and industry.
5.1. Calibration and Reality Test of the MILP Model
The case described in
Section 4 depicts the current forest industry structure in two northern Norwegian counties, comprising all major VC actors with their current production capacities and demands. Optimizing VC profits yields optimal flows in a centrally coordinated VC—obviously, this represents an idealistic situation. However, to compare to reality and to calibrate parameters we did not obtain realistic values for, we run the optimization model without allowing for investments and fixing logging decisions to values obtained from statistics [
49]. For the year 2014, the statistics report a total of
billion m
timber logged in the region’s municipalities, which accounts to about half of the considered production capacity. Timber export from the region is, currently, rather negligible, and we presume that the remaining timber volume required for production had been imported from outside the region (mostly mid-Norway and Sweden).
According to public statistics for the year 2014 [
23], the forestry sector in the considered region generated a gross value added
(for the whole VC) of
billion NOK. The model run estimated national and regional gross value added REs to
and
billion NOK, respectively. With expression (
4) for
, an average regional value-added multiplier for the whole VC can then be determined as
. Taking into account that our model simplifies real world complexity, this value is comparable to the regional
estimated in
Table 2, affirming that the mathematical optimization model replicates statistical data for the region reasonably good.
5.2. Optimizing from Several Perspectives
We consider now a longer time horizon and investigate which effect different perspectives have on investments and operations in the value chain. In particular, we are interested in profits and REs generated in the value chain, decisions to invest in one or several sawmills and how much of local resources is used. We optimize from the point of view of the industry and forest owners, maximizing total VC profits (model run 1), of a national or regional government, maximizing, respectively, national or regional REs only (model runs 3 and 4) and a combination of VC profits and national or regional REs with equal weights (model runs 4 and 5). Main results are gathered in
Table 3.
Model run 1, maximizing VC profits, reflects the traditional approach in VC optimization and we consider it as the benchmark in the following discussion. In this case, the VC is profitable with a maximum achievable total profit of 992 million USD for all companies and all forest owners combined. About of this sum is profit of regional companies, that of regional forest owners, and the remaining that of other forest owners. It is optimal to invest in two of the 15 potential sawmills. Although they both will have a negative profit, they will contribute positively to total VC profits: For example, a sawmill established in Meløy processes local timber that then can be sold to another local company. Without this sawmill, the raw timber would have been transported to buyers further away at higher transport costs while the local company would have been forced to buy sawn timber from somewhere else. This sawmill is established in all different model runs.
In all model runs, 23 million m
pulpwood are imported from areas just south of the case region, delivered efficiently to large-scale consuming companies in the south of the region. Replacing this volume by pulpwood logged in the case region, with more complex transportation, appears rather unreasonable. The usage of regional forest resources, however, varies with the different objectives. In the benchmark case, just over half of the resources available in the region is used, amounting to
of the total resource usage of
million m
. Focusing on value creation alone (runs 2 and 3), usage of regional forest resources increases to 31 million m
. This corresponds to a regional share of
of all resources used such that
of the regional forest resources are logged. One reason for this rather extreme deforestation is that logging activities have a high multiplier. Logging is the primary (first) activity in our value chain and, consequently, logging intermediates are not adjusted for double accounting. Thus, logging activities will contribute heavily to REs, cf.
Table 2. This leads to the establishment of a large number of sawmills, evenly spread out over the region, to process the large additional amount of timber. Also this activity creates ripple effects. However, this perspective by and large disregards (value chain) profitability. Moreover, while VC profit maximization takes into account both revenues and costs, REs are based only on revenues (value creation), resulting in distortions towards production. Consequently, many regional forest owners would face financial losses—even the profit of all forest owners in the region combined is negative. Also most sawmills produce with a deficit. Likewise, of the nine companies originally in the VC, two cease to produce while two plants end up with negative profits. Forest owners outside the region are not affected by the sector restructuring, their share of the total value chain profit soars to about 70%. Despite a gain of nearly 450 million USD in national REs and about 180 million USD in regional REs, the extensive change in industry structure leads to a value chain profit of less than half of that in the benchmark case.
Taking a more realistic point of view and compromising between the two extreme perspectives, model runs 4 and 5 maximize a combination between VC profits and REs with equal weights. As expected, the results strike a balance between the previous findings, although most considered values are closer to the benchmark run (VC profit maximization). Both regional share of forest resources and total resource usage resemble that of the industry-focused benchmark case with a more moderate logging policy. Likewise, profits earned and REs generated by the various groups of VC entities are close to those in the benchmark case. Still, also here it is optimal for the whole VC that a few of the 48 forest owners will operate with a deficit over the long run, most likely due to high transportation costs.
These findings raise questions of what may constitute a good balance between regional political and industry interests, how does it affect the actors in the VC and how stable is it with respect to changing priorities or political viewpoints. For example, a shift in focus from VC profit maximization completely over to national RE maximization will lead to a loss of nearly 600 million USD in VC profits while national REs increase by only close to 449 million USD. With a balanced focus (model run 4), VC profits will be only 18 million USD lower while national REs increase by 55 million USD. Consequently, it may even be a wise choise to subsidize some VC actors if this leads to higher combined benefits.
Obviously, central coordination of a value chain purely in order to maximize ripple effects from its activities is an unrealistic assumption. This is also evident when investigating the rather high regional resource usage in this model run: As REs from logging and production accrue with the sale of products, forest owners will sell as much timber and pulpwood as possible. The wood is stored on the companies’ premises as they do not have sufficient production capacity and/or demand to process it. Partly, this excessive logging may also contribute to several forest owners’ and companies’ deficits as it would actually not be profitable to log or buy these volumes. Shifting the focus to VC profits, a more sensible behaviour can be observed: less forest is logged—at different locations—and unused resources are kept at the logging sites. Still, large amounts of pulpwood amass at some sites, mainly due to an imbalance in the studied VC: Sawmills process only timber, but timber logging always causes also a certain share of pulpwood to be produced—which is not matched by demand in the VC to be profitable. Establishing more pulpwood-processing industries may alleviate this inefficiency. Indeed, an according extension of the case, discussed in the next section, shows some effects in this regard.
The above discussion demonstrates that different perspectives and interests may affect industry structure and flows in the value chain differently. It may, hence, be interesting to investigate whether there would exist a well-balanced prioritization of, e.g., business and regional policy interests and which impacts it may have on resource usage and other indicators.
5.3. Finding a Trade-Off between Political and Industry Interests: Pareto Curves
Evidently, increasing REs leads to considerably lower VC profit, suggesting the existence of an unfavourable trade-off. We investigate this more systematically by way of Pareto curves, exploring choices between the extreme points discussed in
Section 5.2: The VC profit and RE solutions of model runs 1, 2 and 3 constitute the left and right end points of the graphs, respectively. Intermediate points are determined by maximizing REs achievable under given lower limits on the VC profit, e.g., at least
,
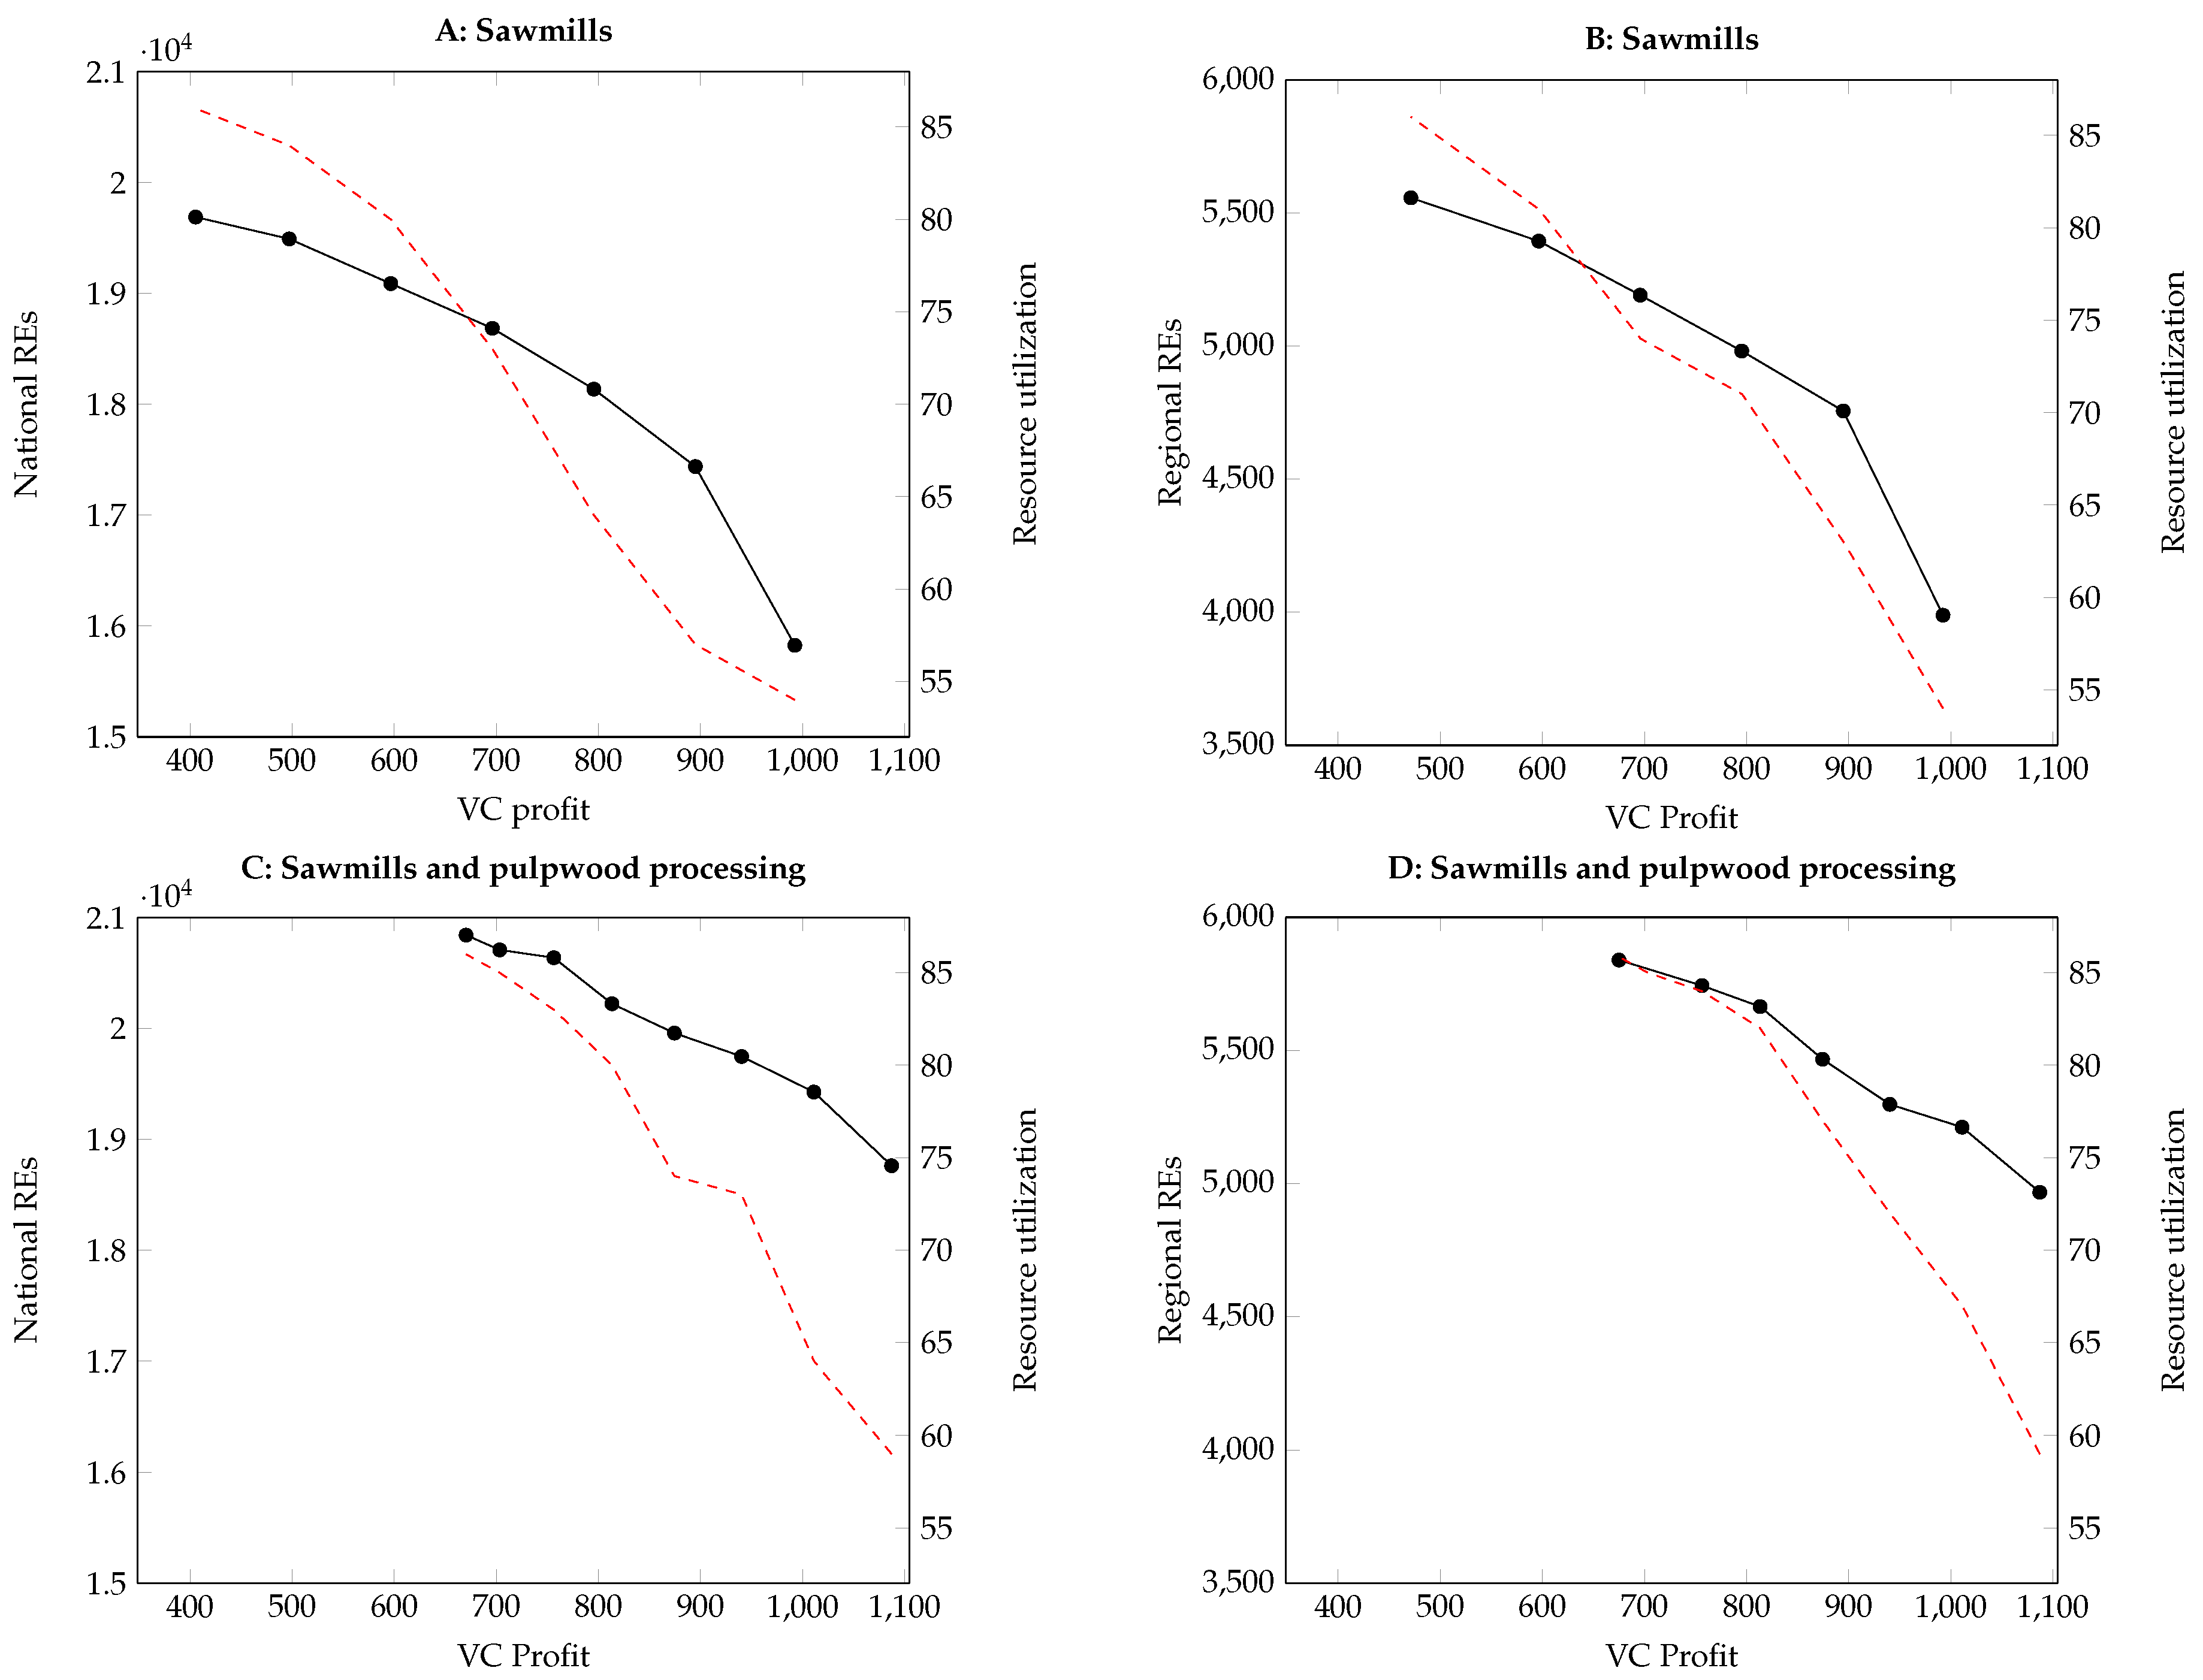
, ... of the value obtained in the benchmark run 1. As secondary information, we also read out the percentage of regional resources harvested. Note that the intermediate points may also be constructed by maximizing VC profits under lower limits on REs, resulting in possibly differently shaped Pareto curves. We have not explored further to which degree this may be the case here.
Figure 4 shows the resulting Pareto curves. Points below the curve are not optimal (it is possible to achieve a higher VC profit with the same REs or vice versa) while points above are infeasible. The upper pair of graphs reflects the previously discussed case study, allowing investments only in sawmills. In this situation, a change of perspective affects the results significantly: Optimizing from an industry point of view, national and regional REs can be achieved which are, respectively,
and
lower than what may be achieved with a socio-economic point of view. Maximizing REs, the corresponding VC profit is even only
and
of the optimal values. In absolute terms, a gain in VC profit by far outweighs the accompanying loss in REs nearly always. Moving along the graph with increasing lower limits on the VC profit, this imbalance decreases. Only at the national level, gains in VC profits in the last step actually are significantly lower than RE losses. But, contrary to the situation discussed by You et al. [
11], we cannot identify a "good choice" solution, where a significant improvement in one objective is accompanied by a rather small decrease in the optimal value of the other objective.
Extending the case study slightly, we include options to invest in pulpwood-processing industry. Evidently, this leads to a more robust industry structure with more diverse activities and products, resulting in higher VC profits and REs. The diversity increases robustness of the results with respect to a change in optimization perspective: optimizing VC profits, we obtain national and regional REs which are only and , respectively, below maximally achievable values. Vice versa, VC profits achieved for RE maximization are about of the optimal value. This smaller range means that a shift in perspective affects solutions less severely. There is a less pronounced pattern for the trade-off between VC profits and REs throughout the value range but gains in VC profit clearly outweigh losses in REs. Also here, a “good choice” solution is not clearly discernible.
While extra-regional resource usage did not change compared to the previous case study, regional resources are now used more efficiently—as may be expected. This is evidenced by higher VC profits and REs achieved with the same resource utilization. Obviously, this gain stems from the additional capacity to process pulpwood which was put aside in the former case and to sell the resulting products. Hence, both activities across the value chain and the chain’s profitability increased. Generally, it appears counterintuitive that increasing VC profit requirements are connected with lower resource usage. However, recall that these points in the Pareto curves are constructed with RE maximization in mind. As discussed in
Section 5.2, logging activities have rather high value-added multipliers and, thus, contribute heavily to REs. Consequently, higher REs are accompanied by increased logging activity although the logged resources may not be used profitably.
6. Conclusions
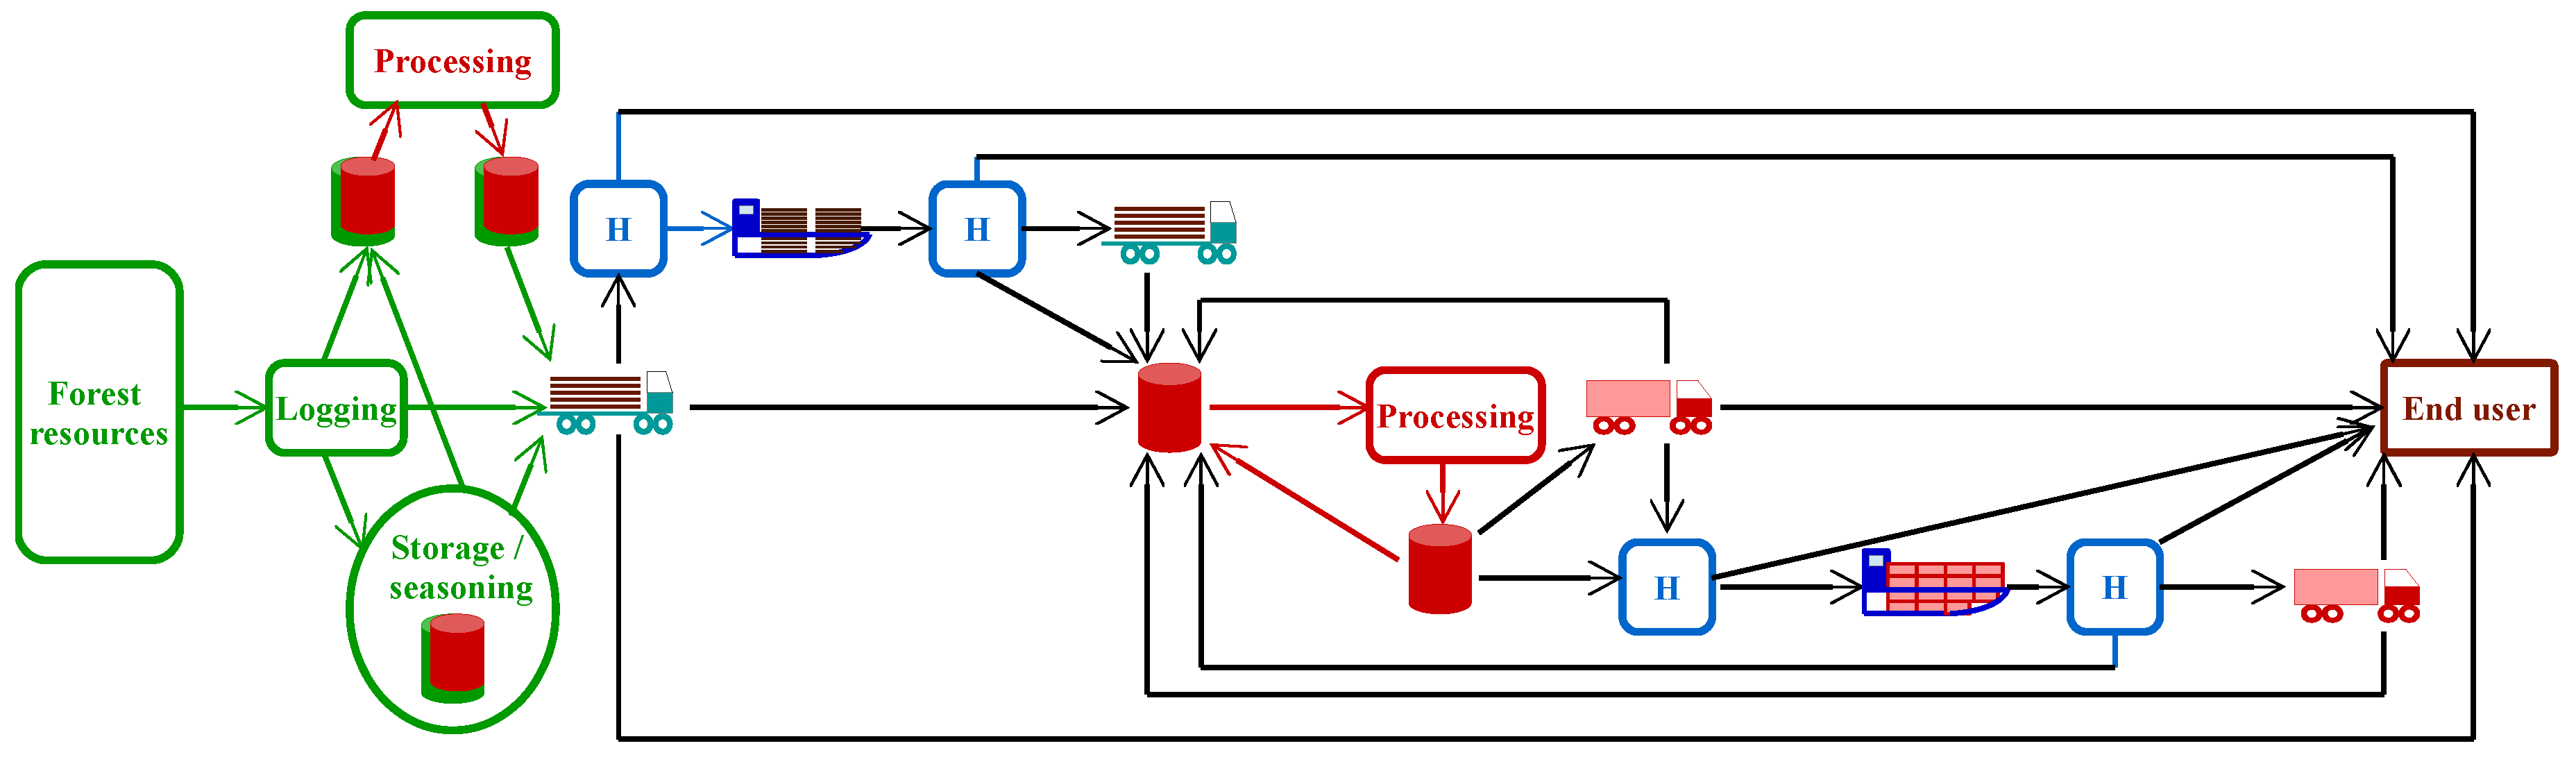
As a result of past decades of extensive afforestation, mature forest volumes in Norway are increasing. National forestry politics call for sustainable and efficient resource usage and increased regional processing. Regional policies seek to provide good conditions for such industries to be competitive and to improve regional value creation. Against this background, we developed a dynamic optimization model combining VC activities and aspects of regional macro-economics. The model considers the forestry VC from logging to processing to sales to end-user customers. With a strategic-tactical perspective, it helps to find optimal decisions to invest or disinvest in processing facilities and technologies, both spatially and temporally. Aggregating VC flows over larger time periods, it can also give advice on optimal logging locations and volumes, transportation and storage choices or processing. In addition, requirements such as evenly distributed logging can be taken into account. We derive regional and national output and value-added multipliers from statistics (I-O tables) complemented by survey data. This allows us to take into account ripple effects on the economy from the VC activities, either through inclusion in the model’s objective function, hence optimizing REs alone or in combination with VC profits, or through post-optimization calculations.
The model development provided new insights about integrating operations research and regional macro-economics methodology in a common modelling framework, in particular, about the creation of finer-detailed regional I-O multipliers using a combination of statistical and survey data and their application in an optimization context. Evidently, this can be extended to other quantifiable aspects that can be set in a relation to VC profits. An obvious next step would be to assess further regional macro-economic indicators such as employment multipliers or to expand the existing multipliers with income effects. Other conceivable aspects may concern a stronger inclusion of environmental considerations and sustainability (e.g., biodiversity, recreational or other values of forests), forest protection or selective logging. This sets up diverse business, political and public interests and prioritizations against each other and assesses their effects on regional development.
We apply the model to a realistic case study motivated by the interests of our partners from industry and government, investigating options for industry development. For a region in northern Norway, we examine how different focus on VC profits or REs may affect the usage of regional forest resources and the VC structure and flows. Assessing the trade-off between VC profit (industry focus) and REs (political or society focus) by way of Pareto curves, our analysis indicates an imbalance in that an increase of VC profit is accompanied by an incomparably higher loss of REs. Extending the case study to allow for a broader variety of activities to be established, we see this imbalance vanishing somewhat with a more robust industry structure. Still, a universally good choice can hardly be found. Moreover, also in the second, more balanced case, changes in perspective affect VC profits more strongly than REs. This may be a consequence of the current model set-up, following the product flows in the VC while REs are included only via multipliers in the objective function. Future research should, hence, be concerned with an even tighter integration of both methodologies, beyond the mere inclusion of more macro-economic aspects.
Today, a wide range of instruments is already in place for forest owners and businesses, such as incentives to plant and harvest more timber, transport subsidies or investment grants [
2]. We did not test the sensitivity of case study results with respect to cost parameters affected by such policy instruments. For example, transport or other subsidies may lead to increased use of regional timber and increased REs while compensating for VC profit losses. Although an optimization model may help to assess effects of such instruments and thus contribute to a sound decision basis, the ultimate choice and application of instruments is a question of political prioritization. The abundance of policy instruments should motivate authorities to use them efficiently to stimulate regional resource usage and the industry’s contributions to society regionally and nationally without sacrificing profitability.
Our work assumes central VC coordination, which presupposes collaboration between the single entities, thus delivering the best results which can be attained from an overall perspective. The case study indicates that some companies may be required to operate with a deficit, enabling more efficient companies to accrue higher profits, leading to a higher total VC profit. Obviously, this is not a realistic solution. A natural extension would, therefore, be to explore the purposeful application of governmental instruments stimulating regional industry development. This may imply subsidies to establish a more robust and interconnected sector in the region or other incentives to stimulate collaboration. With respect to the latter, it may prove valuable to extend the evaluation framework with methods from social sciences such as network analysis. This aids identifying relations and information flow between important entities within and outside the wood value chain, thus determining drivers and barriers for adopting good solutions. Aspects other than profitability guiding companies’ decision processes may then be included—in particular, companies with strong local ties or in small communities may also be inclined to consider, e.g., the social benefits of their operations. In a longer-term research perspective, it may also be interesting to investigate the inclusion of equilibrium modelling approaches reflecting the VC participants’ independent decision processes or how uncertainty about future political prioritizations may be considered.


