Site- and Species-Specific Influences on Sub-Alpine Conifer Growth in Mt. Rainier National Park, USA
by
 ,
,
Myesa Legendre-Fixx
1, 
Leander D. L. Anderegg
1,2,
Ailene K. Ettinger
3,4 and
Janneke HilleRisLambers
1,* 1
Department of Biology, University of Washington, Seattle, WA 98195, USA
2
Carnegie Institution for Science, Global Ecology, Stanford, CA 94305, USA
3
Arnold Arboretum of Harvard University, Boston, MA 02130, USA
4
Department of Biology, Tufts University, Medford, MA 02155, USA
*
Author to whom correspondence should be addressed.
Forests 2018, 9(1), 1; https://doi.org/10.3390/f9010001
Submission received: 2 October 2017
/
Revised: 15 December 2017
/
Accepted: 18 December 2017
/
Published: 22 December 2017
(This article belongs to the Special Issue Treeline Ecotone Dynamics)
Abstract
:Identifying the factors that influence the climate sensitivity of treeline species is critical to understanding carbon sequestration, forest dynamics, and conservation in high elevation forest/meadow ecotones. Using tree cores from four sub-alpine conifer species collected from three sides of Mt. Rainier, WA, USA, we investigated the influences of species identity and sites with different local climates on radial growth–climate relationships. We created chronologies for each species at each site, determined influential plant-relevant annual and seasonal climatic variables influencing growth, and investigated how the strength of climate sensitivity varied across species and location. Overall, similar climate variables constrained growth on all three sides of the mountain for each of the four study species. Summer warmth positively influenced radial growth, whereas snow, spring warmth, previous summer warmth, and spring humidity negatively influenced growth. We discovered only a few subtle differences in the climate sensitivity of co-occurring species at the same site and between the same species at different sites in pairwise comparisons. A model including species by climate interactions provided the best balance between parsimony and fit, but did not lead to substantially greater predictive power relative to a model without site or species interactions. Our results imply that at treeline in moist temperate regions like Mt. Rainier, the same climatic variables drive annual variation in growth across species and locations, despite species differences in physiology and site differences in mean climates.
1. Introduction
Climate change is expected to affect alpine and sub-alpine areas [1,2,3,4] and forecasting changes to these areas is critical for natural resource management and conservation. On a warming planet where multiple aspects of climate are changing [5], climate sensitivities that differ among sub-alpine tree species could result in differing growth responses. Since sub-alpine trees set the important forest/meadow ecotone at high elevations [4], the drivers of variability in climate–growth responses of sub-alpine tree species may therefore have particular significance for ecosystem function, resource management and conservation (e.g., the amount of carbon stored in trees, the upslope movement of treeline, conversion of alpine habitat to forests). For example, high mountain meadows are species rich (e.g., [6,7]), and—due to their isolation from each other, and the shape of mountains—are likely to decrease in area if sub-alpine tree growth increases greatly with climate warming. This may have negative consequences for the plants and animals associated with high mountain meadows. Additionally, larger scale ecosystem functions may be strongly influenced by the position of treeline, especially in the Pacific Northwest, where forests hold large amounts of carbon [8]. Finally, high mountain meadows in parks receive high recreational visitation, thus, changes to the extent of and diversity in mountain meadows could have impacts on the experience of visitors to protected natural areas [9]. In short, understanding the factors that impact climate sensitivity of trees is critical in order to be prepared for future changes at the community or ecosystem level [10,11,12,13].
Ecologists have made a great deal of progress in understanding that sub-alpine trees are often strongly limited by climate, and thus, that treeline is likely to respond to warming [11,13,14]. However, much work remains to be done to understand how treeline responses might vary locally (i.e., different sides of a mountain) and across species [15], the scales at which conservation and resource management occur. Even though it is common for treeline to be dominated by more than one species, studies often focus on how climate sensitivity of an individual species varies across vast regions with different macroclimates [11,16,17,18,19,20,21]. Studies like these have shown synchrony within a climatic zone and significant differences in influential climate variables and climate sensitivity across climatic zones [11,16,17,18,19,20,21,22,23,24].
Fewer studies examine the radial growth climate sensitivity of multiple species at different locations. Most studies that explicitly compare species responses tend to focus on a single site [25,26,27] or species that don’t directly co-occur [28]. Those studies that do consider species differences at multiple sites have found conflicting results. For two climatically different sub-alpine regions, Nakawatase and Peterson reported that tree growth in the wetter region was limited by growing degree days, whereas in the drier region soil moisture limited growth [29]. In contrast, Deck et al. found that co-occuring conifers across two regions responded to the same most influential variable [30]. Peterson and Peterson also reported consistency between the identities of the influential climate variables across locations with different aspect, and that species identity has a greater influence on climate sensitivity than site [31]. Conversely, Liang et al. concluded that topography had a greater effect on climate sensitivity than species identity [32]. They found that topography influenced the climate variables to which tree species responded, and concluded that species physiology influenced the strength of sensitivity to a particular climate variable [32]. In all, these studies demonstrate that climatic zones can generate different climate sensitivities, but do not tell us at what spatial scale these differences in radial growth sensitivity for a single species arise. Similarly, although it is clear species identity can influence climate sensitivity, it is not clear if species-driven differences in climate sensitivity become more or less pronounced under certain climatic conditions. Since managed forest areas (e.g., national parks) do not extend across continents (and therefore usually do not encompass large changes in climate), it is imperative to understand the factors that influence climate sensitivity at a local level.
In this study, we explored two potential drivers of variation in radial growth climate sensitivity of sub-alpine trees—site influences and species identity—at a local scale. We characterized site differences as the differences in long-term mean climate at the scale of our collection sites in Washington, USA. Specifically, we assessed (A) whether the identity of climate variables constraining growth and the strength of their effects differed by site; (B) whether the identity of climate variables constraining growth and the strength of their effects differed by species; and (C) whether there were site by species interactions in climate sensitivity. We did so by collecting tree cores from the four dominant conifer species forming treeline at three broad locations in Mt. Rainier National Park (Figure 1). Each of our sampling locations was on a different side of Mt. Rainier, and therefore experienced different mean climates (Figure 2). We hypothesized that all trees would be sensitive to similar climate variables, but that both species identity and location (site climatic context) would affect the magnitude of growth sensitivity to climate. Our results demonstrate that tree growth of our four focal high elevation conifers on all three sides of the mountain responded to similar climate variables, and that climate sensitivities for each climate variable—regardless of the species or site—were similar in magnitude, with a few minor exceptions. Our results imply that at treeline in moist temperate regions (like Mt. Rainier), neither species identity nor mean climatic conditions has a major influence on high elevation conifer climate sensitivity.
2. Materials and Methods
2.1. Study Site and Species
Tree cores were collected in Mt. Rainier National Park, WA, USA. The climate is temperate maritime with dry summers, and heavy winter precipitation. Mt. Rainier National Park is an ideal study system for examining climate–tree growth relationships. Since its establishment in 1899, the forests and alpine ecosystems have been relatively undisturbed by human influences. Additionally, the different sides of Mt. Rainier experience different local climates. The south side has the most snowfall, the northwest side receives the most growing season rainfall, and the east side of the mountain is the driest, according to 30 year PRISM (Parameter-elevation Regressions on Independent Slopes Model) climate averages [33] downscaled using the ClimateWNA downscaling algorithm [34] (Figure 2).
At high elevation treeline, dominant tree species are Abies amabilis Douglas ex J Forbes (Pacific silver fir), Tsuga mertensiana (Bong.) Carriere (mountain hemlock), Callitropsis nootkatensis (D. Don) Oerst. ex D.P. Little (Alaska yellow cedar), and Abies lasiocarpa (Hook.) Nutt. (sub-alpine fir). Tree cores were collected from all four dominant tree species at three high-elevation sites on the three climatically different sides of Mt. Rainier (Figure 1).
2.2. Tree Growth Data
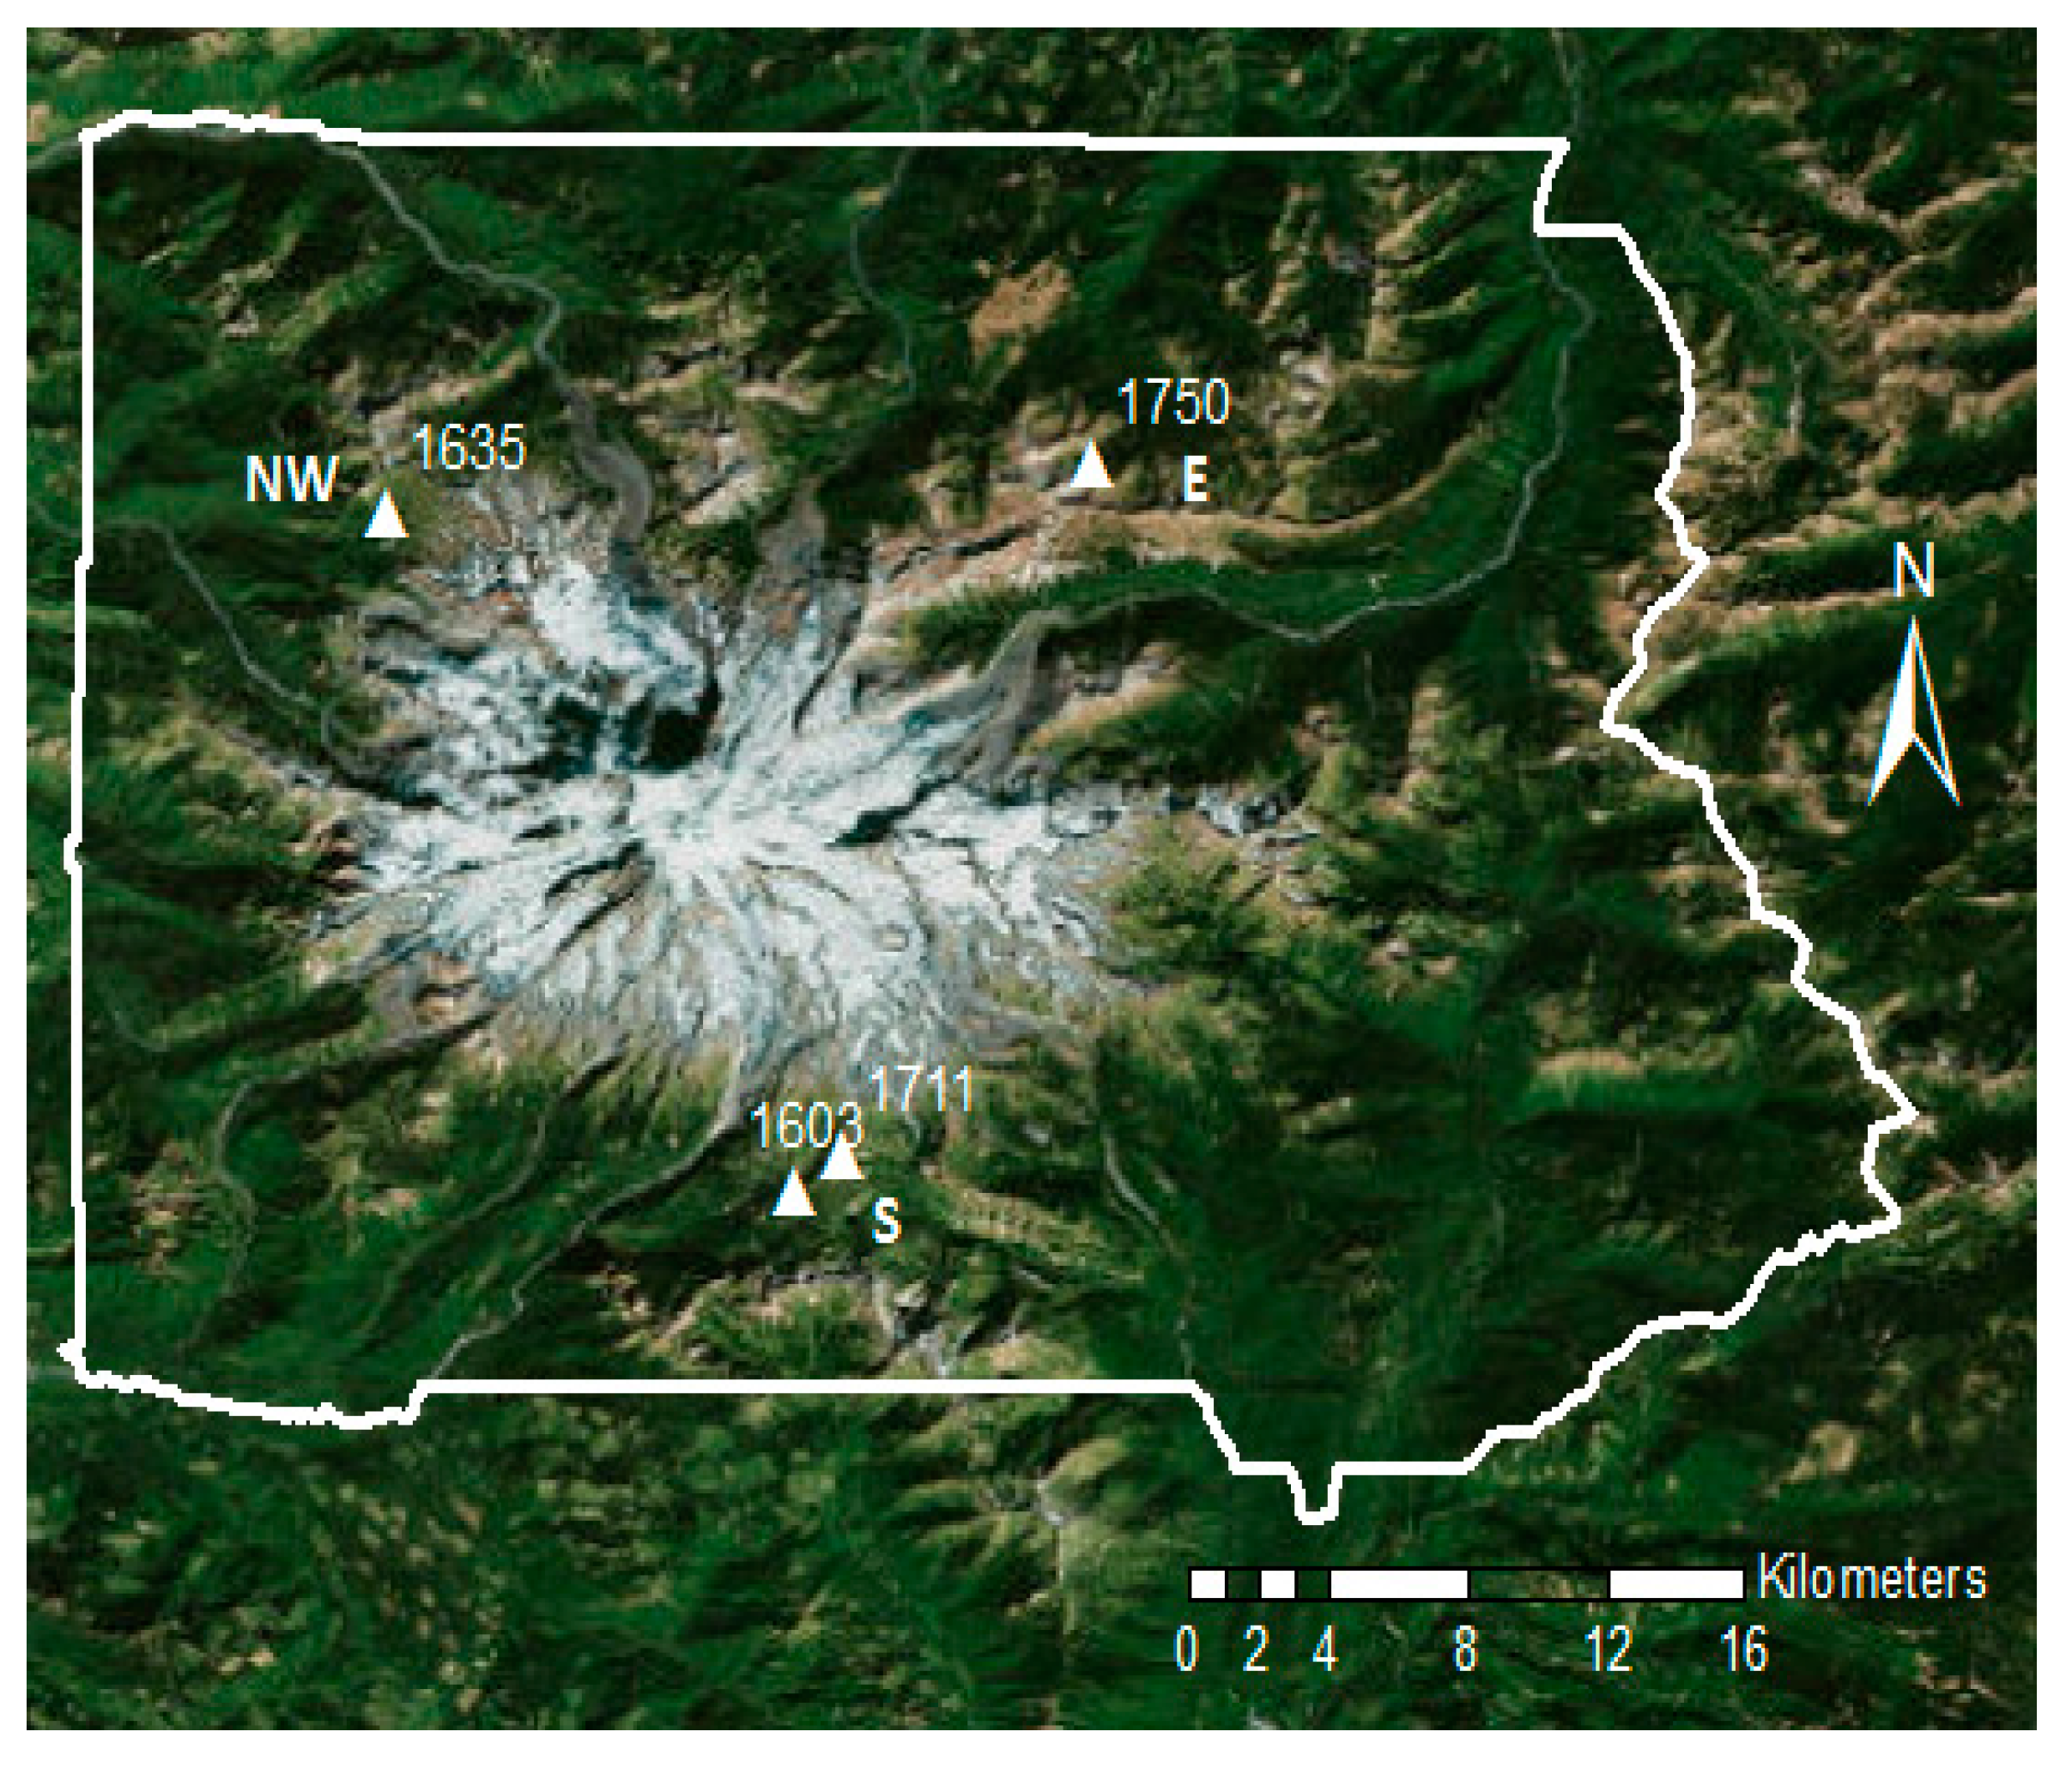
Up to 20 mature, canopy dominant individuals of A. amabilis, T. mertensiana and C. nootkatensis were sampled from three high elevation locations that are the sites of long-term forest demographic monitoring [35]. Trees cores were collected within an approximately 1 hectare (100 m × 100 m) area, with individuals of the same species located at least 20 m apart from each other. These sites were established in 2010, and described in a recent publication on seedling recruitment [35]. One site was also described in two recent publications about growth–climate sensitivities [36,37]. These sites are located at elevations of 1603 m (south), 1635 m (northwest), and 1750 m a.s.l. (east) (Figure 1). The canopy density was similar across sites; all locations were mature, closed canopy forests (e.g., Figure 3a). The average size of trees cored was 60.54 cm diameter at breast height (range: 30.5–117 cm DBH). Cored trees were selected to capture the approximate size distribution of dominant, mature trees at the plot to obtain the mean growth response of a typical canopy tree, and were situated away from any detectible topographic features (e.g., drainages). These trees, which were cored during 2009–2013, were resampled in 2016 to extend the chronologies until 2015. This allowed us to include growth from the years with the latest (2011) and earliest (2015) snowmelt dates on record.
Sampling for A. lasiocarpa deviated slightly from that of the other species. A. lasiocarpa, unlike the other three species, is extremely shade-intolerant and only rarely grows in moderate to closed canopy forests in Mt. Rainier National Park (ML pers. obs.) [38]. Therefore, A. lasiocarpa was sampled in the open areas adjacent to the closed canopy forest site on the northwest side (Figure 3b) and sampled within and adjacent to the closed canopy forest site on the east side in 2016. A. lasiocarpa trees sampled at these two sites ranged from 39.0 cm to 86.3 cm diameter at breast height. On the south side, A. lasiocarpa was sampled at a site 1.3 km away from the permanent stand (1711 m a.s.l. elevation) (Figure 1) in 2012. These trees ranged from 28.2 cm to 41.5 cm diameter at breast height. Trees from all focal species cored are near the upper range limits of the study species. For all species, at least two cores per individual were collected from opposite sides of the tree perpendicular to the aspect. See Table A1 in Appendix A for number (n) of trees sampled for each species.
Increment cores were dried, mounted, sanded with progressively finer grits of sandpaper (according to standard protocol [39]), and scanned. The program Windendro (Version 2009b; WinDENDRO 2009, Regent Instruments Inc., Quebec, QC, Canada) was used to measure annual growth rings to 0.001 mm [40]. Visual crossdating was performed in Windendro, and COFECHA (Version 6.06P, Laboratory of Tree-Ring Research, Tucson, AZ, USA) [41] was used to verify and to determine the quality of the crossdating [42] for all rings formed after 1880.
Once all cores were crossdated, a mean chronology was created for each tree by averaging the ring widths from all cores taken from the same tree using Windendro [40]. Before detrending, the chronologies were shortened to 1880 (the date up to which the chronologies had been crossdated). The chronologies were detrended with a 67-year spline (to reduce age and forest dynamics effects on growth—growth suppression or release patterns related to the competitive environment, not climatic fluctuations) and then pre-whitened using an AR1 autocorrelation model (to remove autocorrelation effects on growth) using dplR (Version 1.6.5, R Foundation for Statistical Computing, Vienna, Austria) [43]. Then, master chronologies for each species at each site were created from the tree chronologies using the Tukey’s biweight robust mean function in R (R. version 3.3.2, R Foundation for Statistical Computing: Vienna, Austria) [44]. Master chronologies were later shortened to the same length as the climate data available (1901 to year of most recent ring).
2.3. Climate Data
Our study required site-specific climate data, since climatic conditions in montane ecosystems can change substantially at scales of a few hundreds of meters in elevation [45,46]. In Mt. Rainier National Park, there is only one long-term high elevation weather station (the Paradise meteorological station, on the south side of the mountain). Fortunately, ClimateWNA can provide localized climate estimates using partial derivative functions of climatic change along elevational gradients, thereby providing high-resolution climate data for mountainous terrain [34]. ClimateWNA also provides biologically relevant climate variables using monthly climate data [34]. Monthly temperature and precipitation anomalies are used to adjust the interpolated baseline data obtained from PRISM [47] for a chosen location [34]. All downscaling algorithms are evaluated against the observations from 3353 weather stations across Western North America [34]. ClimateWNA provides monthly climate variables from the CRU TS 2.1 0.5 degree gridded historical dataset, interpolated using the PRISM 2.5 arcminute climate normal and a scale-free downscaling technique [34]. While ClimateWNA is a gridded product that may contain errors and biases, our hope was that the interpolation algorithm would serve as the ‘best guess’ for the climate of the specific site. We believe that this algorithm largely maintains similar interannual anomalies in temperature and precipitation across sites (once variables were z-score standardized), and provides the best possible estimate for derived variables such as precipitation as snow and growing degree days that have nonlinear relationships with temperature and precipitation lapse rates. Both the absolute magnitude and interannual variability of precipitation and temperature variables from climateWNA compare favorably to station observations from the Paradise meteorological station, corrected to the location of the long-term forest demography site on the south side, which is the closest to the station (see Ettinger et al., 2011). This suggests that climateWNA, while not perfect, captures interannual climate variability without major biases (See Figure A1 in Appendix A).
Climate data were obtained for the mean latitude, longitude and elevation of each master chronology of a species at each site based on the coordinates of individual trees from ClimateWNA (Version 5.40, University of British Columbia, BC, Canada) [48]. For GPS coordinates where an elevation was not recorded, elevation was determined from latitude and longitude using Geoplaner (Version 2.7, München, Germany) (height accuracy of 6 m and horizontal resolution of 30 m) [49]. Therefore, every species at each site had its own time series of climate variables, although climate time series for trees at the same site were quite similar.
2.4. Climate Variable Selection, Model Selection and Statistical Analyses
We first used simple univariate climate correlations with growth anomaly and our biological knowledge of the system to identify relevant climate variables for further analysis. The strongest univariate correlations with monthly variables given by ClimateWNA [48] using the response and correlation function analysis in the R program treeclim (Version 2.0.0, R Foundation for Statistical Computing, Vienna, Austria) [50] helped guide our choices of annual and seasonal variables for quantifying growth sensitivity of our focal species to climate. Variables were tested for the previous May to the current October. Previous studies have indicated that snow negatively impacts and warmth positively impacts the growth of high elevation conifers [17,18,31,36,37]. Rather than test only these climatic variables, our procedure enabled us to identify additional variables that might have unexpected yet significant influences on growth.
From the univariate correlations from treeclim [50], six main categories of annual and seasonal variables emerged as potential explanatory variables of tree growth: summer warmth (June–August), summer moisture/drought variables (June–August), spring warmth (March–May), snow (precipitation as snow = previous August-current July, winter precipitation = previous December-current February), spring humidity (March–May), and previous summer warmth (previous June–previous August). Rather than using general temperature and precipitation summaries (e.g., mean annual temperature, total precipitation) as explanatory variables, we chose to examine the effects of plant-relevant climate variables from each of these categories to more accurately model the complexities of climate responses [19]. Timeseries of these variables for our sampling sites were obtained from ClimateWNA [48]. We used our biological knowledge of the study system to pick one explanatory variable from a suite of potential explanatory variables that were highly correlated. From our univariate correlations, we found that spring and summer Hargreaves reference evaporation (a simple estimate of potential evapotranspiration [51]) and climate moisture deficit in the current growing season had a positive influence on growth. These drought stress metrics were highly correlated with temperature variables (e.g., 0.76 correlation between summer growing degree days and summer Hargreaves reference evaporation from east side A. amabilis climate dataset). We therefore assumed that these positive correlations between drought and growth (i.e., more growth in drier years) instead reflect effects of summer warmth on growth. Therefore, we selected growing degree days (degree days above 5 °C) to quantify summer warmth and did not include any additional summer moisture/drought variables in models to avoid including correlated explanatory variables. For spring warmth, we chose growing degree days (degree days above 5 °C) because they are more plant-relevant than freezing degree days (degree days below 0 °C). On Mt. Rainier, precipitation as snow is more biologically relevant than winter precipitation because, in the sub-alpine, snow falls in seasons other than winter. Metrics for spring humidity and previous summer warmth were relative humidity and growing degree days, respectively. Because we had found no evidence of interactions among climate variables for three of our focal species (A. amabilis, T. mertensiana, C. nootkatensis) at the high elevation site on the south side of Mt. Rainier [36], we included only additive effects in our model of RWI (ring width indices).
Our final equation for testing climate sensitivity was:
(sm = summer, sp = spring, prev = previous, GDD = growing degree days, PAS = precipitation as snow, RH = relative humidity). To avoid violating the assumption of independence, none of the explanatory variables we included in the final model were highly correlated (r < 0.55).
RWI = sm_GDD + sp_GDD + PAS + prev_sm_GDD + sp_RH
We tested the relative importance of these five climate variables by fitting the above model and all possible nested models for each species at each site, ranking models by their AIC-weight and assessing the variable importance (proportion of top models including the variable) of each climate factor based on the top models that cumulatively accounted for 95% of the AIC-weight for every focal species at each site (Table 1). Nested models were fit and variable importances assessed using the MuMIn package (R Foundation for Statistical Computing: Vienna, Austria Version 1.15.6) in R [52].
To quantify growth sensitivity to climate, we then fit Equation (1) to each species at every site. We standardized climate variables with the z-score standardization method for each species at a site, before including them as explanatory variables for RWI values. Thus, the slope value given by the regression for a particular climate variable is analogous to the coefficient of growth sensitivity for that species to that climate variable. Since climate data was standardized, the effects of different climate variables on tree growth can therefore be directly compared. These individual models for each species and site were used for computing the climate sensitivities and confidence intervals reported in the figures.
To test for significant differences in sensitivity between co-occuring species at each site, we modified Equation (1) to include interactions between climate variables and species identity, and fit three separate models, one per site. Specifically, we asked whether climate effects on growth for one species differed from those of all other species at the site (i.e., climate by species interactions—at α = 0.05). From our previous studies in this study system, A. amabilis has been shown to have the greatest sensitivity to snow out of all of our focal species [36,37]. Thus, we expected A. amabilis to be the most climate-sensitive species in our analysis. Therefore, we set A. amabilis as the intercept for all site models, and used model contrasts (based on t-distributions) to test for significant differences between A. amabilis sensitivity and the climate sensitivity of the three other species. Our rationale was that if the most sensitive species did not show significant differences in climate sensitivity from the three other species, then it was unlikely that the other three species differed from each other.
We then modified Equation (1) to include a site interaction and fit the model to all data from each species (1 model for each of the four study species) to test whether climate sensitivity for all master chronologies of the same species varied by site. This allowed us to determine whether the same species experienced different sensitivities to climate depending on where it was growing on the mountain. Based on our previous research, we would expect to see the greatest differences between the snowiest site and the rest of the sites, because snow had a strong effect on growth in this study system [36,37]. Thus, using the same rationale as above, we set the south side site as our intercept for site comparisons, and tested for significant differences in site climate sensitivities using contrasts based on t-distributions. While this does not allow us to test all pairwise climate sensitivities between species and sites, we chose these contrasts to pick up the largest differences in sensitivity, which would be of most interest to forecasting and management. We also saw no evidence that additional post-hoc tests were warranted to detect differences between species/sites not included in the model contrasts given the overlap between the confidence intervals of climate sensitivity parameters for almost all species and sites and the results of the final analysis testing the overall importance of species identity and site (see below). Statistics for these comparisons are located in Table A2.
Finally, to determine the relative importance of site and species on overall climate sensitivity of treeline species at Mt. Rainier, four multiple linear regression models were fit to a combined dataset including all data from all species and all sites. The models were compared using AIC-based model selection. The following models were tested: a null model (Equation (2)), a climate-only null model (Equation (3)), a model with species influences (Equation (4)), a model with site influences (Equation (5)), and a model with both species and site influences (Equation (6)).
RWI = 1
RWI = sm_GDD + sp_GDD + PAS + prev_sm_GDD + sp_RH
RWI = sm_GDD*species + sp_GDD*species + PAS*species + prev_sm_GDD*species + sp_RH*species − species
RWI = sm_GDD*site + sp_GDD*site + PAS*site + prev_sm_GDD*site + sp_RH*site − site
RWI = sm_GDD*species*site + sp_GDD*species*site + PAS*species*site + prev_sm_GDD*species*site + sp_RH*species*site − species − site − species:site
3. Results
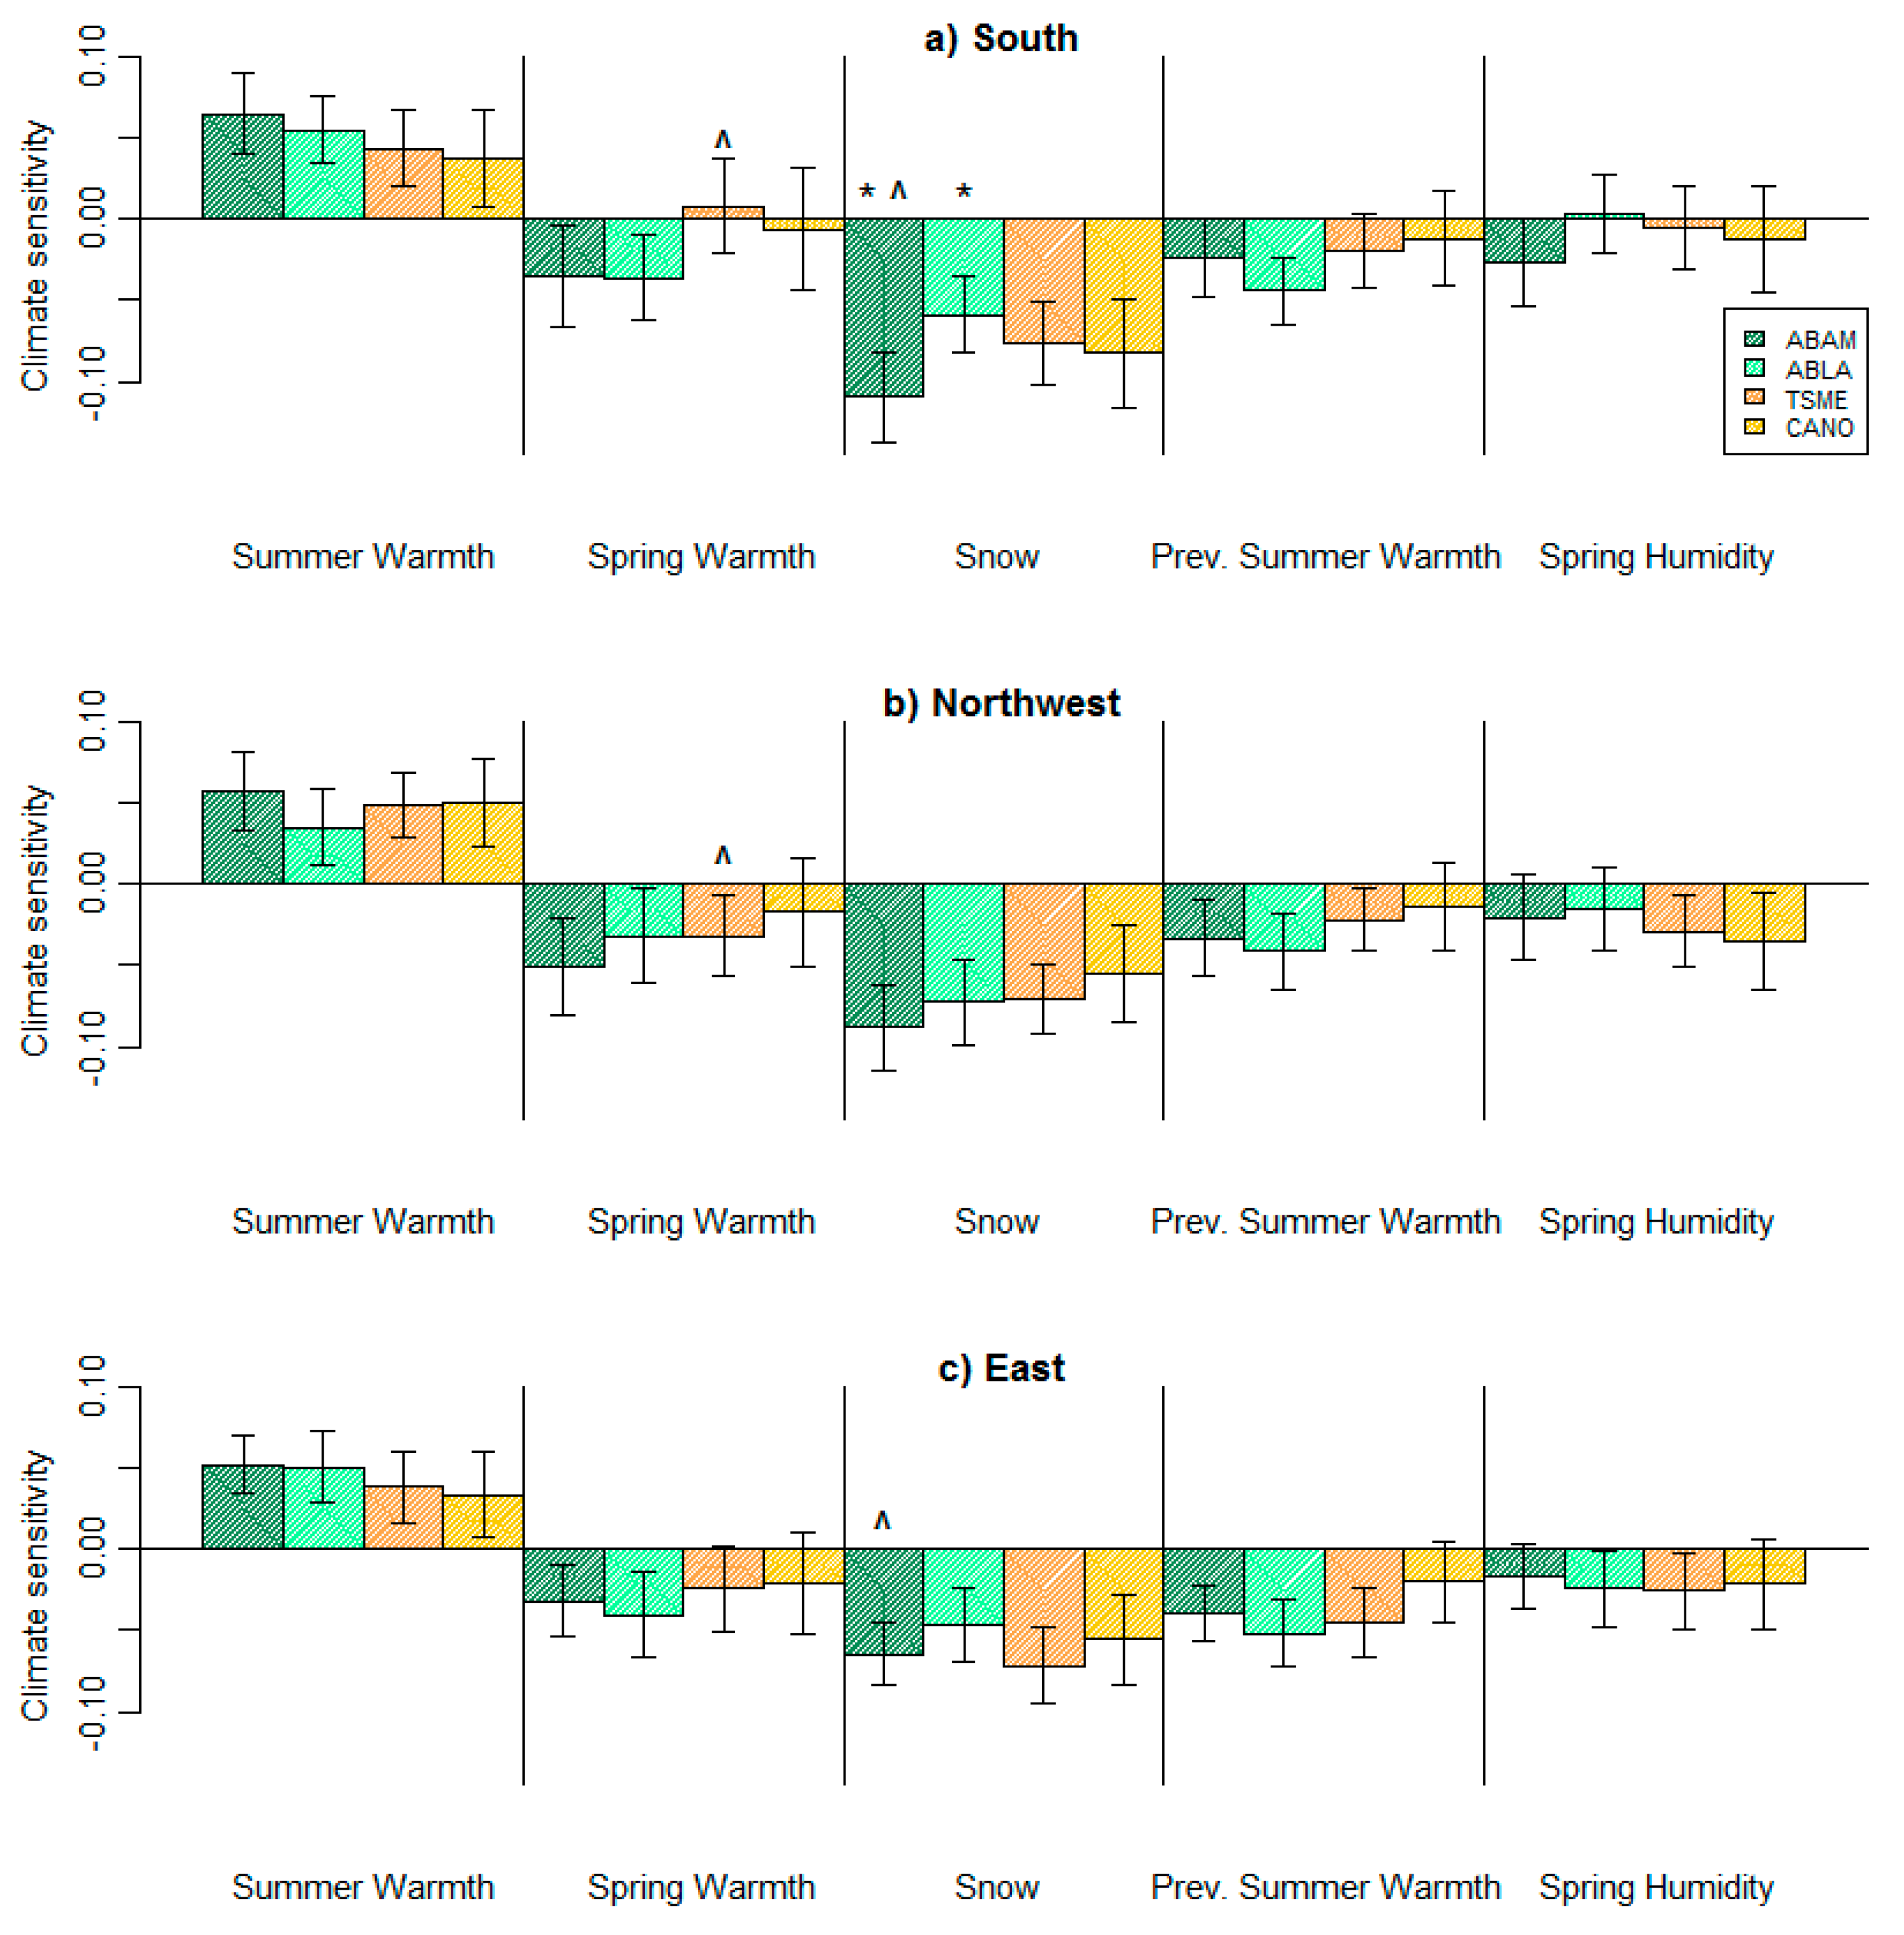
The identity of the climate variables that most strongly influenced radial growth (RWI) did not vary by side of the mountain (Table 1). For all species at all Mt. Rainier locations, tree growth was most strongly influenced by two climatic variables—summer warmth which had positive effects, and snow which had negative effects (Figure 4, Table 1). Sensitivity to spring humidity was small and not significantly different from zero for most species at most sites (Figure 4). Sensitivity to previous summer warmth was non-significant for C. nootkatensis, but the other three species generally responded negatively, with the exception of A. amabilis and T. mertensiana on the south side (Figure 4a). For each site, effects of all climate variables on species growth were in the same direction (i.e., all positive, or all negative), or were not significant (Figure 4).
Overall, the sensitivities of each species did not vary greatly across the three sides of the mountain, and all species at the same site were similarly affected by climatic variables. For example, A. lasiocarpa had a consistent sensitivity to summer warmth, spring warmth, snow, and previous summer warmth at all three sites (Figure 4). Similarly, previous summer warmth did not significantly influence growth of C. nootkatensis (Figure 4), no matter what side of the mountain. On the northwest side and the east side of the mountain, all four species had similar sensitivities to summer warmth and snow (Figure 4b,c).
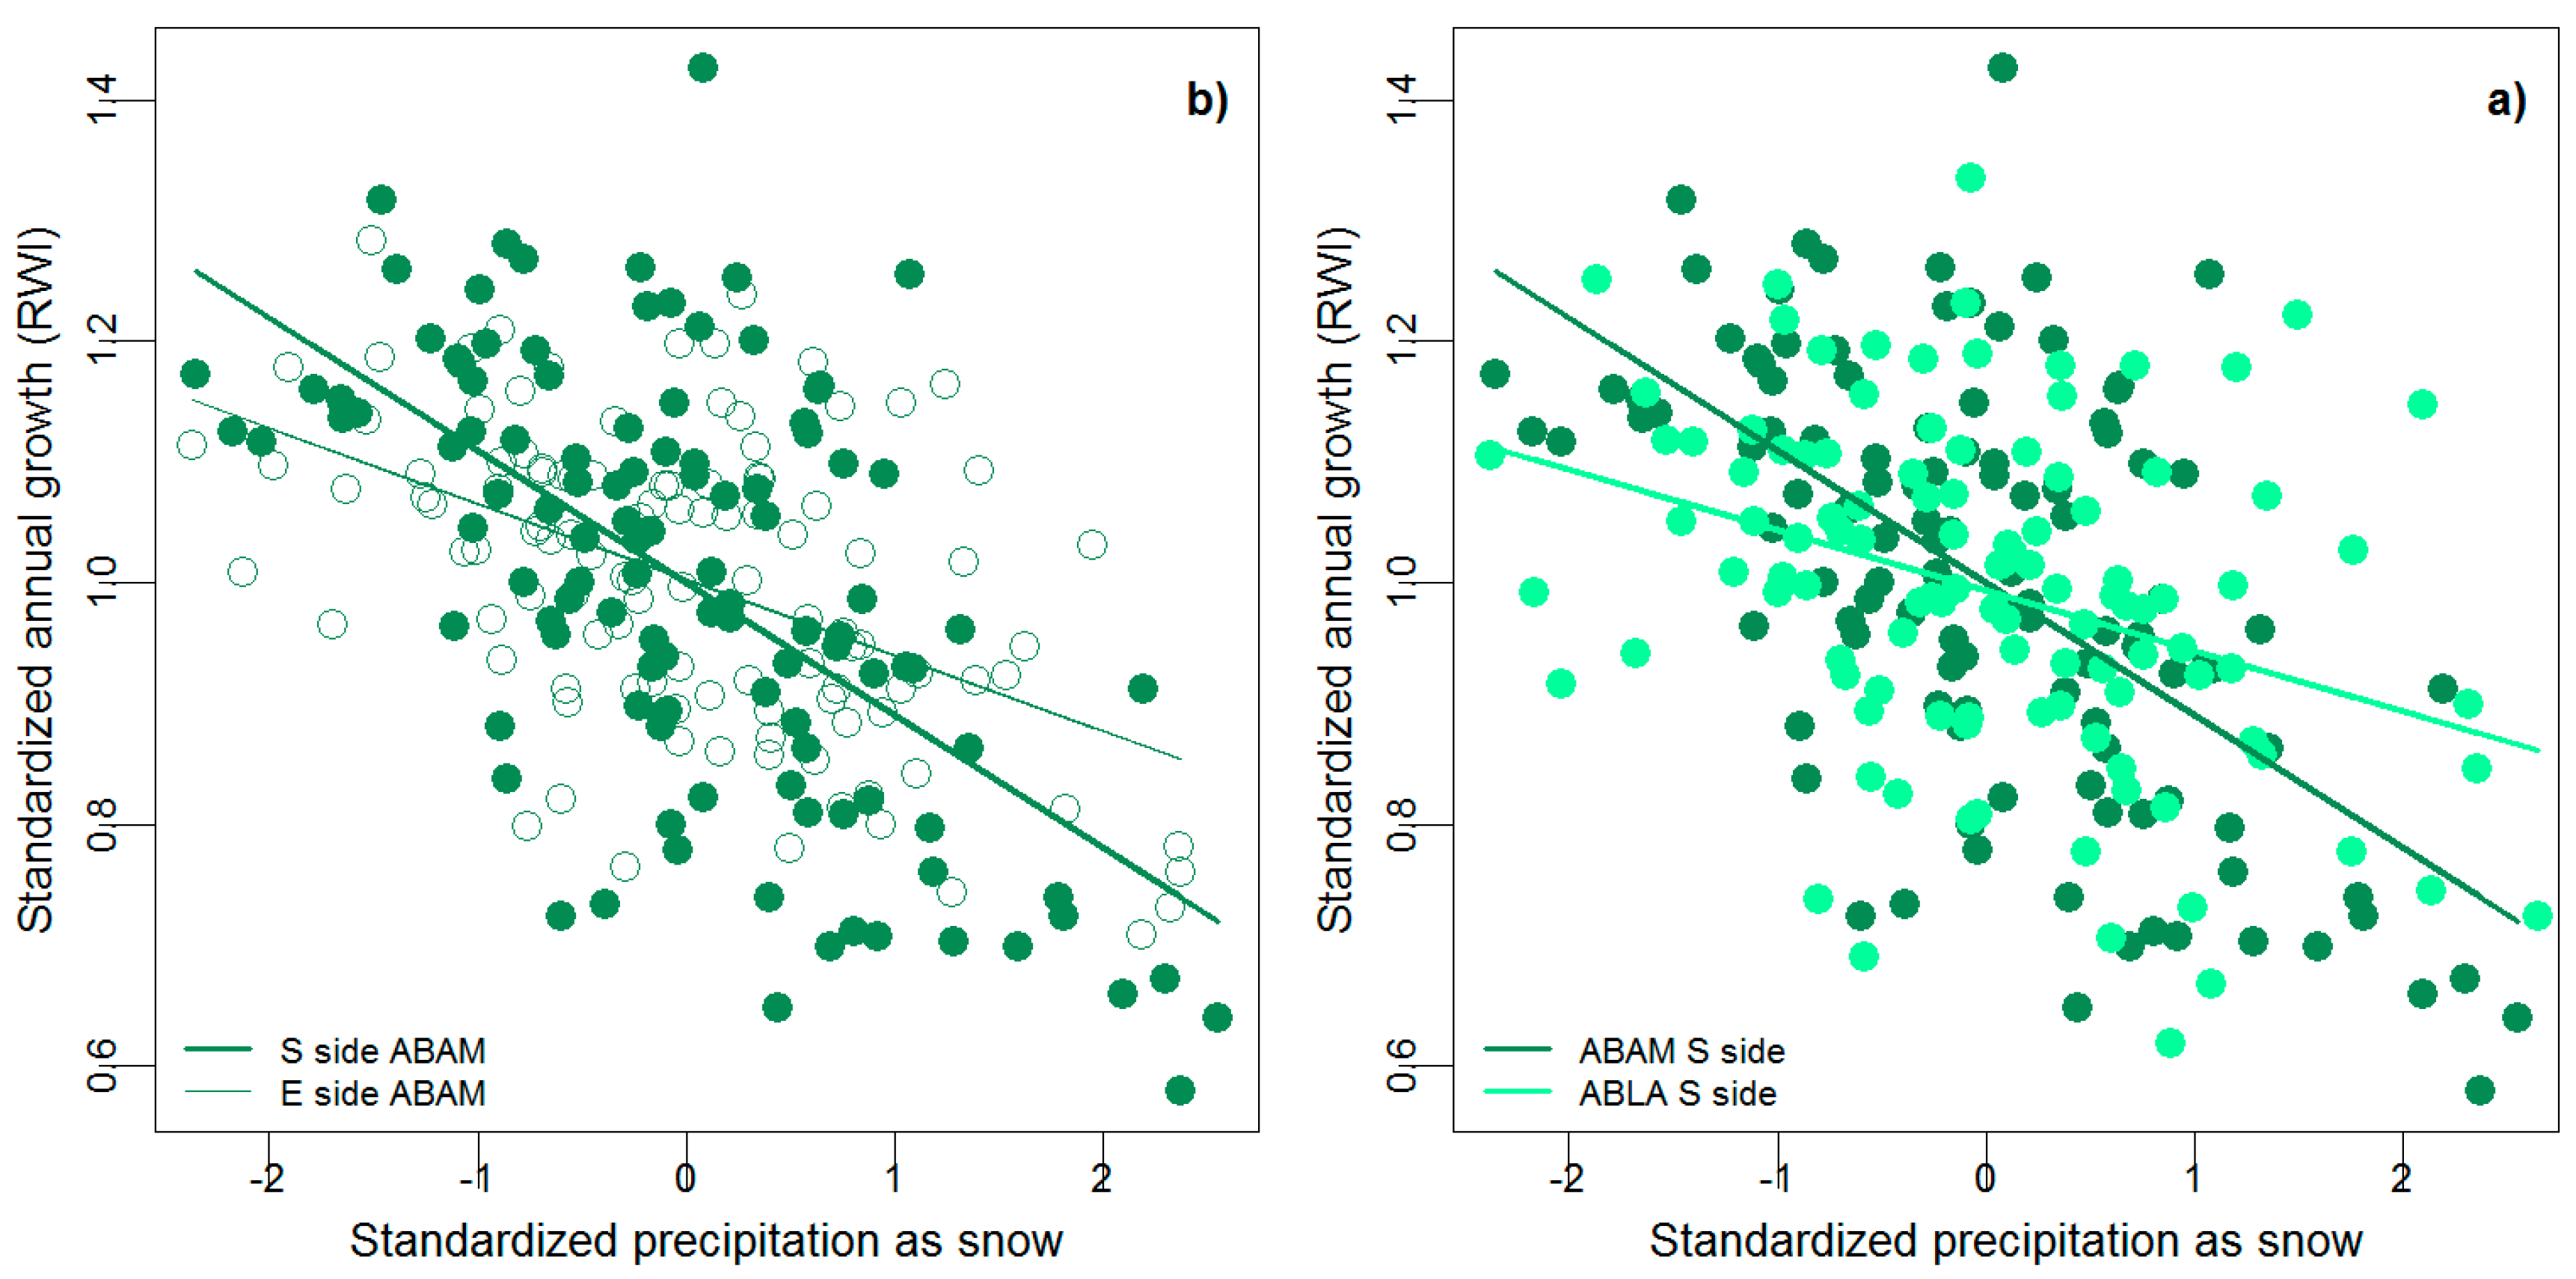
We only identified two site-level differences in climate sensitivity within a species. A. amabilis was more sensitive to snow on the snowiest side of the mountain—the south side, than on the drier side—the east side (p = 0.0114) (Figure 5a). The mean climates of these two sides are the most different from each other (Figure 2), due to the rain shadow effect. Additionally, T. mertensiana was more sensitive to spring warmth on the northwest side (the rainiest side) than on the snowiest side (p = 0.0403) (Figure 4a,b).
With one exception, species were sensitive to the same climatic variables, and with similar climate sensitivities within each of the three sites. However, on the snowiest side, the south side, A. amabilis was significantly more sensitive to snow than A. lasiocarpa (p = 0.0114) (Figure 5b), but not significantly more (or less) sensitive than the other two species (Figure 4a).
Species identity emerged as a slightly more important determinant of growth sensitivity to climate than site in our comparison of four multiple linear regression models with different combinations of species and site interactions fit to all data. Specifically, the best model according to AIC included RWI modeled as a function of climate with species interactions, and the second best model included climate with site interactions (Table 2). However, allowing climate sensitivity to vary by either species or site only explained an additional 1–2% of the variability in RWI (Table 2). No species/site interactions were apparent in the interaction models that we tested.
4. Discussion
Overall, our results demonstrate that similar climate variables act as important constraints on tree growth (RWI) of four sub-alpine trees on all sides of Mt. Rainier, despite climatic differences between sites and differences in species traits. The radial growth–climate relationships reported here suggest that growth of high elevation conifer trees in our study was primarily constrained by the snow and increased by summer warmth, regardless of species or side of Mt. Rainier (Figure 4). This is consistent with previous studies at this site [36,37] and other sites for three of the four sub-alpine species in the Pacific Northwest [17,18,31]. Similarly, over a range of elevations at two different regions on the Kamchatka peninsula in Russia, two co-occuring conifer species tested had the same most influential climatic driver: summer (May–August) temperature [30].
We found that climate sensitivity did vary by species, but that differences were not great. For example, although A. amabilis was more sensitive to snow than A. lasiocarpa (Figure 5b) on the snowiest side of the mountain, both species were still negatively affected by high snowfall years. In addition, the relative sensitivity of A. amabilis compared to A. lasiocarpa for summer warmth, snow, and previous summer warmth was generally consistent across sites, with slight differences that were not significant (Figure 4). Differing from the two Abies species, C. nootkatensis and T. mertensiana were not significantly affected by spring warmth, and C. nootkantensis was uninfluenced by previous summer warmth (Figure 4). Models of climate–growth relationships fit across all species provide additional support that climate–growth sensitivity varies by species, but not in a dramatic fashion. Specifically, a model including a climate by species interaction was the best fitting model to all tree ring data, but the species by climate interaction did not greatly improve the predictive power of the climate-only null model (Table 2). Previous research suggests climate sensitivity often differs between co-occuring species [31,53], which is why we were surprised not to see greater differences.
The slight difference in sensitivity to snow we found between A. amabilis and A. lasiocarpa on the south side of Mt. Rainier could in part be due to the different growth habits of these two species. In the Cascade Mountains, A. lasiocarpa is a shade-intolerant colonizing species [38], whereas A. amabilis is extremely shade-tolerant [54] and part of a secondary forest community [55]. Thus, tree growth of A. amabilis may have been more strongly constrained by climate than the growth of A. lasiocarpa, whose growth may be more strongly influenced by competitive dynamics. However, we did not see the same pattern on any of the other sides of the mountain (Figure 4b,c). Because these species were sampled 1.3 km away from each other on the south side, there could also have been edaphic, topographic, or microclimate differences that we did not measure, and therefore could not account for, that influenced this slightly significant difference in sensitivity, rather than true differences in species physiology.
We were surprised to find that climate sensitivity of our focal species varied only subtly by site (Table 2, Figure 4 and Figure 5a), despite the fact that these three sites differ in climatic conditions (Figure 2). This is in contrast to the many studies that have found considerable differences in climate sensitivity within individual species across large-scale (i.e., latitudinal or continental) climate gradients. For instance, climate responses have been shown to depend on environmental conditions that vary by latitude and elevation [53], to differ by climatic regime [16,19,24] and to differ by latitude [56]. In all, this suggests that the climatic differences among the sides of Mt. Rainer were not large enough to result in substantially different sensitivities to climate. Indeed, although long-term (1901–2015) mean values of precipitation as snow, growing degree days, climate moisture deficit and May–September precipitation differed between sites, there was a large amount of overlap in the annual values when considering interannual variability (Figure 2). Perhaps we did not find the site-specific variation that we expected in part because we compared our chronologies to site-specific climate data, unlike previous studies, which have compared growth to regional climate records (e.g., [16,19,24]).
The subtle differences in climate sensitivity we did observe between species growing at different sites (e.g., Abies amabilis S- and E-side sites—Figure 5a) could be due to microsite differences [57,58,59,60], although we do not believe it very likely. Unfortunately, we did not have tree-specific microsite data to assess significant differences between the sites to test this idea. Topography is known to impact local climate (e.g., [32]), and both the aspect [57,58,59] and hydrological position [60] a tree is growing in have been shown to influence climate sensitivity of conifer species, and they may differ systematically between the three sites. However, unless these microsite differences were strong enough to significantly alter the annual variability in climates the trees experienced (as opposed to simply the mean climate), we do not expect such microsite differences to strongly influence the identity of climatic variables identified as important.
While our results indicate a consistent effect of snow and summer warmth on annual growth of all species growing at their upper range limits across Mt. Rainier, forecasting forest dynamics in a warming world will depend on additional factors not investigated in this study. For one, radial growth–climate sensitivity is only one component of tree demography that may be influenced by climate. Height growth, mortality or reproductive output could have different climate sensitivities by species and/or location (e.g., [35,61]). In addition, climate sensitivity can change over time, as has been reported for boreal northern regions which are temperature limited [62,63], and for one of our focal species (mountain hemlock) on the Western slopes of the Cascade range (where Mt. Rainier is located) [64]. Another important factor could be competitive dynamics. While our findings of consistent climate sensitivities across species and sites suggest consistent responses to climate change (and thus, minimal effects on forest composition) [37], more study is needed to determine whether competitive interactions may change with warming. Finally, changes in disturbance could potentially alter sub-alpine community structure [37]. All of these factors are a critical direction for future research and must additionally be taken into account to provide accurate estimates of future treeline forests, and of the processes that depend on them (e.g., future carbon storage [62]).
5. Conclusions
In summary, we found that species identity and site differences in climate-growth sensitivities will likely not complicate extrapolation of tree growth responses to climate change on Mt. Rainier. Specifically, growing season temperature and snowpack size were consistently the most important drivers of tree growth across all four species and three climatically different sites, with only subtle differences in the strength of effects and effects of a few other climatic variables. Given that growing season temperatures are projected to increase while snowpack declines in the Pacific Northwest with future climate change, our results therefore suggest that we can expect tree encroachment and corresponding decreases in alpine meadows throughout Mt. Rainier National Park, regardless of compositional differences at treeline or differences in mean climates at different sites. More broadly, our results imply that at climate space at wet treeline (such as found throughout the Pacific Northwest), neither species identity nor site-specific differences have a major influence on high elevation conifer climate sensitivity. If these results are verified by other studies (in the Pacific Northwest and beyond), generalization of treeline responses may be possible.
Supplementary Materials
The code used and data files produced in this study are available online at www.mdpi.com/1999-4907/9/1/1/s1.
Acknowledgments
This study was supported by the National Science Foundation (NSF Career DEB-1054012 to JHRL), the U.S. Department of Energy (DOE number DE-FC02-06ER64159 to JHRL), the University of Washington Mary Gates Endowment (ML), the Ronald E. McNair Post-Baccalaureate Achievement Program (ML), the University of Washington GenOM Project (NIH 5R25HG007153-05) (ML), and the University of Washington Department of Biology (ML). The authors thank the members of the HRL lab for valuable feedback during the process of this research project, all the field interns who assisted in collecting tree cores, and Stuart Graham for taking the photos for Figure 3.
Author Contributions
J.H., A.K.E. and M.L.-F. designed and sampled for this study; M.L.-F. performed the analysis; L.D.L.A. and J.H. contributed to data analysis and interpretation; M.L.-F., J.H. and L.D.L.A. wrote the paper.
Conflicts of Interest
The authors declare no conflict of interest.
Appendix A
Figure A1.
A comparison of climate variable observations taken at the Paradise meteorological station (located on the south side of Mt. Rainier) corrected to the permanent forest demography plot on the south side using PRISM normals (see Ettinger et al., 2011), vs. climateWNA for the same permanent forest demography plot for the years 1965–2007. PAS = precipitation as snow; SWE = snow-water equivalent; MAP = mean annual precipitation; MAT = mean annual temperature.


Table A1.
Number of trees sampled from each species at each site included in analysis.
| South | Northwest | East | |
|---|---|---|---|
| ABAM | 20 | 19 | 21 |
| ABLA | 10 | 19 | 20 |
| TSME | 20 | 19 | 19 |
| CANO | 19 | 20 | 19 |
Table A2.
Test statistics for the pairwise differences that revealed significantly different climate sensitivities, either between two species at a site, or two sites for the same species. A. amabilis was set as the intercept for comparisons between species at a site, and the south (snowiest) side was set as the intercept for comparisons between sites. PAS = precipitation as snow, DD5_sp = spring growing degree days.
| Species/Site | Comparison | F-Statistic | df | t-Value | p-Value |
|---|---|---|---|---|---|
| ABAM/SOUTH | siteEAST:PAS | 20.14 on 15 | 323 | 2.544 | 0.01143 |
| TSME/SOUTH | siteNORTHWEST:DD5_sp | 16.29 on 15 | 324 | −2.059 | 0.04031 |
| ABAM/SOUTH | speciesABLA:PAS | 14.67 on 20 | 428 | 2.542 | 0.01137 |
References
- Dirnböck, T.; Dullinger, S.; Grabherr, G. A regional impact assessment of climate and land-use change on alpine vegetation. J. Biogeogr. 2003, 30, 401–417. [Google Scholar] [CrossRef]
- Guisan, A.; Theurillat, J.-P. Assessing alpine plant vulnerability to climate change: A modeling perspective. Integr. Assess. 2000, 1, 307–320. [Google Scholar] [CrossRef]
- Rochefort, R.M.; Little, R.L.; Woodward, A.; Peterson, D.L. Changes in sub-alpine tree distribution in western North America: A review of climatic and other causal factors. Holocene 1994, 4, 89–100. [Google Scholar] [CrossRef]
- Haugo, R.E.; Halpern, C.B.; Bakker, J.D. Landscape context and long-term tree influences shape the dynamics of forest-meadow ecotones in mountain ecosystems. Ecosphere 2011, 2. [Google Scholar] [CrossRef]
- Intergovernmental Panel on Climate Change (IPCC). Climate Change 2014: Synthesis Report; Contribution of Working Groups I, II and III to the Fifth Assessment Report of the Intergovernmental Panel on Climate Change; in IPCC AR5 Synthesis Report Website; Core Writing Team, Pachauri, R.K., Meyer, L.A., Eds.; IPCC: Geneva, Switzerland, 2014; 151p. [Google Scholar]
- Krahulec, F.C.A.; Skálová, H.; Herben, T.; Hadincová, V.; Wildová, R.; Pecháčková, S. Vegetation changes following sheep grazing in abandoned mountain meadows. Appl. Veg. Sci. 2001, 4, 97–102. [Google Scholar] [CrossRef]
- Zhang, C.; Willis, C.G.; Klein, J.A.; Ma, Z.; Li, J.; Zhou, H.; Zhao, X. Recovery of plant species diversity during long-term experimental warming of a species-rich alpine meadow community on the Qinghai-Tibet plateau. Biol. Conserv. 2017, 213, 218–224. [Google Scholar] [CrossRef]
- Smithwick, E.A.H.; Harmon, M.E.; Remillard, S.M.; Acker, S.A.; Franklin, J.F. Potential upper bounds of carbon stores in forests of the Pacific Northwest. Ecol. Appl. 2002, 12, 1303–1317. [Google Scholar] [CrossRef]
- Wilson, A.; Bacher, K.; Breckheimer, I.; Lundquist, J.; Rochefort, R.; Theobald, E.; Whiteaker, L.; HilleRisLambers, J. Monitoring wildflower phenology using traditional science, citizen science, and crowd sourcing. Park Sci. 2017, 33, 17–26. Available online: https://www.nps.gov/ParkScience/articles/parkscience33_1_17-26_wilson_et_al_3850.htm (accessed on 18 September 2017).
- Soja, A.J.; Tchebakova, N.M.; French, N.H.; Flannigan, M.D.; Shugart, H.H.; Stocks, B.J.; Sukhinin, A.I.; Parfenova, E.; Chapin, F.S.; Stackhouse, P.W. Climate-induced boreal forest change: Predictions versus current observations. Glob. Planet. Chang. 2007, 56, 274–296. [Google Scholar] [CrossRef]
- Sherriff, R.L.; Miller, A.E.; Muth, K.; Schriver, M.; Batzel, R. Spruce growth responses to warming vary by ecoregion and ecosystem type near the forest-tundra boundary in south-west Alaska. J. Biogeogr. 2017, 44, 1457–1468. [Google Scholar] [CrossRef]
- Dijak, W.D.; Hanberry, B.B.; Fraser, J.S.; He, H.S.; Wang, W.J.; Thompson, F.R. Revision and application of the LINKAGES model to simulate forest growth in central hardwood landscapes in response to climate change. Landsc. Ecol. 2016, 32, 1365–1384. [Google Scholar] [CrossRef]
- Saxe, H.; Cannell, M.G.R.; Johnsen, Ø.; Ryan, M.G.; Vourlitis, G. Tree and forest functioning in response to global warming. New Phytol. 2001, 149, 369–399. [Google Scholar] [CrossRef]
- Grace, J.; Berninger, F.; Nagy, L. Impacts of climate change on the Tree Line. Ann. Bot.-Lond. 2002, 90, 537–544. [Google Scholar] [CrossRef]
- Nicklen, E.F.; Roland, C.A.; Ruess, R.W.; Schmidt, J.H.; Lloyd, A.H. Local site conditions drive climate-growth responses of Picea mariana and Picea glauca in interior Alaska. Ecosphere 2016, 7, e01507. [Google Scholar] [CrossRef]
- Suarez, M.C.A.D.L.; Villalba, R.; Mundo, I.A.; Schroeder, N. Sensitivity of Nothofagus dombeyi tree growth to climate changes along a precipitation gradient in northern Patagonia, Argentina. Trees 2015, 29, 1053–1067. [Google Scholar] [CrossRef]
- Gedalof, Z.; Smith, D.J. Dendroclimatic response of mountain hemlock (Tsuga mertensiana) in Pacific North America. Can. J. For. Res. 2001, 31, 322–332. [Google Scholar] [CrossRef]
- Ettl, G.J.; Peterson, D.L. Growth response of subalpine fir (Abies lasiocarpa) to climate in the Olympic Mountains, Washington, USA. Glob. Chang. Biol. 1995, 1, 213–230. [Google Scholar] [CrossRef]
- Restaino, C.M.; Peterson, D.L.; Littell, J. Increased water deficit decreases Douglas fir growth throughout western US forests. Proc. Natl. Acad. Sci. USA 2016, 113, 9557–9562. [Google Scholar] [CrossRef] [PubMed]
- Littell, J.S.; Peterson, D.L.; Tjoelker, M. Douglas-fir growth in mountain ecosystems: Water limits tree growth from stand to region. Ecol. Monogr. 2008, 78, 349–368. [Google Scholar] [CrossRef]
- Wilson, R.J.S.; Hopfmueller, M. Dendrochronological investigations of Norway spruce along an elevational transect in the Bavarian Forest, Germany. Dendrochronologia 2001, 19, 67–79. [Google Scholar]
- Griesbauer, H.P.; Green, D.S. Regional and ecological patterns in interior Douglas-fir climate–growth relationships in British Columbia, Canada. Can. J. For. Res. 2010, 40, 308–321. [Google Scholar] [CrossRef]
- Griesbauer, H.P.; Green, D.S.; O’Neill, G.A. Using a spatiotemporal climate model to assess population-level Douglas-fir growth sensitivity to climate change across large climatic gradients in British Columbia, Canada. For. Ecol. Manag. 2011, 261, 589–600. [Google Scholar] [CrossRef]
- Griesbauer, H.P.; Green, D.S. Geographic and temporal patterns in white spruce climate–growth relationships in Yukon, Canada. For. Ecol. Manag. 2012, 267, 215–227. [Google Scholar] [CrossRef]
- Friedrichs, D.A.; Trouet, V.; Büntgen, U.; Frank, D.C.; Esper, J.; Neuwirth, B.; Löffler, J. Species-specific climate sensitivity of tree growth in Central-West Germany. Trees 2009, 23, 729–739. [Google Scholar] [CrossRef]
- Brienen, R.J.W.; Zuidema, P.A. Relating tree growth to rainfall in Bolivian rain forests: A test for six species using tree ring analysis. Oecologia 2005, 146. [Google Scholar] [CrossRef] [PubMed]
- Gillner, S.; Bräuning, A.; Roloff, A. Dendrochronological analysis of urban trees: Climatic response and impact of drought on frequently used tree species. Trees 2014, 28, 1079–1093. [Google Scholar] [CrossRef]
- Kint, V.; Aertsen, W.; Campioli, M.; Vansteenkiste, D.; Delcloo, A.; Muys, B. Radial growth change of temperate tree species in response to altered regional climate and air quality in the period 1901–2008. Clim. Chang. 2012, 115, 343–363. [Google Scholar] [CrossRef]
- Nakawatase, J.M.; Peterson, D.L. Spatial variability in forest growth–climate relationships in the Olympic Mountains, Washington. Can. J. For. Res. 2006, 36, 77–91. [Google Scholar] [CrossRef]
- Deck, C.; Wiles, G.; Frederick, S.; Matsovsky, V.; Kuderina, T.; D’Arrigo, R.; Solomina, O.; Wiesenberg, N. Climate response of larch and birch forests across an elevational transect and hemisphere-wide comparisons, Kamchatka Peninsula, Russian Far East. Forests 2017, 8, 315. [Google Scholar] [CrossRef]
- Peterson, D.W.; Peterson, D.L. Effects of climate on radial growth of subalpine conifers in the North Cascade Mountains. Can. J. For. Res. 1994, 24, 1921–1932. [Google Scholar] [CrossRef]
- Liang, E.; Shao, X.; Eckstein, D.; Huang, L.; Liu, X. Topography- and species-dependent growth responses of Sabina przewalskii and Picea crassifolia to climate on the northeast Tibetan Plateau. For. Ecol. Manag. 2006, 236, 268–277. [Google Scholar] [CrossRef]
- Daly, C.; Halbleib, M.; Smith, J.I.; Gibson, W.P.; Doggett, M.K.; Taylor, G.H.; Curtis, J.; Pasteris, P.P. Physiographically sensitive mapping of climatological temperature and precipitation across the conterminous United States. Int. J. Climatol. 2008, 28, 2031–2064. [Google Scholar] [CrossRef]
- Wang, T.; Hamann, A.; Spittlehouse, D.L.; Murdock, T.Q. ClimateWNA—High-Resolution Spatial Climate Data for Western North America. J. Appl. Meteorol. Clim. 2012, 51, 16–29. [Google Scholar] [CrossRef]
- Kroiss, S.J.; Hillerislambers, J. Recruitment limitation of long-lived conifers: Implications for climate change responses. Ecology 2015, 96, 1286–1297. [Google Scholar] [CrossRef] [PubMed]
- Ettinger, A.K.; Ford, K.R.; Hillerislambers, J. Climate determines upper, but not lower, altitudinal range limits of Pacific Northwest conifers. Ecology 2011, 92, 1323–1331. [Google Scholar] [CrossRef] [PubMed]
- Hillerislambers, J.; Anderegg, L.D.L.; Breckheimer, I.; Burns, K.M.; Ettinger, A.K.; Franklin, J.F.; Freund, J.A.; Ford, K.R.; Krolss, S.J. Implications of climate change for turnover in forest composition. Northwest Sci. 2015, 89, 201–218. [Google Scholar] [CrossRef]
- Franklin, J.F.; Dyrness, C.T. Natural Vegetation of Oregon and Washington; Report PNW-8; USDA Forest Service, Pacific Northwest Forest and Range Experiment Station: Portland, OR, USA, 1973; 417p.
- Stokes, M.A.; Smiley, T.L. An Introduction to Tree-Ring Dating; University of Chicago Press: Chicago, IL, USA, 1968. [Google Scholar]
- Regent Instruments Inc. WinDendro; Version 2009b; Regent Instruments Inc.: Quebec, QC, Canada, 2009. [Google Scholar]
- Holmes, R.L. Computer-assisted quality control in tree-ring dating and measurement. Tree-Ring Bull. 1983, 43, 69–78. [Google Scholar]
- Grissino-Mayer, H. Evaluating crossdating accuracy: A manual and tutorial for the computer program COFECHA. Tree-Ring Res. 2001, 57, 205–221. [Google Scholar]
- Bunn, A.G. Statistical and visual crossdating in R using the dplR library. Dendrochronologia 2010, 28, 251–258. [Google Scholar] [CrossRef]
- R Core Team. R: A Language and Environment for Statistical Computing; R Foundation for Statistical Computing: Vienna, Austria, 2016; Available online: https://www.R-project.org/ (accessed on 25 September 2017).
- Hamann, A.; Wang, T. Potential effects of climate change on ecosystem and tree species distribution in British Columbia. Ecology 2006, 87, 2773–2786. [Google Scholar] [CrossRef]
- DeLong, C.; Griesbauer, H.; Mackenzie, W.; Foord, V. Corroboration of biogeoclimatic ecosystem classification climate zonation by spatially modelled climate data. BC J. Ecosyst. Manag. 2010, 10, 49–64. [Google Scholar]
- Daly, C.; Gibson, W.; Taylor, G.; Johnson, G.; Pasteris, P. A knowledge-based approach to the statistical mapping of climate. Clim. Res. 2002, 22, 99–113. [Google Scholar] [CrossRef]
- Wang, T.; Hamann, A.; Spittlehouse, D.; Carroll, C. Locally downscaled and spatially customizable climate data for historical and future periods for North America. PLoS ONE 2016, 11, e0156720. [Google Scholar] [CrossRef] [PubMed]
- GPS Geoplaner Online. Available online: https://geoplaner.com (accessed on 12 March 2017).
- Zang, C.; Biondi, F. Treeclim: An R package for the numerical calibration of proxy-climate relationships. Ecography 2015, 38, 431–436. [Google Scholar] [CrossRef]
- Hargreaves, G.H.; Samani, Z.A. Reference crop evapotranspiration from temperature. Appl. Eng. Agric. 1985, 1, 96–99. [Google Scholar] [CrossRef]
- Bartoń, K. MuMIn: Multi-Model Inference, R Package Version 1.15.6; 2016. Available online: https://CRAN.R-project.org/package=MuMIn (accessed on 25 September 2017).
- Babst, F.; Poulter, B.; Trouet, V.; Tan, K.; Neuwirth, B.; Wilson, R.; Carrer, M.; Grabner, M.; Tegel, W.; Levanic, T.; et al. Site- and species-specific responses of forest growth to climate across the European continent. Glob. Ecol. Biogeogr. 2013, 22, 706–717. [Google Scholar] [CrossRef]
- Filip, G.M.; Schmitt, C.L. Rx for Abies: Silvicultural Options for Diseased Firs in Oregon and Washington; Gen. Tech. Rep. NW-GTR-252; U.S. Department of Agriculture, Forest Service, Pacific Northwest Research Station: Portland, OR, USA, 1990; 34p.
- Klinka, K.; Krajina, V.J.; Ceska, A.; Scagel, A.M. Indicator Plants of Coastal British Columbia; University of British Columbia Press: Vancouver, BC, Canada, 1989; 288p. [Google Scholar]
- Dorangeville, L.; Duchesne, L.; Houle, D.; Kneeshaw, D.; Cote, B.; Pederson, N. Northeastern North America as a potential refugium for boreal forests in a warming climate. Science 2016, 352, 1452–1455. [Google Scholar] [CrossRef] [PubMed]
- Leonelli, G.; Pelfini, M.; Battipaglia, G.; Cherubini, P. Site-aspect influence on climate sensitivity over time of a high-altitude Pinus cembra tree-ring network. Clim. Chang. 2009, 96, 185–201. [Google Scholar] [CrossRef]
- Stage, A.R.; Salas, C. Composition and productivity. For. Sci. 2007, 53, 486–492. [Google Scholar]
- Primicia, I.; Camarero, J.J.; Janda, P.; Čada, V.; Morrissey, R.C.; Trotsiuk, V.; Bače, R.; Teodosiu, M.; Svoboda, M. Age, competition, disturbance and elevation effects on tree and stand growth response of primary Picea abies forest to climate. For. Ecol. Manag. 2015, 354, 77–86. [Google Scholar] [CrossRef]
- Raney, P.A.; Leopold, D.J.; Dovciak, M.; Beier, C.M. Hydrologic position mediates sensitivity of tree growth to climate: Groundwater subsidies provide a thermal buffer effect in wetlands. For. Ecol. Manag. 2016, 379, 70–80. [Google Scholar] [CrossRef]
- Sakai, A.; Matsui, K.; Kabeya, D.; Sakai, S. Altitudinal variation in lifetime growth trajectory and reproductive schedule of a sub-alpine conifer, Abies mariesii. Evol. Ecol. Res. 2003, 5, 671–689. [Google Scholar]
- Briffa, K.R.; Schweingruber, F.H.; Jones, P.D.; Osborn, T.J.; Shiyatov, S.G.; Vaganov, E.A. Reduced sensitivity of recent tree-growth to temperature at high northern latitudes. Nature 1998, 391, 678–682. [Google Scholar] [CrossRef]
- Carrer, M.; Urbinati, C. Long-term change in the sensitivity of tree-ring growth to climate forcing in Larix decidua. New Phytol. 2006, 170, 861–872. [Google Scholar] [CrossRef] [PubMed]
- Marcinkowski, K.; Peterson, D.L.; Ettl, G.J. Nonstationary temporal response of mountain hemlock growth to climatic variability in the North Cascade Range, Washington, USA. Can. J. For. Res. 2015, 45, 676–688. [Google Scholar] [CrossRef]
Figure 1.
Tree core collection locations in Mt. Rainier National Park, Washington. The labels denote elevation in meters. White line shows the border of Mt. Rainier National Park.
Figure 1.
Tree core collection locations in Mt. Rainier National Park, Washington. The labels denote elevation in meters. White line shows the border of Mt. Rainier National Park.

Figure 2.
Annual climate variability since 1901 (small points) and long-term mean climate (large points) for the three sub-alpine sampling locations on Mt. Rainier. Selected climate variables: precipitation as snow and growing degree days (a) and climate moisture deficit and growing season precipitation (b) for comparison among the three sites. Climate data obtained from ClimateWNA (Version 5.40, University of British Columbia, BC, Canada) spans from 1901 to 2015. Growing degree days, precipitation as snow, and climate moisture deficit are derived annual summaries of monthly variables calculated by ClimateWNA. The data for the south side is for the long-term forest demographic monitoring site on that side of the mountain (1603 m).

Figure 3.
Closed-canopy forest where A. amabilis, T. mertensiana, and C. nootkatensis co-occur (a) and open meadow where A. lasiocarpa has established (b) at the sampling locations on the northwest side of Mt. Rainier.
Figure 3.
Closed-canopy forest where A. amabilis, T. mertensiana, and C. nootkatensis co-occur (a) and open meadow where A. lasiocarpa has established (b) at the sampling locations on the northwest side of Mt. Rainier.

Figure 4.
Climate sensitivity for all focal species across all three study sites at Mt. Rainier: (a) south side, (b) northwest side, (c) east side. The magnitude of climate sensitivity indicates the strength of sensitivity; the larger the bar, the more sensitive the group of trees is to that particular climate variable. A positive direction of climate sensitivity represents a positive growth response for an increase in the climate variable and vice versa. Error bars are 1.96× standard error. * s indicate significantly different climate sensitivities for two species at a site. ^ s indicate significantly different climate sensitivities for a single species across two sites. α = 0.05.

Figure 5.
Significant differences in climate sensitivity (a) for A. amabilis growing on different sides of the mountain (p = 0.0114) and (b) between A. amabilis and A. lasiocarpa on the same side of the mountain (p = 0.0114).
Figure 5.
Significant differences in climate sensitivity (a) for A. amabilis growing on different sides of the mountain (p = 0.0114) and (b) between A. amabilis and A. lasiocarpa on the same side of the mountain (p = 0.0114).

Table 1.
Importance factors (proportion of top models including the variable) for RWI/climate variable relationships for all species at each site. Importance factor values range from 0 to 1, 1 being the most important. (sm = summer, sp = spring, prev = previous, GDD = growing degree days, PAS = precipitation as snow, RH = relative humidity). Note: species codes in column 1 are the first two letters of the genus and the first two letters of the species epithet.
| Species/Site | GDD_sm | GDD_sp | PAS | Prev_GDD_sm | RH_sp |
|---|---|---|---|---|---|
| ABAM/S | 1.00 | 0.74 | 1.00 | 0.83 | 0.65 |
| ABAM/NW | 1.00 | 1.00 | 1.00 | 1.00 | 0.51 |
| ABAM/E | 1.00 | 1.00 | 1.00 | 1.00 | 0.56 |
| ABLA/S | 1.00 | 1.00 | 1.00 | 1.00 | 1.00 |
| ABLA/NW | 0.97 | 0.65 | 1.00 | 1.00 | 0.33 |
| ABLA/E | 1.00 | 1.00 | 1.00 | 1.00 | 0.72 |
| TSME/S | 1.00 | 0.23 | 1.00 | 0.58 | 0.24 |
| TSME/NW | 1.00 | 0.92 | 1.00 | 0.82 | 0.94 |
| TSME/E | 1.00 | 0.47 | 1.00 | 1.00 | 0.73 |
| CANO/S | 0.89 | 0.21 | 1.00 | 0.31 | 0.29 |
| CANO/NW | 1.00 | 0.36 | 1.00 | 0.50 | 0.83 |
| CANO/E | 0.86 | 0.33 | 1.00 | 0.62 | 0.43 |
| Average | 0.98 | 0.66 | 1.00 | 0.81 | 0.60 |
Table 2.
Model selection for ring width indices as a function of climate, ring width as a function of climate with species interactions, with site interactions, and with both species and site interactions. ΔAIC is relative to the climate-only null model. A negative ΔAIC indicates that the model is better than the null. ◊ denotes the best model.
| Model | df | ΔAIC | R2 |
|---|---|---|---|
| rwi~1 | 2 | 572.80 | 0 |
| rwi~climate | 7 | 0 | 0.349 |
| rwi~climate*site | 17 | −2.42 | 0.360 |
| ◊ rwi~climate*species | 22 | −8.20 | 0.367 |
| rwi~climate*species*site | 62 | 31.90 | 0.386 |
© 2017 by the authors. Licensee MDPI, Basel, Switzerland. This article is an open access article distributed under the terms and conditions of the Creative Commons Attribution (CC BY) license (http://creativecommons.org/licenses/by/4.0/).
Share and Cite
MDPI and ACS Style
Legendre-Fixx, M.; Anderegg, L.D.L.; Ettinger, A.K.; HilleRisLambers, J. Site- and Species-Specific Influences on Sub-Alpine Conifer Growth in Mt. Rainier National Park, USA. Forests 2018, 9, 1. https://doi.org/10.3390/f9010001
AMA Style
Legendre-Fixx M, Anderegg LDL, Ettinger AK, HilleRisLambers J. Site- and Species-Specific Influences on Sub-Alpine Conifer Growth in Mt. Rainier National Park, USA. Forests. 2018; 9(1):1. https://doi.org/10.3390/f9010001
Chicago/Turabian StyleLegendre-Fixx, Myesa, Leander D. L. Anderegg, Ailene K. Ettinger, and Janneke HilleRisLambers. 2018. "Site- and Species-Specific Influences on Sub-Alpine Conifer Growth in Mt. Rainier National Park, USA" Forests 9, no. 1: 1. https://doi.org/10.3390/f9010001
Note that from the first issue of 2016, this journal uses article numbers instead of page numbers. See further details here.