Article

Nitrogen Nutrition of European Beech Is Maintained at Sufficient Water Supply in Mixed Beech-Fir Stands

1
Institute of Forest Sciences, Chair of Tree Physiology, University of Freiburg, Georges-Koehler-Allee 54/54, 79110 Freiburg, Germany
2
College of Urban and Rural Development and Planning, Mianyang Normal University, Xianren Road 30, Mianyang 621000, China
3
Institute of Meteorology and Climate Research, Atmospheric Environmental Research (IMK-IFU), Karlsruhe Institute of Technology (KIT), Kreuzeckbahnstrasse 19, 82467 Garmisch-Partenkirchen, Germany
4
Büsgen-Institute, Department of Forest Botany and Tree Physiology, University of Göttingen, Büsgenweg 2, 37077 Göttingen, Germany
5
Hrvatski Šumarski Institute, Zavod za Genetiku, Oplemenjivanje Šumskog Drveća i Sjemenarstvo Cvjetno naselje 41, 10450 Jastrebarsko, Croatia
6
College of Sciences, King Saud University, P.O. Box 2455, Riyadh 11451, Saudi Arabia
*
Author to whom correspondence should be addressed.
Forests 2018, 9(12), 733; https://doi.org/10.3390/f9120733
Submission received: 17 October 2018 / Revised: 20 November 2018 / Accepted: 21 November 2018 / Published: 23 November 2018
(This article belongs to the Special Issue Physiological Responses to Abiotic and Biotic Stress in Forest Trees)

Abstract

:
Research highlights: Interaction effects of coniferous on deciduous species have been investigated before the background of climate change. Background and objectives: The cultivation of European beech (Fagus sylvatica L.) in mixed stands has currently received attention, since the future performance of beech in mid-European forest monocultures in a changing climate is under debate. We investigated water relations and nitrogen (N) nutrition of beech in monocultures and mixed with silver-fir (Abies alba Mill.) in the Black Forest at different environmental conditions, and in the Croatian Velebit at the southern distribution limit of beech, over a seasonal course at sufficient water availability. Material and methods: Water relations were analyzed via δ13C signatures, as integrative measures of water supply assuming that photosynthesis processes were not impaired. N nutrition was characterized by N partitioning between soluble N fractions and structural N. Results: In the relatively wet year 2016, water relations of beech leaves, fir needles and roots differed by season, but generally not between beech monocultures and mixed cultivation. At all sites, previous and current year fir needles revealed significantly lower total N contents over the entire season than beech leaves. Fir fine roots exhibited higher or similar amounts of total N compared to needles. Correlation analysis revealed a strong relationship of leaf and root δ13C signatures with soil parameters at the mixed beech stands, but not at pure beech stands. While glutamine (Gln) uptake capacity of beech roots was strongly related to soil N in the monoculture beech stands, arginine (Arg) uptake capacities of beech roots were strongly related to soil N in mixed stands. Conclusions: Leaf N contents indicated a facilitative effect of silver-fir on beech on sites where soil total N concentrations where low, but an indication of competition effect where it was high. This improvement could be partially attributed to protein contents, but not to differences in uptake capacity of an individual N source. From these results it is concluded that despite similar performance of beech trees at the three field sites investigated, the association with silver-fir mediated interactive effects between species association, climate and soil parameters even at sufficient water supply.

1. Introduction

European beech (Fagus sylvatica L.) and silver-fir (Abies alba MILL.) possess a similar migration history after the last glaciation into Central Europe. Both species found refuge areas in the south, southwest, and southeast of Europe in order to survive the last glacial period [1]. Silver-fir migrated into Central Europe from three of its five refugia, one located in the Balkans, one in Central Italy, and the third in Central/Eastern France [2]. The locations of beech refugia are still a matter of debate, but presumably also beech migrated from several refuge areas into Central Europe, mainly from a population in the Alpine-Slovenia-Istria region [3]. The populations originating from the Calabrian refugium seem to be restricted to Italy [4]. Today, European beech is a key species in Central European forests, where it dominates under many climatic conditions [5], and is the most spread of all beech species [6]. Its climate optimum allowed the colonization of large areas all over Europe, only limited by excessive water supply in very moist habitats, or restricted water supply in the south, where its populations decrease in favor of conifers and oaks under dry and warm conditions [7]. Silver-fir occurs mainly in mountainous regions scattered all over Europe, and is thought to restrain its distribution range to cool and moist climate conditions [2,7,8,9], though this belief is questioned to date [10]. Mixed beech-fir forests (‘Abieti-Fagetum’ [5]) constituted the typical association in the Black Forest in Southern Germany before the 18th century [11]. Today, these mixed forests are found mainly at the southern distribution limit of beech, i.e., in the mountainous regions of the Dinaric Alps or the Iberian Peninsula [12].
The quasi-monoculture beech forests found in Germany today are the result of a combination of anthropogenic and natural processes. To counteract the promotion of pure plantations of Norway spruce (Picea abies (L.) KARST), beech plantations have been favored by forestry practices due to its economic benefits. For example, beech forests are promoted in the state of Baden-Württemberg, Germany, towards a desired extend of 30% of the total forested area [13]. Since beech trees are very competitive, they can occupy between 80 and 100% of the canopy area in forests [14]. Additionally, beech seedlings can grow in the understory of a closed canopy by adapting their photosynthetic performance [15,16] and by increasing their specific leaf area (SLA) to increase light capture and carbon gain [17,18,19], an indication of high shade tolerance. Thus, adult beeches favor their offspring by enabling its growth under low light conditions for a prolonged period of time [20,21,22]. However, if a “forest gap” opens, juvenile beech trees can react in the subsequent growing season by the development of leaves adapted to high light conditions and, hence, increase growth [19,23]. These features led to a coverage of large areas of Central Europe with beech forests, where moderate site conditions apply [3].
Despite the dominance of beech in Central European forests, numerous studies showed that beech trees are relatively drought-sensitive [7,24,25]. The distribution limit of beech is found in regions where long severe winters and summer drought arise [26]. As a consequence, the Balkan Peninsula constitutes the southernmost distribution area of beech, where it is likely to perform at its physiological limit. Under the auspices of climate change, we can expect forest responses towards heat, drought, and extreme events especially in this region [27,28,29], with implications for nutrient acquisition [30], forest productivity [31,32], and forest dieback [33,34,35].
In a changing climate with increased frequencies of “drying-wetting-cycles”, the future performance of beech forests in Central Europe is questioned [36,37,38]. To cope with a changing climate, the development of adaption approaches is thought to be required fostering compositional, functional and/or structural complexity of forests [39,40]. To meet this aim, in the Black Forest in southwest Germany quasi-monoculture stands of beech are currently diversified by re-introducing naturally occurring species such as silver-fir (Abies alba Mill.) [39,41]. This species combination is frequently found in mountain forests of Europe forming natural associations with varying beech:fir ratios also at the southern distribution limit of beech [42]. Under these conditions, silver-fir was found to lose its sensitivity to summer droughts under nutrient limitation [43] and is thought to benefit from enhanced water supply provided by increased stem-flow and concentrated infiltration of water at the stem base of beech [44,45]. Vice versa, relatively shallow-rooting beech trees may benefit from the association with deep-rooting fir under drought conditions from the access of fir to additional water sources [46]. However, facilitative effects such as improved water supply by silver-fir’s taproot via hydraulic lift [47] during drought might be superimposed by competition effects during years of sufficient water supply, like aboveground competition for light [48,49], or belowground competition for nutrients [50,51].
To address the extend of the interaction effect of beech and fir, we analyzed water relations and N nutrition of beech at three forest sites, naturally differing in nutrient supply and climate in a wet year that provided sufficient water to the stands at all sites. Two forest sites were located in the “Black Forest” in southwest Germany and one at the southern distribution limit of beech in the Dinaric Alps in Croatia. We investigated the tree vegetation over a seasonal course, trying to link the water and nutrient availability in the soil to the performance of the investigated stands. We hypothesized that even at sufficient water supply (1) the performance of beech and silver-fir differed between the forest site at its southern distribution limit and the two stands in the “Black Forest”; (2) an interactive effect of firs on the performance of beech can be identified by comparing N partitioning and acquisition of beeches in mixed versus pure beech stands; (3) soil N contents, climate, and species associations interactively affect the performance of beech also at sufficient water supply.

2. Materials and Methods

2.1. Field Sites and Experimental Approaches

For the present experiments, three field sites were chosen differing in N supply and water holding capacity, i.e., the Freiamt (EM) and Conventwald (CO) sites in Germany and a field site in Croatia (CR) (Table S5). The EM field site is located in the Black Forest area at approx. (approximately) 400 m a.s.l. (above sea level). The mean annual air temperature is 9.6 °C and the annual precipitation amounts to 1100 mm. The soil parent material is sandstone and is characterized as Dystric Cambisol with a mean field capacity of approx. 18 vol%. The average soil depth amounts to 80–100 cm. The vegetation consists of 70% of beech, 15% silver-fir, and 15% larch.
The CO site is located 15 km from the EM site at ca. 700 m a.s.l., revealing a mean annual air temperature of 7.3 °C and an annual precipitation of 1777 mm. The soil is classified as hyperdystric skeletic folic Cambisol developed on paragneiss. The mean field capacity of approx. 19 vol% is similar to the EM site. Soil depth at the CO site is very heterogenic and varies between 50 and 100 cm, with a high amount of skeleton. Vegetation composition differed between the two sub-sites used for the present study. In the “pure beech” sub-site it consists of approx. 55% beech, 10% silver-fir, and 35% spruce. In the “mixed forest” sub-site we found approx. 35% beech, 35% silver-fir, 5% spruce, 10% douglas fir, and 5% larch.
The CR field site is located near the city of Gospić in the Velebit Mountains at an elevation of approx. 900 m a.s.l. (Table S5). The mean annual air temperature amounts to 7.5 °C and the annual precipitation to ca. 2230 mm (577 mm during the vegetation period, climate station Baške Oštarije, 924 m; 1987–2010). The soil developed on limestone parent bedrock and is classified as Chromic Cambisol, exhibiting a field capacity of ~33 vol%. The average soil depth amounts to ca. 45 cm. As for the CO site, two sub-sites were included in the studies at the CR site. The vegetation composition surrounding the “pure beech” sub-site consisted of 57.6% beech, 40% silver-fir and 3% others; the “mixed forest” sub-site was composed of 38% beech, 50% silver-fir and 12% other deciduous species (personal communication, forest direction of Gospić).
For the experiments at each site, beeches were chosen growing either surrounded by beeches as neighboring trees (i.e., “pure stands”), or with silver-firs as the neighboring species (i.e., mixed stands).

2.2. Soil Sampling and Analyses

For the CO site, soil characterization and other soil data were provided by the University of Freiburg, Chair of Soil Ecology (Lang and Krüger, personal communication). For soil characterization, soil of the field sites EM and CR was sampled in July 2016, to a depth of approx. 100 cm and 45 cm, respectively, corresponding to the beginning of soil parent rock material. For the EM site three pits were dug and three replicas were taken from each horizon, with ten further drillings around every pit to account for spatial variability in topsoil. For the CR site a total of 10 pits—including at least three pits under pure beech, three under pure fir as well as three under a mix of beech and fir, each—were dug and three replicated samples were taken from each horizon. All samples were combined to one sample per horizon and pit and were consequently air-dried. Soil texture was determined by wet sieving and sedimentation (DIN ISO 11277) in a commercial laboratory (Agrolab Group, Sarstedt, Germany).
To quantify SOC and TN stocks, soil samples of 100 cm3 were taken with a soil corer in five to eight replicates per soil pit and horizon and used for the determination of soil bulk density via drying at 105 °C for 24 h. For total carbon analysis, as well as for carbonate and total nitrogen (TN) investigation, soil was sieved to 2 mm, grinded and the contents were analyzed in a commercial laboratory (Dr. Janssen’s laboratory, Gillersheim, Germany), using VDLUFA (Verband Deutscher Landwirtschaftlicher Untersuchungs- und Forschungsanstalten) Method IA 5.3.1 for carbonate, DIN ISO 10694 for total carbon, and DIN ISO 13878 for TN. Soil organic carbon (SOC) was calculated as the difference between total carbon and carbonate-C content. For the analysis of extractable ammonium and nitrate concentrations in EM and CO soil, three replicated samples (30 g) of the Ah horizon and the Bv horizon as well as leaf litter samples (10 g) were extracted with 0.5 M K2SO4 (Merck KGaA, Darmstadt, Germany) [52]. For CR, 30 replicated samples of the Ah and Bv horizon as well as leaf litter were extracted with 1 M KCl (Merck KGaA, Darmstadt, Germany). Tests showed that for Chromic Cambisol, extraction with 1 M KCl revealed the same inorganic N concentrations compared to extraction with 0.5 M K2SO4. For the extractions, samples were shaken with the extraction solution for one hour in 250 mL plastic bottles (Carl Roth GmbH, Karlsruhe, Germany) at 170 rpm. Subsequently, extracts were filtered using vacuum pumps, glass fiber filters (Whatman GF/A, Springfield, UK), and finally syringe filters (0.45 µm) (Schleicher and Schuell, Dassel, Germany) and frozen immediately. Concentrations of NH4+ and NO3 were analyzed colorimetrically by a commercial laboratory (Dr. Janssen’s laboratory, Gillersheim, Germany) using the VDLUFA method A 6141 [53].
Field capacity was estimated as the soil volumetric water content (VWC) two days after rain events in spring. Volumetric water content was gained from continuous measurements using TDR (Time Domain Reflectometry, 5TM, and GS1 sonsors, Decagon Devices, Inc., Pullman, WA, USA) probes—calibrated by gravimetric measurements—at a depth of 5 and 40 cm for the CR site. The average VWC for the CR site was calculated from seven sensors in 5 cm depth and five sensors in 40 cm depth. For the EM site, field capacity was calculated as the water held against gravity [54]. Further description of the latter method can be found elsewhere [46].

2.3. Sampling of Plant Material

At each field site, European beech trees (Fagus sylvatica L.) and silver-firs (Abies alba MILL.) of similar size and age were selected. Sampling was conducted three times over the growing season, the first time after beech leaves were just fully developed (i.e., “Spring”), a second time during a hotter and drier period ca. six to eight weeks later (i.e., “Summer”), and a third time just after some beech leaves started to change color (though only still intact and green leaves were sampled; i.e., “Fall”). At each sampling campaign, branches facing the adjacent trees in the upper surface of the crown, of approximately 30–45 cm in length, were collected by professional tree climbers equipped with a throw line and pole saws. To limit diurnal variation and variation by light availability, branches were harvested between 10 a.m. to 2 p.m. at approximately the same tree height.
From each beech twig, three fully developed, intact leaves were collected; from twigs of silver firs, previous-year needles were excised. To collect root samples, fine roots (<2 mm diameter) were carefully removed from the soil near the tree trunk, rinsed with demineralized water, and dried with paper tissues. Subsamples of leaves/needles and roots were immediately shock-frozen in liquid nitrogen in the field. For further analysis, samples were homogenized with mortar and pestle under liquid nitrogen and stored at −20 °C. The rest of the samples were dried in the oven at 60 °C for approx. 3 days until weight constancy. Hydration state of leaf and root material was calculated as the difference between fresh weight (FW) and dry weight (DW) divided by the DW [55].

2.4. Element and Stable Isotope Analyses of C and N

Total N and total C contents as well as δ15N and δ13C signatures were measured as previously described elsewhere [56]. For this purpose, oven dried samples were ground with a ball mill (Retsch MM 400, Retsch GmbH, Haan, Germany), aliquots (1.0–1.5 mg) were loaded into tin capsules (IVA Analysentechnik, Meerbusch, Germany) and measured in an isotope ratio mass spectrometer (Delta V Plus, Thermo Finnigan MAT, GmbH, Bremen, Germany) coupled via a Conflo III interface with an element analyser (NA2500, CE Instruments, Milan, Italy). Working standards (glutamic acid) were calibrated against the primary standards of the U.S. Geological Survey 40 (USGS 40, glutamic acid δ13CPDB = −26.39‰) and USGS 41 (glutamic acid δ13CPDB = 37.63‰) for δ13C, and USGS 25 (ammonium sulphate, δ15NAir = −30.4‰) and USGS 41 (glutamic acid δ15NAir = 47.600‰) for δ15N and analyzed after every tenth sample to account for a potential instrument drift over time as described by Simon et al. [21].

2.5. Protein and Amino Acid Analyses

Soluble protein in plant material was determined using a modification of the method described by Du et al. [57]. Approximately 50 mg frozen homogenized leaf/needle or 80 mg root material was mixed with double the amount of polyvinylpolypyrrolidone (PVPP, Sigma-Aldrich Inc., St. Louis, MO, USA) and extracted with 1 mL Tris/HCl-Buffer (50 mM Tris-Cl (Sigma-Aldrich Inc., St. Louis, MO, USA), 1 mM EDTA (Sigma-Aldrich Inc., St. Louis, MO, USA), 1 mM DTT (Sigma-Aldrich Inc., St. Louis, MO, USA), 100 µM PMSF (Sigma-Aldrich Inc., St. Louis, MO, USA), 15% Glycerol (Sigma-Aldrich Inc., St. Louis, MO, USA) (v/v), 0.1% Triton-100 (Sigma-Aldrich Inc., St. Louis, MO, USA) (v/v), pH 8.0) by vortexing and incubation for 30 min at 4 °C. After centrifugation for 10 min at 12,000× g and 4 °C, 500 µL aliquots of the supernatant were transferred into new tubes, mixed with 500 µL 10% trichloroacetic acid (TCA, Merck KGaA, Darmstadt, Germany), vortexed and incubated for 10 min at room temperature. After 10 min centrifugation at 12,000× g and 4 °C, the pellet was dissolved in 500 µL 1 M KOH (Merck KGaA, Darmstadt, Germany) by shaking for 30 min at 4 °C. For quantification of total soluble protein of leaf material (i.e., leaves and needles), 5 µL aliquots of the extract were pipetted in triplicate into a disposable polystyrene micro cuvette plate and mixed with 200 µL Bradford reagent (Amresco, Solon, OH, USA). The mixtures were incubated for 10 min at room temperature and the optical density was measured at 595 nm using a microplate reader (Sunrise-basic Tecan, Grödlg, Austria). For root material 25 µL aliquots were mixed with 500 µL Bradford reagent. Optical density was measured in a spectrophotometer (Type DU 650, Beckman Coulter, Brea, CA, USA) at 595 nm. In both cases bovine serum albumin (BSA, Sigma-Aldrich, Taufkirchen, Germany) was used as a standard. Protein-N was calculated from the mean N content in BSA (15.9%).
The extraction of amino acids from plant material was conducted after the method of Winter et al. [58] and Hu et al. [59] with slight modifications. Approximately 50 mg of frozen leaf or 80 mg root powder were mixed with 1 mL methanol/chloroform (Merck KGaA, Darmstadt, Germany) (3.5/1.5, v/v) and 0.2 mL Hepes buffer (containing 20 mM Hepes (Merck KGaA, Darmstadt, Germany), 5 mM EGTA (Sigma-Aldrich Inc., St. Louis, MO, USA), 10 mM NaF (Sigma-Aldrich Inc., St. Louis, MO, USA)). After incubation on ice for 30 min, 0.6 mL distilled water was added and the mixture was centrifuged for 10 min at 14,000× g at 4 °C. Aliquots of 1 mL of the supernatant were transferred into new tubes and stored on ice. Subsequently, the extraction of the plant material was repeated and 1 mL aliquots of the supernatants were combined. Aliquots of 0.1 mL of the combined supernatants and 0.1 mL ninhydrin solution (1:1 mixture of a solution containing 4.2 g monohydrate citric acid (Merck KGaA, Darmstadt, Germany) and 0.16g anhydrous stannous chloride (Sigma-Aldrich Inc., St. Louis, MO, USA) in 40 mL 1 M NaOH (Merck KGaA, Darmstadt, Germany), made up to 100 mL with distilled water (pH 5.0) and a solution containing 4 g ninhydrin (Sigma-Aldrich Inc., St. Louis, MO, USA) in 100 mL ethylene glycolmonomethyl ether (Merck KGaA, Darmstadt, Germany) were boiled for 30 min. Subsequently, 1.25 mL isopropanol (Merck KGaA, Darmstadt, Germany) (50%) were added and the samples were incubated for 15 min at room temperature in the dark. The optical density was determined with a UV-DU650 spectrophotometer (DU 650, Beckman Coulter, Brea, CA, USA) at 570 nm. l-glutamine (Sigma-Aldrich Inc., St. Louis, MO, USA) was used as standard.

2.6. Calculation of Structural N

Structural N in leaves/needles and roots was calculated by subtracting the N fractions of total amino acids and soluble proteins from total N. Calculations were based on the dry weight of the samples. Dannenmann et al. [60] as well as Simon et al. [21] found that inorganic N did not contribute significantly to total N in temperate forest trees and, therefore, inorganic N was neglected in this calculation.

2.7. N Uptake Experiments

Net N uptake experiments were conducted using the N-enrichment technique described by Gessler et al. [61]. Fine roots still attached to the tree were dug out, rinsed with distilled water to remove adhering soil particles, dried with cellulose paper and submersed into 4 mL of an artificial soil solution for 2 h between 10 a.m. and 2 p.m. to avoid diurnal variation in N uptake capacity [62]. The artificial soil solution resembled the mineral soil onsite in concentration of anions and cations as well as in pH; it contained 100 μM KNO3 (Merck KGaA, Darmstadt, Germany), 90 μM CaCl2 2H2O (Merck KGaA, Darmstadt, Germany), 70 μM MgCl2 6H2O (Merck KGaA, Darmstadt, Germany), 50 μM KCl (Merck KGaA, Darmstadt, Germany), 24 μM MnCl2 4H2O (Merck KGaA, Darmstadt, Germany), 20 μM NaCl (Merck KGaA, Darmstadt, Germany), 10 μM AlCl3 (Merck KGaA, Darmstadt, Germany), 7 μM FeSo4 7H2O (Merck KGaA, Darmstadt, Germany), 6 μM K2HPO4 (Merck KGaA, Darmstadt, Germany), 1 μM NH4Cl (Merck KGaA, Darmstadt, Germany), as well as the amino acids glutamine (Sigma-Aldrich Inc., St. Louis, MO, USA) (25 μM) and arginine (Sigma-Aldrich Inc., St. Louis, MO, USA) (25 μM). Thus, the artificial soil solution consisted of four different N sources, ammonium (NH4+) and nitrate (NO3) as inorganic and the amino acids glutamine (Gln) and arginine (Arg) as organic N sources. The latter constitute the most abundant amino compounds in beech roots [63]. Uptake experiments were carried out with only one of the four N sources being offered as 15N-labeled compound (K15NO3, 15NH4Cl and double labeled 15N13C-Gln/15N13C-Arg, Cambridge Isotope Laboratories, Inc., Andover, MA, USA) with three replicates per N-labeled source and tree. In addition, control solutions without label were applied to account for the natural abundance of 15N in the roots. After being submersed for 2 h, the roots were cut off, washed twice with 0.5 M CaCl2 (Merck KGaA, Darmstadt, Germany), dried with cellulose paper, and dried in an oven at 60 °C for 48 h. Subsequently, the samples were ground and 1.2–2 mg powder was weighed into tin capsules (IVA Analysetechnik, Meerbusch, Germany). Samples were analyzed with an element analyzer (NA 1108, Fisons, Rodano, Italy, or NA 1110, CE Instruments, Milan, Italy) coupled via a Conflo III interface to an isotope ratio mass spectrometer (Delta Plus, Thermo Finnigan MAT GmbH, Bremen, Germany). The working standard glutamic acid, calibrated against the international standard USGS 41 (δ15Nair = 47.600) for δ15N, was measured after each tenth sample. For calculation of the net N uptake capacity (NUC), Equation (1) was applied [64]:
  N U C = n = 1 2 Δ 15 N n c N n D W 10 5 Δ t F W M ( N )
where NUC is the net uptake capacity (nmol g−1 FW h−1), ∆15Nn the difference in 15N abundance (% total N) of the sample and the 15N abundance of a control sample (natural 15N abundance), cN the total N (% of root dry weight), DW the dry weight of the root segment (g), ∆t the incubation time, FW the fresh weight of the sample incubated in the artificial soil solution (g), and M(N) the molecular weight of N (15 g mol−1).

2.8. Statistical Analysis

All statistical analyses were performed using reference [65]. A detailed list of all R packages used can be found in Table S9. A linear mixed model was fitted on the data in order to analyze differences between identification (ID; i.e., BB = pure beech; BF = beech in mixed stands or FB = fir in mixed stands, respectively), time of season (season; i.e., spring, summer, and fall, respectively), and field sites (CO; EM; CR). We fitted the model twice on the data, once including all three possible IDs (i.e., BB, BF, and FB), and again with only BB and BF, to correctly meet the requirement of hypothesis 2, if there were differences between BB and BF stands. Since the results were identical for both models, we only documented the “full” model including all three IDs.
ID, season and site were treated as fixed factors, whereas the tree number served as random factor due to the repeated measurements on the same trees. δ13C, total N, structural N, protein N, and amino acid N were the dependent variables of each model. Bulk leaf material (leaves and needles) and root material were analyzed separately. Normal distribution of residuals and homoscedasticity were checked visually (residual-fitted values–plots [66,67] and supported by the Shapiro-Wilk test when checking for normal distribution of residuals, and by Levene’s test for homoscedasticity. If these assumptions were not met, raw data were transformed by either cube root transformation, or by “Tukey’s ladder of Powers”. Subsequently, transformed data were fitted again and the assumptions were checked visually as above. Backward elimination of non-significant effects by the principle of marginality was conducted to find the best suitable model. To assess significant differences “ls-means” was used as a wrapper, comparing the means pairwise based on the model output. The same approach was used on the N uptake data, distinguishing between N sources (arginine A, glutamine G, nitrate NO3, and ammonium NH4+), site, season, and ID.
Correlation analyses were conducted using Spearman’s rank correlation coefficient (ρ) to identify relations between leaf and root bulk material and soil parameters, as well as for analyzing relationships between the N uptake capacity of the four different N sources. Soil parameters were categorized into three depths (litter, Ah-horizon, and Bv-horizon) to ensure comparability between the three investigated sites. Consequently, these three depths were correlated separately with each plant parameter. Correlation was tested for its significance and considered a “true” correlation, when ρ ≥ ±0.5 was met.

3. Results

For our first hypothesis we analyzed silver-fir and beech performance at three different sites and the first part of the results is dedicated to this hypothesis, thus including silver-fir and the two associations of beech (BB and BF). The second part, consisting mainly of bivariate correlation analysis, is dedicated to investigate our second and third hypothesis and, thus, excludes samples obtained from silver-firs (FB) for soil and plant parameter correlations. Since adult beech mainly takes up nitrogen in fall [21], we correlated soil and plant data for the fall measurements exclusively.

3.1. Inorganic Soil Nitrogen Contents in Fall

Ammonium-N contributes most to mineral soil N and was significantly higher than nitrate-N (Table S5). Mineral soil N concentrations differed significantly between the litter layer and the mineral soil (i.e., Ah and Bv). Due to high variation of inorganic nitrogen contents in the litter layer, the differences between the EM and CR sites (revealing twofold higher values compared to the CO site) and the CO site were not significant (Table S5). We observed similar patterns at the three sites, with mineral N concentrations being highest in the litter layer and decreasing significantly to the Ah- and Bv-horizon (without differences between the latter) (Table S5).

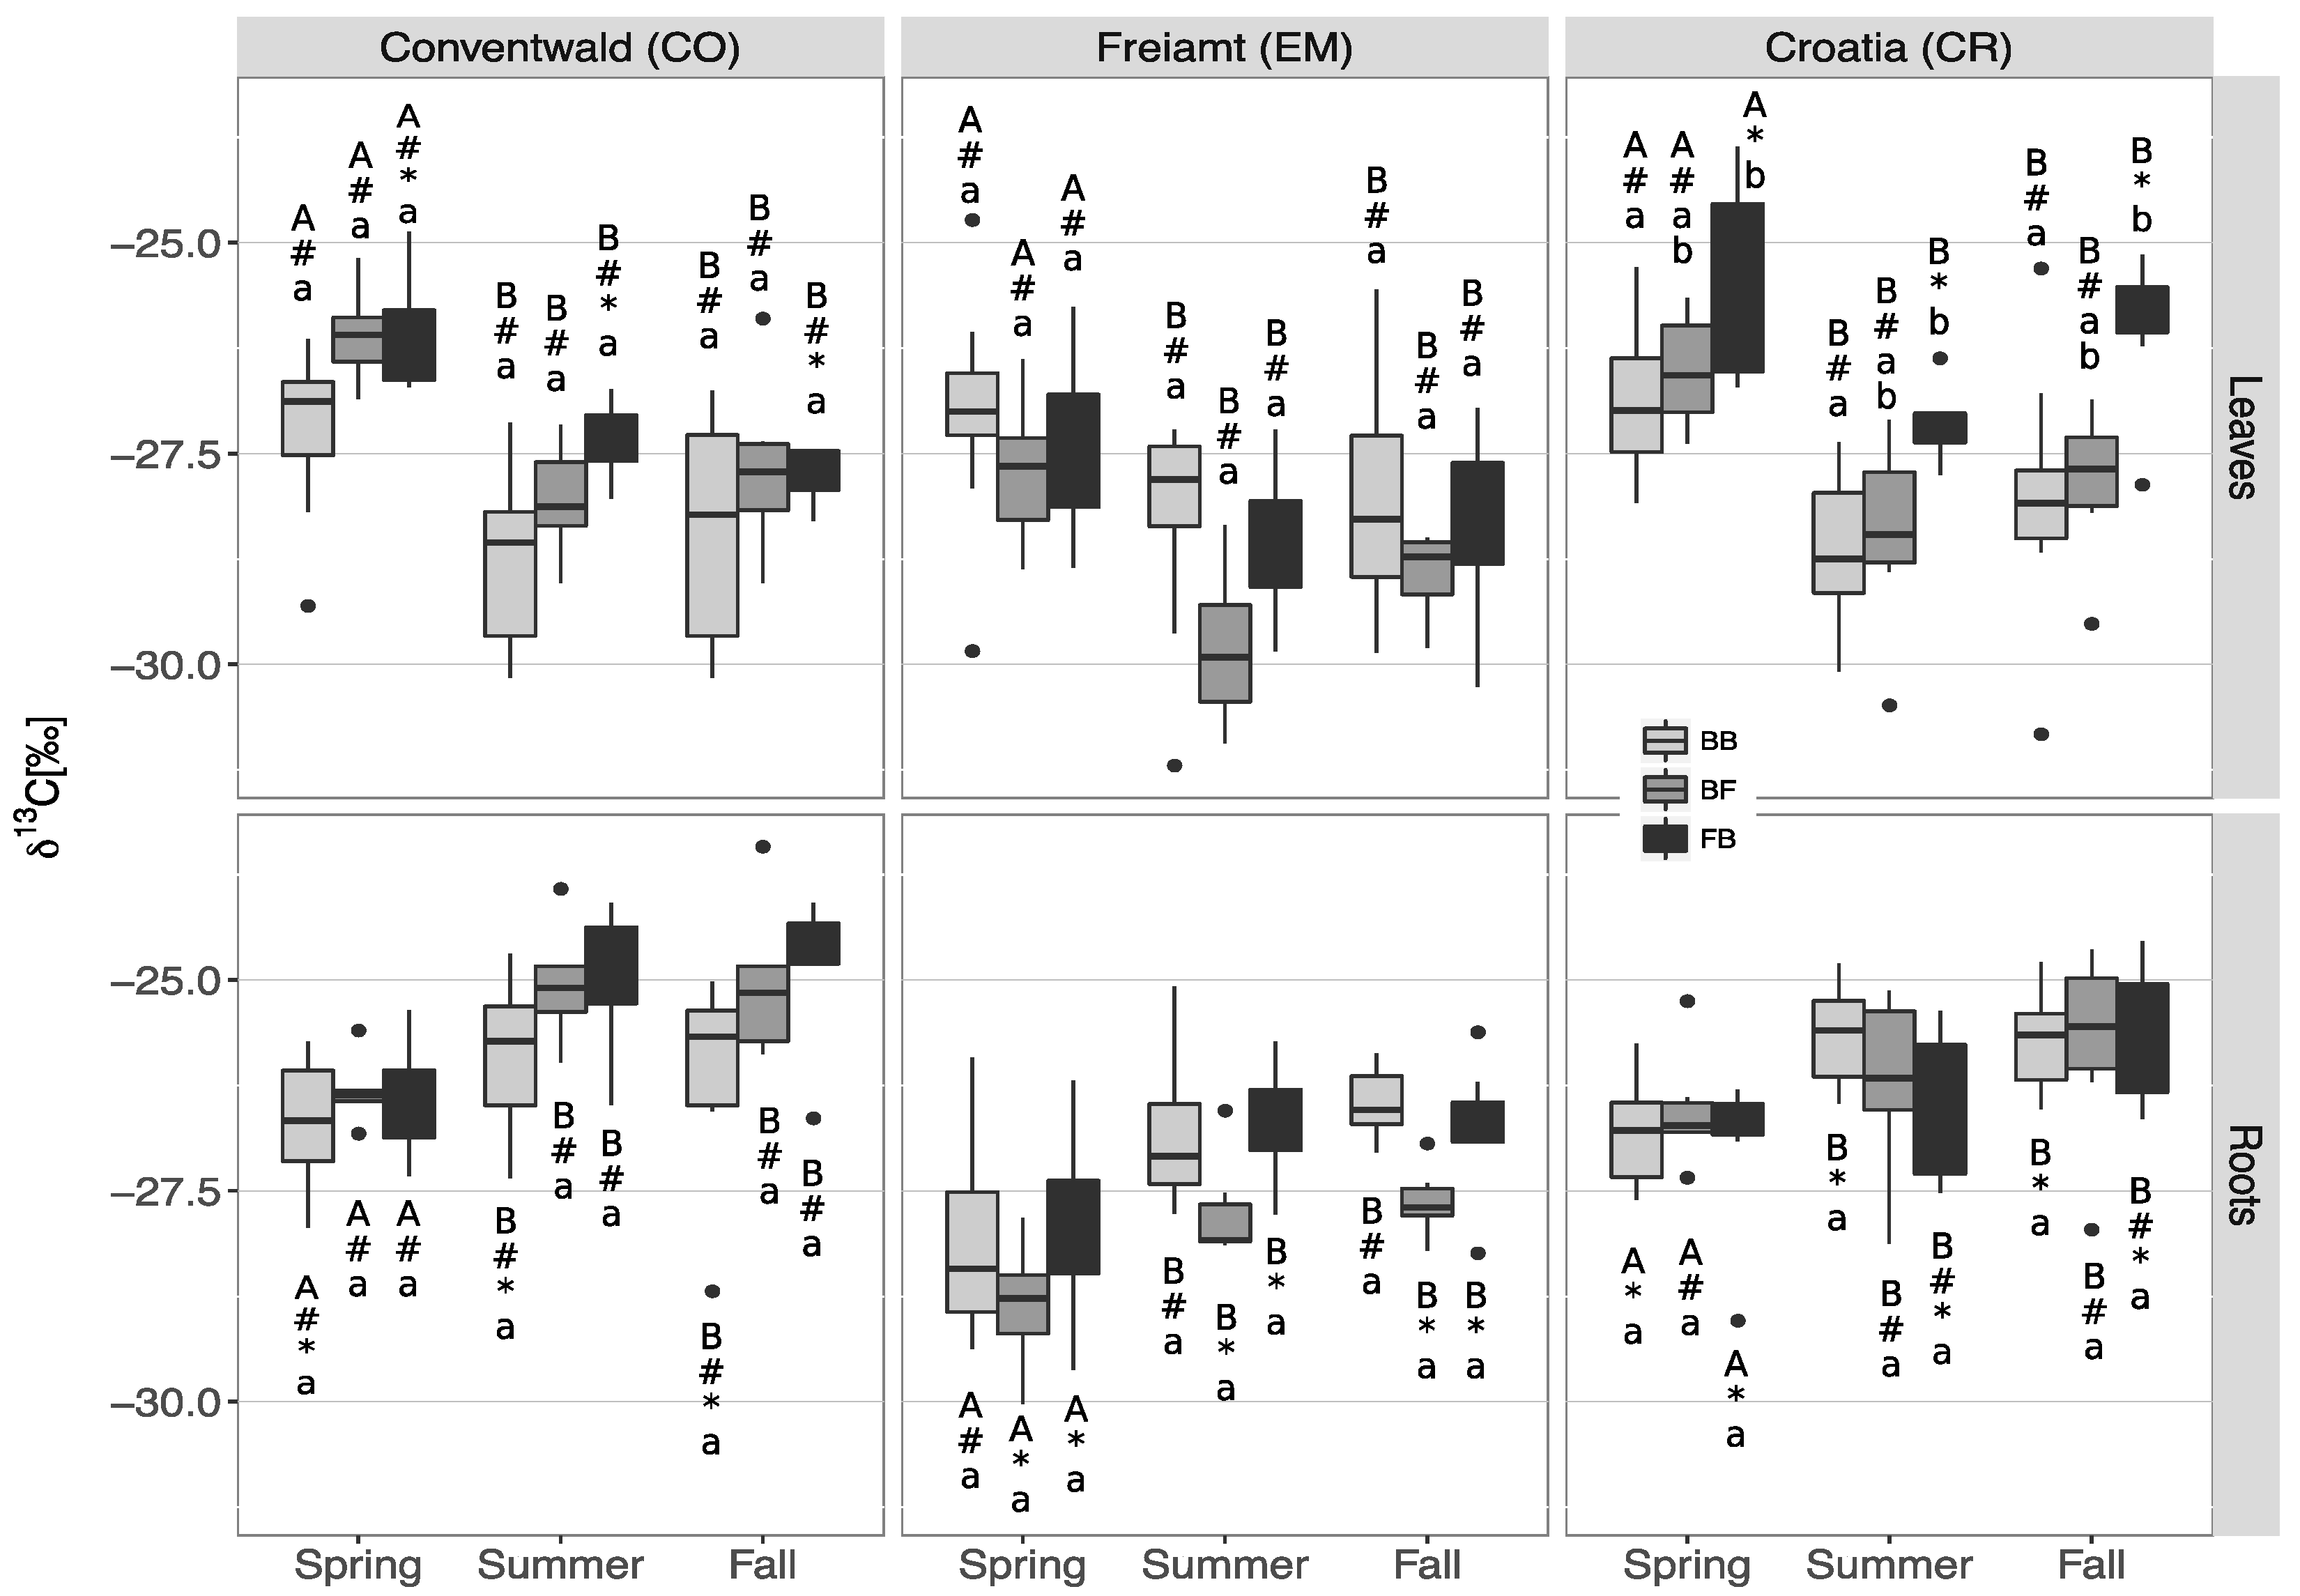
3.2. δ13C Signatures in Leaves/Needles and Roots

δ13C signatures of beech leaves and fir needles were significantly more enriched in spring, became more depleted in summer and did not differ in fall, regardless if associated in pure or mixed stands (Figure 1, Table S1). Previous as well as current year fir needles at the CR site were significantly more enriched compared to the EM site (Table S1 and S2). Compared to previous year needles, current year needles tended to be more depleted at every sampling point of the season (Table S2). We found that roots were significantly more enriched in summer and fall compared to spring at all three sites, again regardless of ID. At the CR site, fine roots signatures of pure as well as mixed beech stands were significantly more enriched compared to the EM site. We did not observe significant differences in δ13C signatures between pure and mixed beech stands at any site and at any time of the season (Table S3).

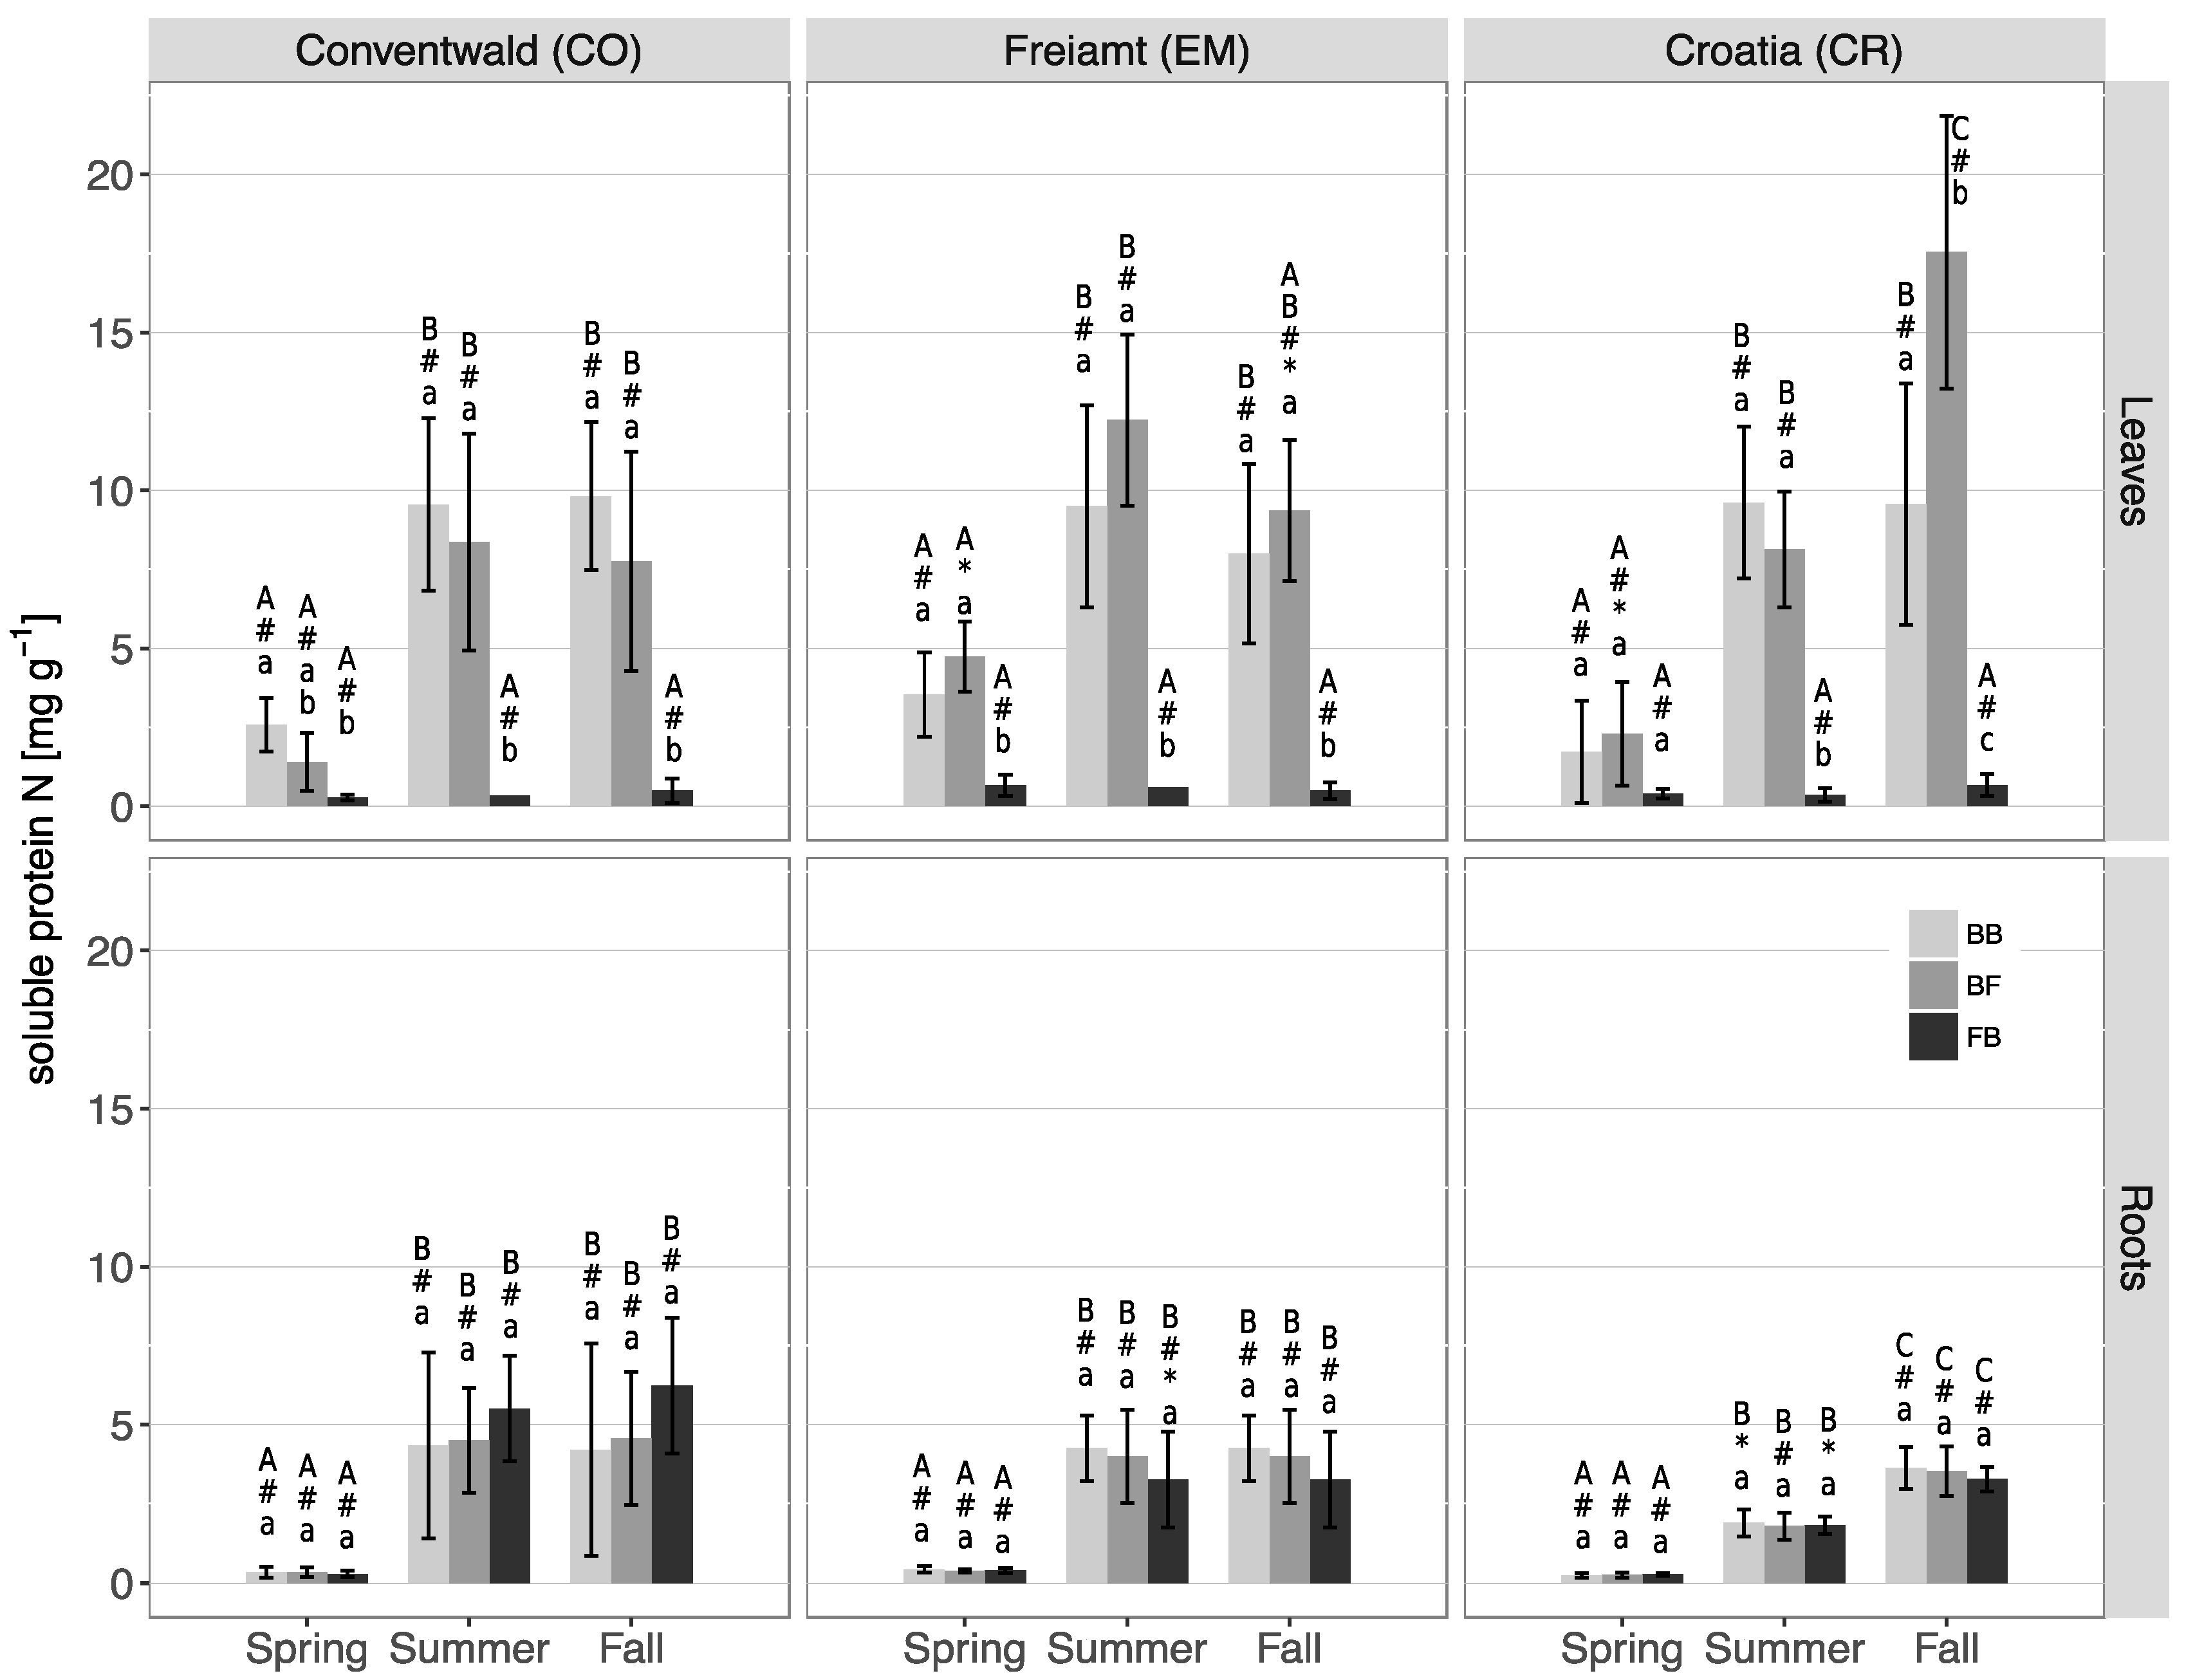
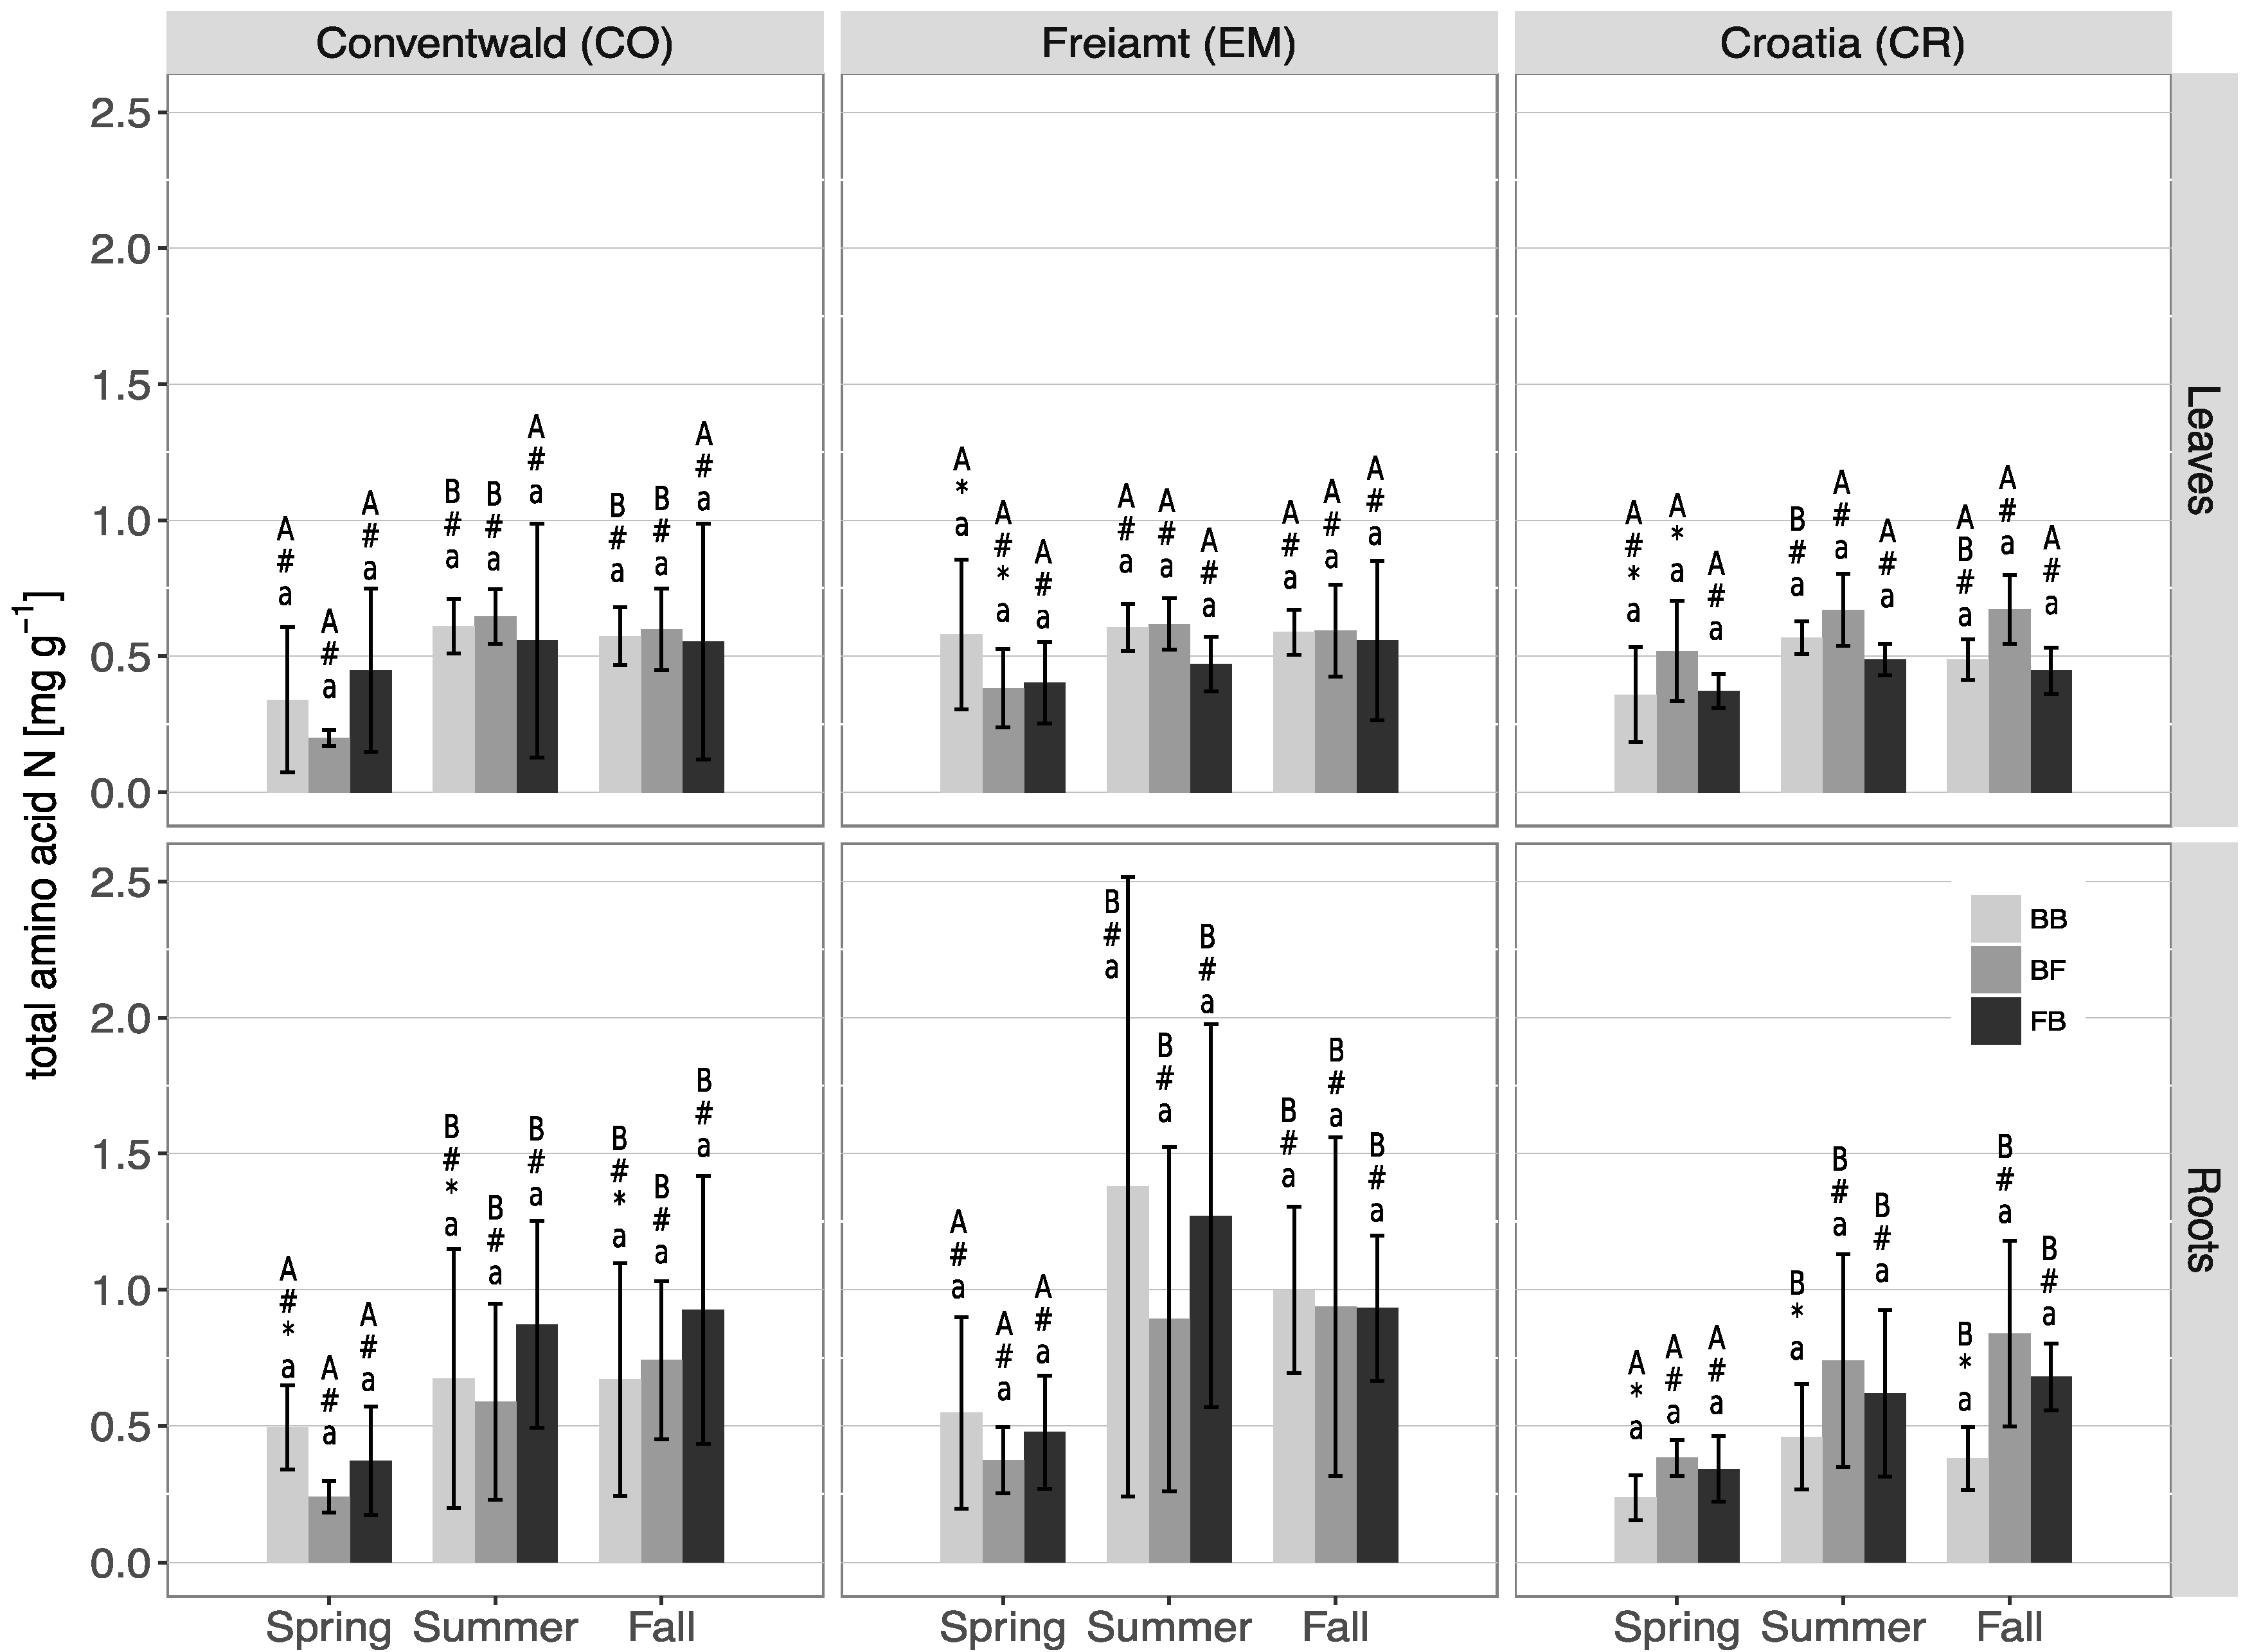
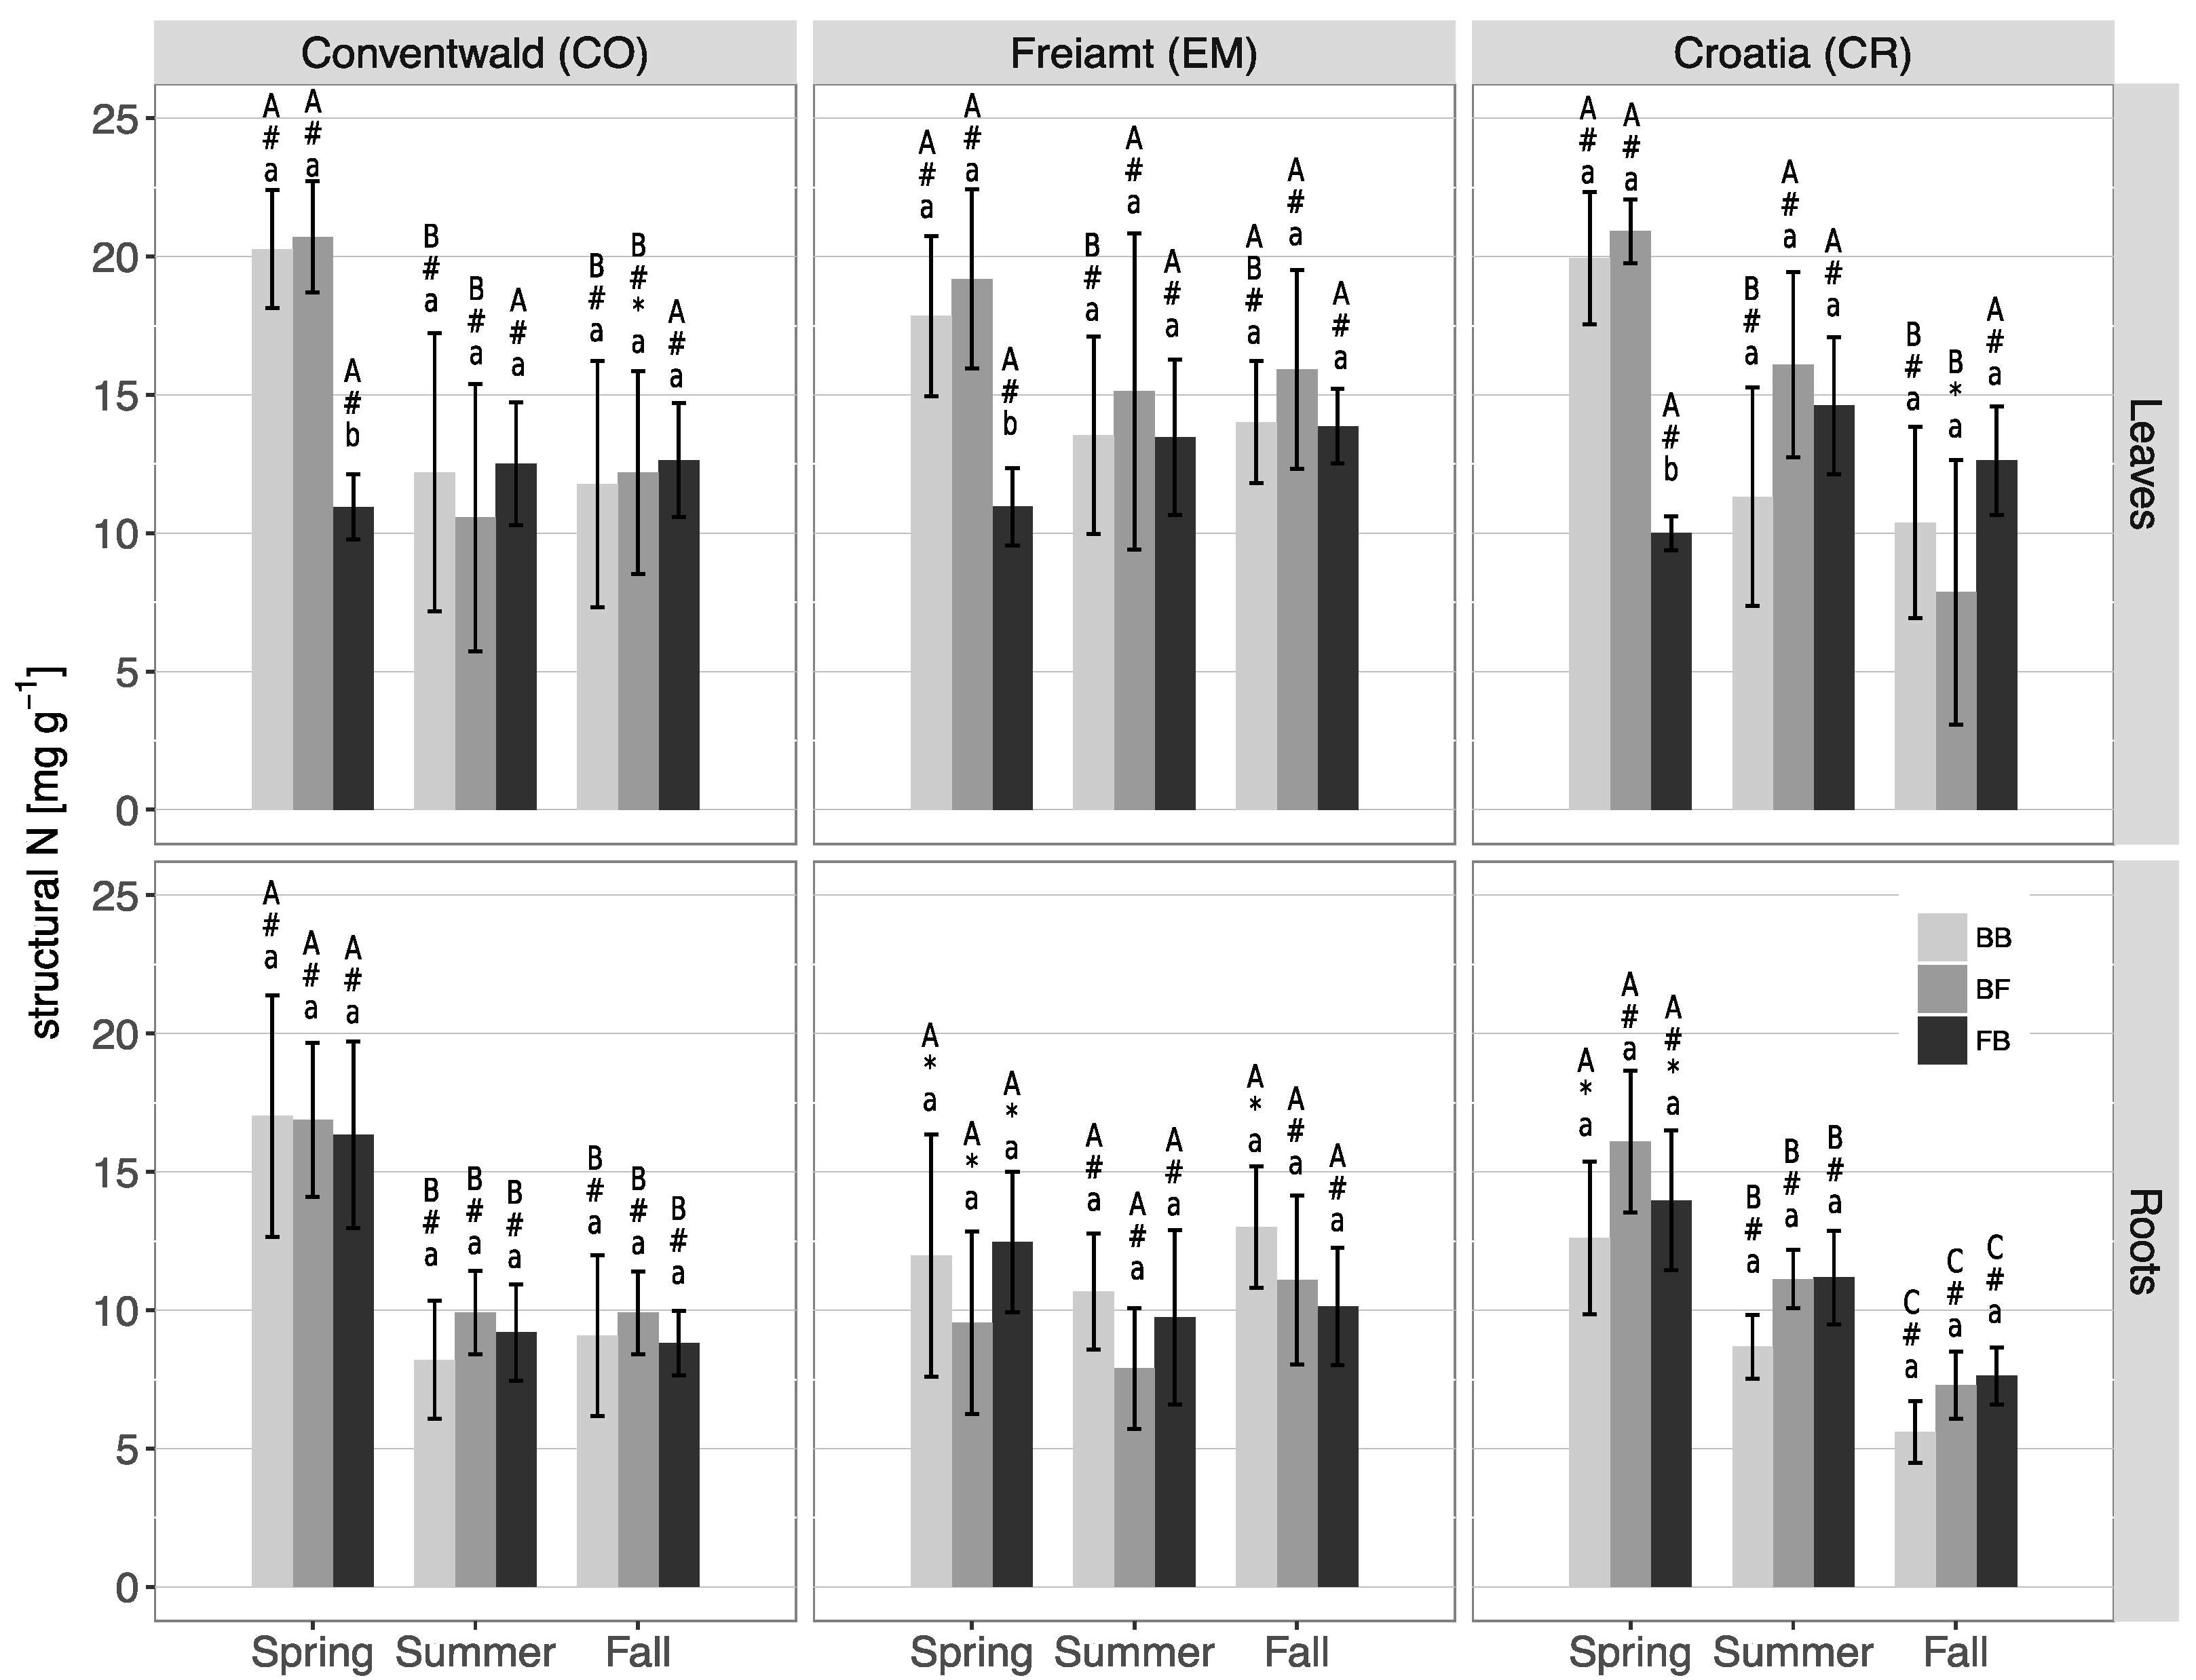
3.3. N Contents and N Partitioning in Leaves/Needles and Roots

Previous and current year fir needles revealed significantly lower total N contents over the entire season than beech leaves disregarding sites (Figure 2, Table S1). At the same time, fir fine roots exhibited more or similar amounts of total N compared to the needles (Figure 2, Tables S1 and S3). At the EM and CR site, beech leaves in mixed stands contained significantly higher amounts of total N in summer and fall compared to the CO site. We did not observe significant differences between pure and mixed beech stands due to high natural variations in beech leaf N content, except in fall at the CR site, where beeches in mixed stands revealed significantly higher amounts of total N compared to pure beeches.
While previous and current year fir needles revealed low protein N contents throughout the whole season, protein N contents of beech leaves were significantly lower in spring compared to summer and fall (Figure 3 Table S1). Differences in protein N contents were not observed between pure and mixed stands, neither in leaves nor in fine roots of beech, except at the CR site in fall where, as already observed for total N contents, protein N amounts in the mixed beeches were significantly higher compared to the pure beech stands. In fine roots, the differences between the two species were negligible throughout the seasons, but as previously observed for leaves, the protein N content in roots of both species became significantly higher from spring to summer, and even ascended more in fall at the CR site (Figure 3, Tables S1 and S3). Protein N contents of fir roots were much higher (up to five-fold) compared to needles, but similar to beech roots (Figure 3).
Total amino acid N concentrations of leaves/needles did not reveal general differences over the seasons regardless of affiliation. At the CO site, amino acid N contents of beech leaves (i.e., BB and BF) significantly increased from spring to summer and fall (Figure 4, Table S1). In fine roots, a similar increase of amino acid N concentration was significant. Beech roots from monoculture revealed the highest amino acid N concentrations at the EM, and the lowest at the CR site (Table S3). Amino acid N contents in roots of both species tended to be higher than in leaves, except for spring when similar contents were observed (Figure 4, Tables S1 and S3). Again, we did not discover differences between pure and mixed beech stands at any time or site.
For structural N a different seasonal pattern emerged. In spring, the structural N contents of beech leaves were significantly higher (CO and CR (BB)) or tended to be higher (EM and CR (BF)) compared to summer and fall (Figure 5, Table S1). In previous year fir needles, structural N was significantly lower in spring compared to beech leaves at every site. These differences vanished in summer and fall, when beech leaves became depleted in structural N. Current year needles contained more structural N than previous year needles (Table S2). In fine roots, at the CO and CR site, structural N contents dropped significantly from spring to summer and fall (Figure 5, Tables S1 and S3). Also, the structural N contents of roots in spring at the CO site were significantly higher than at the EM, and for mixed beech also at the CR site (Table S3).
Overall, we found a tendency towards improved N nutrition of beech leaves in mixed stands compared to monocultures though this trend was only rarely significant. Compared to beech leaves, silver-fir needles exhibited different N partitioning at all sites and times. Regardless of species, root N contents and partitioning deviated strongly from leaves in a season dependent manner. Differences in N partitioning between the sites were small in both leaves/needles and roots.

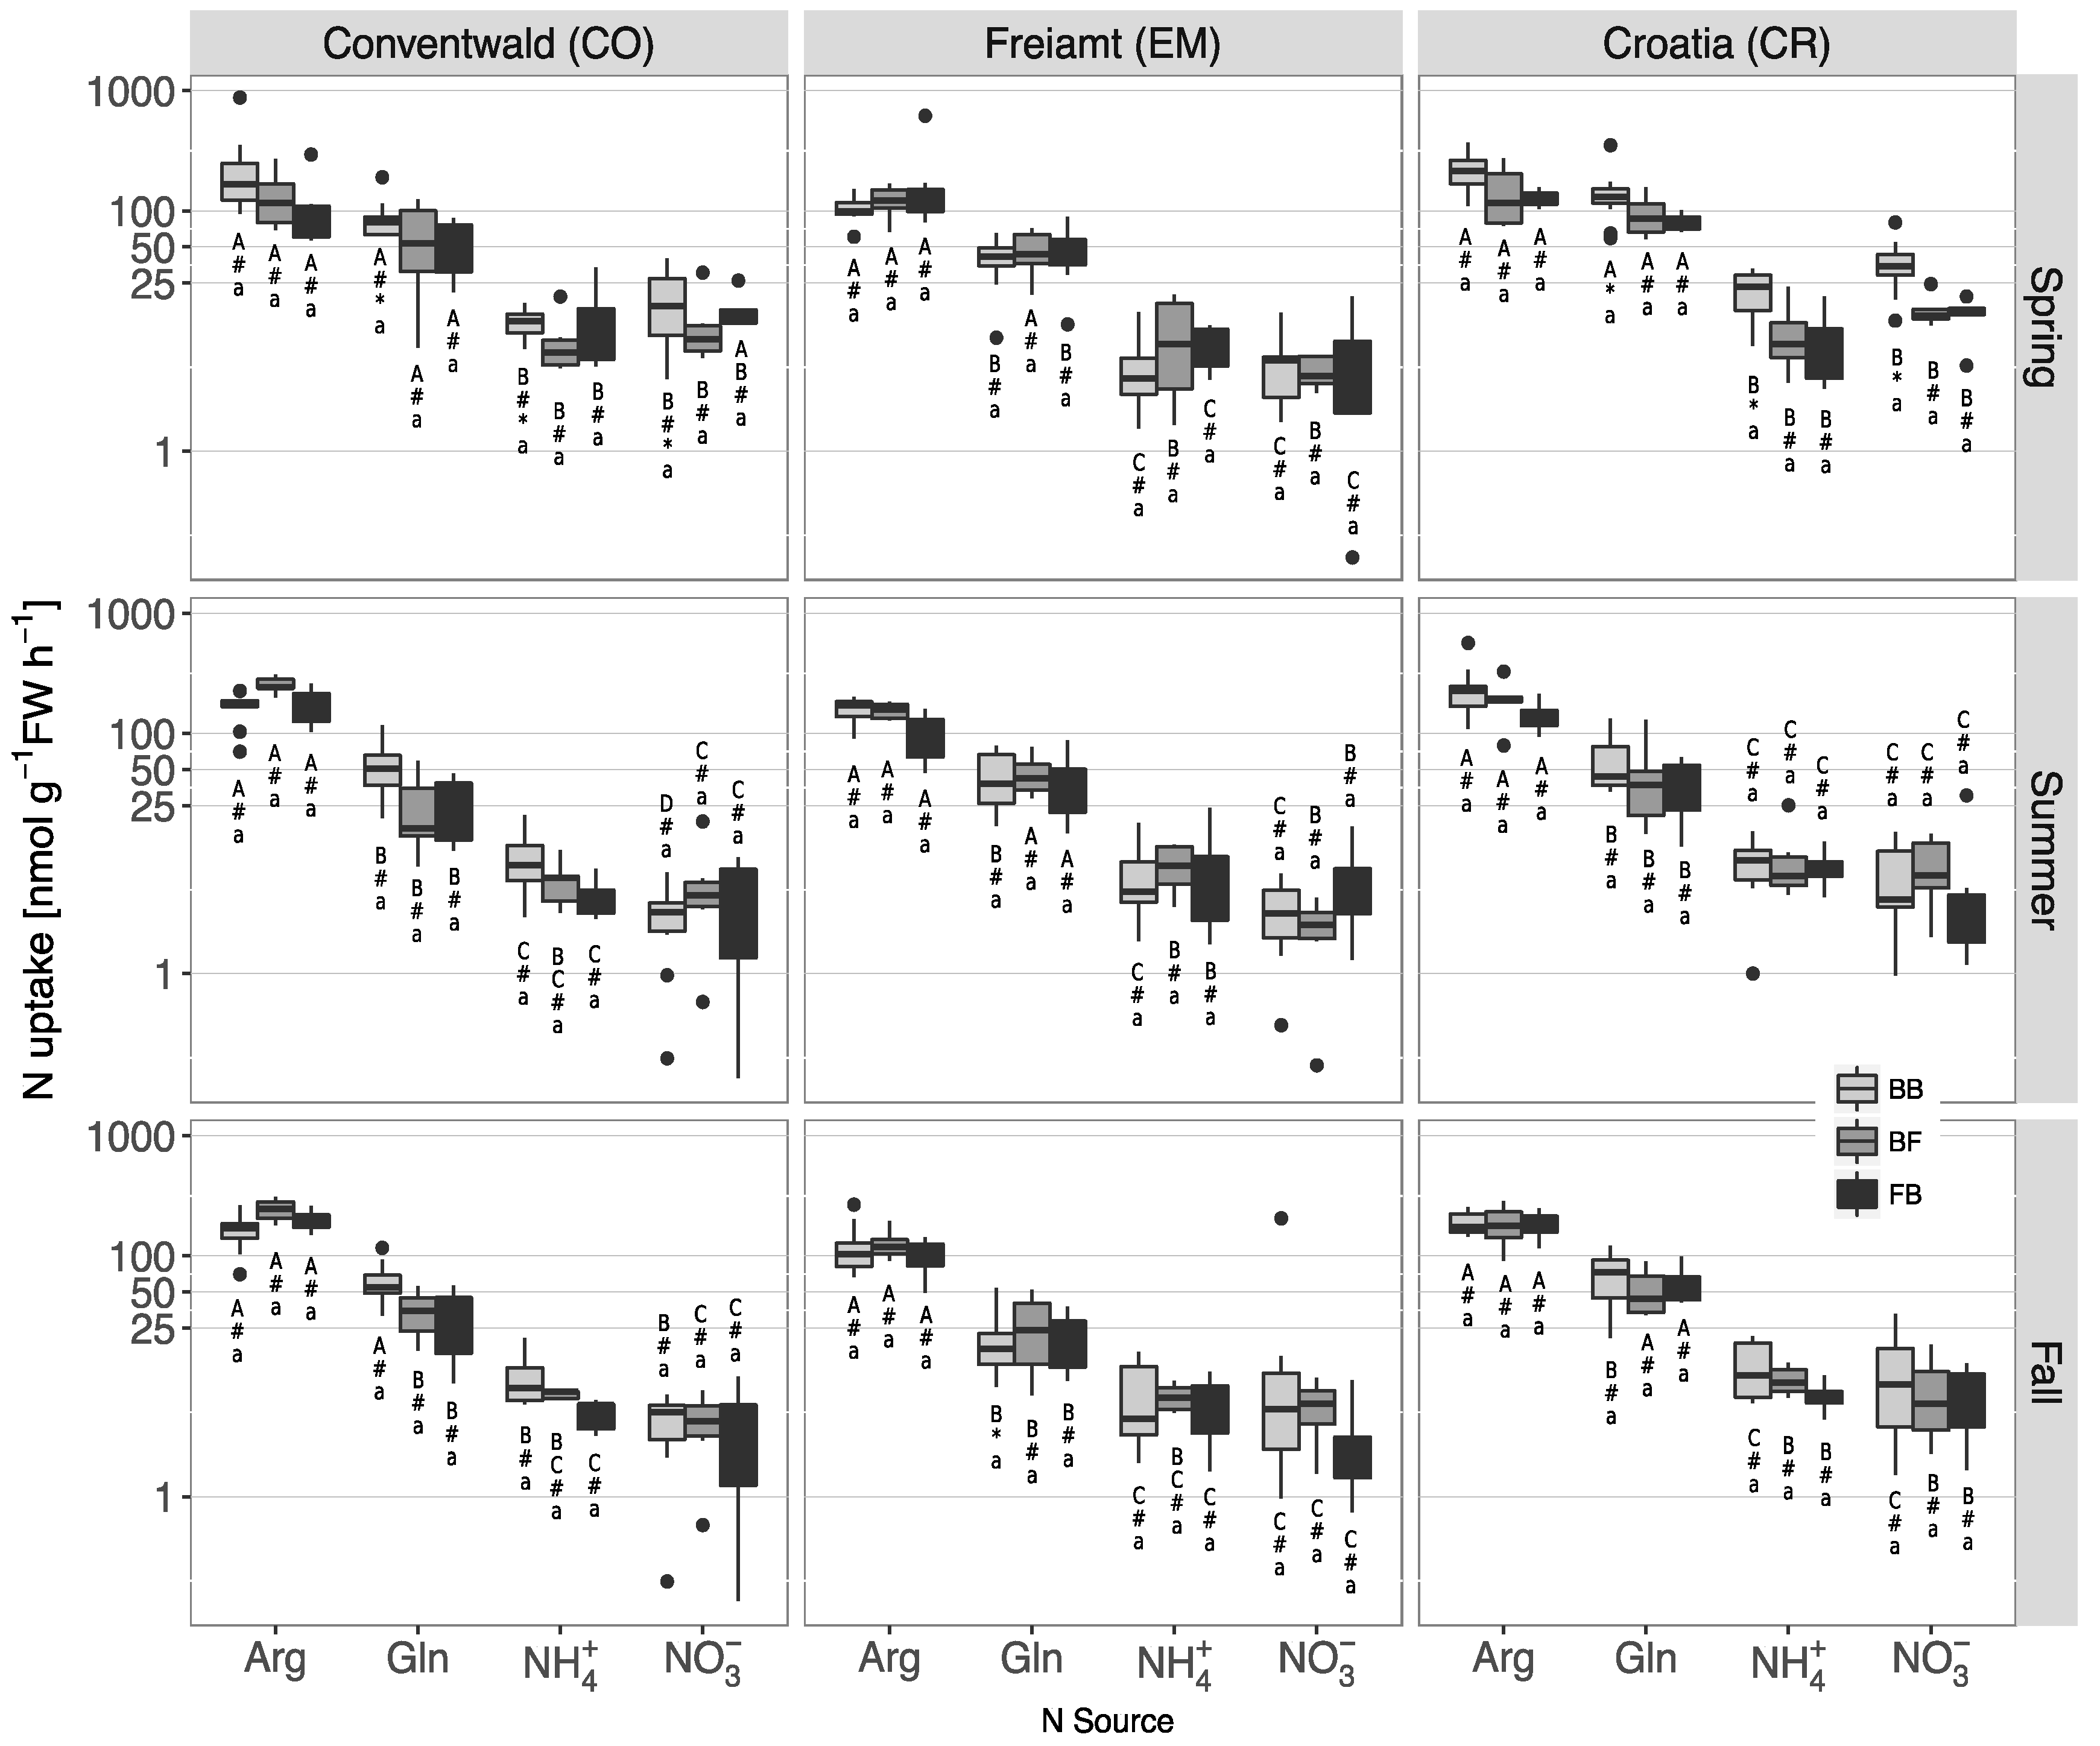
3.4. N Uptake Capacities of the Roots

Species or association effects within the same N source between beech trees in pure stands (BB), beech trees in mixed stands (BF) and firs in mixed stands (FB) were not observed, irrespective of the site or season (Figure 6, Table S3). In spring, Arg uptake capacities did not differ between the sites for both species. Gln uptake capacities of beech monoculture at the CR site revealed significantly higher values compared to the EM site. The same pattern was observed for NH4+ and NO3 uptake capacity of beech in monoculture (Table S4). Uptake capacities between each inorganic N source were similar for CO and CR, whereas the uptake capacities between organic and inorganic sources differed significantly from each other (Table S4). At the EM site, uptake capacities of pure beech and fir in mixed stands for Arg were higher compared to Gln uptake capacities, which both were higher than NH4+ and NO3 uptake capacities. Similar results were obtained in mixed stands for beech.
In summer, across the three investigated sites (CO, EM, CR), uptake capacities showed a similar pattern for every N source (Arg, Gln, NH4+, NO3). At the CO site, uptake capacities of beech in monoculture differed significantly from each other for every N source (Table S4). For BF and FB the uptake capacity for Arg was significantly higher than for Gln, which in turn was higher than the uptake capacities of both inorganic N sources. At the EM site for BF and FB neither the organic nor the inorganic N sources differed from each other, but differed from another. In beech monocultures, highest uptake capacity was observed for Arg, followed by Gln and the two inorganic sources, which did not differ from each other (Table S4). A similar pattern was found at the CR site for every affiliation (BB, BF and FB).
In fall, across the three investigated sites (CO, EM, CR), the uptake capacity pattern was similar for every N source except for pure beech at EM where Gln uptake capacity was significantly lower compared to the same association at CO and CR. When comparing the N uptake capacities for each source at each site, patterns were different from spring and summer. For beech monocultures at the CO site, neither uptake capacities of organic sources nor of inorganic sources differed amongst themselves, but differed from each other. For BF and FB Arg uptake capacity was highest, followed by Gln and the inorganic sources, which did not differ from each other. At the EM site, the latter was true for all three associations and also for BB at the CR site. For BF and FB at the CR site, neither the organic nor the inorganic N sources differed amongst themselves, but from each other (Table S4).
Overall we found inorganic N uptake capacities to be much lower compared to organic N uptake capacities, regardless of IDs, season, or site. Differences in uptake capacities between the two inorganic N sources were small and preferences were not found (Figure 6, Table S4). However, between the organic N sources, uptake capacities of Arg were often significantly higher than Gln uptake capacities. Over the seasonal course, uptake patterns differed inconsistently, though with Arg uptake capacities always being the highest.

3.5. Correlations between Environmental-, Soil-, and Plant Parameters

3.5.1. Environmental and Plant Parameters Relations

We investigated the relationship between the environmental parameters (temperature, precipitation, and altitude) on one side and the δ13Cplant in bulk leaf/needle/root material on the other side (Table 1). Correlation analyses revealed that fir (current and previous year) needle 13C correlated highly significant with altitude, indicating an enrichment in 13C with increasing altitude. This correlation was weaker for beech leaves at the mixed stand, and no correlation was found for beech trees in monoculture. Beech root δ13C in mixed stands revealed a positive correlation with altitude and precipitation, suggesting enrichment in 13C with increasing altitude and precipitation, but a strongly negative correlation with temperature, indicating a depletion in root 13C signatures with increasing air temperature.

3.5.2. Soil and Plant Parameter Relations in Fall

Inorganic soil N concentrations decreased significantly with increasing soil TN concentrations in the upper two soil layers (i.e., litter and Ah-horizon) for both IDs (i.e., BB and BF), but this effect was more pronounced at the BF stands (Table S7). At the Bv-horizon, we observed a significant increase in inorganic soil N concentrations with increasing TN, which was more pronounced at the BB stands (Table S6).
Bulk leaf parameters at the BB stands did not correlate with soil TN, SOC or inorganic N concentrations. For bulk root material, total N, amino acid N, and structural N contents decreased with increasing soil TN, SOC and inorganic N concentrations, though the correlation coefficients only indicated a weak relation, except for the Bv-horizon, where it was very pronounced. Bulk leaf δ13C signatures did not correlate with any soil parameter, whereas for bulk root δ13C signatures the correlation revealed a soft enrichment in roots with increasing TN, SOC and at the Bv-horizon also with inorganic N concentrations (Table S6).
At the BF stands, leaf total N decreased with increasing soil TN and SOC concentrations, and also with increasing inorganic N at the Bv-horizon, but increased with inorganic N in the litter layer. The same relationship applied to the protein N contents of bulk leaf material, again only for the litter layer. Leaf protein N levels decreased with increasing soil inorganic N levels measured in Ah- and Bv-horizons. Total N of bulk roots increased with increasing inorganic N contents of the Ah-horizon, and the same applied for root structural N. Bulk leaf δ13C signatures became enriched with increased levels of soil TN and SOC at the litter layer, but were depleted when inorganic N contents of the Ah-horizon increased. These observations were more pronounced for bulk root δ13C signatures, with an enrichment of 13C in the roots with increasing amounts of TN and SOC in the soil at all depths. As observed for leaf bulk δ13C signatures, root bulk δ13C became depleted when inorganic soil N increased at the Ah-horizon (Table S7).
Overall, we observed differing correlation patterns for pure and mixed beech stands in fall. Correlation analysis of plant with soil parameters revealed that for pure beech stands the relation between root and soil parameters were more pronounced and no such observation was made for bulk leaf material, whereas for mixed beech stands leaf total N exhibited a strong relation with soil TN, SOC and inorganic N concentrations. Furthermore, correlations between leaf and root δ13C on one site and the soil on the other site were more pronounced in mixed compared to pure beech stands.

3.5.3. Relations of N Uptake and Soil Parameters in Fall

For the BB stands, we observed only weak relations between increasing Arg uptake capacities and increasing soil TN, SOC and inorganic N concentrations in Ah- and Bv-horizons. For Gln uptake capacities at the Bv-horizon, the correlations were much stronger with soil TN and SOC at all three soil depths (Table S8). For NH4+ uptake capacities, the relations were again weak and only applicable at the Bv-horizon for TN, SOC, and inorganic N.
At the BF stands, increases in Arg uptake capacities were associated with increased soil TN and SOC, but not with inorganic N. The other N sources used in this experiment were not found to be related to soil parameters (Table S8).
However, we observed distinctly different uptake patterns between pure and mixed beech stands. At the BB stands, NH4+ uptake capacities were associated with increased Arg- and Gln uptake capacities, and NO3 with increased NH4+ uptake capacities (Table S8). This pattern could not be observed at the BF stands, where only a strong increase in Gln uptake capacities correlated with increased NH4+ uptake capacities (Table S8).

4. Discussion

4.1. Beech and Silver-Fir Performances are Similar at the Croatian and Black Forest Field Sites

Compared to standard nutrient levels of beech leaves, the N levels found for mixed beech at the EM and CR sites were in the lower to upper normal range, or even enhanced [68,69]. This result was surprising, since these sites were initially thought to reveal restrictive tree performance due to higher drought sensitivity (EM: higher MAAT (mean annual air temperature), less precipitation, smaller water holding capacity; CR: shallow soil profile (45 cm depth)). The foliar N concentrations of silver-fir were below the values thought to indicate a good nutrient status [70,71]. Previous year needles exhibited the lowest N amounts in spring indicating re-translocation of N into current year needles, which in turn revealed highest amounts of N in spring likely due to relocation [72]. Both, previous and current year needles highly vary in their amounts of N and range between insufficiency (<12.3 g kg−1) in spring (previous) and summer/fall (current), and the normal range (12.3–15.5 g kg−1) in fall [69]. N uptake capacities revealed high variations within the same ID (Figure 6, Table S4), but similar uptake capacities at the Black Forest and Croatian field sites.
Though all δ13Cplant signatures did not indicate water limitation (Table S1), they varied up to 5‰ between the EM and CR site. For fir needles this observation was significant, whereas beech leaves revealed no significant differences between the sites, though signatures at the CR site tended to be more enriched compared to EM. These observations might be a consequence of different site conditions. Even though the CR site revealed the highest yearly precipitation rate, precipitation in summer only amounts to a quarter of that. Also it had the most shallow soil (only up to 45 cm; Table S5), though revealing the highest water holding capacity. When investigating plant bulk material of beech along a climate gradient across Europe, a positive relation between altitude and δ13C signatures has been reported by [73]. Our field sites are located on altitudes ranging from 400 to 900 m a.s.l. and correlation analysis confirmed this positive relation, where δ13C signatures become more enriched with increasing height. This observation also has been made in previous studies with other species [74,75,76] and was attributed to the reduction of O2 partial pressure combined with an increase in assimilation rates [74].
From the present results, we were not able to confirm Hypothesis 1 regarding N partitioning or N acquisition strategies, and only partially confirmed this hypothesis for water supply and photosynthesis indicated by δ13C signatures. However, studies during a wet year subsequent to extended periods of drought are likely to show different results.
Water scarcity in beeches not only result in leaf stomatal closure and, thereby, reduced discrimination against 13CO2 in leaves, but also in a reduction of root water retrieval from the soil and reduced nutrient acquisition resulting in reduced competitiveness [77,78,79]. Concomitant with the lack of precipitation, soluble proteins in leaves and roots are degraded mediating an increase of free amino acids [80]. Ultimately, beeches react towards drought with decreasing root growth and root exudates, thereby deteriorating their nutrient uptake capacity [81]. This observation was confirmed by observations in a greenhouse experiment, where N uptake and consequent allocation of N into the fine roots was reduced [80]. Projecting these findings into years with repetitive drought periods and into consecutive dry years, the effects on forest ecosystems will be severe. Thus, the number of drought periods in dry years and also the number of dry years preceding a wet year will play a major role when investigating N nutrition during a wet year. Therefore, long-term studies are required even for evaluating N nutrition during a wet year in areas subject to climate change. Hence, the present study performed in such areas only provides “baseline” information of mixed and pure beech stands.

4.2. The Performance of Beech Tends to Be Influenced by the Presence of Silver-Fir

We did not observe any differences in N uptake capacities regardless of site or association (pure vs. mixed). Significant differences in N contents and partitioning were only rarely observed and, in these cases, indicate improved N nutrition upon fir admixture rather than competition between beech and fir for N. A possible explanation for this observation might be the similar mineral N contents at the three investigation sites (Table S5), even though the three sites were characterized by major differences in soil total nitrogen concentrations (Table S5). The similar soil mineral N concentrations may have mediated similar tree N uptake capacities (Figure 6, Table S4), and subsequently, mostly similar total N contents and N partitioning (Figure 2, Figure 3, Figure 4 and Figure 5, Tables S1–S3) at the field sites studied.
Beeches grown in mixture at the field sites more susceptible towards drought (EM and CR, see above) revealed a trend towards higher foliar N contents (Figure 2) indicating a facilitative effect of silver-fir on beech on sites where soil total N concentrations were low. It supports the “stress-gradient hypothesis” (SGH), stating that facilitation was more “common in communities developing under high physical stress (…)” [82]. According to this hypothesis, such an effect would be observable at sites providing a benign environment and at these sites competition should dominate tree performance. Therefore, the tendency towards lower total foliar N at the CO site in our study is consistent with SGH (Figure 2, Tables S1 and S5). Many studies report that species richness results in enhanced forest productivity [83]. When mixing of evergreen and deciduous species, this effect is attributed to a reduction of light competition [84,85], a greater absorption for photosynthetically active radiation [86], and improved nitrogen nutrition [87]. However, the assessment of mixture effects on the trees’ nutritional status is still a matter of debate [51,88].
From the present results we conclude that the presence of silver-fir does not cause a general change in N acquisition and partitioning of beech trees, thereby rejecting hypothesis 2. However, we also did not observe a competition effect of fir admixture on beech, indicating that beech trees experience largely the same inter- and intra-specific competition for nutrients with or without growing in mixture with silver firs at sufficient water availability.

4.3. What Is the Driving Force of the N Nutrition of Beech?

In order to assess our third hypothesis stating that soil N contents, climate and species associations interactively affect the performance of beech, we correlated environmental, soil derived and plant derived parameters with each other. We did not find a consistent general pattern that could enable us to relate any specific parameter to performance, but we rather revealed the complexity of the ecosystems investigated. Well-known and established in literature, we still could not relate soil total N and foliar N concentrations [88,89] at the pure beech stands, indicating that soil N was not a main influencing factor at these sites. This might be explained by the fact that soil total N stocks are largely bound in polymeric organic compounds, thereby not being available to plants. It is only microbial processes, such as depolymerization and ammonification, that produce the small plant-available soil monomeric organic N or mineral N pools [90]. In mixed stands, foliar N concentrations even decreased with higher soil TN concentrations [88]. In contrast, the mineral N concentrations of the litter layer revealed a positive correlation with foliar N at the mixed stands, but not mineral N concentrations at the other soil depths, indicating that at the mixed stands the litter layer can determine the N concentrations of the foliage, as previously reported [90]. Additionally, when including N uptake capacities in the equation, we found that in the pure beech stands the relationship between Gln uptake capacities and soil total N was strong, while at the mixed stand (both, beeches and firs) at the same time, Arg uptake capacities increased with increasing total N in the soil, but neither site revealed a strong relation between mineral soil N and N uptake capacities. This difference between pure to mixed stands in plant-soil interaction poses the question, how fir admixture alters soil parameters. In the mixed stands, the soil respiration was found to be decreased in comparison to the pure stands (Rehschuh and Dannenmann; personal communication). Therefore, reduced mineralization rates of soil organic matter in mixed stands due to more recalcitrant fir litter may have mediated lower N acquisition by beech roots in the mixed stands.
Thus, the present results support our third hypothesis that soil N contents, climate and species associations interactively affect the performance of beech, but it remains unclear which factor influences most/least and in which direction.

4.4. Silver-Fir Total N Contents Indicate the Roots as Storage Location

As previously observed, fir needle N contents were lower compared to beech leaves and root N contents were similar for both species [46]. Furthermore, the fir root N contents were the same as current/previous year needles or even exceeded their N contents (Tables S2 and S3). Needle N contents were comparable to the ones of Scots pine in Sweden, though revealing a higher variability [91], to the ones in Radiata Pine [92], though the ones from this study again indicated a wider range. In comparison to spruce stands in Bavaria, we found that total N contents in previous year needles were lower or similar, but similar or higher compared to values obtained from Douglas fir in the same study [88]. Evergreen species are thought to store N mainly in the youngest age class of needles [93,94,95], where N is mostly stored in the form of photosynthetic proteins (i.e., RuBisCo) [96,97] and provided for initial growth and development to the next needle generation [98]. For silver-fir this view cannot be confirmed from the present observations, since we (a) found similar/exceeding amounts of total N in the roots of fir, and (b) could neither find decreased amounts of protein N in previous year needles in spring nor increased amounts in fall. Therefore, we propose that N storage in roots of silver firs plays a major role, as previously observed for the evergreen Nothofagus fusca [99].

5. Conclusions

At sufficient water availability, beneficial effects of silver-fir on the N nutrition of beeches might be restricted to sites with low N supply, where an increase in soil available N would increase the nutritional status of the trees. Additionally, in future studies a closer interrelation of soil and tree analyses would improve the assessment of dependencies of the alteration of plant and soil parameters. In the present study, the analyses of soil parameters remained only at a descriptive level.

Supplementary Materials

The following are available online at https://www.mdpi.com/1999-4907/9/12/733/s1, Table S1: δ13C signatures and N partitioning of the previous year leaves/needles sorted by site, season and ID, Table S2: δ13C signatures and N partitioning of the current year leaves/needles sorted by site, season and ID, Table S3: δ13C signatures and N partitioning of the roots sorted by site, season and ID, Table S4: Net N uptake capacities of beech and fir roots sorted by site, N source, season and ID, Table S5: Basic climate, vegetation, and soil properties of the investigated field sites, Table S6: Correlation between pure beech plant parameters and soil parameters in fall, Table S7: Correlation between mixed beech plant parameters and soil parameters in fall, Table S8: Correlation between N uptake capacities of pure and mixed beech stands in fall, Table S9: Packages used in statistical analysis in R.

Author Contributions

R.-K.M. and F.Y. contributed equally to this work. Conceptualization: M.D. and H.R.; data curation: R.-K.M., F.Y., S.R., M.B. and R.P.; formal analysis: R.-K.M. and S.R.; funding acquisition: M.D. and H.R.; investigation: R.-K.M., F.Y., S.R. and M.B.; project administration: T.B., M.I. and H.R.; resources: T.B. and M.I.; supervision: M.D. and H.R.; visualization: R.-K.M.; writing—original draft: R.-K.M., F.Y. and S.R.; writing—review and editing: R.P., M.D. and H.R.

Funding

The present study is part of the project “Buchen-Tannen-Mischwälder zur Anpassung von Wirtschaftswäldern an Extremereignisse des Klimawandels (BuTaKli)” within the program “Waldklimafonds” (No. 28W-C-1-069-01) which was financially supported via the Bundesanstalt für Landwirtschaft und Ernährung (BLE), Germany, by the Bundesministerium für Ernährung und Landwirtschaft (BMEL) and the Bundesministerium für Umwelt, Naturschutz, Bau und Reaktorsicherheit (BMUB) based on the decision of the German Federal Parliament.

Acknowledgments

We gratefully acknowledge the help of Cornelia Herschbach, Monika Eiblmeier, Marcus Zistl-Schlingmann, Jan Holweg, Lukas Krentzel, Martin Fuchs, and Jannik Menz during sample collection and lab work. Data on tree composition of the forest stands were kindly provided by the forestry districts “Breisgau-Hochschwarzwald” and “Emmendingen”. We sincerely thank the forest administration in Gospic (Croatia) for information on the local forest sites and support whenever needed. In addition, we express our gratitude to Friederike Lang and Jaane Krüger for providing soil analysis data from the Conventwald site.

Conflicts of Interest

The authors declare no conflict of interest.

References

  1. Taberlet, P.; Fumagalli, L.; Wust-Saucy, A.G.; Cosson, J.F. Comparative Phylogeography and Postglacial Colonization Routes in Europe. Mol. Ecol. 1998, 7, 453–464. [Google Scholar] [CrossRef] [PubMed]
  2. Konnert, M.; Bergmann, F. The Geographical Distribution of Genetic Variation of Silver Fir (Abies alba, Pinaceae) in Relation to Its Migration History. Plant Syst. Evol. 1995, 196, 19–30. [Google Scholar] [CrossRef]
  3. Magri, D.; Vendramin, G.G.; Comps, B.; Dupanloup, I.; Geburek, T.; Gömöry, D.; Latałowa, M.; Litt, T.; Paule, L.; Roure, J.M.; et al. A New Scenario for the Quaternary History of European Beech Populations: Palaeobotanical Evidence and Genetic Consequences. New Phytol. 2006, 171, 199–221. [Google Scholar] [CrossRef] [PubMed]
  4. Demesure, B.; Comps, B.; Petit, R.J. Chloroplast DNA Phylogeography of the Common Beech (Fagus sylvatica L.) in Europe. Evolution 1996, 50, 2515–2520. [Google Scholar] [CrossRef] [PubMed]
  5. Ellenberg, H. Vegetation Ecology of Central Europe; Cambridge University Press: Cambridge, UK, 1988. [Google Scholar]
  6. Fang, J.; Lechowicz, M.J. Climatic Limits for the Present Distribution of Beech (Fagus L.) Species in the World. J. Biogeogr. 2006, 33, 1804–1819. [Google Scholar] [CrossRef]
  7. Ellenberg, H.; Leuschner, C. Vegetation Mitteleuropas Mit Den Alpen: In Ökologischer, Dynamischer Und Historischer Sicht; UTB Ulmer: Stuttgart, Germany, 2010; p. 1333. [Google Scholar]
  8. Frey, W.; Lösch, R. Geobotanik; Spektrum Akademischer Verlag: Heidelberg, Germany, 2010; p. 600. [Google Scholar]
  9. Ellenberg, H. Vegetation Ecology of Central Europe, 4th ed.; Cambridge University Press: Cambridge, UK, 2009. [Google Scholar]
  10. Tinner, W.; Colombaroli, D.; Heiri, O.; Henne, P.D.; Steinacher, M.; Untenecker, J.; Vescovi, E.; Allen, J.R.M.; Carraro, G.; Conedera, M.; et al. The Past Ecology of Abies alba Provides New Perspectives on Future Responses of Silver Fir Forests to Global Warming. Ecol. Monogr. 2013, 83, 419–439. [Google Scholar] [CrossRef]
  11. Oberdorfer, E. Süddeutsche Pflanzengesellschaften; Gustav Fischer Verlag: Jena, Germany, 1957; p. 564. [Google Scholar]
  12. Blanco, E.; Casado, M.A.; Costa, M.; Escribano, R.; García, M.; Génova, M.; Gómez, A.; Gómez, F.; Moreno, J.C.; Morla, C. Los Bosques Ibéricos. Una Interpretación Geobotánica, 4th ed.; Planeta: Barcelona, Spain, 1997; p. 572. [Google Scholar]
  13. Schraml, U.; Volz, K. Conversion of Coniferous Forests in Social and Political Perspectives. Findings from Selected Countries with Special Respect to Germany. Norway Spruce Convers.—Options Conseq. EFI Res. Rep. 2004, 18, 97–119. [Google Scholar]
  14. Guckland, A.; Jacob, M.; Flessa, H.; Thomas, F.M.; Leuschne, C. Acidity, Nutrient Stocks, and Organic-Matter Content in Soils of a Temperate Deciduous Forest with Different Abundance of European Beech (Fagus sylvatica L.). J. Plant Nutr. Soil Sci. 2009, 172, 500–511. [Google Scholar] [CrossRef]
  15. Lichtenthaler, H.K. The Stress Concept in Plants: An Introduction. Ann. N. Y. Acad. Sci. 1998, 851, 187–198. [Google Scholar] [CrossRef] [PubMed]
  16. Kunstler, G.; Curt, T.; Bouchaud, M.; Lepart, J. Growth, Mortality, and Morphological Response of European Beech and Downy Oak along a Light Gradient in Sub-Mediterranean Forest. Can. J. For. Res. 2005, 35, 1657–1668. [Google Scholar] [CrossRef]
  17. Curt, T.; Coll, L.; Prévosto, B.; Balandier, P.; Kunstler, G.; Truţǎ, E.; Cǎpraru, G.; Surdu, Ş.; Zamfirache, M.M.; Olteanu, Z.; et al. Plasticity in Growth, Biomass Allocation and Root Morphology in Beech Seedlings as Induced by Irradiance and Herbaceous Competition. Ann. For. Sci. 2005, 59, 51–60. [Google Scholar] [CrossRef]
  18. Bonosi, L. The Influence of Light and Size on Photosynthetic Performance, Light, Interception, Biomass Partitioning and Tree Architecture in Open Grown Acer pseudoplatanus, Fraxinus excelsior and Fagus sylvatica Seedlings; Albert-Ludwigs-Univ., Waldbau-Inst.: Freiburg, Germany, 2006. [Google Scholar]
  19. Petritan, A.M.; von Lüpke, B.; Petritan, I.C. Influence of Light Availability on Growth, Leaf Morphology and Plant Architecture of Beech (Fagus sylvatica L.), Maple (Acer pseudoplatanus L.) and Ash (Fraxinus excelsior L.) Saplings. Eur. J. For. Res. 2009, 128, 61–74. [Google Scholar] [CrossRef]
  20. Johnson, J.D.; Tognetti, R.; Michelozzi, M.; Pinzauti, S.; Minotta, G.; Borghetti, M. Ecophysiological Responses of Fagus sylvatica Seedlings to Changing Light Conditions—The Interaction of Light Environment and Soil Fertility on Seedling Physiology. Physiol. Plant 1997, 101, 124–134. [Google Scholar] [CrossRef]
  21. Simon, J.; Dannenmann, M.; Gasche, R.; Holst, J.; Mayer, H.; Papen, H.; Rennenberg, H. Competition for Nitrogen between Adult European Beech and Its Offspring Is Reduced by Avoidance Strategy. For. Ecol. Manag. 2011, 262, 105–114. [Google Scholar] [CrossRef]
  22. Petritan, A.M.; Von Lüpke, B.; Petritan, I.C. Effects of Shade on Growth and Mortality of Maple (Acer pseudoplatanus), Ash (Fraxinus excelsior) and Beech (Fagus sylvatica) Saplings. Forestry 2007, 80, 397–412. [Google Scholar] [CrossRef]
  23. Annighöfer, P. Stress Relief through Gap Creation? Growth Response of a Shade Tolerant Species (Fagus sylvatica L.) to a Changed Light Environment. For. Ecol. Manag. 2018, 415, 139–147. [Google Scholar]
  24. Fotelli, M.N.; Rennenberg, H.; Holst, T.; Mayer, H.; Geßler, A. Carbon Isotope Composition of Various Tissues of Beech (Fagus sylvatica) Regeneration Is Indicative of Recent Environmental Conditions within the Forest Understorey. New Phytol. 2003, 159, 229–244. [Google Scholar] [CrossRef]
  25. Peuke, A.D.; Gessler, A.; Rennenberg, H. The Effect of Drought on C and N Stable Isotopes in Different Fractions of Leaves, Stems and Roots of Sensitive and Tolerant Beech Ecotypes. Plant Cell Environ. 2006, 29, 823–835. [Google Scholar] [CrossRef]
  26. Röhrig, E.; Bartsch, N.; von Lüpke, B.; Dengler, A. Waldbau Auf Ökologischer Grundlage; Ulmer: Stuttgart, Germany, 2006; p. 479. [Google Scholar]
  27. Schlesinger, W.H.; Dietze, M.C.; Jackson, R.B.; Phillips, R.P.; Rhoades, C.C.; Rustad, L.E.; Vose, J.M. Forest Biogeochemistry in Response to Drought. Glob. Chang. Biol. 2016, 22, 2318–2328. [Google Scholar] [CrossRef] [PubMed]
  28. Allen, C.D.; Macalady, A.K.; Chenchouni, H.; Bachelet, D.; McDowell, N.; Vennetier, M.; Kitzberger, T.; Rigling, A.; Breshears, D.D.; Hogg, E.H. (Ted); et al. A Global Overview of Drought and Heat-Induced Tree Mortality Reveals Emerging Climate Change Risks for Forests. For. Ecol. Manag. 2010, 259, 660–684. [Google Scholar] [CrossRef]
  29. Vitali, V.; Forrester, D.I.; Bauhus, J. Know Your Neighbours: Drought Response of Norway Spruce, Silver Fir and Douglas Fir in Mixed Forests Depends on Species Identity and Diversity of Tree Neighbourhoods. Ecosystems 2018, 21, 1215–1229. [Google Scholar] [CrossRef]
  30. Kreuzwieser, J.; Gessler, A. Global Climate Change and Tree Nutrition: Influence of Water Availability. Tree Physiol. 2010, 30, 1221–1234. [Google Scholar] [CrossRef] [PubMed]
  31. Choat, B.; Jansen, S.; Brodribb, T.J.; Cochard, H.; Delzon, S.; Bhaskar, R.; Bucci, S.J.; Feild, T.S.; Gleason, S.M.; Hacke, U.G.; et al. Global Convergence in the Vulnerability of Forests to Drought. Nature 2012, 491, 752–755. [Google Scholar] [CrossRef] [PubMed]
  32. Fuhrer, J.; Beniston, M.; Fischlin, A.; Frei, C.; Goyette, S.; Jasper, K.; Pfister, C. Climate Risks and Their Impact on Agriculture and Forests in Switzerland. Clim. Chang. 2006, 79, 79–102. [Google Scholar] [CrossRef] [Green Version]
  33. McDowell, N.; Pockman, W.T.; Allen, C.D.; Breshears, D.D.; Cobb, N.; Kolb, T.; Plaut, J.; Sperry, J.; West, A.; Williams, D.G.; et al. Mechanisms of Plant Survival and Mortality during Drought: Why Do Some Plants Survive While Others Succumb to Drought? New Phytol. 2008, 178, 719–739. [Google Scholar] [CrossRef] [PubMed]
  34. Breshears, D.D.; Cobb, N.S.; Rich, P.M.; Price, K.P.; Allen, C.D.; Balice, R.G.; Romme, W.H.; Kastens, J.H.; Floyd, M.L.; Belnap, J.; et al. Regional Vegetation Die-off in Response to Global-Change-Type Drought. Proc. Natl. Acad. Sci. USA 2005, 102, 15144–15148. [Google Scholar] [CrossRef] [PubMed]
  35. Bigler, C.; Bräker, O.U.; Bugmann, H.; Dobbertin, M.; Rigling, A. Drought as an Inciting Mortality Factor in Scots Pine Stands of the Valais, Switzerland. Ecosystems 2006, 9, 330–343. [Google Scholar] [CrossRef]
  36. Rennenberg, H.; Seiler, W.; Matyssek, R.; Gessler, A.; Kreuzwieser, J. European Beech (Fagus sylvatica L.)—A Forest Tree without Future in the South of Central Europe. Allg. Forst Und Jagdzeitung 2004, 175, 210–224. [Google Scholar]
  37. IPCC. Climate Change 2013: The Physical Science Basis. Contribution of Working Group I to the Fifth Assessment Report of the Intergovernmental Panel on Climate Change; Cambridge University Press: Cambridge, UK; New York, NY, USA, 2013; p. 1535. [Google Scholar]
  38. Lindner, M.; Maroschek, M.; Netherer, S.; Kremer, A.; Barbati, A.; Garcia-Gonzalo, J.; Seidl, R.; Delzon, S.; Corona, P.; Kolström, M.; et al. Climate Change Impacts, Adaptive Capacity, and Vulnerability of European Forest Ecosystems. For. Ecol. Manag. 2010, 259, 698–709. [Google Scholar] [CrossRef]
  39. BMEL. Der Wald in Deutschland: Ausgewählte Ergebnisse Der Dritten Bundeswaldinventur; Bundesministerium Für Ernährung Und Landwirtschaft: Berlin, Germany, 2014. [Google Scholar]
  40. Puettmann, K.J.; Coates, K.D.; Messier, C. A Critique of Silviculture. Managing for Complexity; Island Press: Washington DC, USA, 2008; p. 189. [Google Scholar]
  41. Fritz, P.; Jenssen, M. Ökologischer Waldumbau in Deutschland–Fragen Antworten, Perspektiven; Oekom: München, Germany, 2006; p. 351. [Google Scholar]
  42. Robakowski, P.; Wyka, T.; Samardakiewicz, S.; Kierzkowski, D. Growth, Photosynthesis, and Needle Structure of Silver Fir (Abies alba Mill.) Seedlings under Different Canopies. For. Ecol. Manag. 2004, 201, 211–227. [Google Scholar] [CrossRef]
  43. Lebourgeois, F.; Gomez, N.; Pinto, P.; Mérian, P. Mixed Stands Reduce Abies alba Tree-Ring Sensitivity to Summer Drought in the Vosges Mountains, Western Europe. For. Ecol. Manag. 2013, 303, 61–71. [Google Scholar] [CrossRef]
  44. PALUCH, J.G.; GRUBA, P. Effect of Local Species Composition on Topsoil Properties in Mixed Stands with Silver Fir (Abies alba Mill.). Forestry 2012, 85, 413–426. [Google Scholar] [CrossRef]
  45. Koch, A.S.; Matzner, E. Heterogeneity of Soil and Soil Solution Chemistry under Norway Spruce (Picea abies Karst.) and European Beech (Fagus sylvatica L.) as Influenced by Distance from the Stem Basis. Plant Soil 1993, 151, 227–237. [Google Scholar] [CrossRef]
  46. Magh, R.-K.; Grün, M.; Knothe, V.E.; Stubenazy, T.; Tejedor, J.; Dannenmann, M.; Rennenberg, H. Silver-Fir (Abies alba MILL.) Neighbors Improve Water Relations of European Beech (Fagus sylvatica L.), but Do Not Affect, N. Nutrition. Trees 2018, 32, 337–348. [Google Scholar] [CrossRef]
  47. Caldwell, M.M.; Dawson, T.E.; Richards, J.H. Hydraulic Lift: Consequences of Water Efflux from the Roots of Plants. Oecologia 1998, 113, 151–161. [Google Scholar] [CrossRef] [PubMed]
  48. Simon, J.; Li, X.; Rennenberg, H.; Näsholm, T. Competition for Nitrogen between European Beech and Sycamore Maple Shifts in Favour of Beech with Decreasing Light Availability. Tree Physiol. 2014, 34, 49–60. [Google Scholar] [CrossRef] [PubMed]
  49. Chen, H.Y.; Klinka, K.; Mathey, A.-H.; Wang, X.; Varga, P.; Chourmouzis, C. Are Mixed-Species Stands More Productive than Single-Species Stands: An Empirical Test of Three Forest Types in British Columbia and Alberta. Can. J. For. Res. 2003, 33, 1227–1237. [Google Scholar] [CrossRef]
  50. Casper, B.B.; Jackson, R.B. Plant Competition Underground. Annu. Rev. Ecol. Syst. 1997, 28, 545–570. [Google Scholar] [CrossRef]
  51. Rothe, A.; Binkley, D. Nutritional Interactions in Mixed Species Forests: A. Synthesis. Can. J. For. Res. 2001, 31, 1855–1870. [Google Scholar] [CrossRef]
  52. Dannenmann, M.; Bimüller, C.; Gschwendtner, S.; Leberecht, M.; Tejedor, J.; Bilela, S.; Gasche, R.; Hanewinkel, M.; Baltensweiler, A.; Kögel-Knabner, I.; et al. Climate Change Impairs Nitrogen Cycling in European Beech Forests. PLoS ONE 2016, 11, e0158823. [Google Scholar] [CrossRef] [PubMed]
  53. Hoffmann, G. Die Untersuchung von Böden—Methodenbuch Band 1, 4th ed.; VDLUFA-Verlag: Darmstadt, Germany, 1991. [Google Scholar]
  54. Arbeitskreis Standortskartierung. Forstliche Standortsaufnahme: Begriffe, Definitionen, Einteilungen, Kennzeichnungen, Erläuterungen, 7th ed.; Arbeitskreis Standortskartierung in der Arbeitsgemeinschaft Forsteinrichtung: Eching, München, 2016. [Google Scholar]
  55. Contin, D.R.; Soriani, H.H.; Hernández, I.; Furriel, R.P.M.; Munné-Bosch, S.; Martinez, C.A. Antioxidant and Photoprotective Defenses in Response to Gradual Water Stress under Low and High Irradiance in Two Malvaceae Tree Species Used for Tropical Forest Restoration. Trees 2014, 28, 1705–1722. [Google Scholar] [CrossRef]
  56. Simon, J.; Waldhecker, P.; Brüggemann, N.; Rennenberg, H. Competition for Nitrogen Sources between European Beech (Fagus sylvatica) and Sycamore Maple (Acer pseudoplatanus) Seedlings. Plant Biol. 2010, 12, 453–458. [Google Scholar] [CrossRef] [PubMed]
  57. Du, B.; Jansen, K.; Junker, L.V.; Eiblmeier, M.; Kreuzwieser, J.; Gessler, A.; Ensminger, I.; Rennenberg, H. Elevated Temperature Differently Affects Foliar Nitrogen Partitioning in Seedlings of Diverse Douglas Fir Provenances. Tree Physiol. 2014, 34, 1090–1101. [Google Scholar] [CrossRef] [PubMed]
  58. Winter, H.; Lohaus, G.; Heldt, H.W. Phloem Transport of Amino Acids in Relation to Their Cytosolic Levels in Barley Leaves. Plant Physiol. 1992, 99, 996–1004. [Google Scholar] [CrossRef] [PubMed]
  59. Hu, B.; Simon, J.; Kuster, T.M.; Arend, M.; Siegwolf, R.; Rennenberg, H. Nitrogen Partitioning in Oak Leaves Depends on Species, Provenance, Climate Conditions and Soil Type. Plant Biol. 2013, 15, 198–209. [Google Scholar] [CrossRef] [PubMed]
  60. Dannenmann, M.; Simon, J.; Gasche, R.; Holst, J.; Naumann, P.S.; Kögel-Knabner, I.; Knicker, H.; Mayer, H.; Schloter, M.; Pena, R.; et al. Tree Girdling Provides Insight on the Role of Labile Carbon in Nitrogen Partitioning between Soil Microorganisms and Adult European Beech. Soil Biol. Biochem. 2009, 41, 1622–1631. [Google Scholar] [CrossRef]
  61. Gessler, A.; Schneider, S.; Sengbusch v., D.; Weber, P.; Hanemann, U.; Huber, C.; Rothe, A.; Kreutzer, K.; Rennenberg, H. Field and Laboratory Experiments on Net Uptake of Nitrate and Ammonium by the Roots of Spruce (Picea abies) and Beech (Fagus sylvatica) Trees. New Phytol. 1998, 138, 275–285. [Google Scholar] [CrossRef]
  62. Geßler, A.; Kreuzwieser, J.; Dopatka, T.; Rennenberg, H. Diurnal Courses of Ammonium Net Uptake by the Roots of Adult Beech (Fagus sylvatica) and Spruce (Picea abies) Trees. Plant Soil 2002, 240, 23–32. [Google Scholar] [CrossRef]
  63. Stoelken, G.; Simon, J.; Ehlting, B.; Rennenberg, H. The Presence of Amino Acids Affects Inorganic N Uptake in Non-Mycorrhizal Seedlings of European Beech (Fagus sylvatica L.). Tree Physiol. 2010, 30, 1118–1128. [Google Scholar] [CrossRef] [PubMed]
  64. Kreuzwieser, J.; Fürniss, S.; Rennenberg, H. Impact of Waterlogging on the N-Metabolism of Flood Tolerant and Non-Tolerant Tree Species. Plant Cell Environ. 2002, 25, 1039–1049. [Google Scholar]
  65. Team, R.C. R: A Language and Environment for Statistical Computing; R Foundation for Statistical Computing: Vienna, Austria, 2017. [Google Scholar]
  66. Dorman, C. Parametrische Statistik. Verteilungen, Maximum Likelihood Und GLM in R; Springer: Heidelberg, Germany, 2013; Volume 53. [Google Scholar]
  67. Crawley, M.J. Statistik Mit R; Wiley-VCH Verlag GmbH & Co. KGaA: Weinheim, Germany, 2012; p. 424. [Google Scholar]
  68. Mellert, K.H.; Göttlein, A. Comparison of New Foliar Nutrient Thresholds Derived from van Den Burg’s Literature Compilation with Established Central European References. Eur. J. For. Res. 2012, 131, 1461–1472. [Google Scholar] [CrossRef]
  69. Göttlein, A.; Baier, R.; Mellert, K.H. Neue Ernährungskennwerte Für Die Forstlichen Hauptbaumarten in Mitteleuropa—Eine Statistische Herleitung Aus VAN DEN BURG’S Literaturzusammenstellung. Allg. Forst-und Jagdzeitung 2011, 182, 173–186. [Google Scholar]
  70. Bergman, W. Ernährungsstörungen Bei Kulturpflanzen, Entstehung Und Diagnose; Gustav Fischer Verlag: Jena, Germany, 1983; p. 614. [Google Scholar]
  71. Peguero-Pina, J.J.; Camarero, J.J.; Abadía, A.; Martín, E.; González-Cascón, R.; Morales, F.; Gil-Pelegrín, E. Physiological Performance of Silver-Fir (Abies alba Mill.) Populations under Contrasting Climates near the South-Western Distribution Limit of the Species. Flora 2007, 202, 226–236. [Google Scholar] [CrossRef]
  72. Millard, P.; Grelet, G.A. Nitrogen Storage and Remobilization by Trees: Ecophysiological Relevance in a Changing World. Tree Physiol. 2010, 30, 1083–1095. [Google Scholar] [CrossRef] [PubMed]
  73. Keitel, C.; Matzarakis, A.; Rennenberg, H.; Gessler, A. Carbon Isotopic Composition and Oxygen Isotopic Enrichment in Phloem and Total Leaf Organic Matter of European Beech (Fagus sylvatica L.) along a Climate Gradient. Plant Cell Environ. 2006, 29, 1492–1507. [Google Scholar] [CrossRef]
  74. Körner, C.; Farquhar, G.D.; Wong, S.C. Carbon Isotope Discrimination by Plants Follows Latitudinal and Altitudinal Trends. Oecologia 1991, 88, 30–40. [Google Scholar] [CrossRef] [PubMed]
  75. Hultine, K.R.; Marshall, J.D. Altitude Trends in Conifer Leaf Morphology and Stable Carbon Isotope Composition. Oecologia 2000, 123, 32–40. [Google Scholar] [CrossRef] [PubMed]
  76. Warren, C.R.; McGrath, J.F.; Adams, M.A. Water Availability and Carbon Isotope Discrimination in Conifers. Oecologia 2001, 127, 476–486. [Google Scholar] [CrossRef] [PubMed]
  77. Fotelli, M.N.; Rienks, M.; Rennenberg, H.; Geßler, A. Climate and Forest Management Affect 15N-Uptake, N Balance and Biomass of European Beech Seedlings. Trees—Struct. Funct. 2004, 18, 157–166. [Google Scholar] [CrossRef]
  78. Peuke, A.D.; Rennenberg, H. Carbon, Nitrogen, Phosphorus, and Sulphur Concentration and Partitioning in Beech Ecotypes (Fagus sylvatica L.): Phosphorus Most Affected by Drought. Trees 2004, 18, 639–648. [Google Scholar] [CrossRef]
  79. Rennenberg, H.; Loreto, F.; Polle, A.; Brilli, F.; Fares, S.; Beniwal, R.S.; Gessler, A. Physiological Responses of Forest Trees to Heat and Drought. Plant Biol. 2006, 8, 556–571. [Google Scholar] [CrossRef] [PubMed]
  80. Fotelli, M.N.; Rennenberg, H.; Geßler, A. Effects of Drought on the Competitive Interference of an Early Successional Species (Rubus fruticosus) on Fagus sylvatica L. Seedlings: 15N Uptake and Partitioning, Responses of Amino Acids and Other, N. Compounds. Plant Biol. 2002, 4, 311–320. [Google Scholar] [CrossRef]
  81. Meier, I.C.; Leuschner, C. Belowground Drought Response of European Beech: Fine Root Biomass and Carbon Partitioning in 14 Mature Stands across a Precipitation Gradient. Glob. Chang. Biol. 2008, 14, 2081–2095. [Google Scholar] [CrossRef]
  82. Bertness, M.D.; Callaway, R. Positive Interactions in Communities. Trends Ecol. Evol. 1994, 9, 187–191. [Google Scholar] [CrossRef]
  83. Morin, X.; Fahse, L.; Scherer-Lorenzen, M.; Bugmann, H. Tree Species Richness Promotes Productivity in Temperate Forests through Strong Complementarity between Species. Ecol. Lett. 2011, 14, 1211–1219. [Google Scholar] [CrossRef] [PubMed]
  84. Ishii, H.; Asano, S. The Role of Crown Architecture, Leaf Phenology and Photosynthetic Activity in Promoting Complementary Use of Light among Coexisting Species in Temperate Forests. Ecol. Res. 2010, 25, 715–722. [Google Scholar] [CrossRef]
  85. Sapijanskas, J.; Paquette, A.; Potvin, C.; Kunert, N.; Loreau, M. Tropical Tree Diversity Enhances Light Capture through Plastic Architectural Changes and Spatial and Temporal Niche Differences. Ecology 2014, 95, 2479–2492. [Google Scholar] [CrossRef]
  86. Forrester, D.I.; Ammer, C.; Annighöfer, P.J.; Barbeito, I.; Bielak, K.; Bravo-Oviedo, A.; Coll, L.; del Río, M.; Drössler, L.; Heym, M.; et al. Effects of Crown Architecture and Stand Structure on Light Absorption in Mixed and Monospecific Fagus sylvatica and Pinus sylvestris Forests along a Productivity and Climate Gradient through Europe. J. Ecol. 2018, 106, 746–760. [Google Scholar] [CrossRef]
  87. Berger, T.W.; Untersteiner, H.; Toplitzer, M.; Neubauer, C. Nutrient Fluxes in Pure and Mixed Stands of Spruce (Picea abies) and Beech (Fagus sylvatica). Plant Soil 2009, 322, 317–342. [Google Scholar] [CrossRef]
  88. Rothe, A.; Ewald, J.; Hibbs, D.E. Do Admixed Broadleaves Improve Foliar Nutrient Status of Conifer Tree Crops? For. Ecol. Manag. 2003, 172, 327–338. [Google Scholar] [CrossRef]
  89. Maire, V.; Wright, I.J.; Prentice, I.C.; Batjes, N.H.; Bhaskar, R.; van Bodegom, P.M.; Cornwell, W.K.; Ellsworth, D.; Niinemets, Ü.; Ordonez, A.; et al. Global Effects of Soil and Climate on Leaf Photosynthetic Traits and Rates. Glob. Ecol. Biogeogr. 2015, 24, 706–717. [Google Scholar] [CrossRef]
  90. Rennenberg, H.; Dannenmann, M. Nitrogen Nutrition of Trees in Temperate Forests—The Significance of Nitrogen Availability in the Pedosphere and Atmosphere. Forests 2015, 6, 2820–2835. [Google Scholar] [CrossRef] [Green Version]
  91. Tarvainen, L.; Lutz, M.; Räntfors, M.; Näsholm, T.; Wallin, G. Increased Needle Nitrogen Contents Did Not Improve Shoot Photosynthetic Performance of Mature Nitrogen-Poor Scots Pine Trees. Front. Plant Sci. 2016, 7, 1051. [Google Scholar] [CrossRef] [PubMed]
  92. Nambiar, E.K.S.; Fife, D.N. Growth and Nutrient Retranslocation in Needles of Radiata Pine in Relation to Nitrogen Supply. Ann. Bot. 1987, 60, 147–156. [Google Scholar] [CrossRef]
  93. Millard, P.; Proe, M.F. Storage and Internal Cycling of Nitrogen in Relation To Seasonal Growth of Sitka Spruce. Tree Physiol. 1992, 10, 33–43. [Google Scholar] [CrossRef] [PubMed]
  94. Millard, P.; Hester, A.; Wendler, R.; Baillie, G. Interspecific Defoliation Responses of Trees Depend on Sites of Winter Nitrogen Storage. Funct. Ecol. 2001, 15, 535–543. [Google Scholar] [CrossRef]
  95. Sadanandan Nambiar, E.K.; Bowen, G.D. Uptake, Distribution and Retranslocation of Nitrogen by Pinus radiata from 15N-Labelled Fertilizer Applied to Podzolized Sandy Soil. For. Ecol. Manag. 1986, 15, 269–284. [Google Scholar] [CrossRef]
  96. Camm, E. Photosynthetic Responses in Developing and Year-Old Douglas-Fir Needles during New Shoot Development. Trees 1993, 8, 61–66. [Google Scholar] [CrossRef]
  97. Millard, P.; Sommerkorn, M.; Grelet, G.A. Environmental Change and Carbon Limitation in Trees: A Biochemical, Ecophysiological and Ecosystem Appraisal. New Phytol. 2007, 175, 11–28. [Google Scholar] [CrossRef] [PubMed]
  98. Chapin, E.S.; Kedrowski, R.A. Seasonal Changes in Nitrogen and Phosphorus Fractions and Autumn Retranslocation in Evergreen and Deciduous Taiga Trees. Ecology 1983, 64, 376–391. [Google Scholar] [CrossRef]
  99. Stephens, D.W.; Millard, P.; Turnbull, M.H.; Whitehead, D. The Influence of Nitrogen Supply on Growth and Internal Recycling of Nitrogen in Young Nothofagus fusca Trees. Funct. Plant Biol. 2001, 28, 249–255. [Google Scholar] [CrossRef]
Figure 1. Seasonal changes in δ13C signatures of leaves/previous year needles and roots. Top row reveals bulk leaf material, bottom row bulk root material, obtained from three field sites, i.e., “Conventwald” (CO), “Freiamt” (EM) and “Croatia” (CR), respectively. Three shades of grey depict the three different species associations, namely “BB” light grey—beeches in pure beech stands, “BF” grey—beeches in mixed beech-fir-stands, and “FB” dark grey—firs in mixed beech-fir-stands at three sampling time points within the season of 2016, i.e., “Spring” (early June), “Summer” (early September), and “Fall” (mid-September to early October). Box plots include median (solid black line), standard deviation (black error bars), and outliers (black dots) which were generated with n = 10 (CO)/11(EM)/12(CR) for “BB”, n = 6 (CO)/8(EM)/6(CR) for “BF”, and n = 6(CO)/9(EM)/6(CR) at each given time point. Capital letters indicate differences between the same ID and site, but at different seasons; lower case letters indicate differences between different IDs, but at the same season and site; hashtags and asterisks indicate differences between different sites, but same ID and season. Sharing the same letter/symbol indicates no significant difference at p ≤ 0.05.
Forests 09 00733 g001
Figure 2. Seasonal changes of total nitrogen contents of leaves/previous year needles and roots. Top row reveals bulk leaf material, bottom row bulk root material, obtained from three field sites, i.e., “Conventwald” (CO), “Freiamt” (EM) and “Croatia” (CR), respectively. Three shades of grey depict the three different species associations, namely “BB” light grey—beeches in pure beech stands, “BF” grey—beeches in mixed beech-fir-stands, and “FB” dark grey—firs in mixed beech-fir-stands at three sampling time points within the season of 2016, i.e., “Spring” (early June), “Summer” (early September), and “Fall” (mid-September to early October). Bar plots include standard deviation (black error bars), which were generated with n = 10 (CO)/11(EM)/12(CR) for “BB”, n = 6 (CO)/8(EM)/6(CR) for “BF”, and n = 6(CO)/9(EM)/6(CR) for “FB” at each given time point. Capital letters indicate differences between the same ID and site, but at different seasons; lower case letters indicate differences between different IDs, but at the same season and site; hashtags and asterisks indicate differences between different sites, but same ID and season. Sharing the same letter/symbol indicates no significant difference at p ≤ 0.05.
Forests 09 00733 g002
Figure 3. Seasonal changes in soluble protein N contents of leaves/previous year needles and roots. Top row reveals bulk leaf material, bottom row bulk root material, obtained from three field sites, i.e., “Conventwald” (CO), “Freiamt” (EM) and “Croatia” (CR), respectively. Three shades of grey depict the three different species associations, namely “BB” light grey—beeches in pure beech stands, “BF” grey—beeches in mixed beech-fir-stands, and “FB” dark grey—firs in mixed beech-fir-stands at three sampling time points within the season of 2016, i.e., “Spring” (early June), “Summer” (early September), and “Fall” (mid-September to early October). Bar plots include standard deviation (black error bars), which were generated with n = 10 (CO)/11(EM)/12(CR) for “BB”, n = 6 (CO)/8(EM)/6(CR) for “BF”, and n = 6(CO)/9(EM)/6(CR) at each given time point. Capital letters indicate differences between the same ID and site, but at different seasons; lower case letters indicate differences between different IDs, but at the same season and site; hashtags and asterisks indicate differences between different sites, but same ID and season. Sharing the same letter/symbol indicates no significant difference at p ≤ 0.05.
Forests 09 00733 g003
Figure 4. Seasonal changes of total amino acid N contents of leaves/previous year needles and roots. Top row reveals bulk leaf material, bottom row bulk root material, obtained from three field sites, i.e., “Conventwald” (CO), “Freiamt” (EM) and “Croatia” (CR), respectively. Three shades of grey depict the three different species associations, namely “BB” light grey—beeches in pure beech stands, “BF” grey—beeches in mixed beech-fir-stands, and “FB” dark grey—firs in mixed beech-fir-stands at three sampling time points within the season of 2016, i.e., “Spring” (early June), “Summer” (early September), and “Fall” (mid-September to early October). Bar plots include standard deviation (black error bars), which were generated with n = 10 (CO)/11(EM)/12(CR) for “BB”, n = 6 (CO)/8(EM)/6(CR) for “BF”, and n = 6(CO)/9(EM)/6(CR) at each given time point. Capital letters indicate differences between the same ID and site, but at different seasons; lower case letters indicate differences between different IDs, but at the same season and site; hashtags and asterisks indicate differences between different sites, but same ID and season. Sharing the same letter/symbol indicates no significant difference at p ≤ 0.05.
Forests 09 00733 g004
Figure 5. Seasonal changes of structural nitrogen contents of leaves/previous year needles and roots. Top row reveals bulk leaf material, bottom row bulk root material, obtained from three field sites, i.e., “Conventwald” (CO), “Freiamt” (EM) and “Croatia” (CR), respectively. Three shades of grey depict the three different species associations, namely “BB” light grey—beeches in pure beech stands, “BF” grey—beeches in mixed beech-fir-stands, and “FB” dark grey—firs in mixed beech-fir-stands at three sampling time points within the season of 2016, i.e., “Spring” (early June), “Summer” (early September), and “Fall” (mid-September to early October). Bar plots include standard deviation (black error bars), which were generated with n = 10 (CO)/11(EM)/12(CR) for “BB”, n = 6 (CO)/8(EM)/6(CR) for “BF”, and n = 6(CO)/9(EM)/6(CR) at each given time point. Capital letters indicate differences between the same ID and site, but at different seasons; lower case letters indicate differences between different IDs, but at the same season and site; hashtags and asterisks indicate differences between different sites, but same ID and season. Sharing the same letter/symbol indicates no significant difference at p ≤ 0.05.
Forests 09 00733 g005
Figure 6. Seasonal changes in N uptake capacities of fine roots for inorganic and organic N sources. Top row indicates the three field sites, i.e., “Conventwald” (CO), “Freiamt” (EM) and “Croatia” (CR), respectively. Three shades of grey depict the three different species associations, namely “BB” light grey—beeches in pure beech stands, “BF” grey—beeches in mixed beech-fir-stands, and “FB” dark grey—firs in mixed beech-fir-stands at three sampling time points within the season of 2016, i.e., “Spring” (early June), “Summer” (early September), and “fall” (mid-September to early October). Box plots include median (solid black line), standard deviation (black error bars), and outliers (black dots) which were generated with n = 10 (CO)/11(EM)/12(CR) for “BB”, n = 6 (CO)/8(EM)/6(CR) for “BF”, and n = 6(CO)/9(EM)/6(CR) at each given time point. Please note that the y-axis is logarithmic. Significant differences in N uptake capacity are to be read as follows: Capital letters indicate differences between different N sources, but the same ID and site; lower case letters indicate differences between IDs at the same site and N source; hashtags and asterisks indicate differences between sites, but the same IDs and N sources. Sharing the same letter/symbol indicates no significant difference at p ≤ 0.05.
Forests 09 00733 g006
Table 1. Correlation between δ13Cplnat and environmental parameters. Leaf (L13C)/previous year needle bulk δ13C (LY13C), current year needle bulk δ13C (CY13C), and root bulk δ13C (R13C) were correlated with elevation (above sea level), mean annual average temperature (Temp), and annual precipitation (Prec). Correlation coefficient is Spearman’s rho (ρ) followed by asterisks depicting corresponding p-values: p < 0.0001 “****”; p < 0.001 “***”; p < 0.01 “**”; p < 0.05 “*”. Correlations with ρ ≥ ±0.5 were considered as “true” relation.
Pure BeechLC13R13CElevationTemp
L13C
R13C−0.32 **
Elevation−0.040.42 ****
Temp0.08−0.39 ****−0.58 ****
Prec−0.040.42 ****1.00 ****−0.58 ****
Mixed BeechLC13R13CElevationTemp
L13
R13C0.2
Elevation0.40 **0.59 ****
Temp−0.46 ***−0.77 ****−0.53 ****
Prec0.40 **0.59 ****1.00 ****−0.53 ****
Mixed FirLY13CCY13CR13CElevationTemp
LY13C
CY13C0.74 ****
R13C0.050.17
Elevation0.66 ****0.71 ****0.25
Temp−0.46 ***−0.40 **−0.47 ***−0.67 ****
Prec0.66 ****0.71 ****0.251.00 ****−0.67 ****

