Article

Genome-Wide Analysis of Gene and microRNA Expression in Diploid and Autotetraploid Paulownia fortunei (Seem) Hemsl. under Drought Stress by Transcriptome, microRNA, and Degradome Sequencing

Institute of Paulownia, Henan Agricultural University, 95 Wenhua Road, Jinshui District, 450002 Zhengzhou, China
*
Author to whom correspondence should be addressed.
These authors are the co-first authors (Suyan Niu and Zhenli Zhao contributed equally to this work).
Forests 2018, 9(2), 88; https://doi.org/10.3390/f9020088
Submission received: 14 January 2018 / Revised: 7 February 2018 / Accepted: 9 February 2018 / Published: 13 February 2018
(This article belongs to the Special Issue Genetics and Genomics of Forest Trees)

Abstract

:
Drought is a common and recurring climatic condition in many parts of the world, and it can have disastrous impacts on plant growth and development. Many genes involved in the drought response of plants have been identified. Transcriptome, microRNA (miRNA), and degradome analyses are rapid ways of identifying drought-responsive genes. The reference genome sequence of Paulownia fortunei (Seem) Hemsl. is now available, which makes it easier to explore gene expression, transcriptional regulation, and post-transcriptional in this species. In this study, four transcriptome, small RNA, and degradome libraries were sequenced by Illumina sequencing, respectively. A total of 258 genes and 11 miRNAs were identified for drought-responsive genes and miRNAs in P. fortunei. Degradome sequencing detected 28 miRNA target genes that were cleaved by members of nine conserved miRNA families and 12 novel miRNAs. The results here will contribute toward enriching our understanding of the response of Paulownia fortunei trees to drought stress and may provide new direction for further experimental studies related the development of molecular markers, the genetic map construction, and other genomic research projects in Paulownia.

1. Introduction

Drought is a common form of environmental stress that constrains plant growth and development and crop production. During their evolution, plants have evolved processes to respond to adverse stresses, including signal transduction and hormonal regulation [1]. Under drought stress conditions, cell turgor can be maintained at a balanced level through osmotic adjustment, and cell elasticity and size can be adjusted via protoplasmic tolerance, which allows plants to tolerate drought stress. The drought stress response has been studied in various plants, including crops, vegetables, and trees.
Paulownia is a fast-growing woody plant native to China, where it has been used widely for landscaping and silviculture; however, the ecological benefits of Paulownia are being severely affected by the increasingly dry climate. The Paulownia fortunei (Seem) Hemsl. genome has been published recently, which will help in better understanding the drought tolerance of Paulownia species. To enlarge the germplasm and breed a drought-resistant variety, autotetraploids (4n = 80) have been obtained from diploid parent plants (2n = 40) using colchicines [2]. Polyploidy and whole genome duplication lay a foundation for the innovation of genetic material [3]. The altered characters of polyploidy—for instance, drought tolerance or pathogen resistance—make these plants more adapted to rough environmental conditions [4,5]. Different genotypes may cause plants to display different response patterns to drought stress. Therefore, breeding plants with enhanced genetic characteristics requires an in-depth understanding of the regulation mechanisms of gene expression under drought stress.
Next-generation sequencing techniques have made the analysis of genome-wide transcriptome available and affordable. To date, a large number of genes related to drought stress have been reported [6,7,8,9]. MicroRNAs (miRNAs) are the kind of non-coding RNAs that play vital roles in regulation of gene expression at the post-transcriptional level. They regulate gene expression either by cleaving mRNA or by translational repression [10,11]. Plant miRNAs were implicated to play important roles in plants’ responses to adversity stresses [12,13,14,15,16]. Functional analyses have demonstrated that miRNAs are essential to the ability of plants to resist environment stress [17]. However, in the Paulownia species, the networks that underlie these stress responses have not been fully characterized.
Plant hormones play pivotal roles in plant growth and stress tolerance. ABA (phytohormone abscisic acid) is known as a stress hormone because it can be sensitively and rapidly accumulated under drought stress condition in order to reduce or avoid the inhibition of plant growth and development and it can be rapidly decreased and degraded when the stress is removed [18,19,20,21]. ABA regulates the expression of many genes, which leads to changes in important physiological and biochemical indexes that help plants to survive under environment stress [22]. During this process, drought stress increases endogenous ABA levels and induces ABA-dependent and ABA-independent transcriptional regulatory networks [22,23]. It has been shown that genes involved in the regulatory networks are active under drought condition, especially transcription factors (TFs), which are employed to enhance drought tolerance in plants [24,25]. For instance, an increasing number of reports have suggested that the overexpression of TFs such as the MYB (transcription factor MYB), NAC (NAM, ATAF, and CUC transcription factor), WRKY (transcription factor WRKY), ZFP (Zinc finger protein), bHLH (basic helix-loop-helix), ZF-HD (zinc finger homeodomain protein), and AP2 (APETALA 2) families plays a critical role in regulating the expression of specific stress-related genes and plant stress signal transduction, therefore improving the resistance of Arabidopsis and rice plants to drought and salinity stresses [26,27,28,29]. Moreover, it has been shown that drought stress affects miRNAs through regulating their target genes, which encode the MYB, AP2, and ZF-HD TFs that are involved in ABA-dependent and ABA-independent pathways, and that these changes can allow plants to better adapt to water deficit. For instance, ABA treatment and drought stress have been shown to induce the accumulation of miR159, which targets the encoding of the MYB TFs that positively modulate ABA responses during seed germination in Arabidopsis [30]. Although the complex interplay between transcriptional and posttranscriptional regulation of drought response in Arabidopsis has been reported, this type of interplay is not well characterized in Paulownia. To understand the molecular mechanisms associated with the responses of diploid and autotetraploid P. fortunei to drought stress, we sequenced four transcriptome, small RNA, and degradome libraries by high-throughput sequencing. As a result, we obtained information on a large number of genes and biological processes that might be involved in molecular mechanisms of drought responses in Paulownia. The results will help researchers explore the gene expression differences between diploid and autotetraploid P. fortunei under drought stress at the transcriptome and miRNA level, which is of fundamental importance to agricultural production.

2. Materials and Methods

2.1. Plant Materials

The tissue culture samples were harvested from the Institute of Paulownia, Henan Agricultural University (Zhengzhou, Henan Province, China). The autotetraploid clone of Paulownia fortunei was obtained by in vitro treatment of a diploid P. fortunei clone with colchicine from a previous study [2]. This diploid and its derived autotetraploid clone were the same genome with differences at the ploidy level. The samples were treated according to the method of Zhang et al. [2]. Briefly, the P. fortunei tissue culture seedlings (diploid and autotetraploid) were cultured for 30 days. Samples were transferred into nutrition blocks containing normal garden soil for 30 days. Then, samples with the same growth consistency were transferred individually into nutrition pots (30 cm in diameter) containing the same weight of ordinary garden soil. After 50 days, the samples with the same growth consistency were used to carry out the drought treatment. Diploid and autotetraploid P. fortunei plantlets were treated with 75% (control) and 25% (drought treatment) relative soil water contents and named PF2 and PF2T, and PF4 and PF4T, respectively. After 6, 9, and 12 days of treatment, the leaves (second pairs) were picked from the drought-treated plants. At least three biological duplicates with the same growing consistency under each condition were chosen and the leaves were harvested. The obtained leaves were immediately frozen in liquid nitrogen for total RNA extraction.

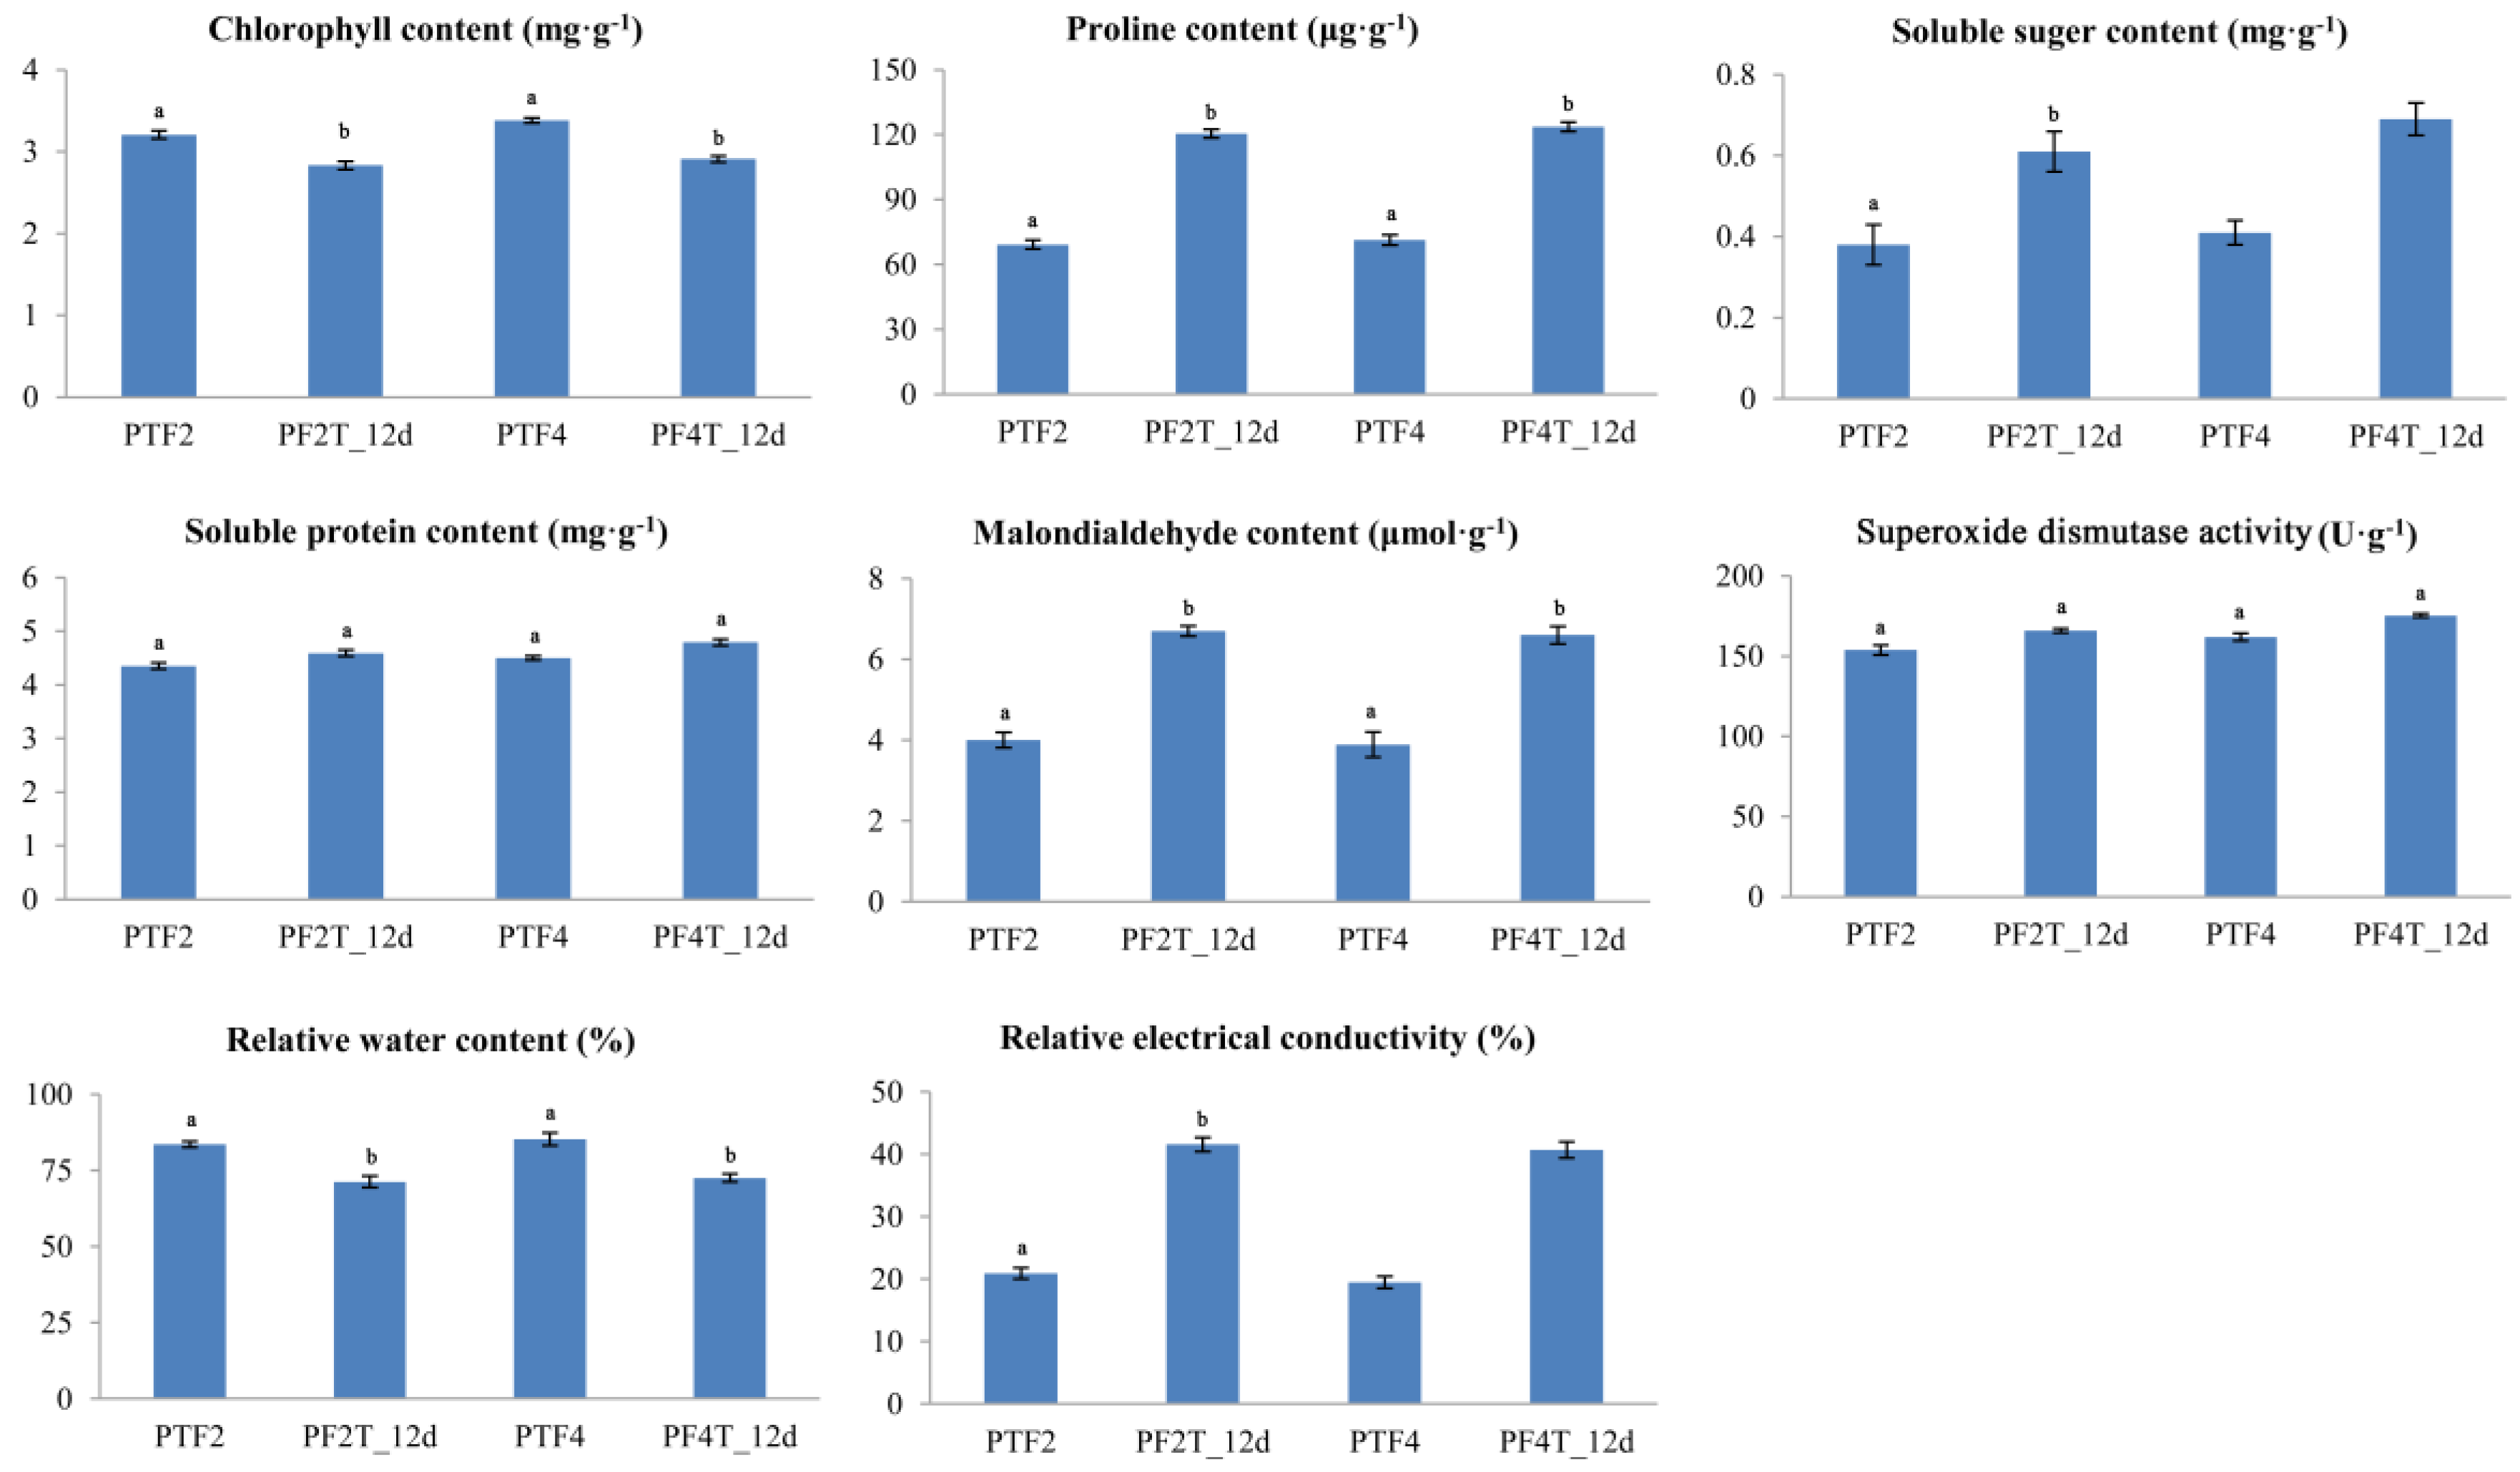
2.2. Physiological Responses of Diploid and Autotetraploid Paulownia fortunei to Drought Stress

Physiological characteristics and biochemical indexes including chlorophyll, proline, soluble sugar, soluble protein content, malondialdehyde concentration, superoxide dismutase activity, relative water content, and relative electrical conductivity of the well-watered control samples (PF2 and PF4) and drought treatment samples (PF2T_12D and PF4T_12D) were calculated in this study. The chlorophyll content was calculated following the methods of Bojović et al. [31] and Arnon [32]. The proline content was calculated by using the method of Bates et al. [33]. The soluble protein content, soluble sugar content, malondialdehyde concentration, and superoxide dismutase activity were measured by the method described previously [34]. The relative water content of the leaf was calculated by using the method described previously [35]. The relative electrical conductivity was calculated according to the methods by Li [34]. The ANOVA Duncan analysis was performed using SPSS 19.0 software (SPASS, Inc., Chicago, IL, USA).

2.3. Construction, Processing, and Annotation of the P. fortunei cDNA Libraries

Total RNA was extracted from each sample using Trizol reagent following the manufacturer’s instructions (Invitrogen, Carlsbad, CA, USA). Then, the samples (PF2, PF2T_12D, PF4, and PF4T_12D) were treated with DNase I, and magnetic beads with Oligo (dT) were used to isolate the mRNA. The mRNA was then mixed with fragmentation buffer to obtain short fragments. The cDNA was synthesized using the mRNA fragments as templates. Briefly, the short fragments had been purified and suspended with elution buffer in a TruSeq™ RNA sample preparation kit (Catalog No. RS-930-2001) for end reparation and single nucleotide A (adenine) addition (Illumina, San Diego, CA, USA). The short fragments were then connected with adapters in the TruSeq™ RNA sample preparation kit. Poly (A) fragments were selected for connected adapters in TruSeq™ RNA sample preparation kit. Suitable fragments were used as templates for PCR amplification. After the quantification and qualification of the sample libraries were performed, these libraries were sequenced on an Illumina HiSeq™ 2000 (Illumina, San Diego, CA, USA).
After the paired-end sequencing was conducted, the raw data for these libraries were obtained and then deposited in the NIH SRA (Short Read Archive) database (http://www.ncbi.nlm.nih.gov/sra) under accession number SRP030466. The reads (about 110 bp length) from either end of cDNA fragment were yielded for each sequencing sample. We used in-house Perl scripts to process the raw data by removing low-quality reads, reads containing adapters, and reads containing poly (N) sequences in order to obtain high-quality reads. Quality control and other downstream analyses were performed on the clean data. The clean reads were mapped to the P. fortunei genome reference and gene reference sequences with Bowtie2 program (http://bowtie-bio.sourceforge.net/bowtie2/index.shtml.) [36]. The transcript expression levels were quantified using the RSEM (RSEM v1.3.0) software package (https://deweylab.github.io/RSEM/). The fragments per kilo base of transcript (FPKM) was used to identify DEGs (differentially expressed genes) from comparisons between two libraries [37]. Statistically significant differences in gene expression levels were determined using the Audic-Claverie algorithm [38]. The p-values were calculated according to previously established methods. The threshold p-value in multiple tests was calculated using the false discovery rate (FDR) method of Benjamini and Hochberg [39]. Threshold FDR < 0.001 and |log2Ratio| > 1 were used to judge the significance of differences in gene expression. Gene functional annotation was based on BLAST searches (E-value cutoff of 10−5) against NCBI’s non-redundant protein sequence (nr) database, and Kyoto Encyclopaedia of Genes and Genomes (KEGG) pathway (http://www.genome.jp/kegg/) and Gene Ontology (GO) databases annotations (http://www.geneontology.org/).

2.4. Construction, Processing, and Annotation of the P. fortunei Small RNA Libraries

The same total RNA samples as those used for transcriptome sequencing were also subjected to build the small RNA (sRNA) libraries and then sequenced on an Illumina GAIIx platform. Briefly, sRNA fragments (18 to 30 nt) were separated and purified by polyacrylamide gel electrophoresis. Then, using the T4 RNA ligase, sRNA fragments were ligated to 5’ and 3’ adaptors. The adaptor-ligated sRNAs were transcribed to single-stranded cDNA and amplified by 12 PCR cycles. The final products were used to construct the libraries for sequencing.
After low quality reads, adapters, and contaminated reads were filtered, we obtained the clean reads. The length distribution of the clean reads was analyzed, and the reads were then mapped to the P. fortunei genome and gene databases. After removing repeat sRNAs, sequences that matched rRNAs, tRNAs, snRNAs, and snoRNAs were removed. The remaining unique sequences were compared against the plant known miRNA sequences in miRBase (Release 21.0; http://www.mirbase.org/) with a maximum of two mismatches allowed [40] in order to identify the conserved miRNAs in P. fortunei. MIREAP (http://sourceforge.net/projects/mireap/) and RNAfold (http://rna.tbi.univie.ac.at/cgi-bin/RNAfold.cgi) software were used to predict novel miRNAs from the remaining unknown sRNAs under the basic criteria described by Meyers et al. [41].

2.5. Differential Expression Analysis of Conserved and Novel miRNAs

The abundance of miRNAs from four libraries was normalized to one million by total clean reads of miRNAs in each sample. Fold changes between any two libraries were calculated as: fold change = log2 (sample 1/sample 2). The miRNAs with fold changes >1 or <−1 and with p ≤ 0.05 were considered likely to be differentially expressed in response to drought stress. The p-values were evaluated according to previously established methods [38].
p-value:
P ( x | y ) = ( N 2 N 1 ) ( x + y ) ! x ! y ! ( 1 + N 2 N 1 ) ( x + y + 1 )
C ( y y max | x ) = y = 0 y y min p ( x | y )
D ( y y max | x ) = y y max p ( x | y )
where N1and N2 represent the total number of reads in PTF2 and PTF2H (or PTF4 and PTF4H; PTF2H and PA4H; or PTF2 and PTF4), respectively; x and y represent the number of reads surveyed in PTF2 and PTF2H (or PTF4 and PTF4H; or PTF2H and PTF4H; or PTF2 and PTF4), respectively; C and D can be regarded as the probability discrete distribution of the p-value inspection.

2.6. Identification of miRNA Target Genes Associated with Drought Stress

To understand the function of target genes in regulating drought stress, four corresponding degradome libraries were built as described elsewhere [42,43]. Poly (A) RNA was isolated from total RNA using an Oligotex kit (QIAGEN, Santa Clarita, CA, USA) and ligated to an RNA adapter that had a 3’ MmeI recognition site. First strand cDNA was obtained using oligo (dT) and the PCR product was digested with MmeI. The digested products were ligated with degenerate nucleotides at the 3’ ends using T4 DNA ligase. The ligation product was amplified with 20 PCR cycles and then sequenced on an Illumina HiSeqTM 2000 system.
After initial processing, quality sequences 20–22 nt in length were collected for subsequent analysis. The unique sequence signatures were match to the P. fortunei genome and gene databases using SOAP software (http://soap.genomics.org.cn). Sequences with less than six mismatches and with zero mismatches between the 10th and 11th nucleotides were considered as potential targets. The CleaveLand pipeline was used to identify the miRNA gene targets. According to the abundance of tags and cleavage sites on the transcript, the cleaved targets were grouped into five categories. Perfectly matched sequences were kept selected and extended to approximately 35 nt in length by adding 15 nt of the upstream sequences. All resulting reads were reverse complemented and mapped to the miRNAs identified in this study. T-plots were built according to the distribution of signatures along the transcripts. The identified targets were subjected to BLASTX analysis and assigned GO annotations (http://www.geneontology.org/) based on their alignment with known sequences. Furthermore, pathway analyses of the targets were performed based on Blastall hits (E-value threshold < 10−5) against the KEGG database (http://www.genome.jp/kegg/).

2.7. Quantitative Real-Time Polymerase Chain Reaction (qRT-PCR) for Verification of the Sequencing Data

Potential genes and miRNAs and their corresponding targets related to drought response were selected randomly for qRT-PCR validation. The RNA samples from the leaves of the PF2, PF2T_6D, PF2T_9D, PF2T_12D, PF4, PF4T_6D, PF4T_9D, PF4T_12D samples were extracted with Trizol (Sangon, Shanghai, China). These samples were harvested at the same time as those used for transcriptome, miRNAs, and degradome sequencing. The purified RNA was denatured and first-strand cDNAs were synthesized using the PrimeScript RT reagent Kit (Takara, Dalian, China). The primers for genes (contained six miRNA targets) were designed by Beacon Designer (version 7.7, Premier Biosoft International, Ltd., Palo Alto, CA, USA) (Table S1). The specific stem-loop primers for the miRNAs were designed according to the method reported previously [44] (Table S1). The cDNAs were then amplified in the Bio-Rad CFX96TM Real-Time System (Bio-Rad, Hercules, CA, USA) under the PCR parameters defined by Fan et al. [45]. Three biological replicates were carried out for each gene and miRNA. The average threshold cycle (Ct) was normalized and the relative expression changes were calculated using the 2−∆∆Ct method [46]. The Paulownia 18S rRNA and U6 snRNA were chosen as internal reference genes for normalization [45].

3. Results

3.1. Physiological Responses of Diploid and Autotetraploid Paulownia fortunei to Drought Stress

The physiological responses of two P. fortunei genotypes to drought stress tolerance were determined in this present study. Figure 1 shows that the chlorophyll and relative water contents were decreased while the proline, malondialdehyde, soluble sugar, and relative electrical conductivity were increased in the drought stress treatment plants (autotetraploids and diploids). The protein contents and superoxide dismutase activity showed increased trends in the drought stress treatment plants (autotetraploids and diploids) but differences did not reach a significant level. Moreover, these physiological and biochemical indexes also exhibited differences between diploid and autotetraploid plants. The autotetraploid plants always stored higher levels of soluble sugar contents and lower relative water contents than the corresponding diploid plants both in well-watered and drought stress conditions (Figure 1). These results are consistent with the previous results presented by other scholars [2,47].

3.2. Transcriptome Data Mapping to the P. fortunei Genome

To get an overview of the diploid and autotetraploid P. fortunei transcriptomes under drought stress, we generated four cDNA libraries from leaves from PF2, PF2T_12D, PF4, and PF4T_12D plants. A total of 54,049,716 clean reads were mapped to the P. fortunei genome sequence, accounting for 84.10% of all the transcripts in the PF2 library. Moreover, 31,664,626 transcripts, accounting for 49.27% of the transcripts in the four libraries, were mapped to the P. fortunei gene database. The alignment statistics for the transcripts in the PPF2, PF2T_12D, PF4, and PF4T_12D libraries are shown in Table 1. Among these reads, 39,381,687 (PF2), 40,236,126 (PF2T_12D), 33,117,090 (PF4), and 34,095,108 (PF4T_12D) were matched perfectly to the Paulownia reference genome, while about 23,034,911 (PF2), 22,138,954 (PF2T_12D), 19,896,750 (PF4), and 18,735,185 (PF4T_12D) reads were perfectly matched to the reference genes (Table 1). The numbers of unique reads that were matched to the reference genome were 46,383,583 (PF2), 47,298,908 (PF2T_12D), 47,201,196 (PF4), and 47,540,030 (PF4T_12D), and the numbers of unique reads that matched to the Paulownia reference genes were 21,725,268 (PF2), 20,998,174 (PF2T_12D), 21,955,604 (PF4), and 21,592,724 (PF4T_12D). Altogether, 54,049,716 (PF2), 55,463,664 (PF2T_12D), 55,033,798 (PF4), and 56,335,628 (PF4T_12D) reads were matched to the reference genome, and 31,664,626 (PF2), 30,623,746 (PF2T_12D), 33,230,102 (PF4), and 31,595,018 (PF4T_12D) reads were matched to the reference genes. However, because of the significant sequencing depth that can be obtained by Illumina sequencing and the incomplete annotation of the P. fortunei genome, 14,668,029 (PF2), 15,227,538 (PF2T_12D), 21,916,708 (PF4), and 22,240,520 (PF4T_12D) reads were not matched to the reference genome, and 8,629,715 (PF2), 8,484,792 (PF2T_12D), 13,333,352 (PF4), and 12,859,833 (PF4T_12D) reads were not matched to the reference genes.

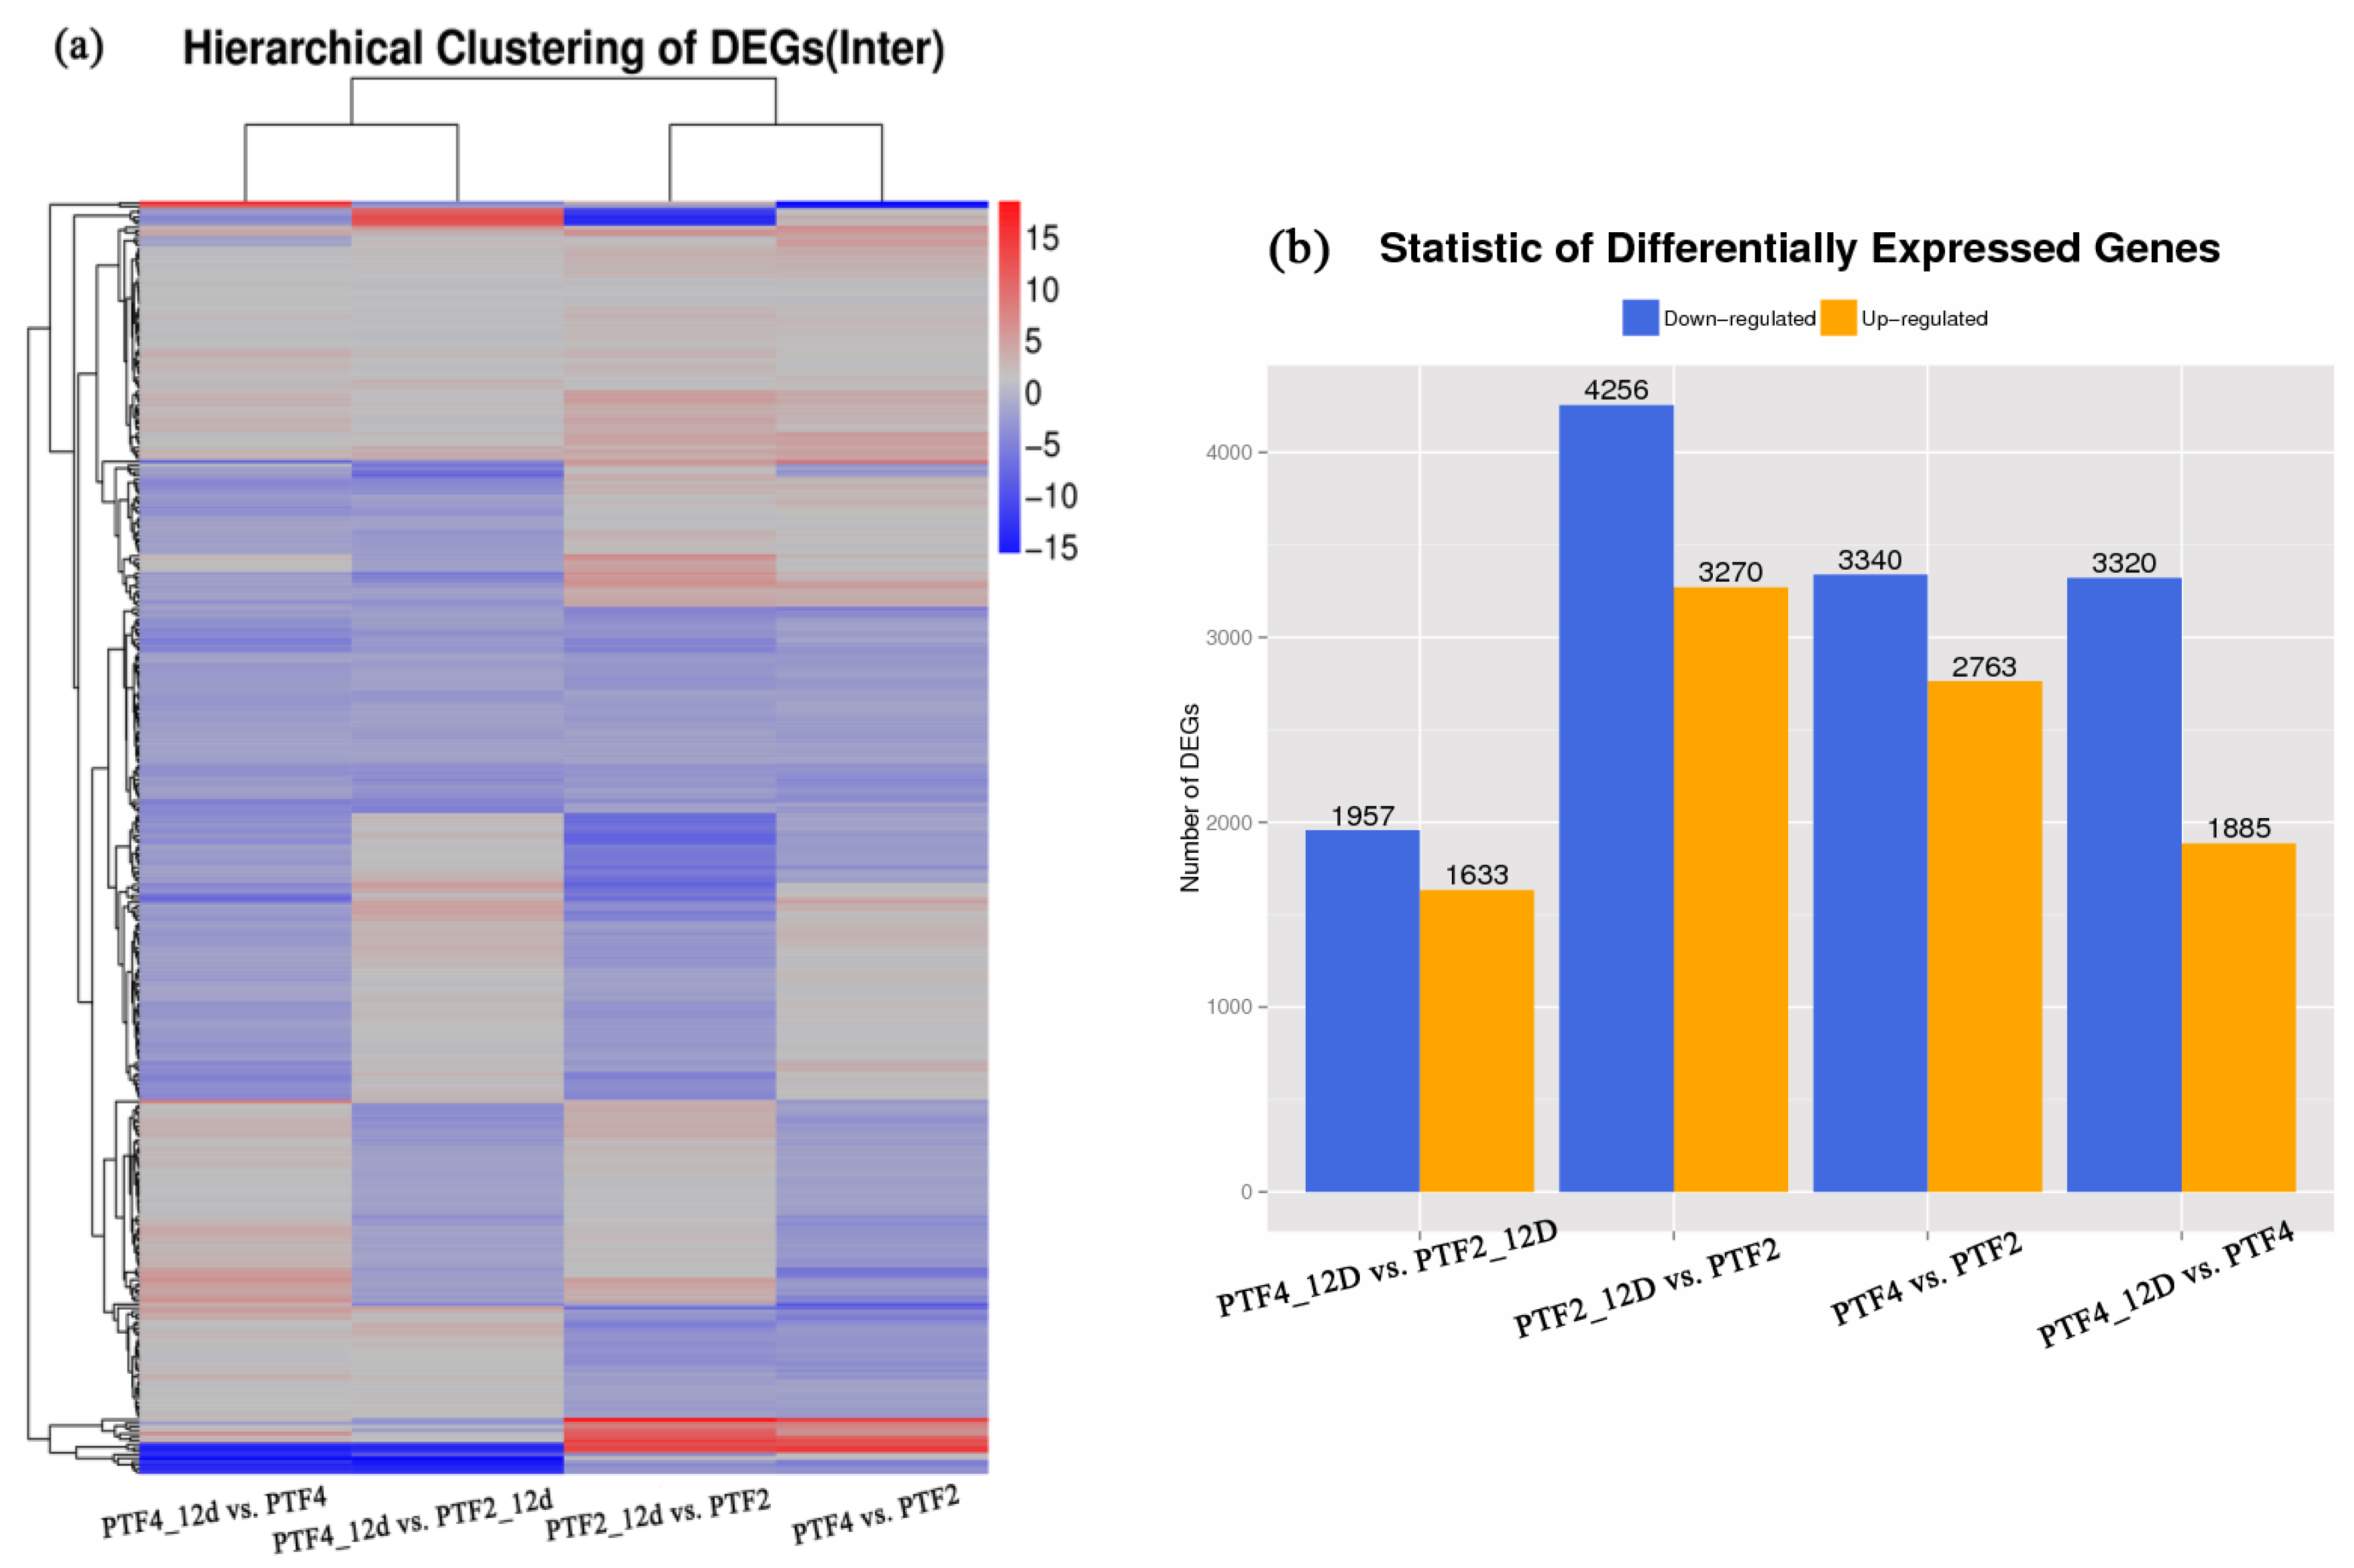
3.3. Comparison of Gene Expression Profiles between the Two P. fortunei Genotypes

To further explore the differences between diploid and autotetraploid P. fortunei under drought stress, we compared gene expression levels for four comparisons (Figure 2a) and detected 7526 (PF2 vs. PF2T_12D), 5205 (PF4 vs. PF4T_12D), 6103 (PF2 vs. PF4), and 3590 (PF2T_12D vs. PF4T_12D) genes that were differentially expressed (Tables S2–S5). In the PF2 vs. PF2T_12D comparison, 3270 genes were upregulated and 4256 were downregulated, while in comparing PF4 vs. PF4T_12D, 1885 and 3320 genes were upregulated and downregulated, respectively (Figure 2b). Moreover, a total of 9591 DEGs were identified in these two P. fortunei genotypes, and 3140 DEGs were common in the PF2 vs. PF2T_12D and PF4 vs. PF4T_12D comparisons. These common DEGs indicated a general drought response. Among the differentially expressed genes (DEGs), 622, 402, 509, and 356 were annotated as transcription factors (TFs) in PF2 vs. PF2T_12D, PF4 vs. PF4T_12D, PF2 vs. PF4, and PF2T vs. PF4T_12D, respectively (Tables S2–S5 for details).
To assign the DEGs to pathways, we performed a KEGG pathway analysis. Among these obtained DEGs, 4606 (61.20%) and 3121 (59.96%) were mapped to 128 and 126 KEGG pathways for PF2 vs. PF2T and PF4 vs. PF4T_12D comparisons, respectively. The metabolic pathway was the most represented, with 1149 (24.95%) DEGs (PF2 vs. PF2T_12D) and 837 (26.82%) DEGs (PF4 vs. PF4T_12D), followed by secondary metabolites biosynthesis, plant-pathogen interaction, and plant hormone signal transduction in two comparisons (Tables S6 and S7). The DEGs were also annotated with GO terms. In the PF2 vs. PF2T and PF4 vs. PF4T comparisons, under the category of cellular component, cell and cell part were the most represented terms, with 2860 DEGs (83.0%) and 1956 DEGs (82.3%), followed by intracellular (71.8% and 70.8%), and intracellular part (71.6% and 70.5%). The terms assigned under the biological process and molecular function categories are list in Supplementary Figures S1 and S2.

3.4. Drought Responsive Genes in the Two P. fortunei Genotypes

According to the expression patterns in the four comparisons, the DEGs were classified into eight types: A (upregulated in both PF2 vs. PF2T_12D and PF4 vs. PF4T_12D), B (downregulated in PF2 vs. PF2T_12D and upregulated in PF4 vs. PF4T_12D), C (downregulated in both PF2 vs. PF2T_12D and PF4 vs. PF4T_12D), D (upregulated in PF2 vs. PF2T and downregulated in PF4 vs. PF4T_12D) (Table S8); E (upregulated in both PF2 vs. PF4 and PF2T_12D vs. PF4T_12D), F (downregulated in PF2 vs. PF4 and upregulated in PF2T_12D vs. PF4T_12D), G (downregulated in both PF2 vs. PF4 and PF2T_12D vs. PF4T_12D), and H (upregulated in PF2 vs. PF4 and downregulated in PF2T_12D vs. PF4T_12D) (Table S9). Finally, we detected co-expressed DEGs in types A and E, A and G, C and E, and C and G, and 258 co-expressed DEGs (as the type I) were selected as the drought responsive candidate genes (Table S10). Among these co-expressed DEGS, 24 of them coding 17 transcription factor (TF) families were identified (Table 2). Moreover, the correlation coefficient of these DEGs between these two genotypes was analyzed, with the correlation coefficient being 0.736 for PF2 vs. PF2T_12D and PF4 vs. PF4T_12D comparisons (Figure S3). These results provided further evidence that these 258 co-expressed DEGs were the drought responsive genes. Furthermore, based on the GO and KEGG pathway annotations, 172 and 147 DEGs were used to perform GO and KEGG analysis, respectively (Figure 3 and Figure 4 and Table S11).

3.5. Analysis of Small RNA Library Data

We obtained a total of 15,707,321 (PF2), 14,828,766 (PF2T_12D), 14,153,413 (PF4), and 16,151,854 (PF4T_12D) raw reads from the four libraries. After initial processing, 15,534,913 (PF2), 14,759,868 (PF2T_12D), 14,024,334 (PF4), and 16,067,026 (PF4T_12D) clean reads were obtained. The sRNAs were mapped to the P. fortunei genome sequence, and classified and annotated as miRNAs, rRNAs, snRNAs, and snoRNAs by searches against the GenBank, Rfam, and miRbase 21.0 databases. A total of 22,521 unique miRNAs were obtained from the PF2 library, accounting for 0.74% of the unique sRNAs in PF2 (Table 3). Among the four libraries, the largest number of miRNA sequences that mapped to the genome was from the PF2 library, possibly because the reference genome in this present research was from the diploid P. fortunei species.

3.6. Identification of Conserved and Novel miRNAs

Unique reads that mapped to the mature plant miRNAs in miRBase 21.0 with less than three mismatches were considered to be the conserved miRNAs. We identified 146 precursors that fulfilled the criteria, giving 63 unique mature miRNAs, which have also been identified as mature miRNAs in other plant species. These 63 mature miRNAs are produced by 137 precursors and are distributed in 30 families (Table S12). The miR156 family was the largest, with 16 members, followed by the miR395, miR164, and miR166 families. Pfo-miR166a-3p was the most abundant miRNA, with 1,131,274 (PF2), 869,592 (PF2T_12D), 866,819 (PF4), and 1,080,900 (PF4T_12D) clean reads in these four libraries, respectively.
To identify novel miRNAs, the unannotated unique sRNA sequences were mapped to the P. fortunei genome sequence. Then, the secondary structures of the mapped sequences were predicted to identify sRNAs that could form the characteristic hairpin structure. As a result, we identified 100 novel miRNAs belonging to 79 miRNA families. Among these novel miRNA candidates, except four novel miRNA candidates (Pfo-mir31b, Pfo-mir31c, Pfo-mir32, and Pfo-mir542), the miRNA* for 96 of them were identified, supporting their identification as novel miRNAs. The minimal folding free energies for the precursor pre-miRNA sequences varied from −153 to −18 kcal mol−1 (average: −52.3 kcal mol−1) in these identified novel miRNAs. The minimal free energies of plant miRNA precursors are commonly below −18 kcal mol−1 [48]. Furthermore, RNA sequences with average minimal free energies close to −46 kcal mol−1 are considered to be true miRNAs, compared with the higher values typical for other categories of RNAs [49,50]. Therefore, we concluded that these novel P. fortunei miRNAs are likely to be real miRNAs. Detailed information about the miRNA sequences is shown in Supplementary Table S13.

3.7. Analysis of miRNA Expression Profiles in the Two P. fortunei Genotypes

The abundances of the miRNAs in the four sRNA libraries were normalized in order to calculate the fold changes and p-values. If the fold-changes were >1 or <−1 and p-values were <0.05, the miRNAs were considered to be differentially expressed miRNAs. A total of 212 miRNAs in the four libraries were identified as being differentially expressed. Among them, we found 109 differentially expressed miRNAs in the PF2 vs. PF2T_12D comparison, including 50 (10 upregulated and 40 downregulated) that were conserved miRNAs and 59 (31 upregulated and 28 downregulated) that were novel miRNAs. In the PF4 vs. PF4T_12D comparison, 77 miRNAs were differentially expressed; among them, 34 (12 upregulated and 22 downregulated) were conserved miRNAs and 43 (23 upregulated and 20 downregulated) were novel miRNAs. In addition, 32 miRNAs in common were differentially expressed in both of the two P. fortunei genotypes under drought stress. Of these miRNAs, 21 (eight upregulated and 13 downregulated) were expressed in the same expression form in the two P. fortunei genotypes under drought stress. Moreover, we also found that 110 and 138 miRNAs were differentially expressed in the PF2 vs. PF4 and PF2T_12D vs. PF4T_12D comparisons, respectively. According to the same manner that was used to select the drought responsive genes, we found 11 miRNAs likely to be the drought responsive miRNAs (Tables S12 and S13).

3.8. Identification of miRNA Target Genes Associated with Drought Stress

To understand the potential regulatory roles of theses identified differentially expressed miRNAs, we constructed and sequenced four degradome libraries. After removing low-quality adapter and redundant sequences, 20,229,141 (PF2), 18,274,196 (PF2T_12D), 22,134,487 (PF4), and 17,221,529 (PF4T_12D) clean reads were obtained. A total of 17,140,999 (84.73%), 15,376,217 (84.14%), 17,032,997 (76.95%), and 13,537,235 (78.61%) tags were mapped to the P. fortunei genome (Table S14). The CleaveLand pipeline [51] was used to detect candidate target genes. The target genes were classed into four categories (Figure 5) according to the relative abundances of the degradome tags at the transcript sites. Twenty-eight potential targets were cleaved by miRNAs from nine conserved miRNA families and 12 novel miRNAs (Table S14). Among these target genes, the largest category was ‘Category 2’. The target genes were annotated by the GO database to better understand the roles of these identified miRNAs and also to illustrate the correlation between miRNA and mRNA.

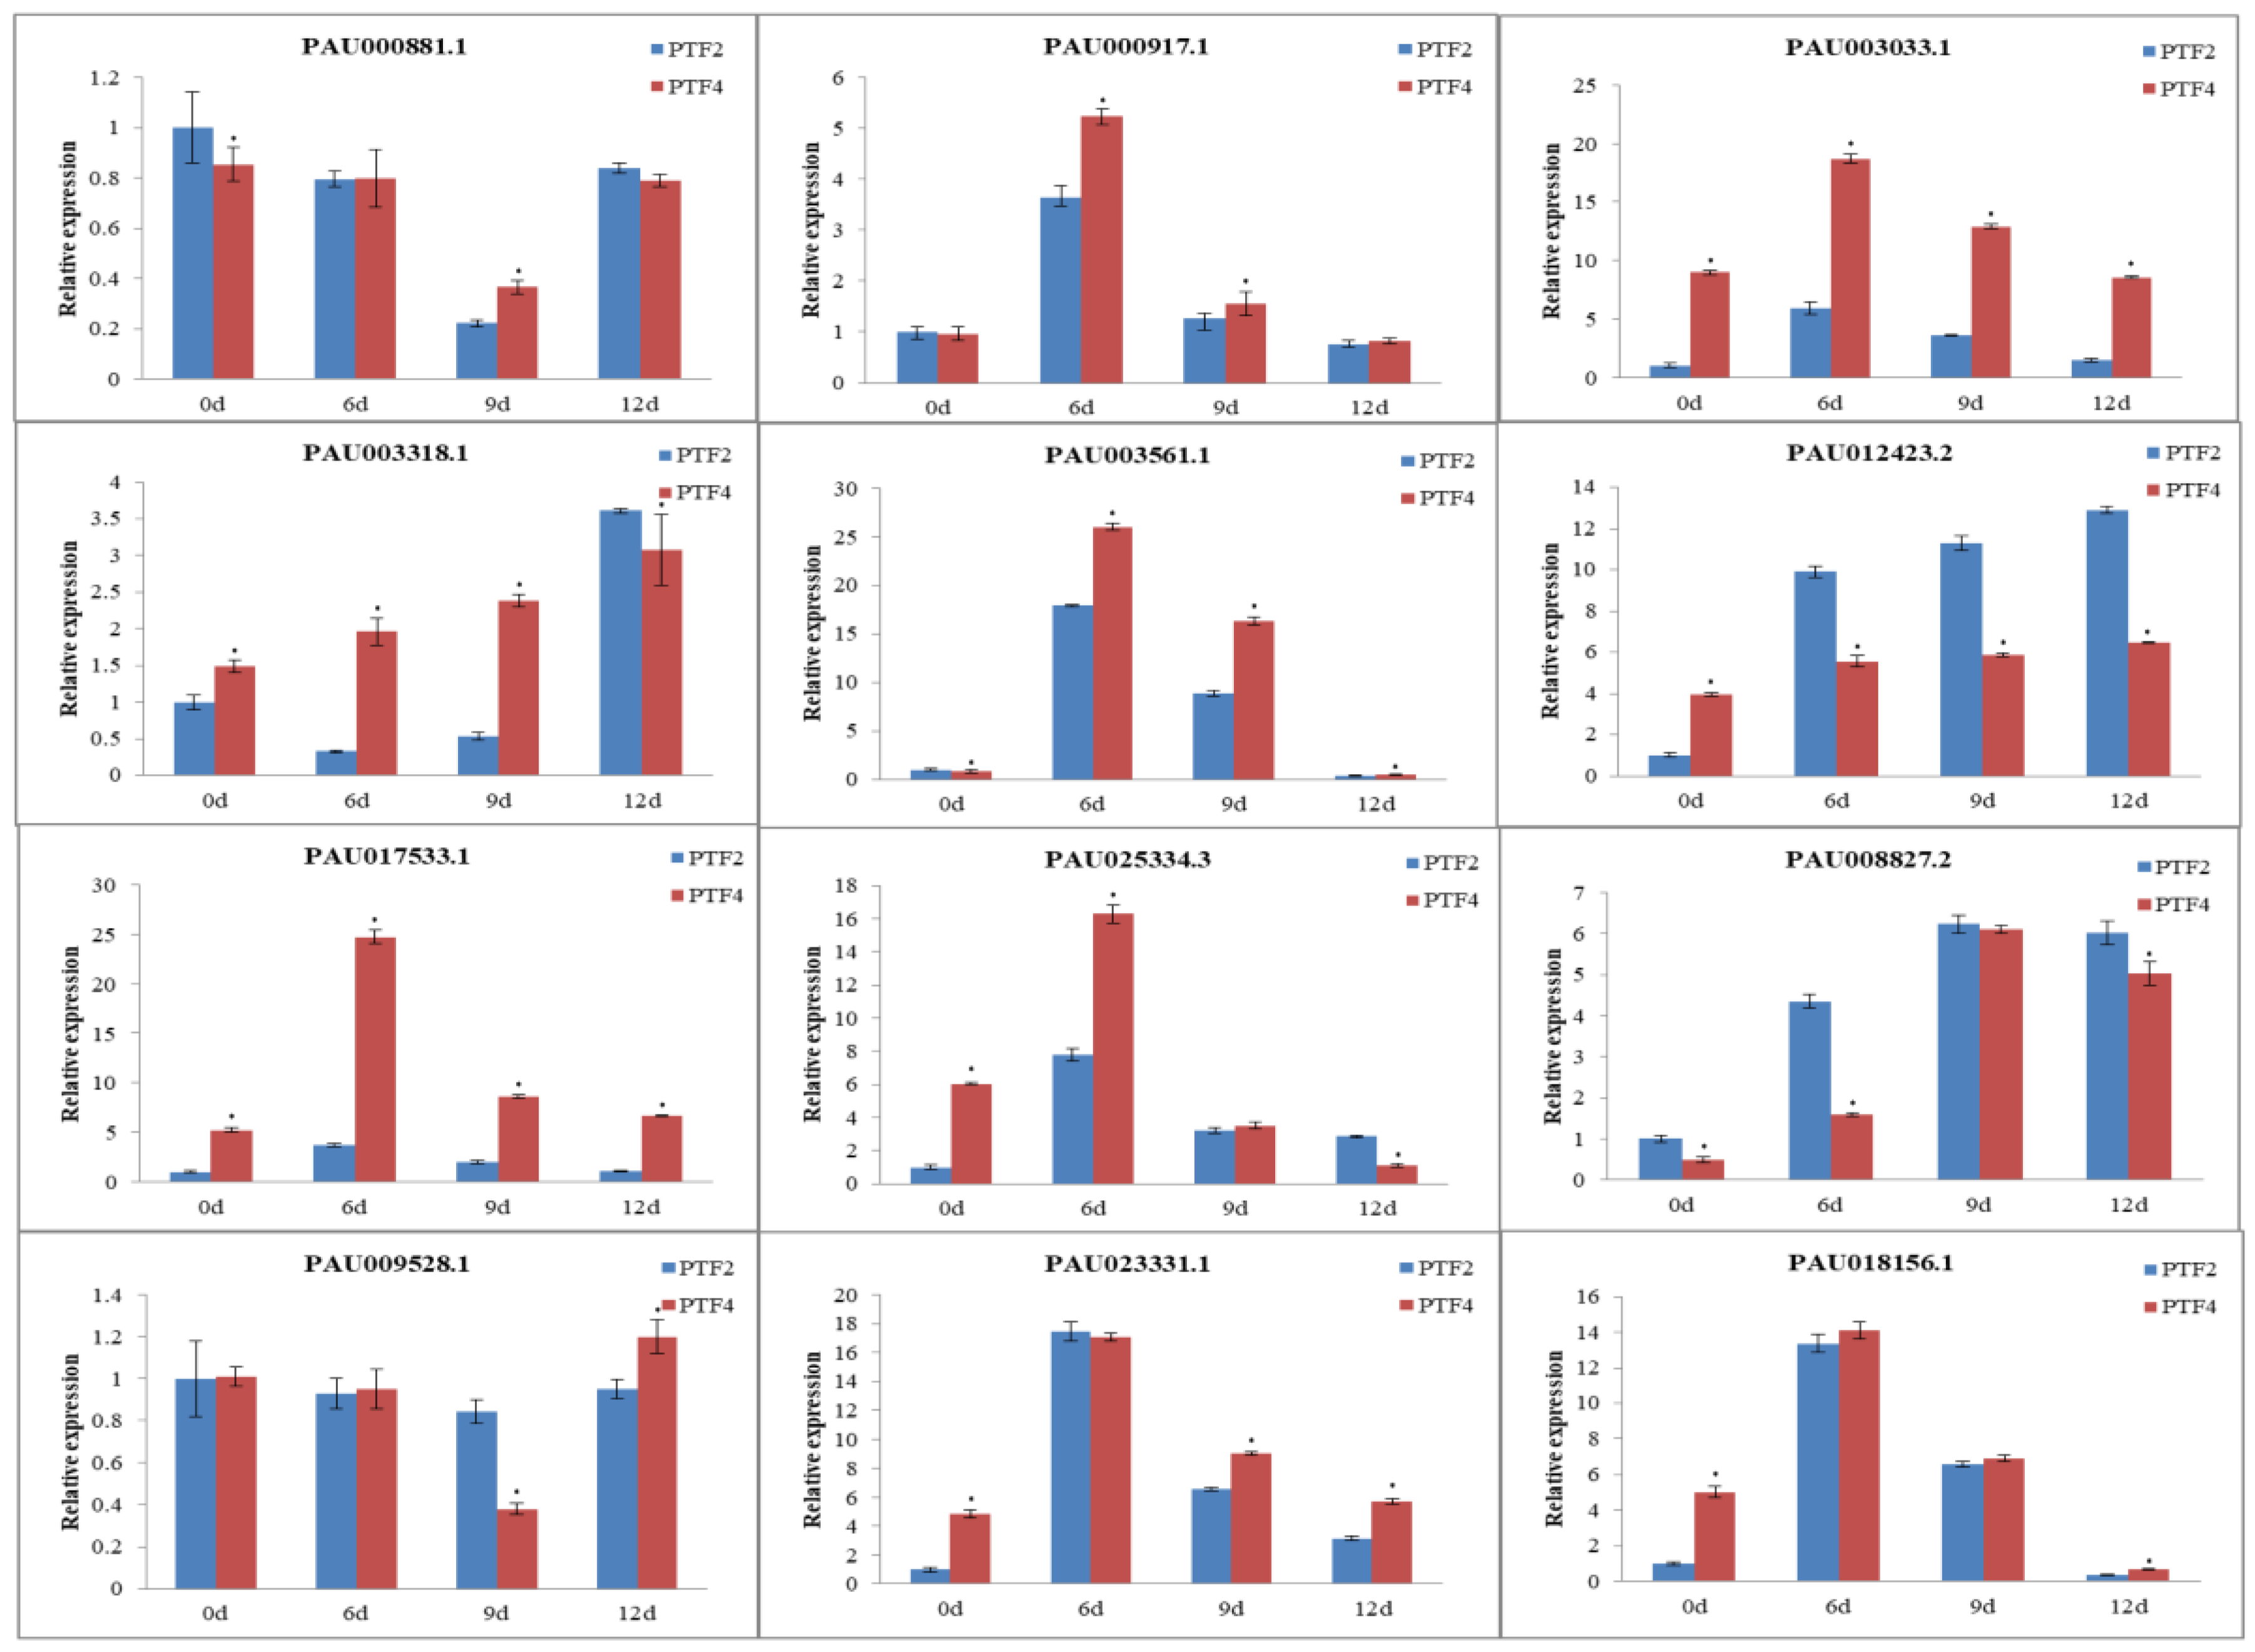
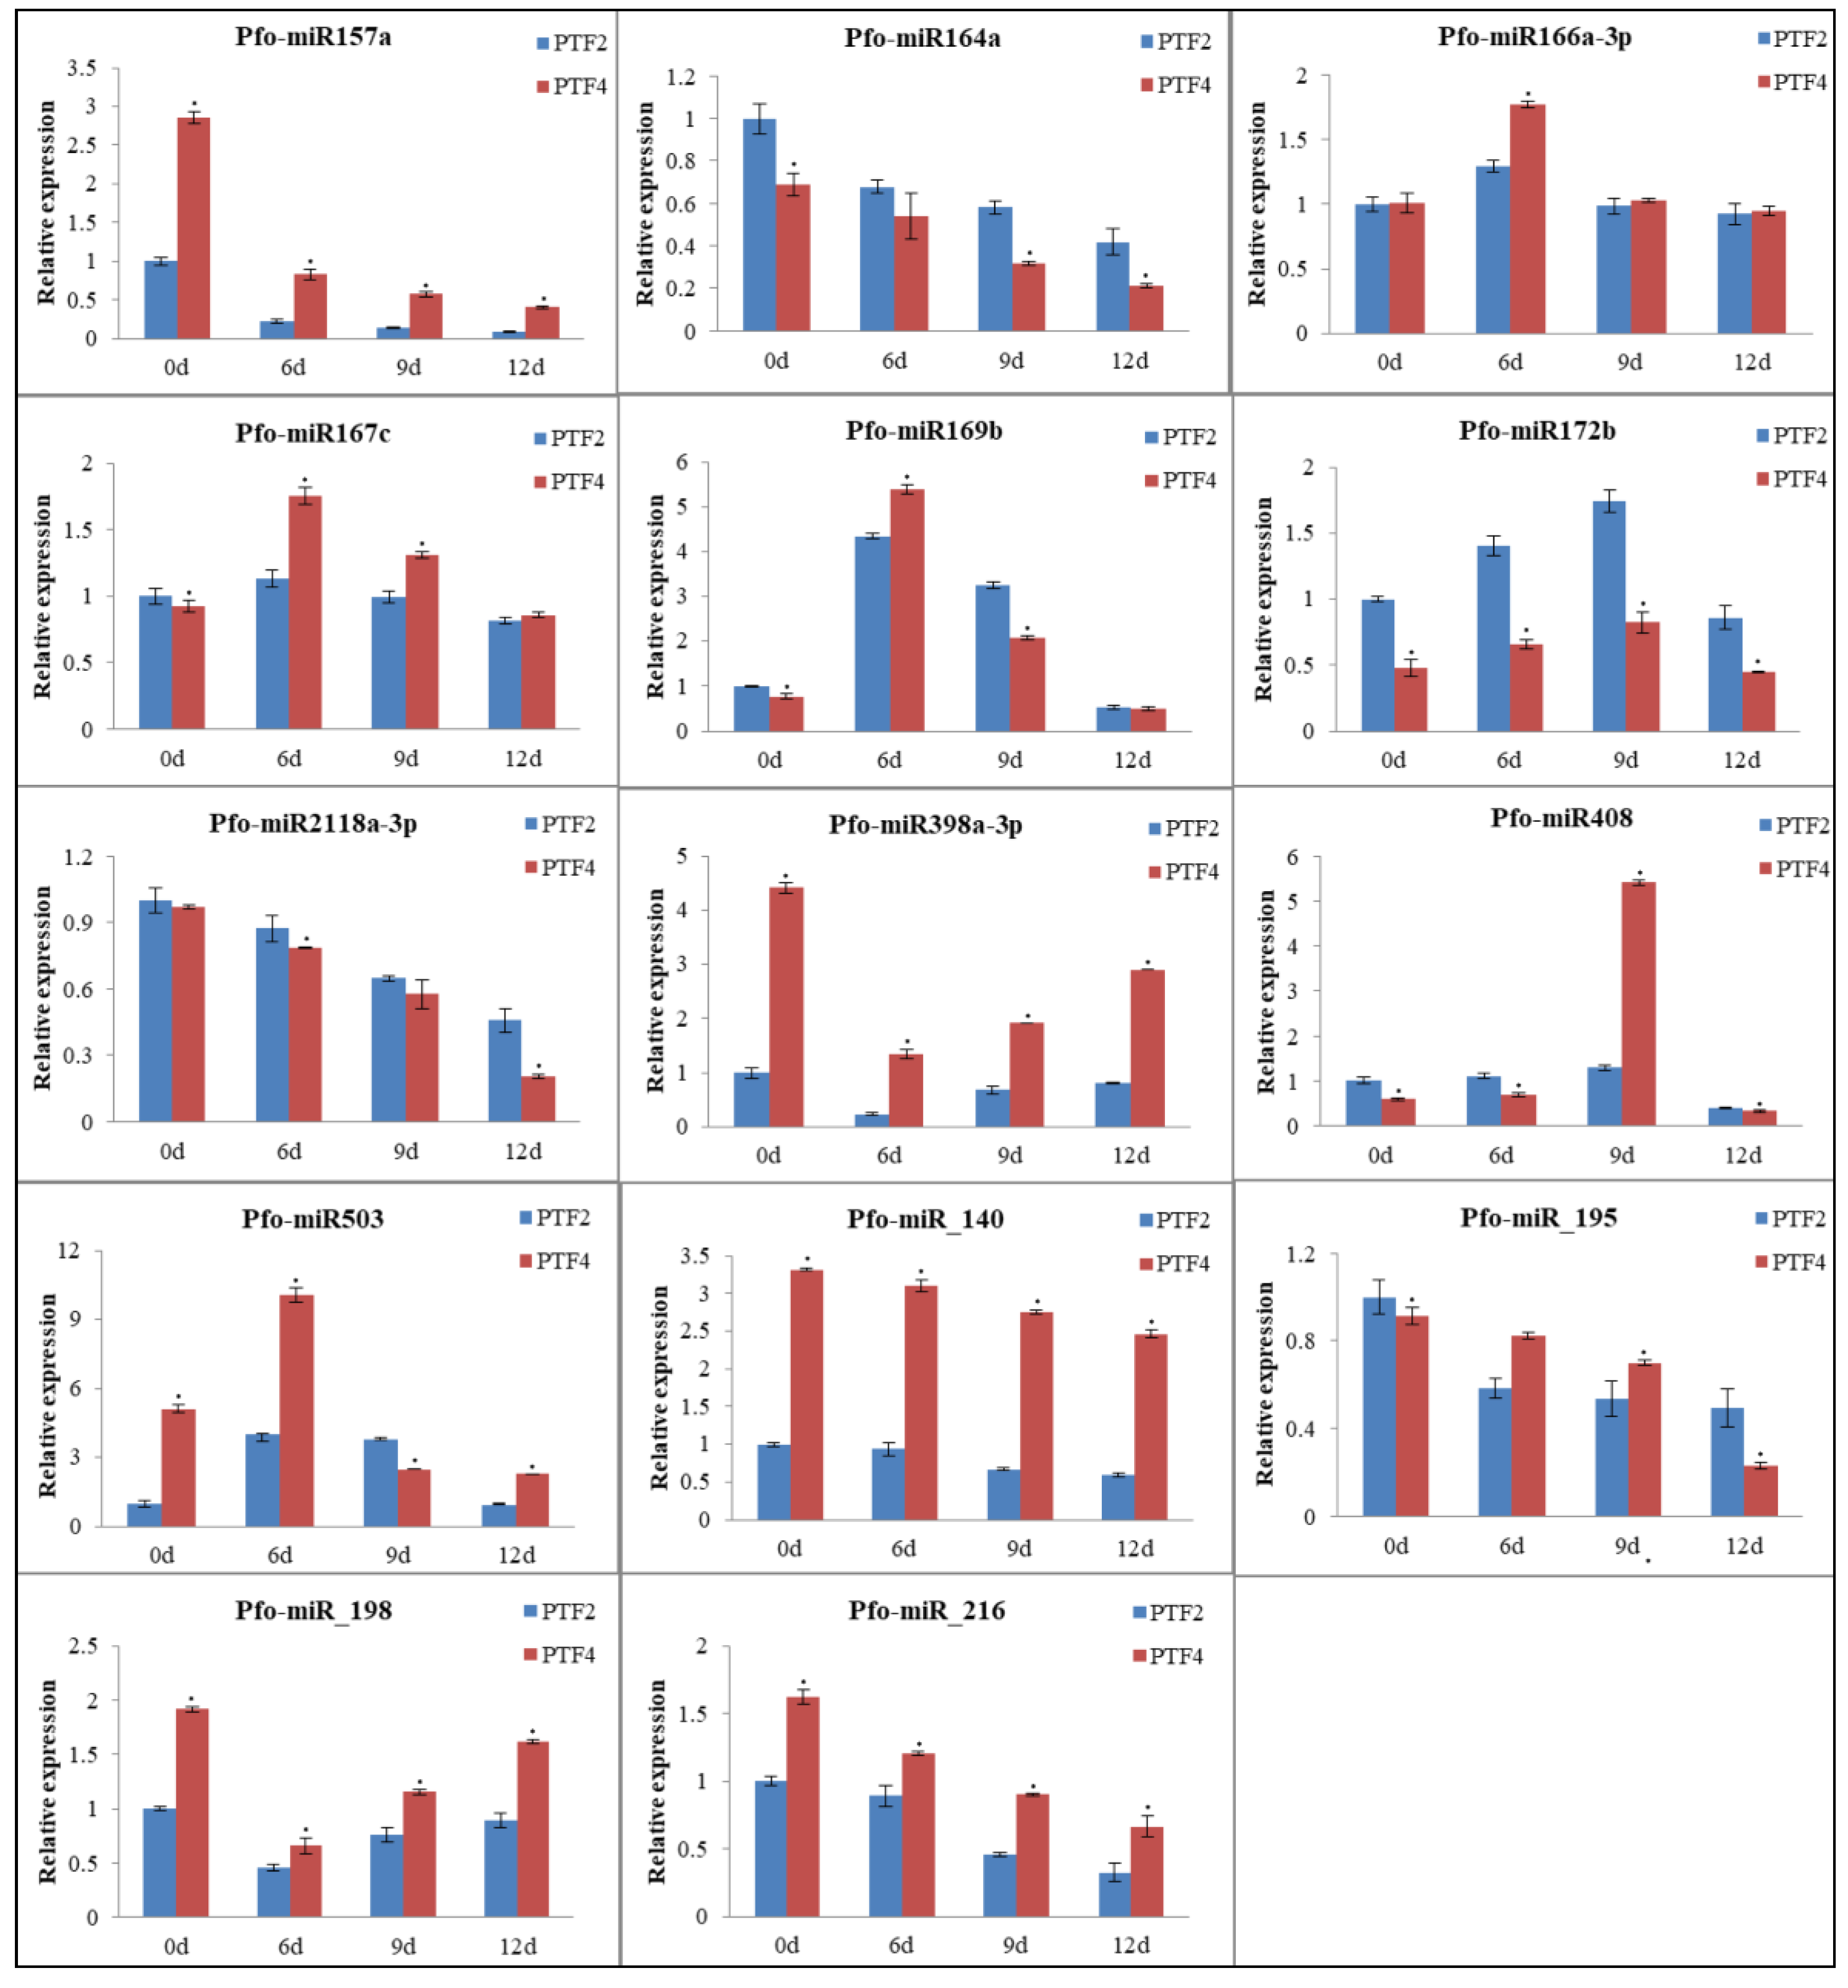
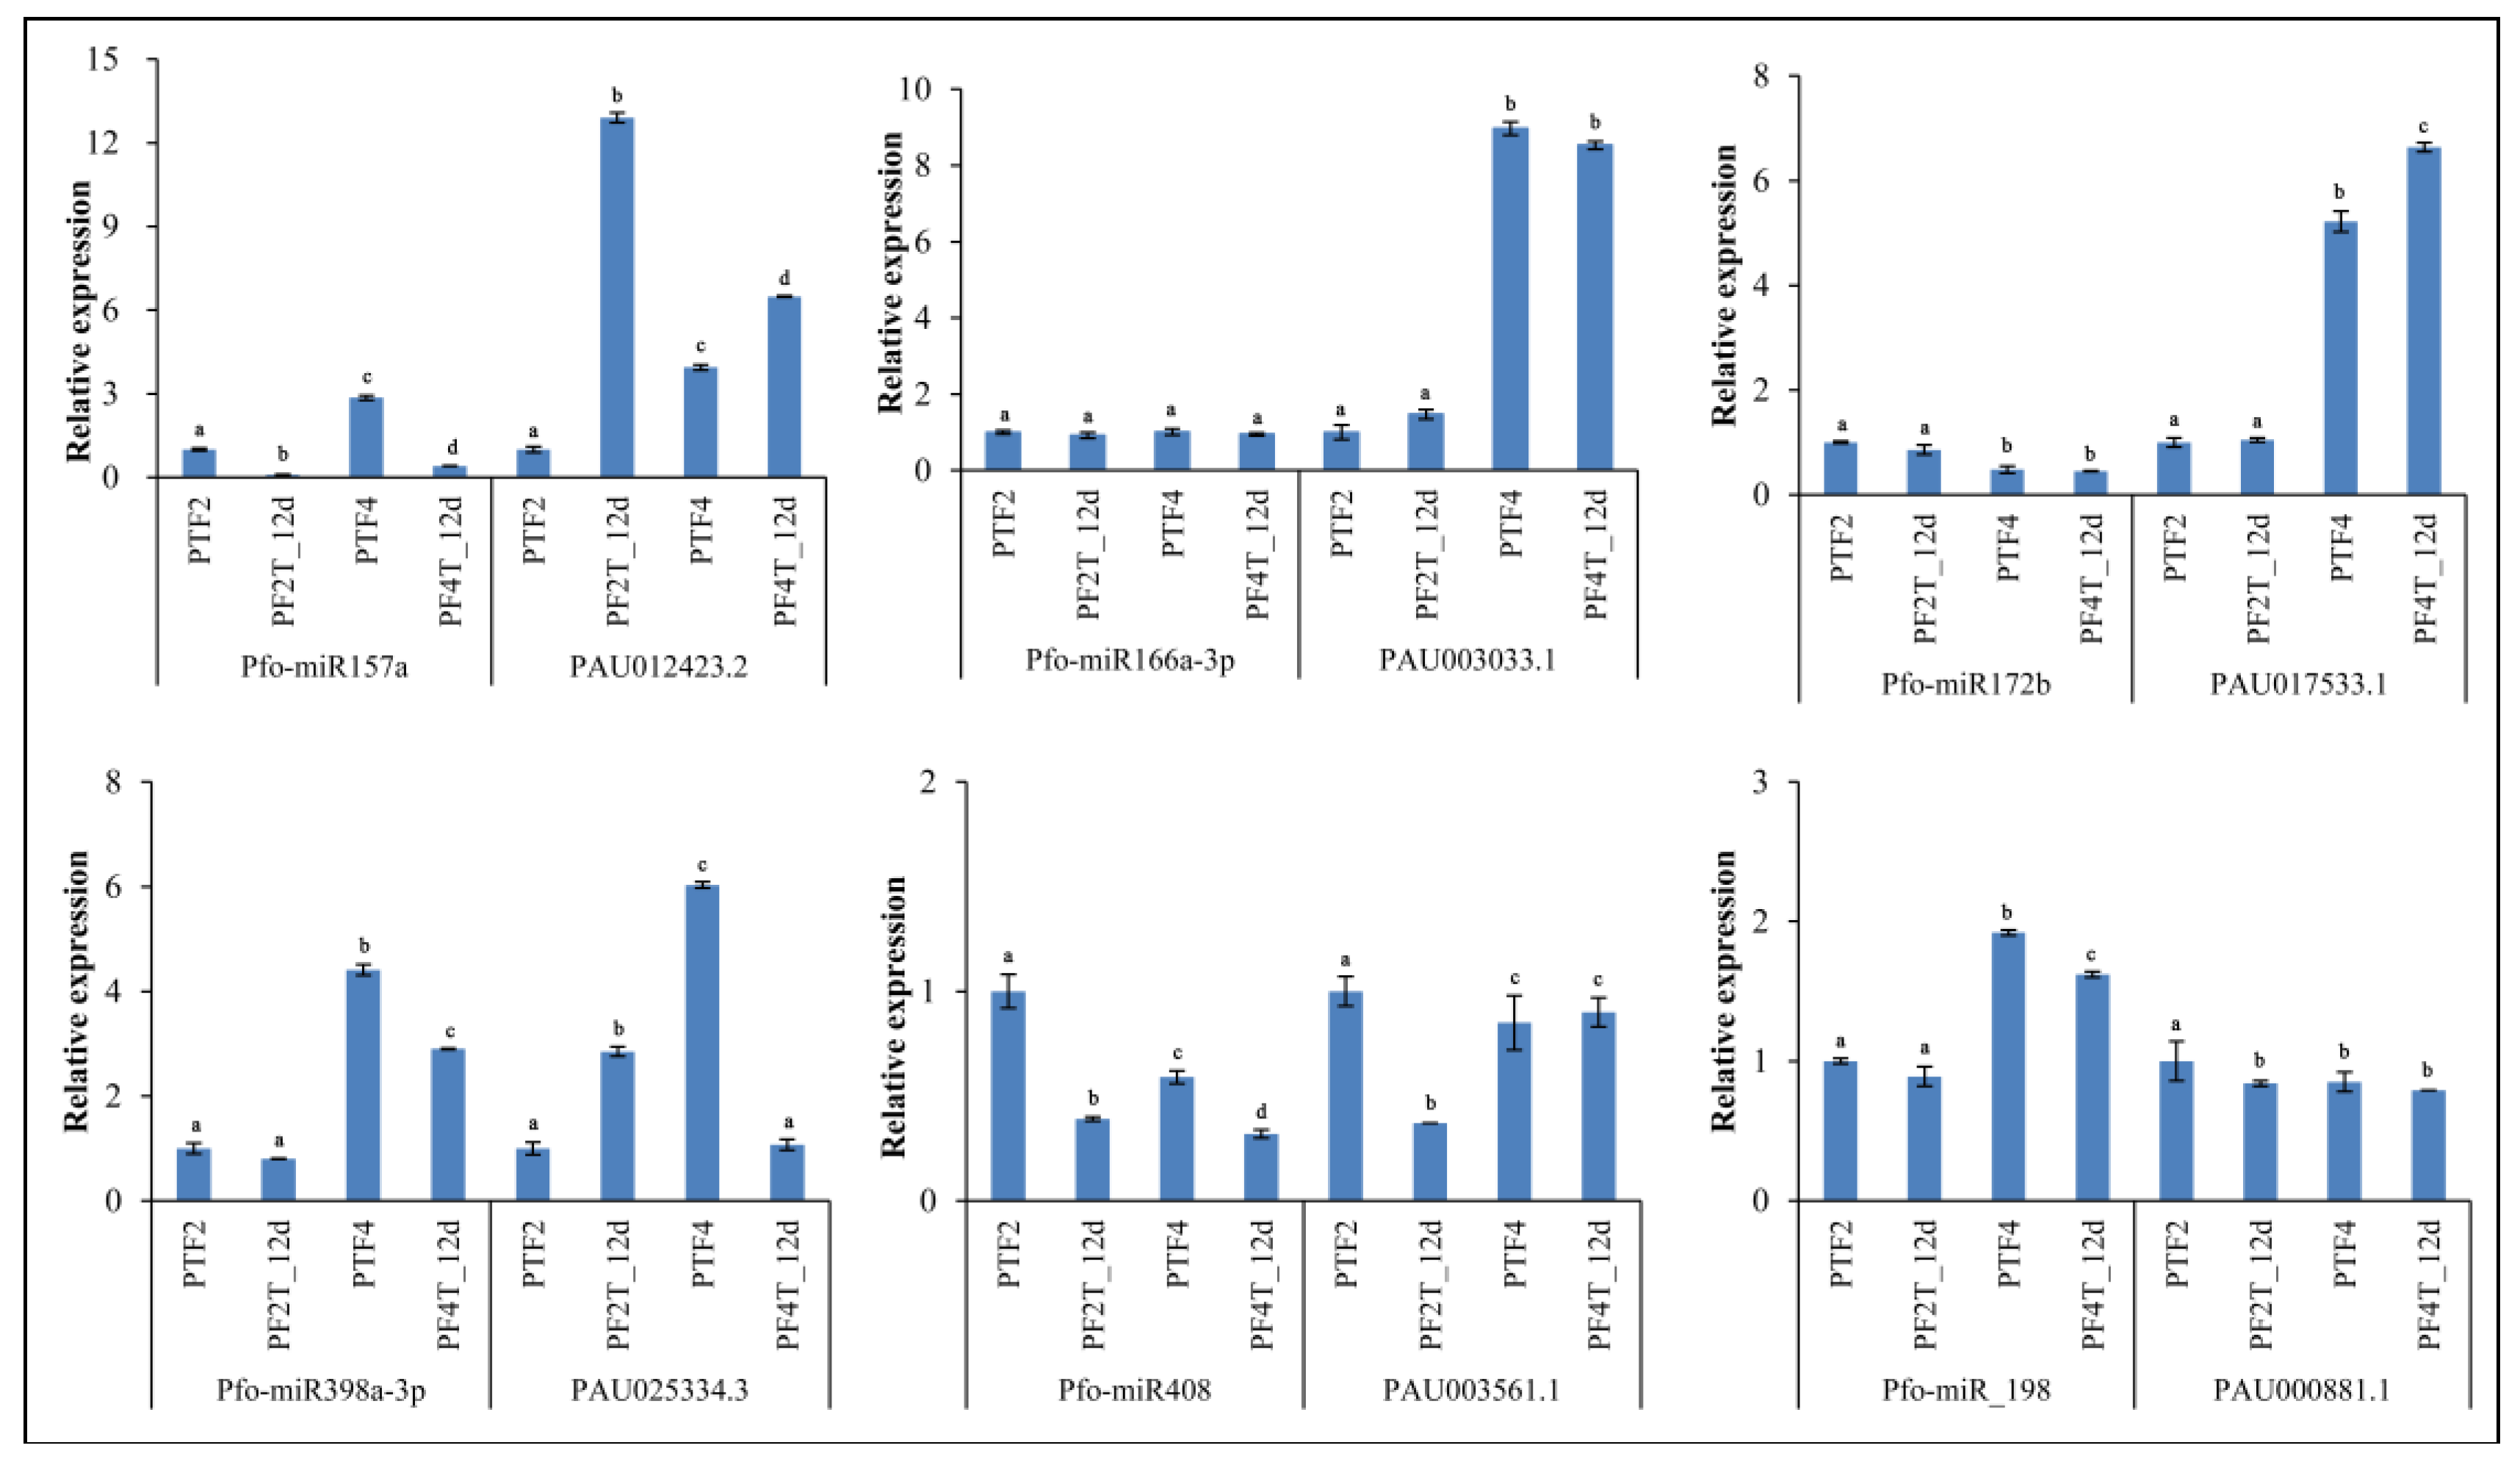
3.9. Confirmation of Genes, miRNAs, and miRNA Targets by qRT-PCR

To confirm the Illumina sequencing data, 12 genes, 14 miRNAs, and six target genes from diploid and autotetraploid samples were monitored by qRT-PCR assays at 0, 6, 9, and 12 days after drought treatment. Figure 6 shows that the expression profiles of the genes tested by qRT-PCR exhibited similar trends to the deep sequencing except the genes PAU000881.1 (uncharacterized protein) and PAU017533.1 (4-beta-N-acetylglucosaminyltransferase-like isoform 1), which were down and up slightly in the PF4T_12D and PF2T_12D, respectively, compared to their control samples PF4 and PF2. For the miRNAs validation, the expressions of Pfo-miR166a-3p and Pfo-miR408 in the PF4T_12D samples showed inverse trends with the results of the deep sequencing but showed the same trends with that in the PF2T_12D samples compared to their corresponding control samples. The rest of the miRNAs exhibited the same trends as the results determined by the deep sequencing (Figure 7). We also found that, whether for genes or miRNAs, the expressions displayed the different trends under different time of drought treatments (Figure 6 and Figure 7).
Furthermore, the potential correlation between miRNAs and targets was also investigated. As shown in Figure 8, the expressions of three target genes (PAU012423.2, PAU003033.1, and PAU017533.1) had negative correlations with the corresponding miRNAs (Pfo-miR157a, Pfo-miR166a-3p, and Pfo-miR172b), and other two target genes (PAU003561.1 and PAU003561.1) showed positive correlations with miRNAs (Pfo-miR408 and Pfo-mir198). Moreover, the rest of the targets showed mixed correlations with their miRNAs (Figure 4). The same results have been reported in other plant species such as Phalaenopsis aphrodite Rchb.f. [52] and cotton [53]. Meanwhile, the results implied that the expression patterns between miRNAs and their target genes were very complex.

4. Discussion

Transcriptome sequencing is a convenient way of rapidly obtaining genomic information when a reference genome is not available, while a transcript that might be overlapping refers to a reference gene in genome. Genome-wide transcriptome analysis can capture an unbiased view of the complete RNA transcript profile, which allows the transcriptional level of each gene to be monitored. In this study, based on the Paulownia reference genome, we used transcriptome, miRNA, and degradome sequencing to identify the genes and miRNAs related to the response of Paulownia plants to drought stress. As a result, 258 DEGs and 11 miRNAs related to drought stress response were identified from the two P. fortunei genotypes. Comparing the results from Dong et al. [47] and Fan et al. [54], we found that less DEGs and miRNAs were identified in this study due to different experimental designs (including the screening strategies for drought responsive genes and reference genome for gene identification) between the study by Dong et al. [47] and this present research.
Molecular markers are closely related to several different agronomic characters and abiotic and disease resistance traits. These molecular markers include hybridization-based and PCR-based markers that have been reported in many crop species and tree species [55,56,57,58,59,60]. Recently, with the advent of next-generation sequencing, the transcriptome sequencing technology not only can capture the genes expressed at the transcriptional level but can also provide the opportunity to detect nucleotide variations in the model or non-model species. Thus, the sequence-based markers, single nucleotide polymorphism (SNP) markers, were generated rapidly. The SNP markers had been previously developed for many model or non-model species such as rice, Arabidopsis, Hemarthria, eggplant, and legumes [61,62,63,64,65,66,67]. Furthermore, Han et al. [63] previously reported the discovery of the novel molecular markers based on the transcription factors in legumes species. In this study, we found 622 and 402 DEGs were annotated as transcription factors in PF2 vs. PF2T_12D and PF4 vs. PF4T_12D comparisons, respectively. These TFs may act as excellent targets for developing drought stress-related molecular markers in Paulownia species in the future.
Transcriptional regulation is mediated by the interplay between TFs and specific-regulatory regions of the genome, leading to gene activation and/or other changes [68]. Therefore, some TFs could be considered as the master regulators, because they are involved in the regulation of other TFs and downstream genes, protein phosphatases, protein kinases, and enzymes involved in phospholipid metabolism, and the components of calcium-coupled phosphoprotein cascades [69]. In this study, we focused on TF genes that were differentially expressed in response to drought stress in P. fortunei. Several putative TF families were identified in the leaves of P. fortunei, including MYB, WRKY, bHLH, zinc finger, NAC, HSF, and AP2/EREBP.
The MYB family of TFs contains a conserved MYB domain, which is present in all eukaryotes. In Arabidopsis, the flavonoids were induced by stress, which was implied to be a positive response to drought stress [70]. Overexpression of MYB12, a regulator of flavonol synthesis, resulted in less water loss [71]. In Arabidopsis, MYB41 was induced by drought and may be involved in regulating cuticle deposition and cell expansion under drought stress [72]. Many R2R3-MYB proteins in Arabidopsis have been reported to be involved in drought responses. For example, for MYB60, a regulator of stomatal movement, its overexpression resulted in hypersensitivity to water deficiency, and it was found to be downregulated under drought stress [73]. In this study, 39 and 26 MYB TFs were upregulated in PF2 vs. PF2T and PF4 vs. PF4T, respectively. We found that six of these MYB TFs were upregulated in both comparisons, while three were downregulated in PF2 vs. PF2T and upregulated in PF4 vs. PF4T.
The phytohormone ABA was involved in plant adaptation under drought stress [18]. It was known that genes (including TFs) involved in regulatory networks are active under drought conditions (Figure S4) [24]. In this study, we identified WRKY and NAC TFs that were differentially expressed in the drought-stressed plants. Previous studies have shown that WRKY18 and WRKY60 were the positive regulators of ABA signaling during stress response and seed germination, while WRKY40 was a negative regulator of ABA signaling. WRKYs18 and 60 are weak transcriptional activators, whereas WRKY40 binds to the promoters of stress-induced TF genes, such as DREB2A, DREB1A/CBF3, and MYB2, and represses the expression of these genes [74,75]. ABA signal perception leads to the induction of WRKYs18 and 40 and their products can bind to the W-box in the WRKY60 promoter sequence, thereby inducing it [74]. In this study, 14 and 13 WRKY TFs were found to be upregulated in PF2 vs. PF2T and PF4 vs. PF4T, respectively. Overexpression of several stress-responsive NAC TFs in Arabidopsis and rice has been reported to impart drought tolerance in transgenic plants. For example, transgenic plants overexpressing NAC TFs were shown to have enhanced drought tolerance and increased sensitivity to ABA [76,77]. Similarly, overexpression of ATAF1, another NAC TF, improved drought tolerance [78]. In the present study, we found that lots of NAC TFs were involved in ABA signaling and that their biosynthesis was significantly upregulated or downregulated in response to drought stress. This finding is consistent with our expectation that ABA plays key roles in drought stress responses and plant growth and development.
Several candidate genes encoding chlorophyll a/b binding proteins were identified in this study. Typically, this protein family contains a chlorophyll-binding CAB domain. There are some indications that these genes are involved in high light protection and encode light-harvesting-like proteins. All organisms that perform oxygenic photosynthesis also contain light-induced-like proteins (LILs), which contain a CAB domain and encode the light-harvesting antenna found in higher plants [79]. The LILs are negatively regulated by the light-harvesting complex (LHC) proteins; for example, under high light conditions, when the expression of LILs is increased, the expression of LHCs is repressed. In Arabidopsis [80] and rice [81] exposed to drought stress, the genes encoding LILs were found to be upregulated, indicating the general importance of these genes in plants under drought stress.
It was known that ploidy variation induces a certain type of gene expression at various levels because of epigenetic interaction between redundant genes [82,83]. In this study, all the clean sRNA reads were mapped to the P. fortunei genome. We found that the percentage of reads that mapped to the P. fortunei genome was lower in the autotetraploid library compared with the diploid library even though the diploid P. fortunei and its derived autotetraploid P. fortunei clone used in the present study were the same genome with the difference at the ploidy level. These findings indicated that whole-genome duplication did not simply increase gene expression by two-fold; indeed, the evolution of genes in genome duplication perhaps transformed the gene structure, leading to different expression patterns in the two genotypes. Furthermore, most miRNA families had more numbers than reported in a previous study, probably because of the availability of a reference genome sequence, which contains more information than the transcriptome data. In addition, many sequences were filtered out when the conserved miRNAs were identified. In this study, 63 conserved miRNAs were identified and 26 of them were identified for the first time in Paulownia, including highly conserved miRNAs such as, miR164, miR171, miR172, miR396, miR398, and miR408. Moreover, we found that 60 conserved miRNAs and 64 novel miRNAs were upregulated or downregulated predominantly in only one of the genotypes after drought treatment; for example, pfo-miR160a/b/c-3p, pfo-miR164i, and pfo-miR166b-3p were downregulated only in diploid clones, and pfo-miR530b and pfo-miR5720c-3p were upregulated only in autotetraploid clones under drought stress. The different expression patterns of the above miRNAs in the two comparisons suggested that these miRNAs may be related to variations in the capacity of the two Paulownia genotypes to adapt to drought stress.
It has been shown that plant response to drought stress involves a large number of genes in regulatory networks, which are active at the transcriptional and post-transcriptional levels [84]. Degradome analysis combined with transcriptome analysis has proven to be helpful in revealing the potential relationships between DEGs, miRNAs, and target genes. In this study, the transcriptome and degradome analyses results identified eight and six target genes that were upregulated and downregulated in PF2 vs. PF2T and PF4 vs. PF4T, respectively. Among those target genes, the gene targeted by pfo-miR157 was differentially expressed in the PF2 vs. PF2T_12D and PF4 vs. PF4T_12D comparisons. MiR157 negatively targets the Squamosa promoter binding protein-like (SPL) TFs in plants, and miR157 overexpression has been found to result in the delayed onset of flowering and adult traits in Arabidopsis [85]. Current research on miR157 has focused mainly on its role in morphology changes and regulation of blooming. Here, the transcriptome and degradome sequencing data have provided evidence that drought stress can disturb the expression of a miR157 target gene, indicating a novel role for miR157 and its target in response to drought stress. We also found that pfo-miR408-3p positively regulated its corresponding targets genes which encoded the blue basic protein. The RNA-Seq results showed that the target gene blue basic protein was downregulated in the PF2 vs. PF2T_12D and PF4 vs. PF4T_12D comparisons, while the expression of pfo-miR408-3p was also downregulated in two comparisons by the qRT-PCR analysis. However, pfo-miR6262 and its target gene were both upregulated in PF2 vs. PF2T_12D. In addition, the miR160 family was reported to target auxin response factors, which are essential for plant growth and development. Under normal conditions, the auxin-responsive genes, which are regulated by miR160, were sufficient for plant growth and development. Under drought stress conditions, miR160 was found to be upregulated, which caused a reduction in the transcript levels of the genes encoding auxin response factors, resulting in the attenuation of plant growth and development. In Medicago truncatula Gaertn. and pea, miR398 was downregulated by drought treatment [24,86]. The target gene encoded the potassium channel KAT1, which may be regulated by ABA to keep the homeostasis of potassium. Additionally, it is important for osmotic adjustment, biofilm formation, and regulation of seedlings growth [87,88]. In the current study, we found that pfo-miR160e-3p was upregulated in both of the two genotypes under the drought stress, whereas pfo-miR398a/b-3p was downregulated in PF2 vs. PF2T, and slightly downregulated in PF4 vs.PF4T. These results suggested these miRNAs may play important roles in Paulownia fortunei plants under dehydration stress and implied that the correlation between miRNAs and their target genes are more complex than we previously thought.

5. Conclusions

In this research, we integrated transcriptome, miRNAs, and degradome data to investigate the drought-responsive genes and miRNAs in P. fortunei at the genome-wide. Fortunately, we have discovered 258 genes and 11 miRNAs related to drought stress response from the two P. fortunei genotypes. Based on GO and KEGG pathway annotation of these drought responsive genes and miRNAs, we found most of these genes were predicted to participate in ABA signaling and biosynthesis, photosynthesis, flavonol synthesis, and auxin signal transduction pathways. The results provide valuable information for drought tolerance molecular mechanisms that are necessary to understand in order to enhance yields under environment stresses. Furthermore, we also found that TFs, especially for the MYB, WRKY, and NCA families, play an irreplaceable role in tolerance to drought stress in Paulownia trees. These TFs may be potential targets for developing molecular markers in Paulownia species in the future.

Supplementary Materials

The following are available online at https://www.mdpi.com/1999-4907/9/2/88/s1, Table S1: Quantitative RT-PCR primers for genes and miRNAs. Table S2: Comparison of the differentially expressed genes in PF2 vs. PF2T_12D. Table S3: Comparison of the differentially expressed genes in PF4 vs. PF4T_12D. Table S4: Comparison of the differentially expressed genes in PF2 vs. PF4. Table S5: Comparison of the differentially expressed genes in PF2T_12D vs. PF4T_12D. Table S6: Comparison of the KEGG annotation of DGEs in PF2 vs. PF2T_12D. Table S7: Comparison of the KEGG annotation of DGEs in PF4 vs. PF4T_12D. Table S8: Comparisons of the consistently differentially expressed genes in PF2 vs. PF2T_12D and PF4 vs. PF4T_12D. Table S9: Comparisons of the consistently differentially expressed genes in PF2 vs. PF4 and PF2T_12D vs. PF4T_12D. Table S10: The DEGs of type I in two P. fortunei genotypes. Table S11: KEGG annotation for the type I DEGs in two P. fortunei genotypes. Table S12: The conserved miRNAs identified in two P. fortunei genotypes. Table S13: The novel miRNAs identified in two P. fortunei genotypes. Table S14: Identified miRNA target genes in P. fortunei by degradome analysis. Figure S1: Gene Ontology of the DEGs in PF2 vs. PF2T_12D. Figure S2: Gene Ontology of the DEGs in PF4 vs. PF4T_12D. Figure S3: The correlation coefficient of DEGs between two P. fortunei genotypes. Figure S4: The schematic representation of transcription factors involved in drought-stress-responses.

Acknowledgments

We thank Beijing Genomics Institute-Shenzhen (BGI-Shenzhen) for helping us with the throughput RNA-seq and sRNA-seq analyses. We also thank Edanz China for assistance with the language proofing.

Author Contributions

G.F. conceived and designed the experiments; Z.Z. performed the experiments; S.N. and Z.Z. analyzed the data; M.D. contributed reagents and analysis tools; S.N. and Y.W. wrote the paper.

Conflicts of Interest

The authors declare no conflict of interest.

References

  1. Huang, G.T.; Ma, S.L.; Bai, L.P.; Zhang, L.; Ma, H.; Jia, P.; Liu, J.; Zhong, M.; Guo, Z.F. Signal transduction during cold, salt, and drought stresses in plants. Mol. Biol. Rep. 2012, 39, 969–987. [Google Scholar] [CrossRef] [PubMed]
  2. Zhang, X.; Liu, R.; Fan, G.; Zhao, Z.; Deng, M. Study on the physiological response of tetraploid paulownia to drought. J. Henan Agric. Univ. 2013, 47, 543–551. [Google Scholar]
  3. Raes, J. Duplication and divergence: The evolution of new genes and old ideas. Ann. Rev. Genet. 2004, 38, 615–643. [Google Scholar]
  4. Jackson, J.A.; Tinsley, R.C. Parasite infectivity to hybridising host species: A link between hybrid resistance and allopolyploid speciation? Int. J. Parasitol. 2003, 33, 137–144. [Google Scholar] [CrossRef]
  5. Ramsey, J.; Schemske, D.W. Neopolyploidy in flowering plants. Ann. Rev. Ecol. Syst. 2002, 33, 589–639. [Google Scholar] [CrossRef]
  6. Ni, Z.; Hu, Z.; Jiang, Q.; Zhang, H. Gmnfya3, a target gene of mir169, is a positive regulator of plant tolerance to drought stress. Plant Mol. Biol. 2013, 82, 113–129. [Google Scholar] [CrossRef] [PubMed]
  7. Yang, J.; Zhang, N.; Mi, X.; Wu, L.; Ma, R.; Zhu, X.; Yao, L.; Jin, X.; Si, H.; Wang, D. Identification of mir159s and their target genes and expression analysis under drought stress in potato. Comput. Biol. Chem. 2014, 53 Pt B, 204–213. [Google Scholar] [CrossRef] [PubMed]
  8. Jovanović, Ž.; Stanisavljević, N.; Mikić, A.; Radović, S.; Maksimović, V. Water deficit down-regulates mir398 and mir408 in pea (Pisum sativum L.). Plant Physiol. Biochem. 2014, 83, 26–31. [Google Scholar] [CrossRef] [PubMed]
  9. Sorin, C.; Declerck, M.; Christ, A.; Blein, T.; Ma, L.; Lelandais-Brière, C.; Njo, M.F.; Beeckman, T.; Crespi, M.; Hartmann, C. A mir169 isoform regulates specific nf-ya targets and root architecture in arabidopsis. New Phytol. 2014, 202, 1197–1211. [Google Scholar] [CrossRef] [PubMed]
  10. Bartel, D.P. Micrornas: Target recognition and regulatory functions. Cell 2009, 136, 215–233. [Google Scholar] [CrossRef] [PubMed]
  11. Brodersen, P.; Sakvarelidze-Achard, L.; Bruun-Rasmussen, M.; Dunoyer, P.; Yamamoto, Y.Y.; Sieburth, L.; Voinnet, O. Widespread translational inhibition by plant mirnas and sirnas. Science 2008, 320, 1185–1190. [Google Scholar] [CrossRef] [PubMed]
  12. Covarrubias, A.A.; Reyes, J.L. Post-transcriptional gene regulation of salinity and drought responses by plant micrornas. Plant Cell Environ. 2010, 33, 481–489. [Google Scholar] [CrossRef] [PubMed]
  13. Wang, Y.-G.; An, M.; Zhou, S.-F.; She, Y.-H.; Li, W.-C.; Fu, F.-L. Expression profile of maize micrornas corresponding to their target genes under drought stress. Biochem. Genet. 2014, 52, 474–493. [Google Scholar] [CrossRef] [PubMed]
  14. Lv, D.K.; Xi, B.; Yong, L.; Ding, X.D.; Ying, G.; Hua, C.; Wei, J.; Wu, N.; Zhu, Y.M. Profiling of cold-stress-responsive mirnas in rice by microarrays. Gene 2010, 459, 39–47. [Google Scholar] [CrossRef] [PubMed]
  15. Nigam, D.; Kumar, S.; Mishra, D.C.; Rai, A.; Smita, S.; Saha, A. Synergistic regulatory networks mediated by micrornas and transcription factors under drought, heat and salt stresses in Oryza sativa spp. Gene 2015, 555, 127–139. [Google Scholar] [CrossRef] [PubMed]
  16. Wang, Y.; Zhao, Z.; Deng, M.; Liu, R.; Niu, S.; Fan, G. Identification and functional analysis of micrornas and their targets in platanus acerifolia under lead (pb) stress. Int. J. Mol. Sci. 2015, 16, 7098–7111. [Google Scholar] [CrossRef] [PubMed]
  17. Jover-Gil, S.; Candela, H.; Ponce, M.R. Plant micrornas and development. Int. J. Dev. Biol. 2005, 49, 733–744. [Google Scholar] [CrossRef] [PubMed]
  18. Singh, D.; Laxmi, A. Transcriptional regulation of drought response: A tortuous network of transcriptional factors. Front. Plant Sci. 2015, 6, 895. [Google Scholar] [CrossRef] [PubMed]
  19. Iuchi, S.; Kobayashi, M.; Taji, T.; Naramoto, M.; Seki, M.; Kato, T.; Tabata, S.; Kakubari, Y.; Yamaguchi-Shinozaki, K.; Shinozaki, K. Regulation of drought tolerance by gene manipulation of 9-cis-epoxycarotenoid, a key in abscisic acid biosynthesis in arabidopsis. Plant J. 2001, 27, 325–333. [Google Scholar] [CrossRef] [PubMed]
  20. Zhang, J.; Jia, W.; Yang, J.; Ismail, A.M. Role of aba in integrating plant responses to drought and salt stresses. Field Crop Res. 2006, 97, 111–119. [Google Scholar] [CrossRef]
  21. Yoshida, T.; Mogami, J.; Yamaguchi-Shinozaki, K. Aba-dependent and aba-independent signaling in response to osmotic stress in plants. Curr. Opin. Plant Biol. 2014, 21, 133–139. [Google Scholar] [CrossRef] [PubMed]
  22. Taishi, U.; Kazuo, N.; Takuya, M.; Takashi, K.; Masaru, T.; Kazuo, S.; Kazuko, Y.S. Molecular basis of the core regulatory network in aba responses: Sensing, signaling and transport. Plant Cell Physiol. 2010, 51, 1821–1839. [Google Scholar]
  23. Shinozaki, K.; Yamaguchi-Shinozaki, K. Gene networks involved in drought stress response and tolerance. J. Exp. Bot. 2007, 58, 221–227. [Google Scholar] [CrossRef] [PubMed]
  24. Shinozaki, K.; Yamaguchi-Shinozaki, K.; Seki, M. Regulatory network of gene expression in the drought and cold stress responses. Curr. Opin. Plant Biol. 2003, 6, 410–417. [Google Scholar] [CrossRef]
  25. Hussain, S.S.; Kayani, M.A.; Amjad, M. Transcription factors as tools to engineer enhanced drought stress tolerance in plants. Biotechnol. Progr. 2011, 27, 297–306. [Google Scholar] [CrossRef] [PubMed]
  26. Abe, H.; Urao, T.; Ito, T.; Seki, M.; Shinozaki, K.; Yamaguchi-Shinozaki, K. Arabidopsis atmyc2 (bhlh) and atmyb2 (myb) function as transcriptional activators in abscisic acid signaling. Plant Cell 2003, 15, 63–78. [Google Scholar] [CrossRef] [PubMed]
  27. Zheng, X.; Chen, B.; Lu, G.; Han, B. Overexpression of a NAC transcription factor enhances rice drought and salt tolerance. Biochem. Biophys. Res. Commun. 2009, 379, 985–989. [Google Scholar] [CrossRef] [PubMed]
  28. Hu, H.; Dai, M.; Yao, J.; Xiao, B.; Li, X.; Zhang, Q.; Xiong, L. Overexpressing a NAM, ATAF, and CUC (NAC) transcription factor enhances drought resistance and salt tolerance in rice. Proc. Natl. Acad. Sci. USA 2006, 103, 12987–12992. [Google Scholar] [CrossRef] [PubMed]
  29. Aharoni, A.; Dixit, S.; Jetter, R.; Thoenes, E.; van Arkel, G.; Pereira, A. The shine clade of ap2 domain transcription factors activates wax biosynthesis, alters cuticle properties, and confers drought tolerance when overexpressed in arabidopsis. Plant Cell 2004, 16, 2463–2480. [Google Scholar] [CrossRef] [PubMed]
  30. Reyes, J.; Chua, N. Aba induction of mir159 controls transcript levels of two myb factors during. Plant J. Cell Mol. Biol. 2007, 49, 592–606. [Google Scholar] [CrossRef] [PubMed]
  31. Bojović, B.; Stojanović, J. Chlorophyll and carotenoid content in wheat cultivars as a function of mineral nutrition. Arch. Biol. Sci. 2005, 57, 283–290. [Google Scholar] [CrossRef]
  32. Arnon, D.I. Copper enzymes in isolated chloroplasts. Polyphenoloxidase in beta vulgaris. Plant Phys. 1949, 24, 1–15. [Google Scholar] [CrossRef]
  33. Bates, L.; Waldren, R.; Teare, I. Rapid determination of free proline for water-stress studies. Plant Soil 1973, 39, 205–207. [Google Scholar] [CrossRef]
  34. Li, H. Principle and Technology of Plant Physiology and Biochemistry; Higher Education Press: Beijing, China, 2000. [Google Scholar]
  35. Liu, J.; Liu, X. Tutorial of Plant Physiology Experiments; Higher Education Press: Beijing, China, 2011. [Google Scholar]
  36. Langmead, B.; Salzberg, S.L. Fast gapped-read alignment with bowtie 2. Nat. Method 2012, 9, 357–359. [Google Scholar] [CrossRef] [PubMed]
  37. Mortazavi, A.; Williams, B.A.; McCue, K.; Schaeffer, L.; Wold, B. Mapping and quantifying mammalian transcriptomes by RNA-seq. Nat. Meth. 2008, 5, 621–628. [Google Scholar] [CrossRef] [PubMed]
  38. Audic, S.; Claverie, J.M. The significance of digital gene expression profiles. Genom. Res. 1997, 7, 986–995. [Google Scholar] [CrossRef]
  39. Benjamini, Y.; Yekutieli, D. The control of the false discovery rate in multiple testing under dependency. Ann. Stat. 2001, 29, 1165–1188. [Google Scholar]
  40. Kozomara, A.; Griffiths-Jones, S. Mirbase: Integrating microrna annotation and deep-sequencing data. Nucleic Acid Res. 2010, 39, D152–D157. [Google Scholar] [CrossRef] [PubMed]
  41. Meyers, B.C.; Axtell, M.J.; Bonnie, B.; Bartel, D.P.; David, B.; Bowman, J.L.; Xiaofeng, C.; Carrington, J.C.; Xuemei, C.; Green, P.J. Criteria for annotation of plant micrornas. Plant Cell 2008, 20, 3186–3190. [Google Scholar] [CrossRef] [PubMed]
  42. Addo-Quaye, C.; Eshoo, T.W.; Bartel, D.P.; Axtell, M.J. Endogenous sirna and mirna targets identified by sequencing of the arabidopsis degradome. Curr. Biol. 2008, 18, 758–762. [Google Scholar] [CrossRef] [PubMed]
  43. German, M.A.; Pillay, M.; Jeong, D.H.; Hetawal, A.; Luo, S.; Janardhanan, P.; Kannan, V.; Rymarquis, L.A.; Nobuta, K.; German, R.; et al. Global identification of microrna-target RNA pairs by parallel analysis of RNA ends. Nat. Biotechnol. 2008, 26, 941–946. [Google Scholar] [CrossRef] [PubMed]
  44. Chen, C.; Ridzon, D.A.; Broomer, A.J.; Zhou, Z.; Lee, D.H.; Nguyen, J.T.; Barbisin, M.; Xu, N.L.; Mahuvakar, V.R.; Andersen, M.R.; et al. Real-time quantification of micrornas by stem-loop rt-pcr. Nucleic Acid Res. 2005, 33, e179. [Google Scholar] [CrossRef] [PubMed]
  45. Fan, G.; Niu, S.; Zhao, Z.; Deng, M.; Xu, E.; Wang, Y.; Yang, L. Identification of micrornas and their targets in paulownia fortunei plants free from phytoplasma pathogen after methyl methane sulfonate treatment. Biochimie 2016, 127, 271–280. [Google Scholar] [CrossRef] [PubMed]
  46. Livaka, K.J.; Schmittgenb, T.D. Analysis of relative gene expression data using real-time quantitative PCR and the 2(-delta delta c(t)) method. Methods 2011, 25, 402–408. [Google Scholar] [CrossRef] [PubMed]
  47. Dong, Y.; Fan, G.; Zhao, Z.; Deng, M. Compatible solute, transporter protein, transcription factor, and hormone-related gene expression provides an indicator of drought stress in paulownia fortunei. Funct. Integr. Genomics 2014, 14, 479–491. [Google Scholar] [CrossRef] [PubMed]
  48. Han, J.; Xie, H.; Kong, M.L.; Sun, Q.P.; Li, R.Z.; Pan, J.B. Computational identification of mirnas and their targets in phaseolus vulgaris. Genet. Mol. Res. 2014, 13, 310–322. [Google Scholar] [CrossRef] [PubMed]
  49. Baohong, Z.; Xiaoping, P.; Cannon, C.H.; Cobb, G.P.; Anderson, T.A. Conservation and divergence of plant microrna genes. Plant J. Cell Mol. Biol. 2006, 46, 243–259. [Google Scholar]
  50. Zhang, B.H.; Pan, X.P.; Cox, S.B.; Cobb, G.P.; Anderson, T.A. Evidence that mirnas are different from other rnas. Cell. Mol. Life Sci. 2006, 63, 246–254. [Google Scholar] [CrossRef] [PubMed]
  51. Addo-Quaye, C.; Miller, W.; Axtell, M.J. Cleaveland: A pipeline for using degradome data to find cleaved small RNA targets. Bioinformatics 2009, 25, 130–131. [Google Scholar] [CrossRef] [PubMed]
  52. An, F.M.; Chan, M.T. Transcriptome-wide characterization of mirna-directed and non-mirna-directed endonucleolytic cleavage using degradome analysis under low ambient temperature in phalaenopsis aphrodite subsp. Formosana. Plant Cell Physiol. 2012, 53, 1737–1750. [Google Scholar] [CrossRef] [PubMed]
  53. Wei, M.; Wei, H.; Wu, M.; Song, M.; Zhang, J.; Yu, J.; Fan, S.; Yu, S. Comparative expression profiling of mirna during anther development in genetic male sterile and wild type cotton. BMC Plant Biol. 2013, 13, 66. [Google Scholar] [CrossRef] [PubMed]
  54. Fan, G.; Niu, S.; Li, X.; Wang, Y.; Zhao, Z.; Deng, M.; Dong, Y. Functional analysis of differentially expressed micrornas associated with drought stress in diploid and tetraploid paulownia fortunei. Plant Mol. Biol. Rep. 2017, 35, 389–398. [Google Scholar] [CrossRef]
  55. Xiaoshen, Z.; Guoqiang, F.; Zhenli, Z.; Xibing, C.; Gaili, Z.; Minjie, D.; Yanpeng, D. Analysis of diploid and its autotetraploid paulownia tomentosa× p. Fortunei with aflp and msap. Sci. Silv. Sin. 2013, 10, 026. [Google Scholar]
  56. Zhang, Y.; Cao, X.; ZhaiI, X.; Fan, G. Study on DNA extraction of aflp reaction system for paulownia plants. J. Henan Agric. Univ. 2009, 6, 007. [Google Scholar]
  57. De la Rosa, R.; Angiolillo, A.; Guerrero, C.; Pellegrini, M.; Rallo, L.; Besnard, G.; Bervillé, A.; Martin, A.; Baldoni, L. A first linkage map of olive (Olea europaea L.) cultivars using rapd, aflp, rflp and ssr markers. Theor. Appl. Genet. 2003, 106, 1273–1282. [Google Scholar] [CrossRef] [PubMed]
  58. Marques, C.; Araujo, J.; Ferreira, J.; Whetten, R.; O’malley, D.; Liu, B.-H.; Sederoff, R. AFLP genetic maps of eucalyptus globulus and e. Tereticornis. Theor. Appl. Genet. 1998, 96, 727–737. [Google Scholar] [CrossRef]
  59. Phillips, R.; Vasil, I. DNA-Based Markers in Plants, Advances in Cellular and Molecular Biology of Plants; Kluwer: Dordrecht, The Netherlands, 2001. [Google Scholar]
  60. Gupta, P.K.; Varshney, R. The development and use of microsatellite markers for genetic analysis and plant breeding with emphasis on bread wheat. Euphytica 2000, 113, 163–185. [Google Scholar] [CrossRef]
  61. Huang, X.; Yan, H.-D.; Zhang, X.; Zhang, J.; Frazier, T.P.; Huang, D.; Lu, L.; Huang, L.; Liu, W.; Peng, Y.; et al. De novo transcriptome analysis and molecular marker development of two hemarthria species. Front. Plant Sci. 2016, 7, 496. [Google Scholar] [CrossRef] [PubMed]
  62. Gramazio, P.; Blanca, J.; Ziarsolo, P.; Herraiz, F.J.; Plazas, M.; Prohens, J.; Vilanova, S. Transcriptome analysis and molecular marker discovery in solanum incanum and s. Aethiopicum, two close relatives of the common eggplant (Solanum melongena) with interest for breeding. BMC Genom. 2016, 17, 300. [Google Scholar] [CrossRef] [PubMed]
  63. Han, Y.; Khu, D.-M.; Torres-Jerez, I.; Udvardi, M.; Monteros, M.J. Plant transcription factors as novel molecular markers for legumes. In Sustainable Use of Genetic Diversity in Forage and Turf Breeding; Springer: Berlin, Germany, 2010; pp. 421–425. [Google Scholar]
  64. Lu, T.; Lu, G.; Fan, D.; Zhu, C.; Li, W.; Zhao, Q.; Feng, Q.; Zhao, Y.; Guo, Y.; Li, W. Function annotation of the rice transcriptome at single-nucleotide resolution by rna-seq. Genom. Res. 2010, 20, 1238–1249. [Google Scholar] [CrossRef] [PubMed]
  65. Zhai, R.; Feng, Y.; Zhan, X.; Shen, X.; Wu, W.; Yu, P.; Zhang, Y.; Chen, D.; Wang, H.; Lin, Z. Identification of transcriptome snps for assessing allele-specific gene expression in a super-hybrid rice xieyou9308. PLoS ONE 2013, 8, e60668. [Google Scholar] [CrossRef] [PubMed]
  66. Gan, X.; Stegle, O.; Behr, J.; Steffen, J.G.; Drewe, P.; Hildebrand, K.L.; Lyngsoe, R.; Schultheiss, S.J.; Osborne, E.J.; Sreedharan, V.T. Multiple reference genomes and transcriptomes for arabidopsis thaliana. Nature 2011, 477, 419. [Google Scholar] [CrossRef] [PubMed]
  67. Chekanova, J.A.; Gregory, B.D.; Reverdatto, S.V.; Chen, H.; Kumar, R.; Hooker, T.; Yazaki, J.; Li, P.; Skiba, N.; Peng, Q. Genome-wide high-resolution mapping of exosome substrates reveals hidden features in the arabidopsis transcriptome. Cell 2007, 131, 1340–1353. [Google Scholar] [CrossRef] [PubMed]
  68. Zhang, D.F.; Li, B.; Jia, G.Q.; Zhang, T.F.; Dai, J.R.; Li, J.S.; Wang, S.C. Isolation and characterization of genes encoding grf transcription factors and gif transcriptional coactivators in maize (Zea mays L.). Plant Sci. 2008, 175, 809–817. [Google Scholar] [CrossRef]
  69. Nadgauda, R.S.; Parasharami, V.A.; Mascarenhas, A.F. Precocious flowering and seeding behaviour in tissue-cultured bamboos. Nature 1990, 344, 335–336. [Google Scholar] [CrossRef]
  70. Thorsen, S.; Rugulies, R.; Løngaard, K.; Borg, V.; Thielen, K.; Bjorner, J.B. Edl3 is an f-box protein involved in the regulation of abscisic acid signalling in arabidopsis thaliana. Int. Arch. Occup. Environ. Health 2011, 62, 5547–5560. [Google Scholar]
  71. Nakabayashi, R.; Yonekura-Sakakibara, K.; Urano, K.; Suzuki, M.; Yamada, Y.; Nishizawa, T.; Matsuda, F.; Kojima, M.; Sakakibara, H.; Shinozaki, K.; et al. Enhancement of oxidative and drought tolerance in arabidopsis by overaccumulation of antioxidant flavonoids. Plant J. 2014, 77, 367–379. [Google Scholar] [CrossRef] [PubMed]
  72. Cominelli, E.; Sala, T.; Calvi, D.; Gusmaroli, G.; Tonelli, C. Over-expression of the arabidopsis atmyb41 gene alters cell expansion and leaf surface permeability. Plant J. 2008, 53, 53–64. [Google Scholar] [CrossRef] [PubMed]
  73. Oh, J.; Kwon, Y.; Kim, J.; Noh, H.; Hong, S.-W.; Lee, H. A dual role for myb60 in stomatal regulation and root growth of arabidopsis thaliana under drought stress. Plant Mol. Biol. 2011, 77, 91–103. [Google Scholar] [CrossRef] [PubMed]
  74. Chen, H.; Lai, Z.; Shi, J.; Xiao, Y.; Chen, Z.; Xu, X. Roles of arabidopsis wrky18, wrky40 and wrky60 transcription factors in plant responses to abscisic acid and abiotic stress. BMC Plant Biol. 2010, 10, 443–462. [Google Scholar] [CrossRef] [PubMed]
  75. Shang, Y.; Yan, L.; Liu, Z.Q.; Cao, Z.; Mei, C.; Xin, Q.; Wu, F.Q.; Wang, X.F.; Du, S.Y.; Jiang, T. The mg-chelatase h subunit of arabidopsis antagonizes a group of wrky transcription repressors to relieve aba-responsive genes of inhibition. Plant Cell 2010, 22, 1909–1935. [Google Scholar] [CrossRef] [PubMed]
  76. Miki, F.; Yasunari, F.; Kyonoshin, M.; Motoaki, S.; Keiichiro, H.; Masaru, O.T.; Lam-Son Phan, T.; Kazuko, Y.S.; Kazuo, S. A dehydration-induced NAC protein, rd26, is involved in a novel aba-dependent stress-signaling pathway. Plant J. 2004, 39, 863–876. [Google Scholar]
  77. Tran, L.S.; Nakashima, K.; Sakuma, Y.; Simpson, S.D.; Fujita, Y.; Maruyama, K.; Fujita, M.; Seki, M.; Shinozaki, K.; Yamaguchi-Shinozaki, K. Isolation and functional analysis of arabidopsis stress-inducible NAC transcription factors that bind to a drought-responsive cis-element in the early responsive to dehydration stress 1 promoter. Plant Cell 2004, 16, 2481–2498. [Google Scholar] [CrossRef] [PubMed]
  78. Wu, Y.; Deng, Z.; Lai, J.; Zhang, Y.; Yang, C.; Yin, B.; Zhao, Q.; Zhang, L.; Li, Y.; Yang, C.; et al. Dual function of arabidopsis ATAF1 in abiotic and biotic stress responses. Cell Res. 2009, 19, 1279–1290. [Google Scholar] [CrossRef] [PubMed]
  79. Neilson, J.A.D.; Durnford, D.G. Evolutionary distribution of light-harvesting complex-like proteins in photosynthetic eukaryotes. Genome 2010, 53, 68–78. [Google Scholar] [CrossRef] [PubMed]
  80. Xu, Y.H.; Liu, R.; Yan, L.; Liu, Z.Q.; Jiang, S.C.; Shen, Y.Y.; Wang, X.F.; Zhang, D.P. Light-harvesting chlorophyll a/b-binding proteins are required for stomatal response to abscisic acid in arabidopsis. J. Exp. Bot. 2011, 63, 1095–1106. [Google Scholar] [CrossRef] [PubMed]
  81. Minh-Thu, P.T.; Hwang, D.J.; Jeon, J.S.; Nahm, B.H.; Kim, Y.K. Transcriptome analysis of leaf and root of rice seedling to acute dehydration. Rice 2013, 6, 1–18. [Google Scholar] [CrossRef] [PubMed]
  82. Li, X.-Q. Natural attributes and agricultural implications of somatic genome variation. Curr. Issue Mol. Biol. 2016, 20, 29–46. [Google Scholar]
  83. Comai, L. The advantages and disadvantages of being polyploid. Nat. Rev. Genet. 2005, 6, 836–846. [Google Scholar] [CrossRef] [PubMed]
  84. Wang, T.; Lei, C.; Zhao, M.; Tian, Q.; Zhang, W.H. Identification of drought-responsive micrornas in medicago truncatula by genome-wide high-throughput sequencing. BMC Genom. 2011, 12, 367. [Google Scholar] [CrossRef] [PubMed]
  85. Park, W.; Scheffler, B.E.; Bauer, P.J.; Campbell, B.T. Identification of the family of aquaporin genes and their expression in upland cotton (Gossypium hirsutum L.). BMC Plant Biol. 2010, 10, 142. [Google Scholar] [CrossRef] [PubMed]
  86. Formey, D.; Iñiguez, L.P.; Peláez, P.; Li, Y.F.; Sunkar, R.; Sánchez, F.; Reyes, J.L.; Hernández, G. Genome-wide identification of the phaseolus vulgaris srnaome using small RNA and degradome sequencing. BMC Genom. 2015, 16, 1–17. [Google Scholar] [CrossRef] [PubMed]
  87. Berkowitz, G.; Zhang, X.; Mercier, R.; Leng, Q.; Lawton, M. Co-expression of calcium-dependent protein kinase with the inward rectified guard cell k+ channel kat1 alters current parameters in xenopus laevis oocytes. Plant Cell Physiol. 2000, 41, 785–790. [Google Scholar] [CrossRef] [PubMed]
  88. Maathuis, F.J.; Sanders, D. Mechanisms of potassium absorption by higher plant roots. Physiol. Plant. 1996, 96, 158–168. [Google Scholar] [CrossRef]
Figure 1. Effects of drought stress on P. fortunei (Seem) Hemsl. physiology. PF2, well-watered diploid; PF2T_12d, 12 days drought-treated diploid; PF4, well-watered autotetraploid; PF4T_12d, 12 days drought-treated autotetraploid. The different letters within a physiological and biochemical index indicate significant difference, while the same letters within a physiological and biochemical index indicate no significant differences (p < 0.05).
Forests 09 00088 g001
Figure 2. Statistics of gene expression in four libraries; (a) The cluster chart of genes expression; (b) The differently expressed genes in the four comparisons of PTF4_12d vs. PTF2_12d, PTF2_12d vs. PTF2, PTF4 vs. PTF2, and PTF4_12d vs. PTF4. DEGs: differentially expressed genes.
Forests 09 00088 g002
Figure 3. Gene Ontology (GO) for the co-expressed DEGs in two P. fortunei genotypes.
Forests 09 00088 g003
Figure 4. Scatter chart of top 20 pathway enrichment for the co-expressed DEGs.
Forests 09 00088 g004
Figure 5. Target plots (t-plots) of miRNA targets in different categories confirmed by degradome sequencing.
Forests 09 00088 g005
Figure 6. Relative expression levels of candidate drought response genes in two P. fortunei genotypes. 18S rRNA was used as the endogenous reference gene. Bar = Standard deviation. The difference between the diploid and autotetraploid P. fortunei within each drought treatment time point was significant (*, p < 0.05) according to the t-test. 0d, well-watered diploid and autotetraploid plants; 6d, 6 days drought-treated diploid and autotetraploid plants; 9d, 9 days drought-treated diploid and autotetraploid plants; 12d, 12 days drought-treated diploid and autotetraploid plants.
Forests 09 00088 g006
Figure 7. Relative expression levels of drought response miRNAs in two P. fortunei genotypes. U6 snRNA was used as the endogenous reference gene. Bar = Standard deviation. The difference between the diploid and autotetraploid P. fortunei within each drought treatment time point was significant (*, p < 0.05) according to the t-test. 0d, well-watered diploid and autotetraploid plants; 6d, 6 days drought-treated diploid and autotetraploid plants; 9d, 9 days drought-treated diploid and autotetraploid plants; 12d, 12 days drought-treated diploid and autotetraploid plants.
Forests 09 00088 g007
Figure 8. Relative expression of the target genes of six P. fortunei miRNAs by Quantitative Real-Time Polymerase Chain Reaction (qRT-PCR) assay. PF2, well-watered diploid; PF2T_12d, 12 days drought-treated diploid; PF4, well-watered autotetraploid; PF4T_12d, 12 days drought-treated autotetraploid. The different letters within a miRNA expression or a gene expression indicate significant difference, while the same letters within a miRNA expression or a gene expression indicate no significant differences (p < 0.05).
Forests 09 00088 g008
Table 1. The statistics of clean reads mapped to reference gene and genome.
Map to GenomeMap to Gene
CategoryReads NumberPercentReads NumberPercent
PF2Total Reads64,267,312100.00%64,267,312100.00%
Total Base Pairs5,784,058,080100.00%5,784,058,080100.00%
Total Mapped Reads54,049,71684.10%31,664,62649.27%
Perfect Match39,381,68761.28%23,034,91135.84%
Mismatch14,668,02922.82%8,629,71513.43%
Unique Match46,383,58372.17%21,725,26833.80%
Multi-position Match7,666,13311.93%9,939,35815.47%
Total Unmapped Reads10,217,59615.90%32,602,68450.73%
PF2T_12DTotal Reads66,551,876100.00%66,551,876100.00%
Total Base Pairs5,989,668,840100.00%5,989,668,840100.00%
Total Mapped Reads55,463,66483.34%30,623,74646.01%
Perfect Match40,236,12660.46%22,138,95433.27%
Mismatch15,227,53822.88%8,484,79212.75%
Unique Match47,298,90871.07%20,998,17431.55%
Multi-position Match8,164,75612.27%9,625,57214.46%
Total Unmapped Reads11,088,21216.66%35,928,12853.99%
PF4Total Reads67,073,816100.00%67,073,816100.00%
Total Base Pairs6,036,643,440100.00%6,036,643,440100.00%
Total Mapped Reads55,033,79882.05%33,230,10249.54%
Perfect Match33,117,09049.37%19,896,75029.66%
Mismatch21,916,70832.68%13,333,35219.88%
Unique Match47,201,19670.37%21,955,60432.73%
Multi-position Match7,832,60211.68%11,274,49816.81%
Total Unmapped Reads12,040,01817.95%33,843,71250.46%
PF4T_12DTotal Reads68,805,144100.00%68,805,144100.00%
Total Base Pairs6,192,462,960100.00%6,192,462,960100.00%
Total Mapped Reads56,335,62881.88%31,595,01845.92%
Perfect Match34,095,10849.55%18,735,18527.23%
Mismatch22,240,52032.32%12,859,83318.69%
Unique Match47,540,03069.09%21,592,72431.38%
Multi-position Match8,795,59812.78%10,002,29414.54%
Total Unmapped Reads12,469,51618.12%37,210,12454.08%
Table 2. The co-expressed DEGs coding the transcription factors.
Gene IDTF FamilyIncluded DomainExcluded Domain
PAU000179.1C3Hzf-CCCHPHD, SNF2_N, zf-C2H2
PAU000931.1MYBMyb_DNA-bindingARID, Response_reg, SNF2_N
PAU000931.1Trihelixtrihelix-
PAU001653.1GRASGRAS-
PAU001788.1MYBMyb_DNA-bindingARID, Response_reg, SNF2_N
PAU001788.1G2-likeG2-likeResponse_reg
PAU002069.1GRASGRAS-
PAU003364.1NACNAM-
PAU003475.1GRASGRAS-
PAU006678.1HSFHSF_DNA-bind-
PAU007281.2ABI3VP1B3AP2, Auxin_resp
PAU008439.1mTERFmTERF-
PAU010113.2AP2-EREBPAP2-
PAU011010.1LOBDUF260-
PAU012184.1bHLHHLH-
PAU012899.1MYB-relatedMyb_DNA-bindingARID, G2-like, Response_reg, SNF2_N,trihelix
PAU012899.1MYBMyb_DNA-bindingARID, Response_reg, SNF2_N
PAU017462.1NACNAM-
PAU018191.1MYB-relatedMyb_DNA-bindingARID, G2-like, Response_reg, SNF2_N,trihelix
PAU018191.1MYBMyb_DNA-bindingARID, Response_reg, SNF2_N
PAU019436.2NACNAM-
PAU021504.1NACNAM-
PAU021792.1C2C2-GATAGATA-
PAU022916.1ARFAuxin_resp-
PAU023755.1ARFAuxin_resp-
PAU025363.1WRKYWRKY-
PAU029472.1LIMLIM-
PAU030808.2GRASGRAS-
Table 3. Annotation of small RNA (sRNA) sequences in four libraries.
CategorySpeciesUnique sRNAsPercent%Reads NumberPercent%
miRNAPF222,5210.47%2,882,54918.56%
PF2T-12D19,7680.42%2,788,08118.89%
PF419,4540.39%2,608,85318.60%
PF4T-12D21,3580.46%2,317,49514.42%
rRNAPF251,6851.09%718,4514.62%
PF2T-12D27,2420.59%271,6351.84%
PF438,9870.78%280,9292%
PF4T-12D38,8190.83%604,4943.76%
repeatPF2257,9525.44%658,1404.24%
PF2T-12D243,4895.23%605,3044.10%
PF4196,2173.94%469,6203.35%
PF4T-12D175,3703.74%511,9103.19%
snRNAPF218460.04%33750.02%
PF2T-12D13160.03%28210.02%
PF417290.03%32470.02%
PF4T-12D16300.03%35820.02%
snoRNAPF26470.01%12570.01%
PF2T-12D4870.01%10830.01%
PF46350.01%11700.01%
PF4T-12D6970.01%11240.01%
tRNAPF215,1760.32%569,3693.67%
PF2T-12D75420.16%293,0781.99%
PF410,6050.21%292,4762.09%
PF4T-12D10,2100.22%669,1134.16%
unannPF24,394,57592.63%10,701,77268.89%
PF2T-12D4,353,09893.56%10,797,86673.16%
PF44,711,84994.62%10,368,08573.93%
PF4T-12D4,436,31494.71%11,959,26274.43%

