Article

De Novo Sequencing and Assembly Analysis of Transcriptome in Pinus bungeana Zucc. ex Endl.

1
State Key Laboratory of Tree Genetics and Breeding, Chinese Academy of Forestry, Beijing 100091, China
2
Research Institute of Forestry, Chinese Academy of Forestry, Beijing 100091, China
3
Key Laboratory of Tree Breeding and Cultivation of State Forestry Administration, Chinese Academy of Forestry, Beijing 100091, China
*
Author to whom correspondence should be addressed.
Forests 2018, 9(3), 156; https://doi.org/10.3390/f9030156
Submission received: 24 January 2018 / Revised: 14 March 2018 / Accepted: 19 March 2018 / Published: 20 March 2018
(This article belongs to the Special Issue Genetics and Genomics of Forest Trees)

Abstract

:
To enrich the molecular data of Pinus bungeana Zucc. ex Endl. and study the regulating factors of different morphology controled by apical dominance. In this study, de novo assembly of transcriptome annotation was performed for two varieties of Pinus bungeana Zucc. ex Endl. that are obviously different in morphology. More than 147 million reads were produced, which were assembled into 88,092 unigenes. Based on a similarity search, 11,692 unigenes showed significant similarity to proteins from Picea sitchensis (Bong.) Carr. From this collection of unigenes, a large number of molecular markers were identified, including 2829 simple sequence repeats (SSRs). A total of 158 unigenes expressed differently between two varieties, including 98 up-regulated and 60 down-regulated unigenes. Furthermore, among the differently expressed genes (DEGs), five genes which may impact the plant morphology were further validated by reverse transcription quantitative polymerase chain reaction (RT-qPCR). The five genes related to cytokinin oxidase/dehydrogenase (CKX), two-component response regulator ARR-A family (ARR-A), plant hormone signal transduction (AHP), and MADS-box transcription factors have a close relationship with apical dominance. This new dataset will be a useful resource for future genetic and genomic studies in Pinus bungeana Zucc. ex Endl.

1. Introduction

Pinus bungeana Zucc. ex Endl. is an endemic species to China, with high economic and ecological values for landscaping and afforestation. Owing to long-term over-exploitation, natural forest of Pinus bungeana Zucc. ex Endl. has been severely damaged and natural populations are mainly found on the top of hills with poor conditions usually isolated and fragmented. Genetic diversity in populations is losing. The plant morphology, which is the most visible difference, has been commonly used for genetic diversity studies. Additionally, its regulation and secondary metabolites should also be focused on.
Sizable numbers of molecular markers and genes data from the genome are playing an increasingly important role in population genomic studies of fine-scale genetic variation and the genetic basis of traits [1]. Nevertheless, very limited genomic data is available on Pinus bungeana Zucc. ex Endl. Transcriptome sequencing is an efficient means to generate functional genomic level data for the plants [2,3]. Transcriptome sequencing is a developed approach to transcriptome profiling that uses deep-sequencing technologies [4]. Studies using this method have already altered our view of the extent and complexity of the eukaryotic transcriptome [5,6].
Apical dominance occurs when the shoot apex inhibits the growth of lateral buds, leading to the vertical growth of the plant [7]. Growing upward vertically is important for the tree. In this way, it can get more sun light to maintain photosynthesis [8]. It is best demonstrated via decapitation, which leads to apical dominance. Branching control is regulated by divergent mechanisms among different species [7,9,10]. The functions of hormones in apical dominance have been included in investigations for nearly five decades. Evidence from hormonal studies suggests that apically produced auxin indirectly suppresses axillary bud outgrowth that is promoted by cytokine originating from roots/shoots [11,12,13]. The mechanism of branching control is still the perplexing problem which is explored by many hypotheses including the classical hypothesis, the auxin transport hypothesis, and the bud transition hypothesis [11]. Exhibiting significant involvement with other hormones, cytokinins (CK) are signaling hormonal molecules that may have an essential impact in regulating cytokinesis, growth, and development in plants [14,15]. In addition, the CKX, a flavoenzyme irresistibly degrading CK into adenine/adenosine moiety, is critical for maintaining CK homeostasis in plants. Therefore, the CKX plays a very important role by means of controlling the balance of CK. The functions of the CKX gene, including pygmyism, high yield, and anti-aging, are reported in many plants, such as maize, rice, and Arabidopsis thaliana (Linn.) Heynh. in Holl & Heynh. Even though the precision of hormone content analyses in tissue has greatly improved in recent years, there have been no reports on the understanding of Pinus spp.
Next generation transcriptome sequencing was employed to characterize the transcriptome of Pinus bungeana Zucc. ex Endl. and to develop genomic resources to support further studies of the species A new variety of Pinus bungeana Zucc. ex Endl. named “Penxian”, which loses apical dominance, has also been sequenced and analyzed to characterize the architecture regulation mechanism of this species at molecular level.

2. Materials and Methods
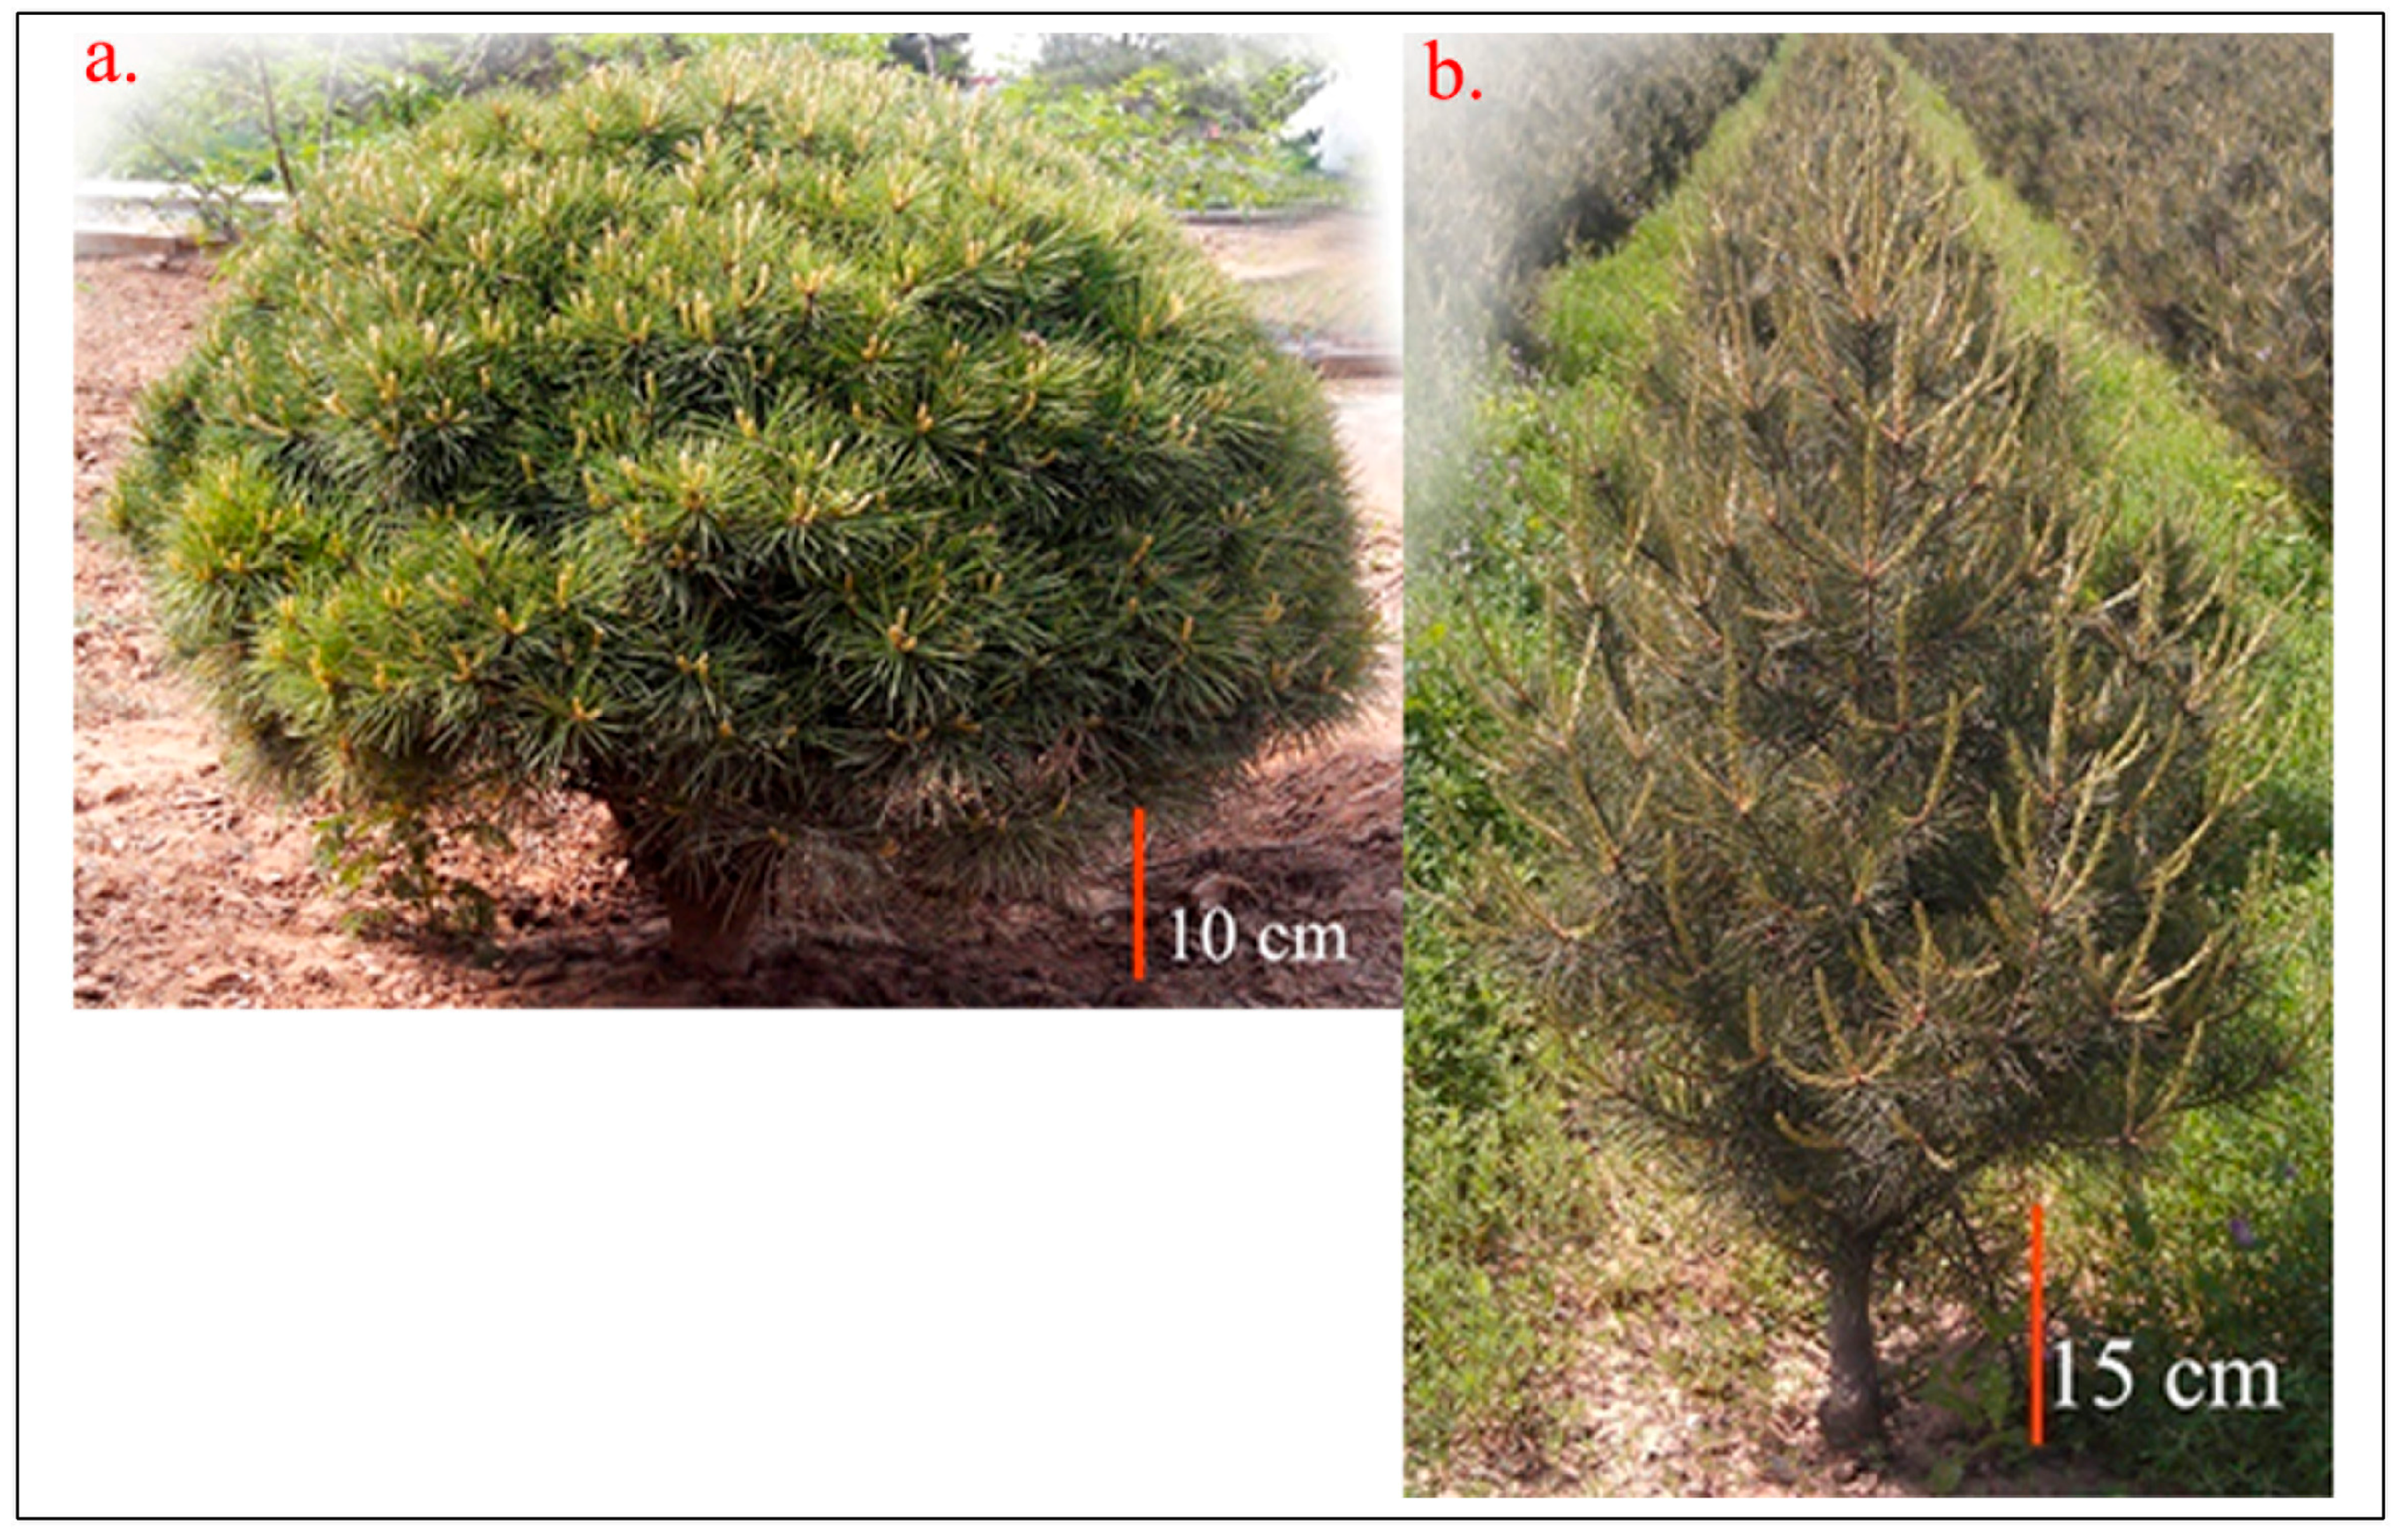
2.1. Materials

Bud samples of two varieties of Pinus bungeana Zucc. ex Endl. namely ‘Tree No. 9’ and ‘Penxian’ were collected from six-year-old seedlings grown in a glasshouse in Changping, Beijing, China. The variety ‘Penxian’ has no main stem due to loss of apical dominance (Figure 1). Three replicate experiments were made for each sample. After sampling, the buds were immediately frozen in liquid nitrogen and homogenized with a pestle and mortar.

2.2. Methods

2.2.1. Sample Preparation for Illumina Sequencing

Total RNA was extracted using TRIzol reagent (Invitrogen, Carlsbad, CA, USA) according to the manufacturer’s protocol. The RNA samples were digested using DNase I at 37 °C for 30 min to remove potential genomic DNA contamination. RNA concentration and quality were assessed using a NanoDrop ND-1000 spectrophotometer (Thermo Scientific, Wilmington, DE, USA) and Agilent 2100 Bioanalyzer (Agilent Technologies, Santa Clara, CA, USA). Poly (A) mRNA was purified from 3 μg of total RNA using Oligo (dT) magnetic beads. The mRNA was fragmented using divalent cations at an elevated temperature. Double-stranded complementary to RNA (cDNA) was synthesized using a SuperScript double-stranded cDNA synthesis kit (Invitrogen, Carlsbad, CA, USA) with random hexamer primers (Illumina). These cDNA fragments were subjected to purification, end repair, and ligation to sequencing adapters. Ligation products were purified with magnetic beads and separated by agarose gel electrophoresis. A range of cDNA fragments (200 ± 25 bp) were excised from the gel and selected for PCR amplification as templates. The cDNA library was sequenced on a paired-end flow cell using IlluminaHiSeq 2500 platform (2 × 100 bp read length) by Biomarker Co. (Beijing, China).

2.2.2. De novo Assembly and Annotation

The raw paired-end reads were filtered to remove those containing adapters and reads with more than 5% unknown nucleotides or a low Q-value (≤10) base more than 20%. Then, clean data from each sample were utilized to do RNA de novo assembly with Trinity [16]. All the assembled unigenes were annotated against the NCBI (National Center of Biotechnology Information) protein Nr (https://www.ncbi.nlm.nih.gov/refseq/) [17], Swiss-Prot (http://www.uniprot.org/) [18], COG (Phylogenetic classification of proteins encoded in complete genomes, https://www.ncbi.nlm.nih.gov/COG/) [19], Pfam (https://pfam.xfam.org/) [20] database using BLASTX (Basic Local Alignment Search Tool, https://blast.ncbi.nlm.nih.gov/Blast.cgi) [21] with a typical E-value threshold of 1.0 × 10⁻⁵. Metabolic pathway analysis was performed using the KEGG (Kyoto Encyclopedia of Genes and Genomes, http://www.kegg.jp/) [22]. The BLAST2GO (https://www.blast2go.com/) [23] program was used to get GO (Gene Ontology, http://go-database-sql.org/) [24] annotations of unigenes for describing biological processes, molecular functions, and cellular components. The dataset is available from the NCBI Short Read Archive (SRA) with the accession number: SRX2024410 (https://www.ncbi.nlm.nih.gov/sra/SRX2024410).

2.2.3. Differential Expression Analysis and Functional Enrichment

To identify DEGs between different samples, the expression level of each unigene was calculated according to the fragments per kilobase of exon per million mapped reads (FPKM) method [6]. The R statistical package software DESeq was used for differential expression analysis with default parameters. The DEGs between different samples were restricted with FDR (False Discovery Rate) ≤ 0.001 and the absolute value of log2 Ratio ≥ 1. In addition, functional-enrichment analyses including GO and KEGG were performed to identify which DEGs were significantly enriched in GO terms and metabolic pathways at a Bonferroni-corrected p-value ≤ 0.05 compared with the whole-transcriptome background. KEGG pathway functional enrichment analysis was carried out by KOBAS (http://kobas.cbi.pku.edu.cn/) [25,26].

2.2.4. Prediction of Unigene Coding Regions

The coding sequence (CDS) for unigene was predicted by BlastX [21] and getorf [27]. The unigene sequences were searched against Nr [17], COG [19], KEGG [20], and Swiss-Prot [18] protein databases using BLASTX (e-value < 10−5) [21]. Unigenes aligned to a higher priority database will not be aligned to a lower priority database. The best alignment results were used to determine the sequence direction of unigenes. When a unigene could not be aligned to any database, the getorf program was introduced to decide its sequence orientation and protein coding region prediction.

2.2.5. Detection of SSR

The SSR detection of unigenes was performed with MicroSAtellite (MISA) software (http://pgrc.ipk-gatersleben.de/misa/misa.html). We searched for SSRs with motifs ranging from mono- to hexa-nucleotides in size. The minimum of repeat units was set as follows: ten repeat units for mono-nucleotides, six for di-nucleotides, and five for tri-, tetra-, penta-, and hexa-nucleotides.

2.2.6. Differential Expression Level Analysis by RT-qPCR

To verify the reliability and accuracy of RNA-Seq-based expression level analysis, five transcripts (Table S1.) which may impact the plant morphology were selected from the contigs database and evaluated the gene expression level in the two Pinus bungeana Zucc. ex Endl. varieties which were described above. RT-qPCR experiments were performed in triplicate. The methods of RNA isolation and cDNA synthesis were the same as described for RNA-Seq above. The specific primer (Table S2.) set for RT-qPCR was designed with the Oligo 7.57 software (MBI, Colorado Springs, CO, USA). The cDNA was diluted and amplified using a 7500 Fast Real-Time PCR Systems (Thermo Fisher, Waltham, MA, USA) and SYBR Premix Ex Taq kit (Thermo Fisher, Waltham, MA, USA) according to the manufacturer’s instructions. Standard curves for individual unigenes were calculated using a dilution series of the pMD19-T vector containing the target gene. The relative expressions of the genes in the cold-treated seedlings compared with the control ones were determined based on comparisons with the reference gene ubiquitin-conjugating enzyme. Therefore, the amplification of the target gene was normalized with the amplification of the reference gene to correct amplification variations. The relative expression data were calculated according to the 2−ΔΔCt method and are presented as fold change [28].

3. Results

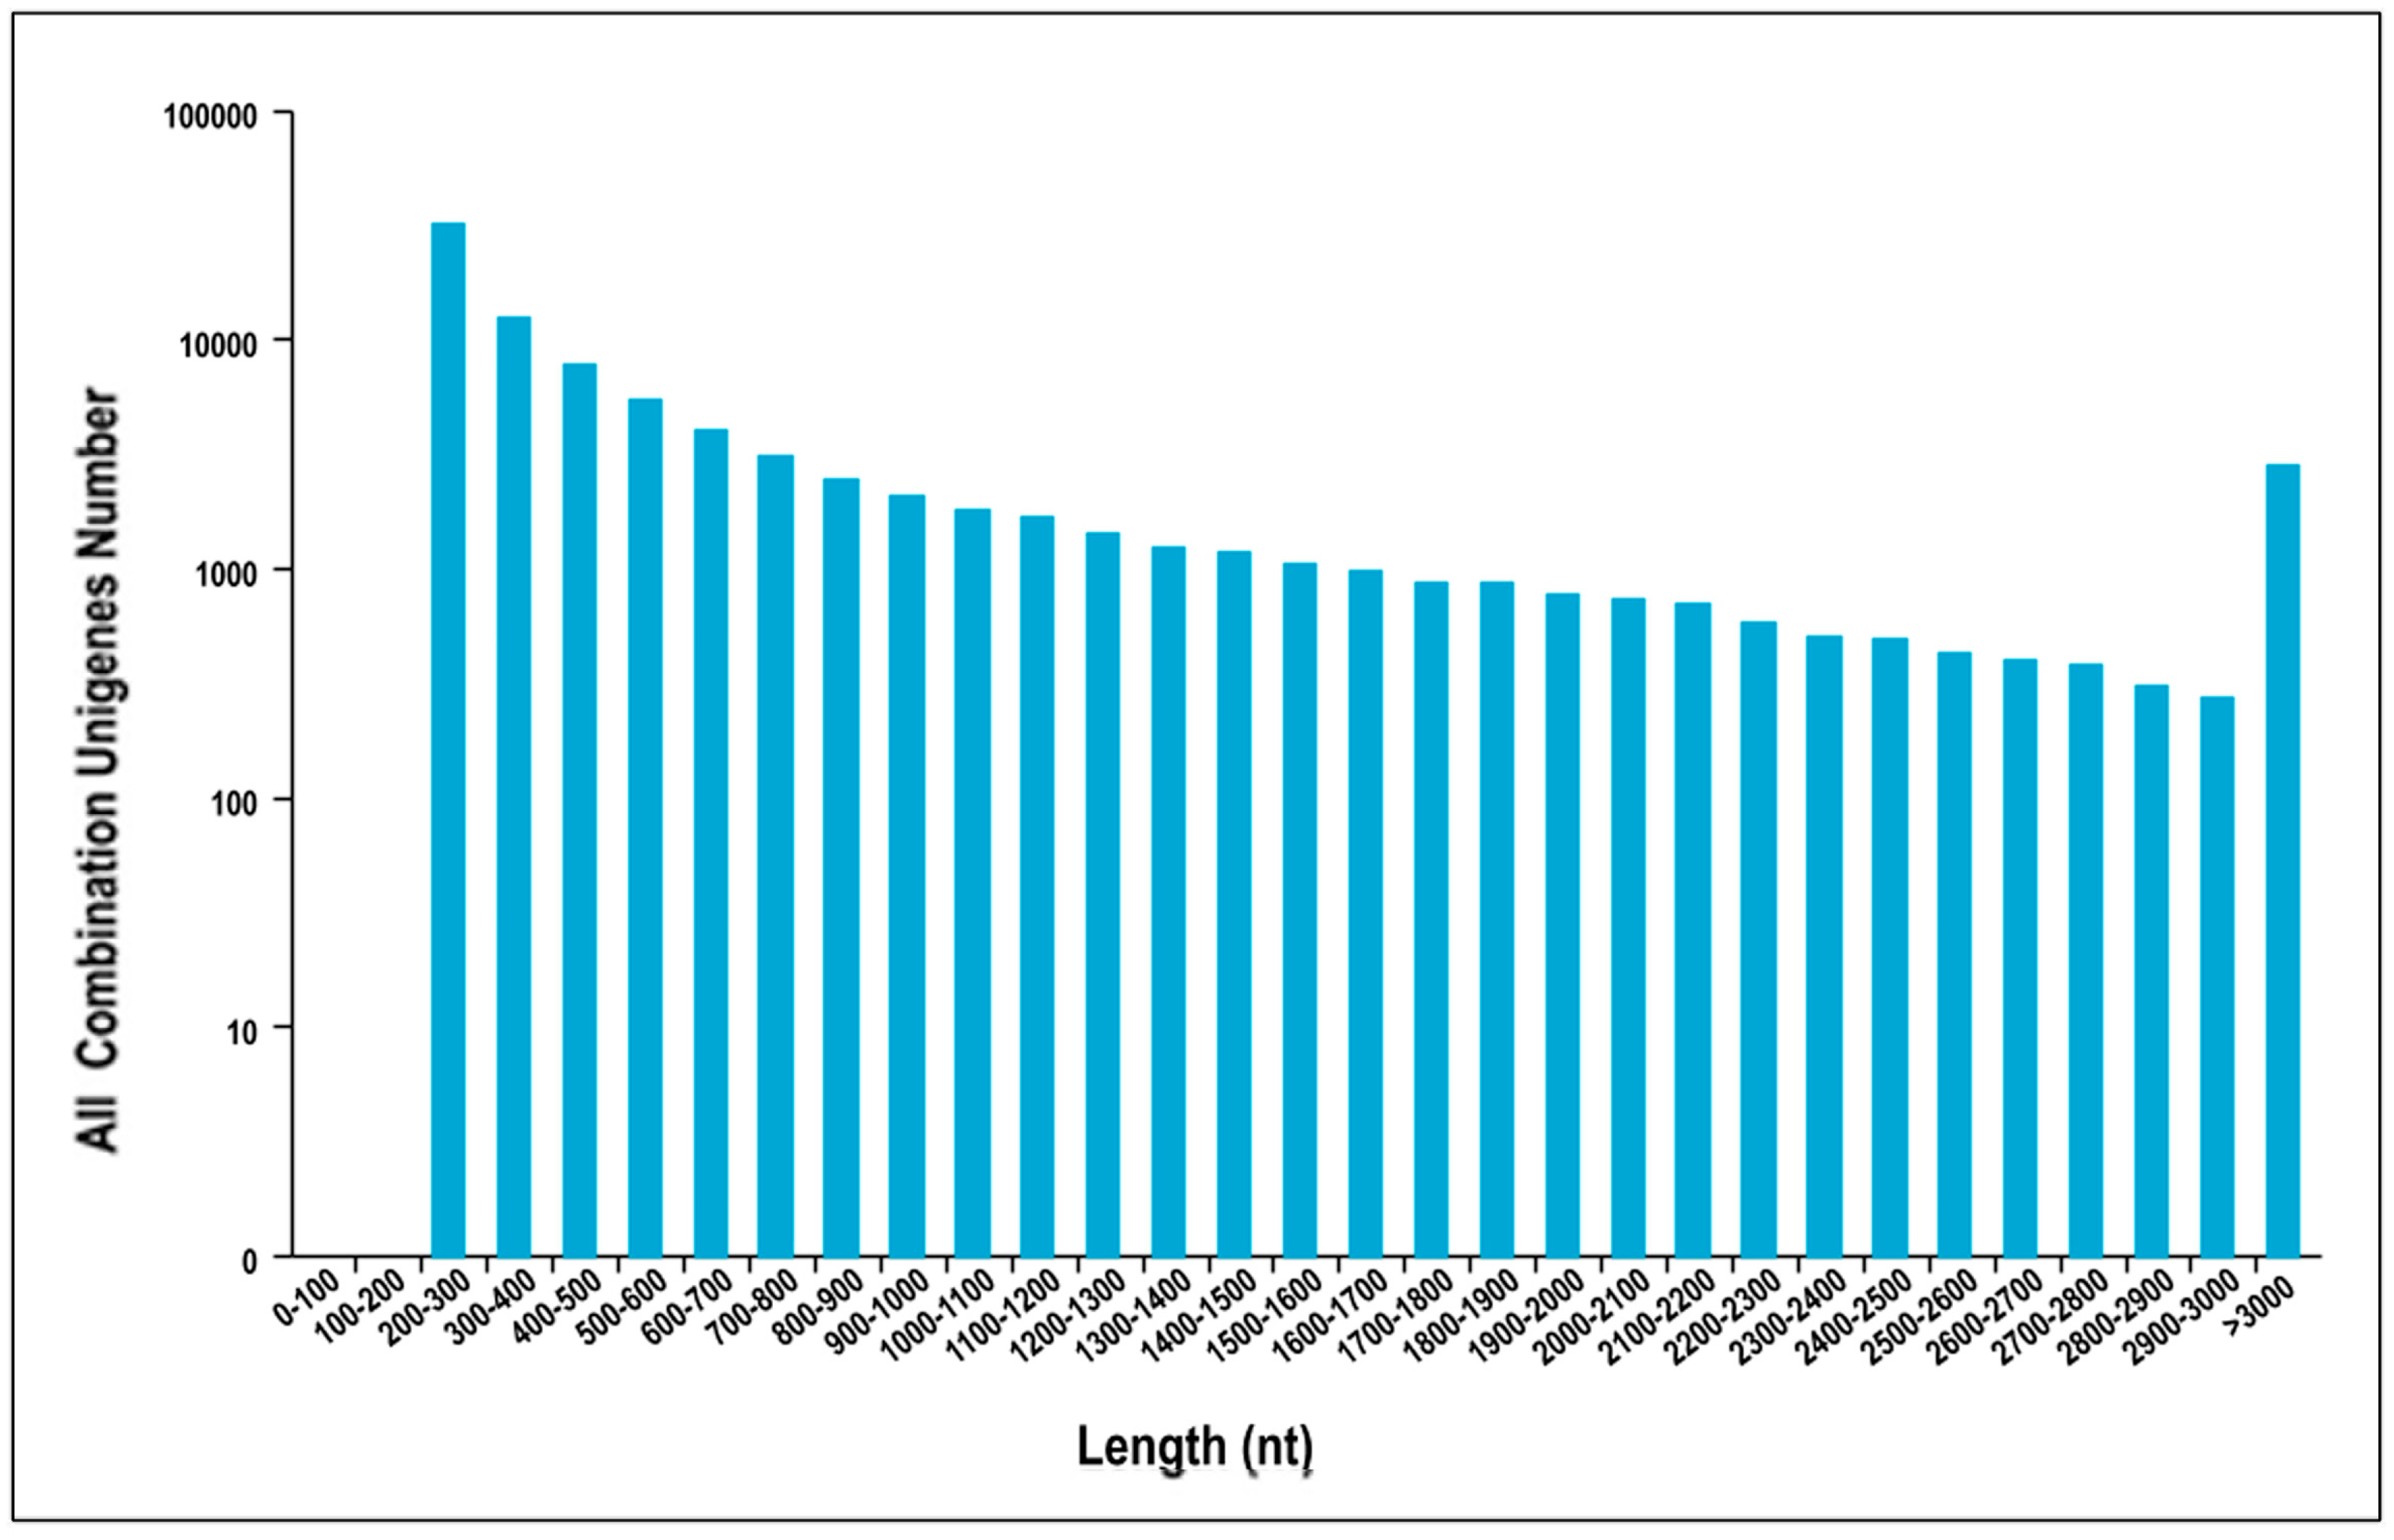
3.1. Sequencing Data Quality and Assembly of Reads

In total, approximately 148 million paired end reads were generated by high throughput sequencing. After removing adapters, low-quality sequences, and ambiguous reads, we obtained approximately 25 million, 25 million, 25 million, 24 million, 25 million, and 23 million clean reads from the ordinary variety samples (Tree No. 9-1, Tree No. 9-2, and Tree No. 9-3), and new variety samples (Penxian-1, Penxian-2, and Penxian-3), respectively. Approximately 37.21 Gb bases were obtained with 91.56% Q30 bases with a GC content of 45.85% (Table 1). Trinity was employed for transcriptome de novo assembly with next-generation short-read sequences. A total of 124,692 transcripts with a mean length of 922 were assembled. Additionally, we further clustered the transcripts into 88,092 unigenes with a mean length of 758 bp and an N50 value of 1357 bp. Among the unigenes, 51,803 (58.81%) were between 200–500 bp, 16,917(19.20%) were between 500–1000 bp, and 19,372 (21.99%) unigenes were greater than 1 kb. The shorter sequences, which were less than 200 bp in length, were excluded, as they may lack a characterized protein domain or be too short to show a sequence that matches the contigs (Table 2). The length distributions of the unigenes are shown in Figure 2.

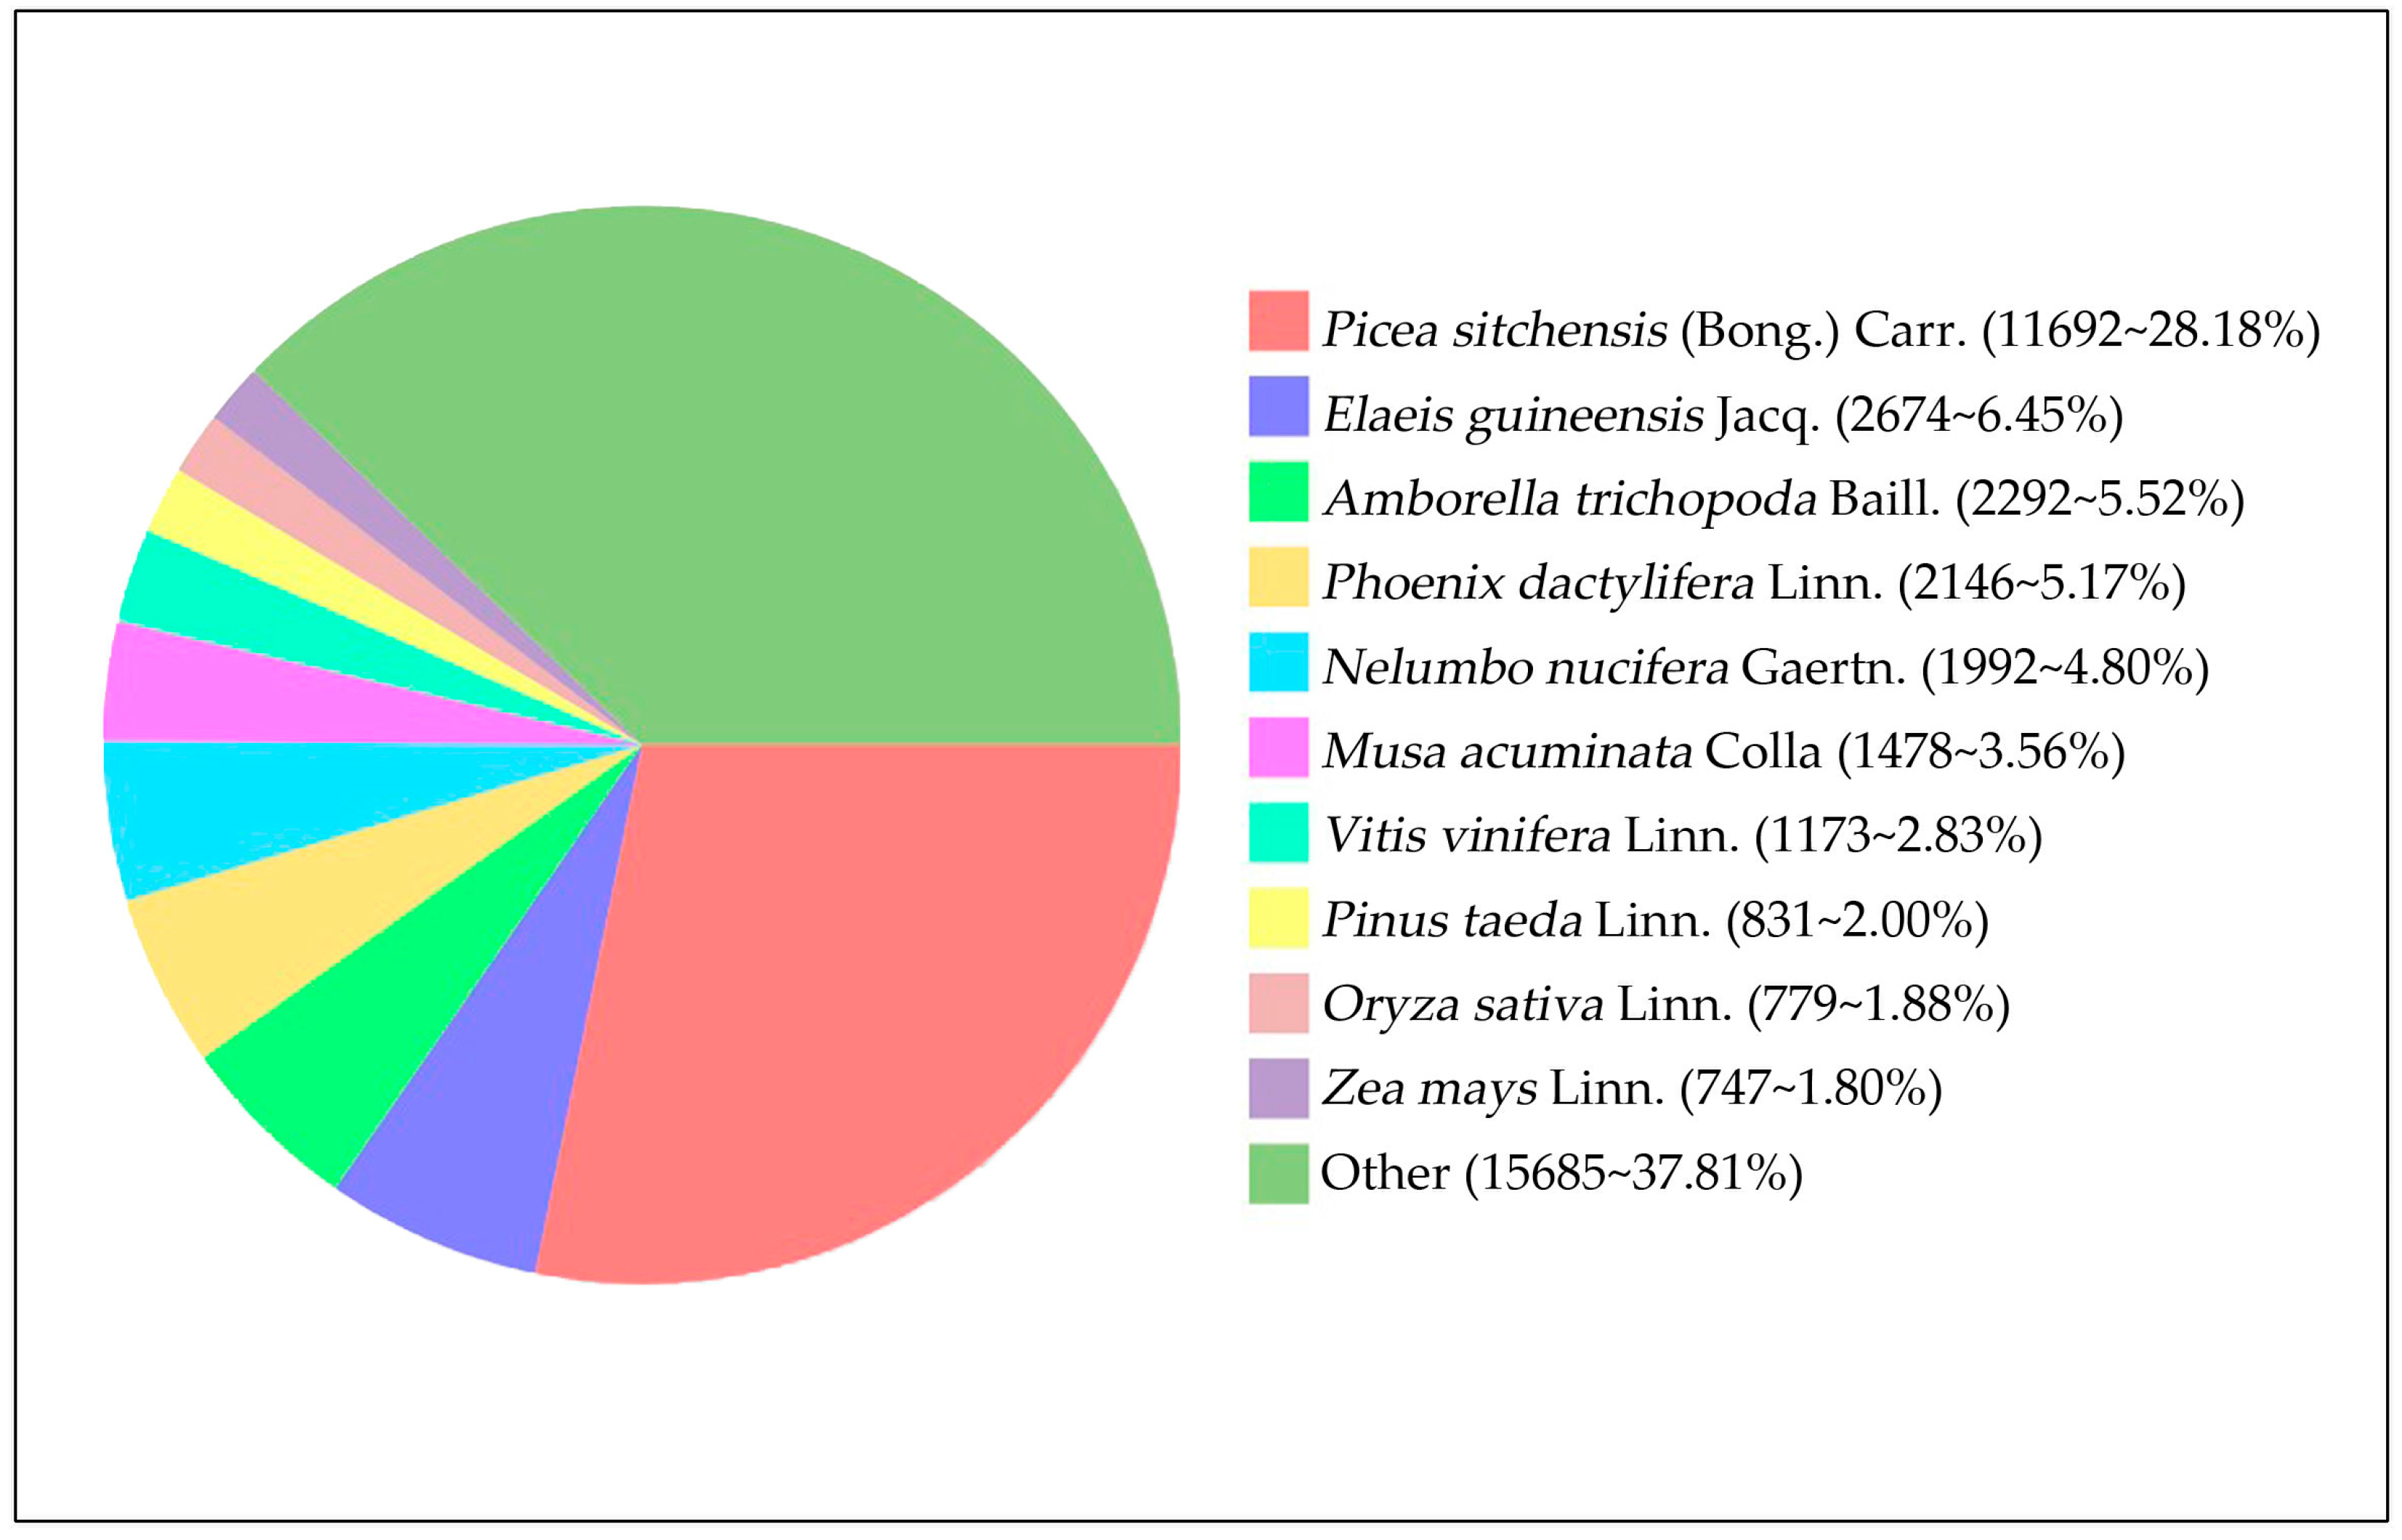
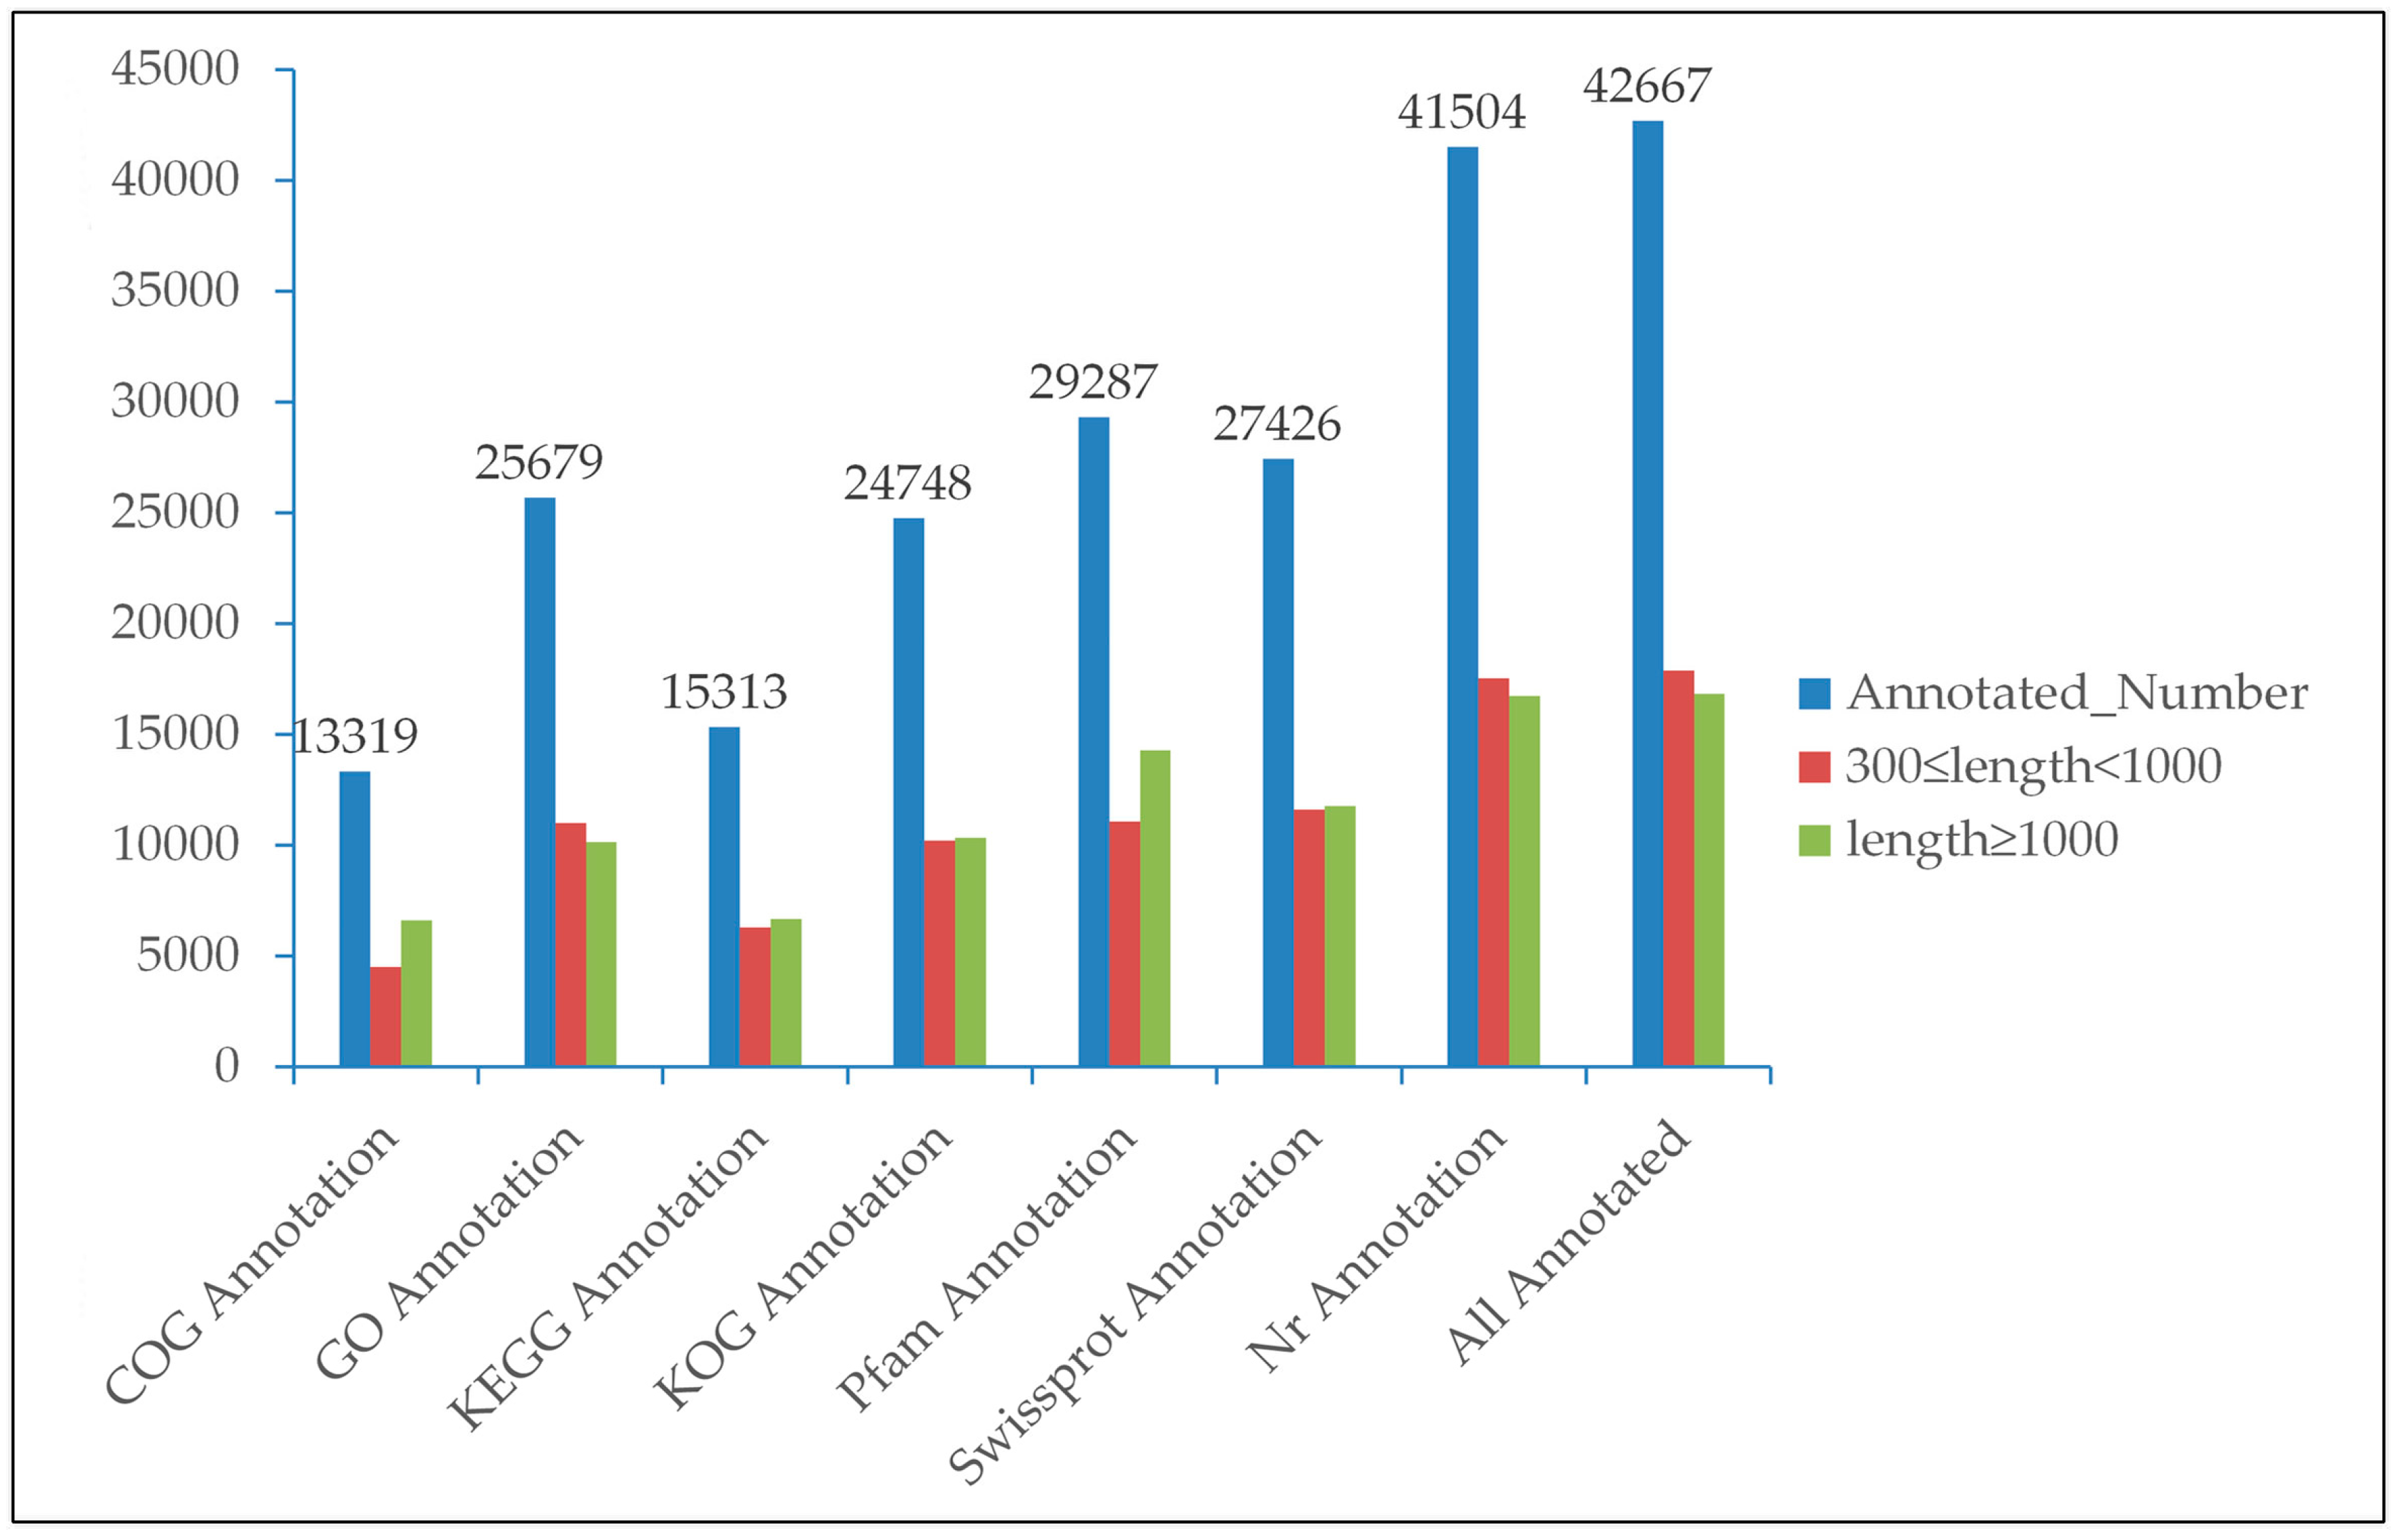
3.2. Functional Annotation

Sequence annotations of all unigenes were predicted with BLAST [21] with an E-value threshold of 10−5 in the NCBI database of Nr [17], the Swiss-Prot [18] protein database, the KEGG [22] database, the COG [19] database, and the GO [24] database. Finally, after sequence annotation, 48.43% unigenes were predicted and 51.57% unigenes were still unknown. Among these annotated unigenes, 41,504 had significant matches in the Nr database, 29,287 had significant matches to the Pfam database , 25,679 had effective matches to the GO database, while 27,426 matched the Swiss-Prot database (Figure 3 and Table S3). In total, 42,667 unigenes were BLAST for homology searches, resulting in 48.43% unigenes showing similarity to known protein databases. For unigene sequences in the Nr annotations, BLAST search analysis further revealed that a total 11,692 had the most similar sequences to proteins from Picea sitchensis, followed by Elaeis guineensis Jacq., with a value of 2674, and Amborella trichopoda Baill., with a value of 2292 (Figure 4 and Table S4).

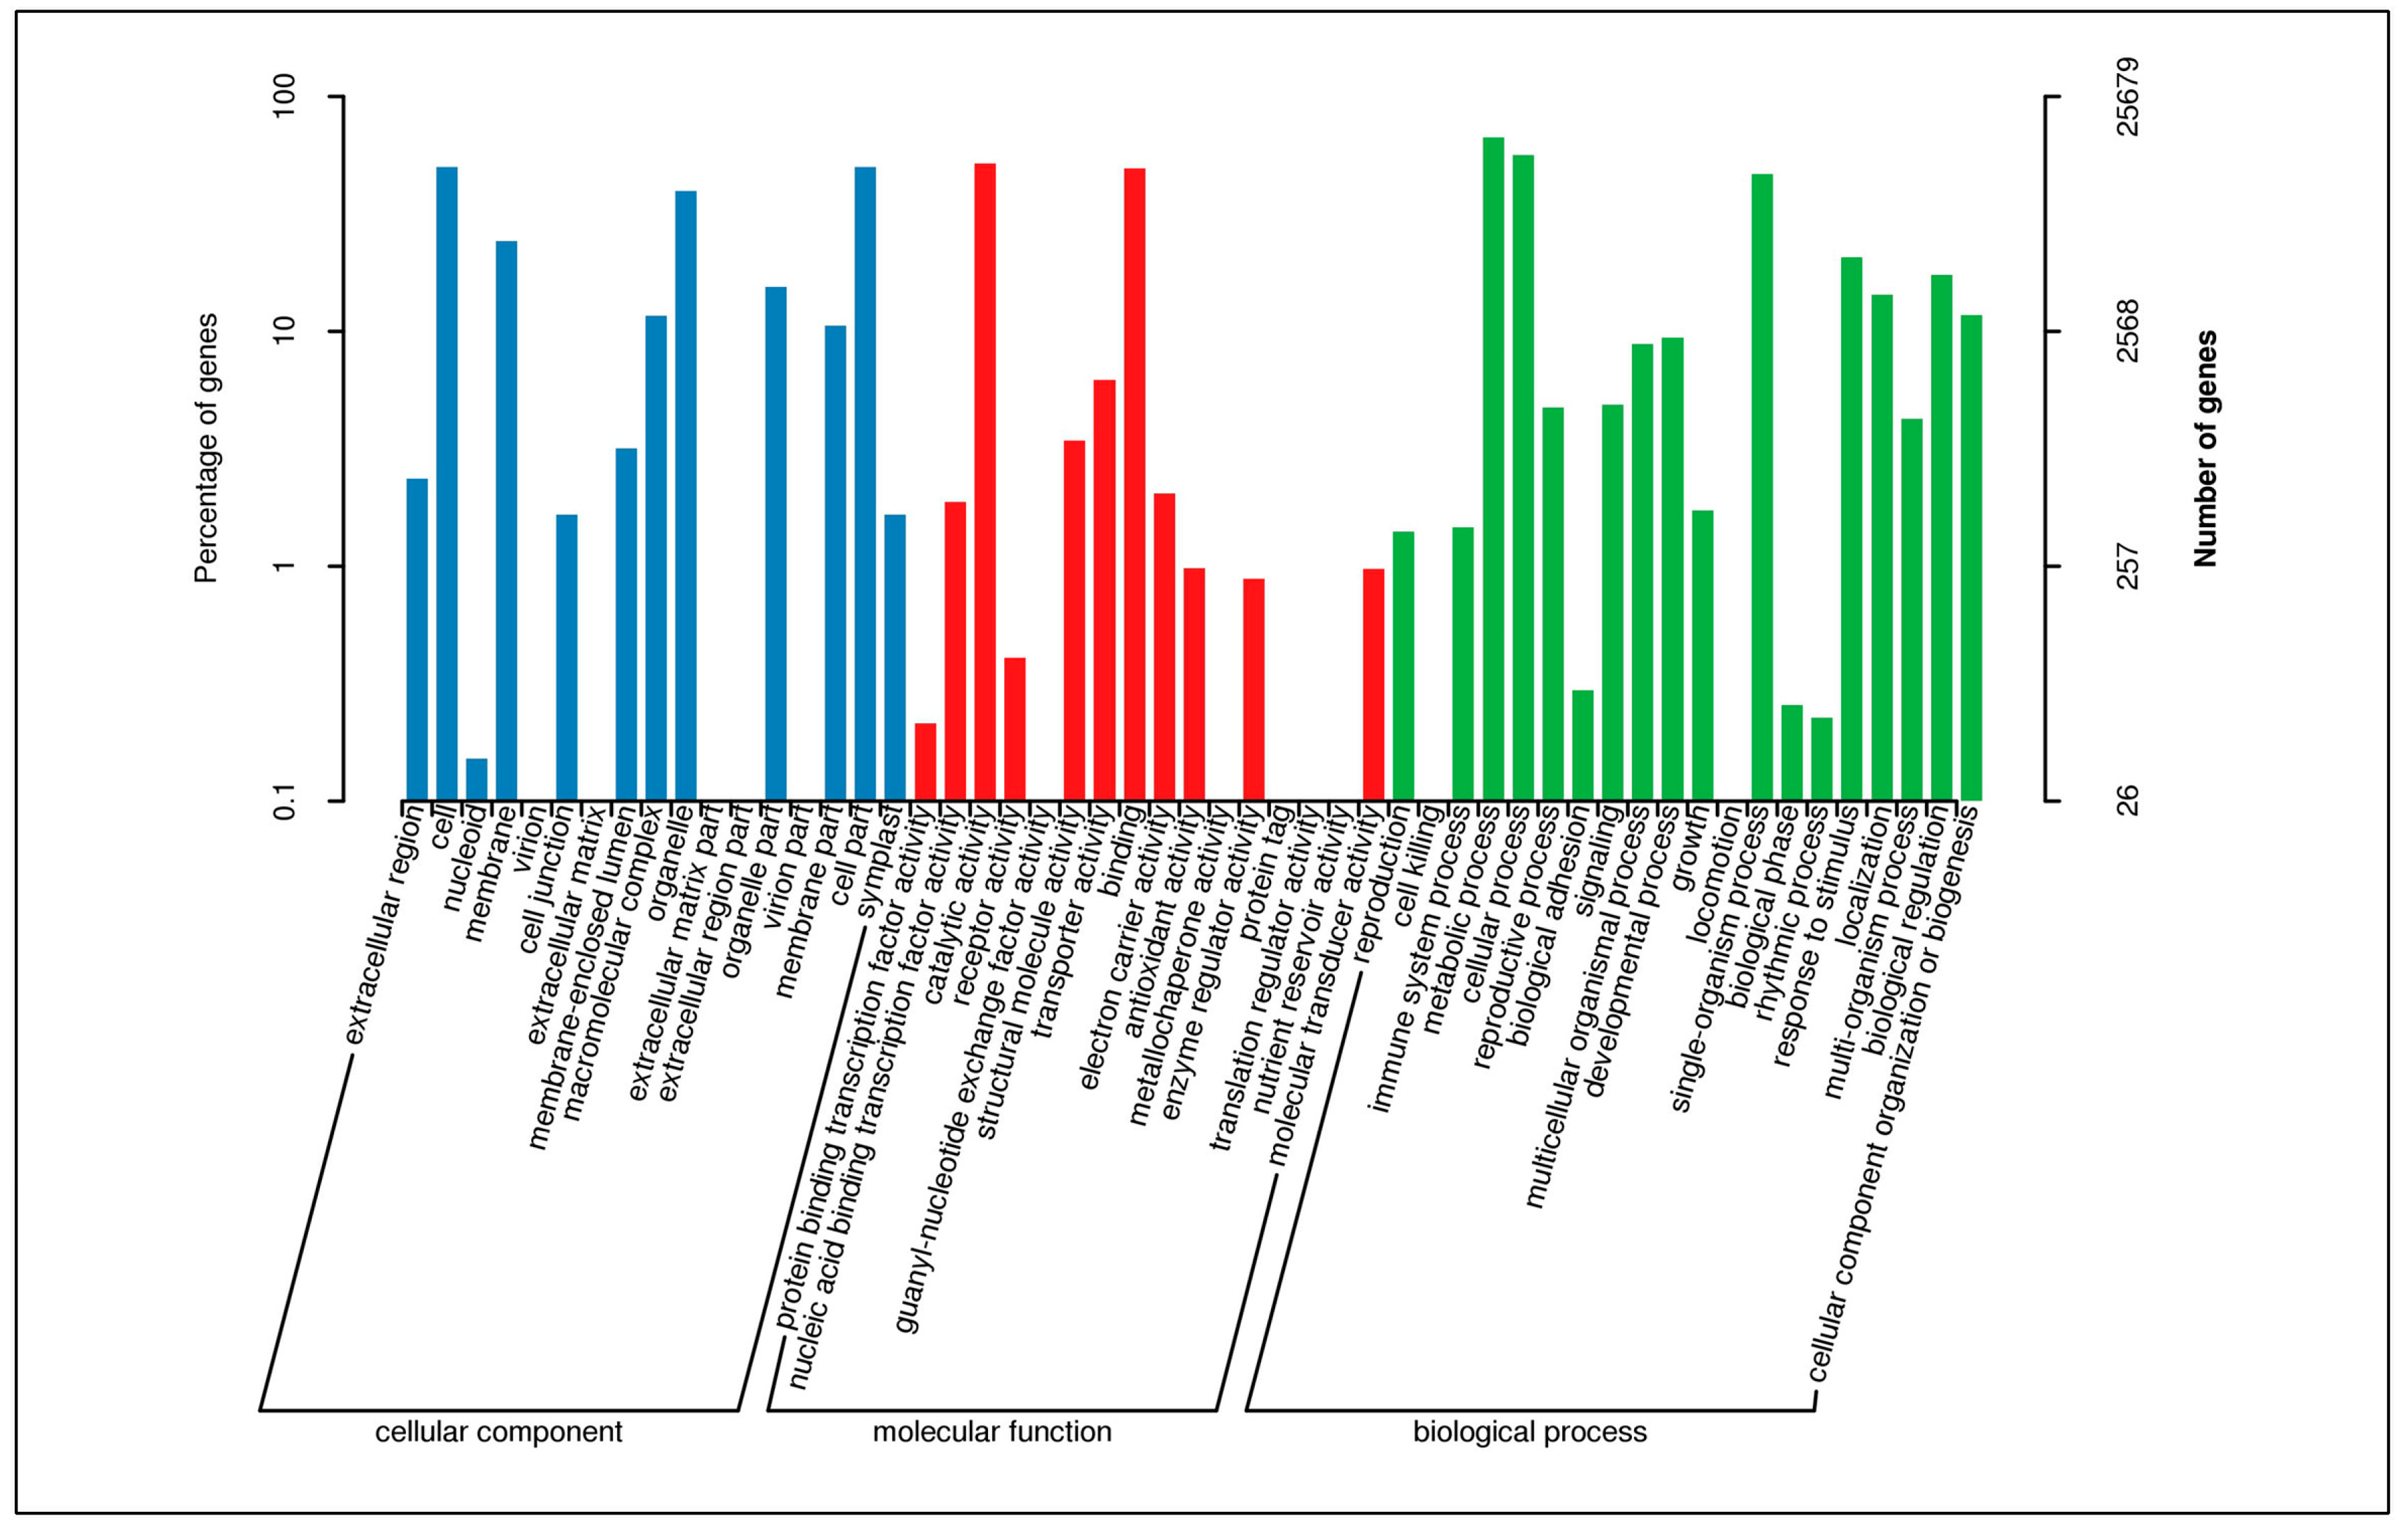
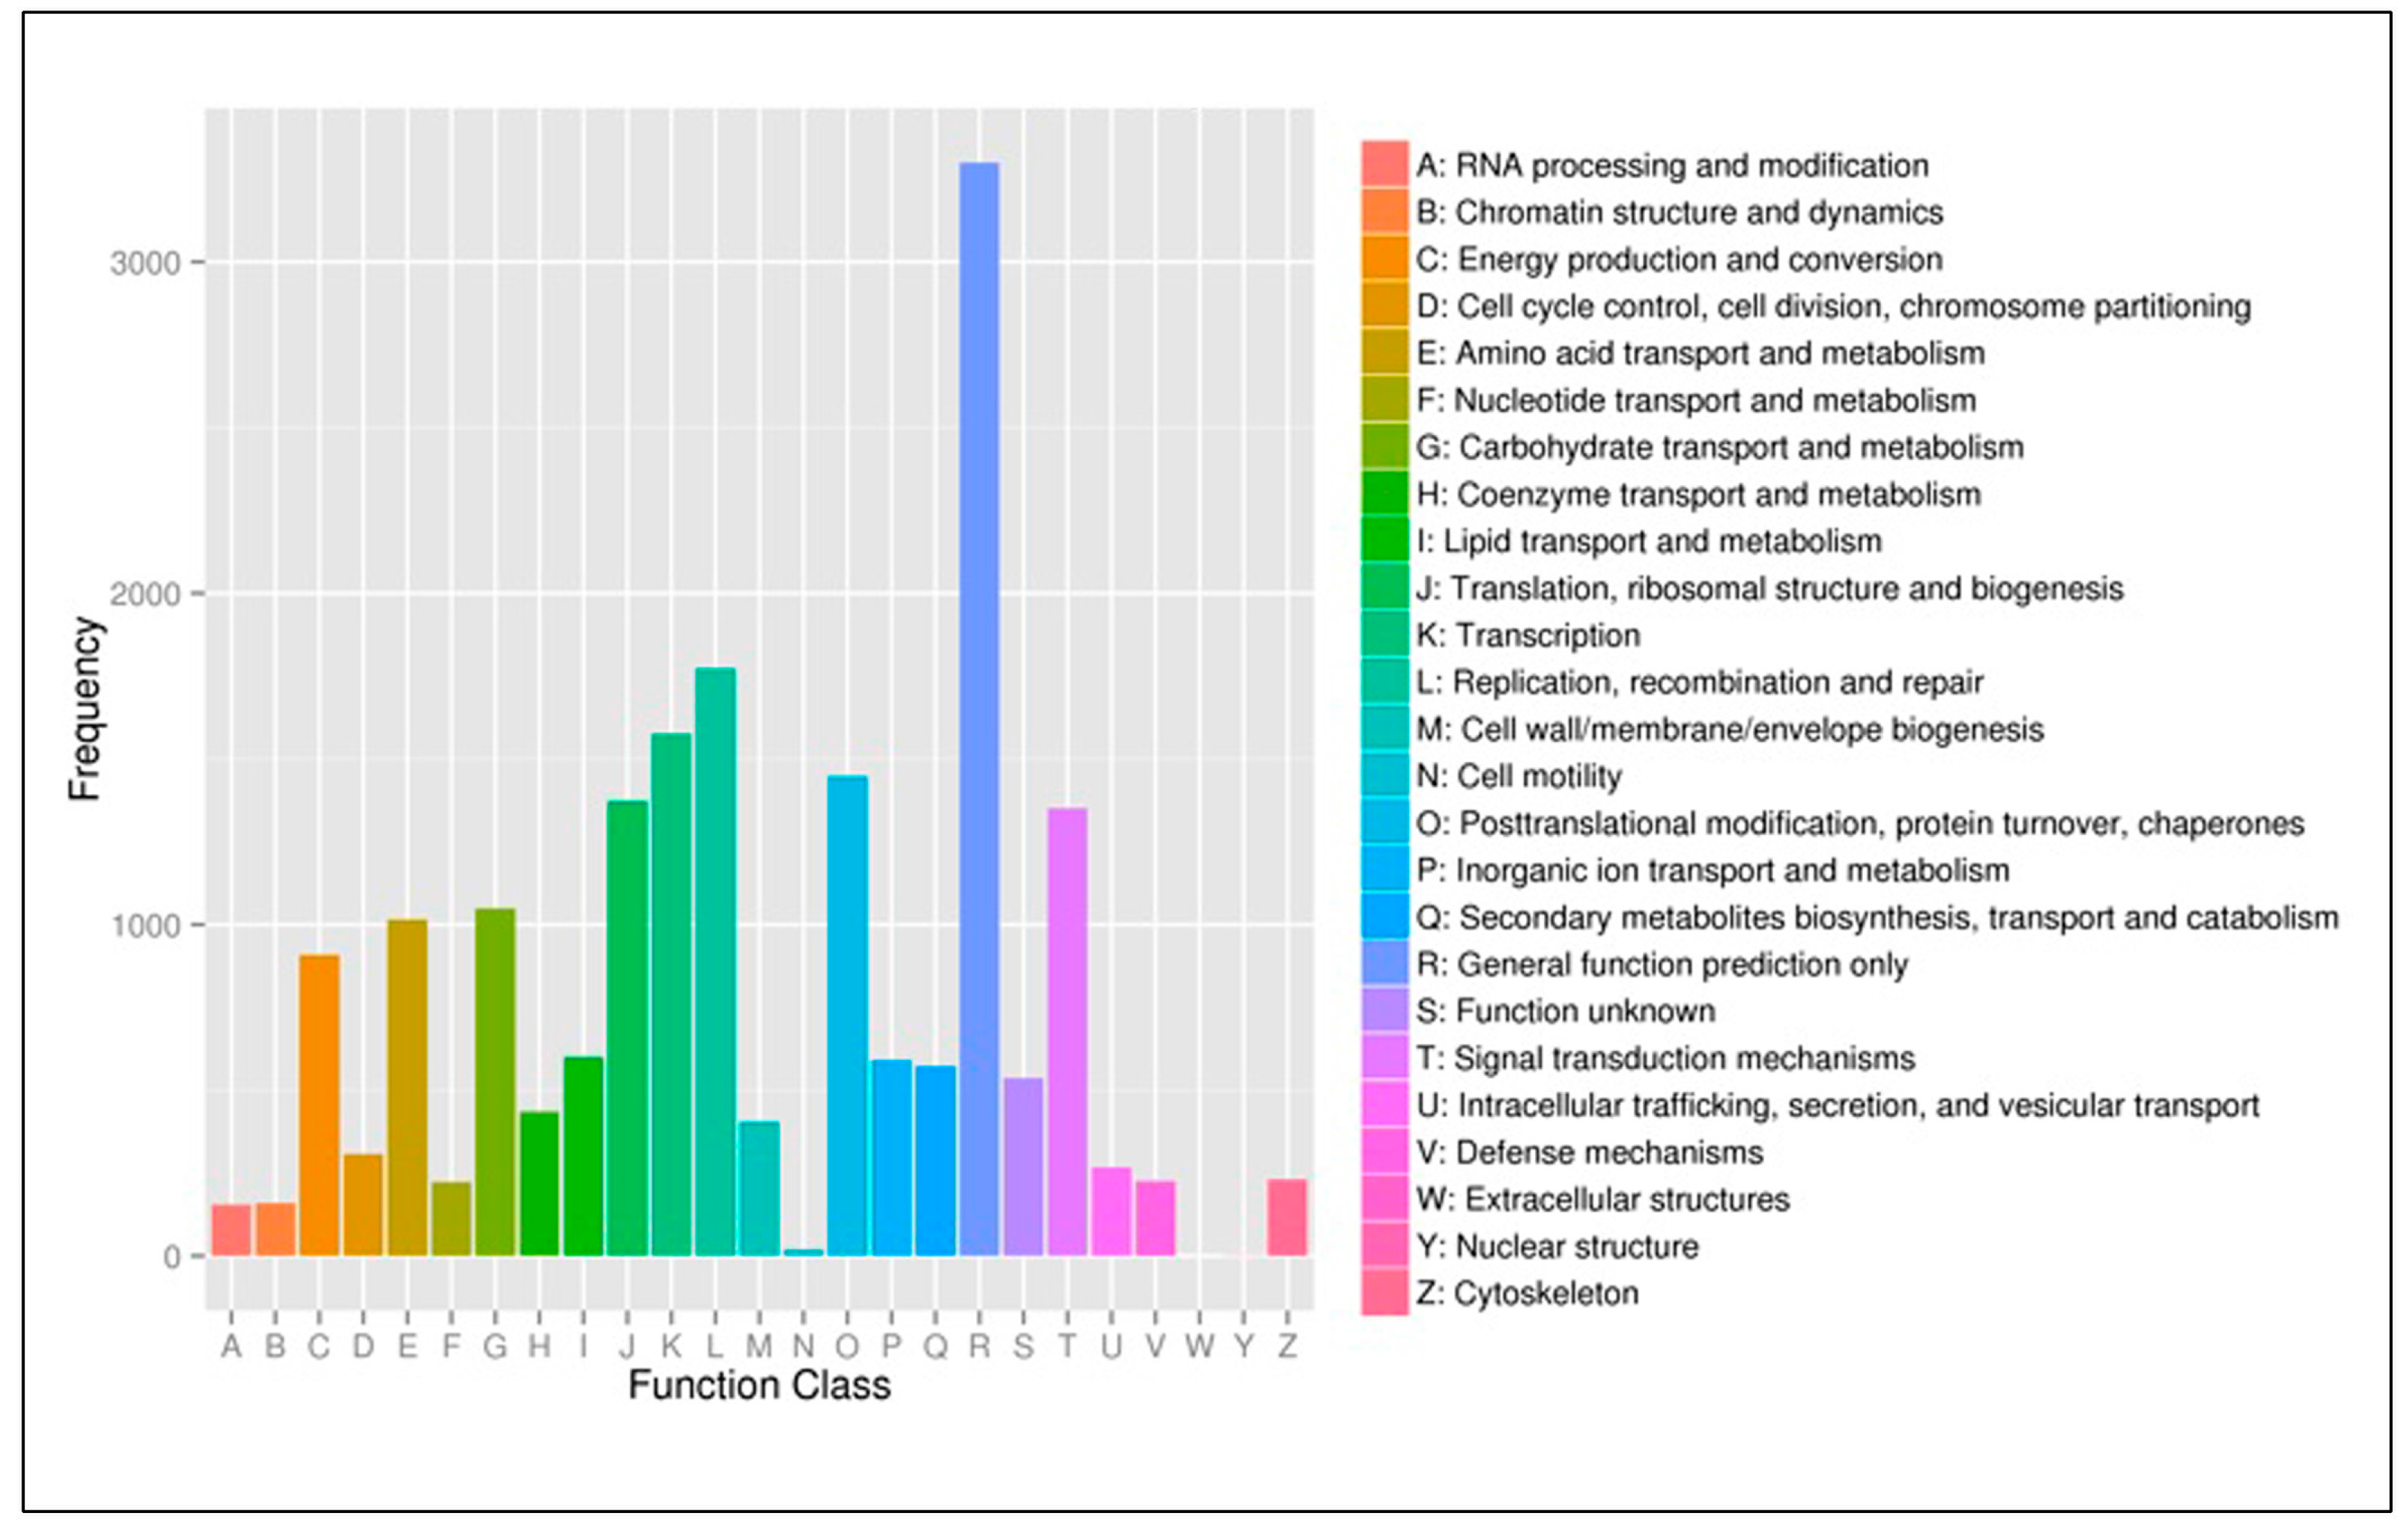
3.3. Functional Classification

Based on the GO annotation, in total, 25,679 unigenes were assigned to 53 functional groups which were categorized into three main divisions (Figure 5 and Table S5). The Cellular components were classified into 17 groups, within which the unigenes were mostly enriched in the cell (12,836), the cell part (12,836), and the organelle (10,185). Additionally, the unique sequences were grouped into 16 groups which were included in the molecular function. The predominant groups were the catalytic activity (13,329) and binding (12,710). These were followed by transporter activity (1594) and structural molecule activity (879). In the biological process group, the matched unique sequences were categorized into 20 classes. In this group, the unigenes were highly matched to the metabolic process (17,168), followed closely by the cellular process (14,445), the single-organism process (11,988), the response to stimulus (5320), the biological regulation (4461), and the localization (3673) (Table S5).
All the assembled unigenes were searched in the COG database. A total of 18,516 matched unique sequences were categorized into 25 functional groups (Figure 6). The maximum group was replication, recombination, and repair (1773), followed by the transcription (1576), posttranslational modification (1447), translation, ribosomal structure, and biogenesis (1372), signal transduction mechanisms (1351), carbohydrate transport and metabolism (1049), and amino acid transport and metabolism (1015) (Figure 6). However, extracellular structures and nuclear structure respectively matched one and two unigenes (Figure 6). Groups with no concrete assignment, such as function unknown (536) and general function prediction only (3299), accounted for a part of unigenes (Figure 6).

3.4. Simple Sequence Repeats (SSR) Loci Discovery

We used the generated 19,372 unigenes (≥1 kb) to exploit potential microsatellites by using MISA software. In total, this resulted in an authentication of 3323 putative microsatellites (including 1717 mononucleotides), covering 2829 nice SSR loci, and 163 loci in a compound formation. The most abundant repeat motif (excluding mononucleotides) was trinucleotide, 862, followed by dinucleotide, 646, tetra nucleotide, 76, penta nucleotide, 14, and hex nucleotide, 8 (Table 3 and Table S6). Further, we designed 2352 SSR primer pairs successfully using software Primer 3 (Table S7). These SSR loci will significantly contribute to developing polymorphic SSR markers in Pinus Zucc. ex Endl.

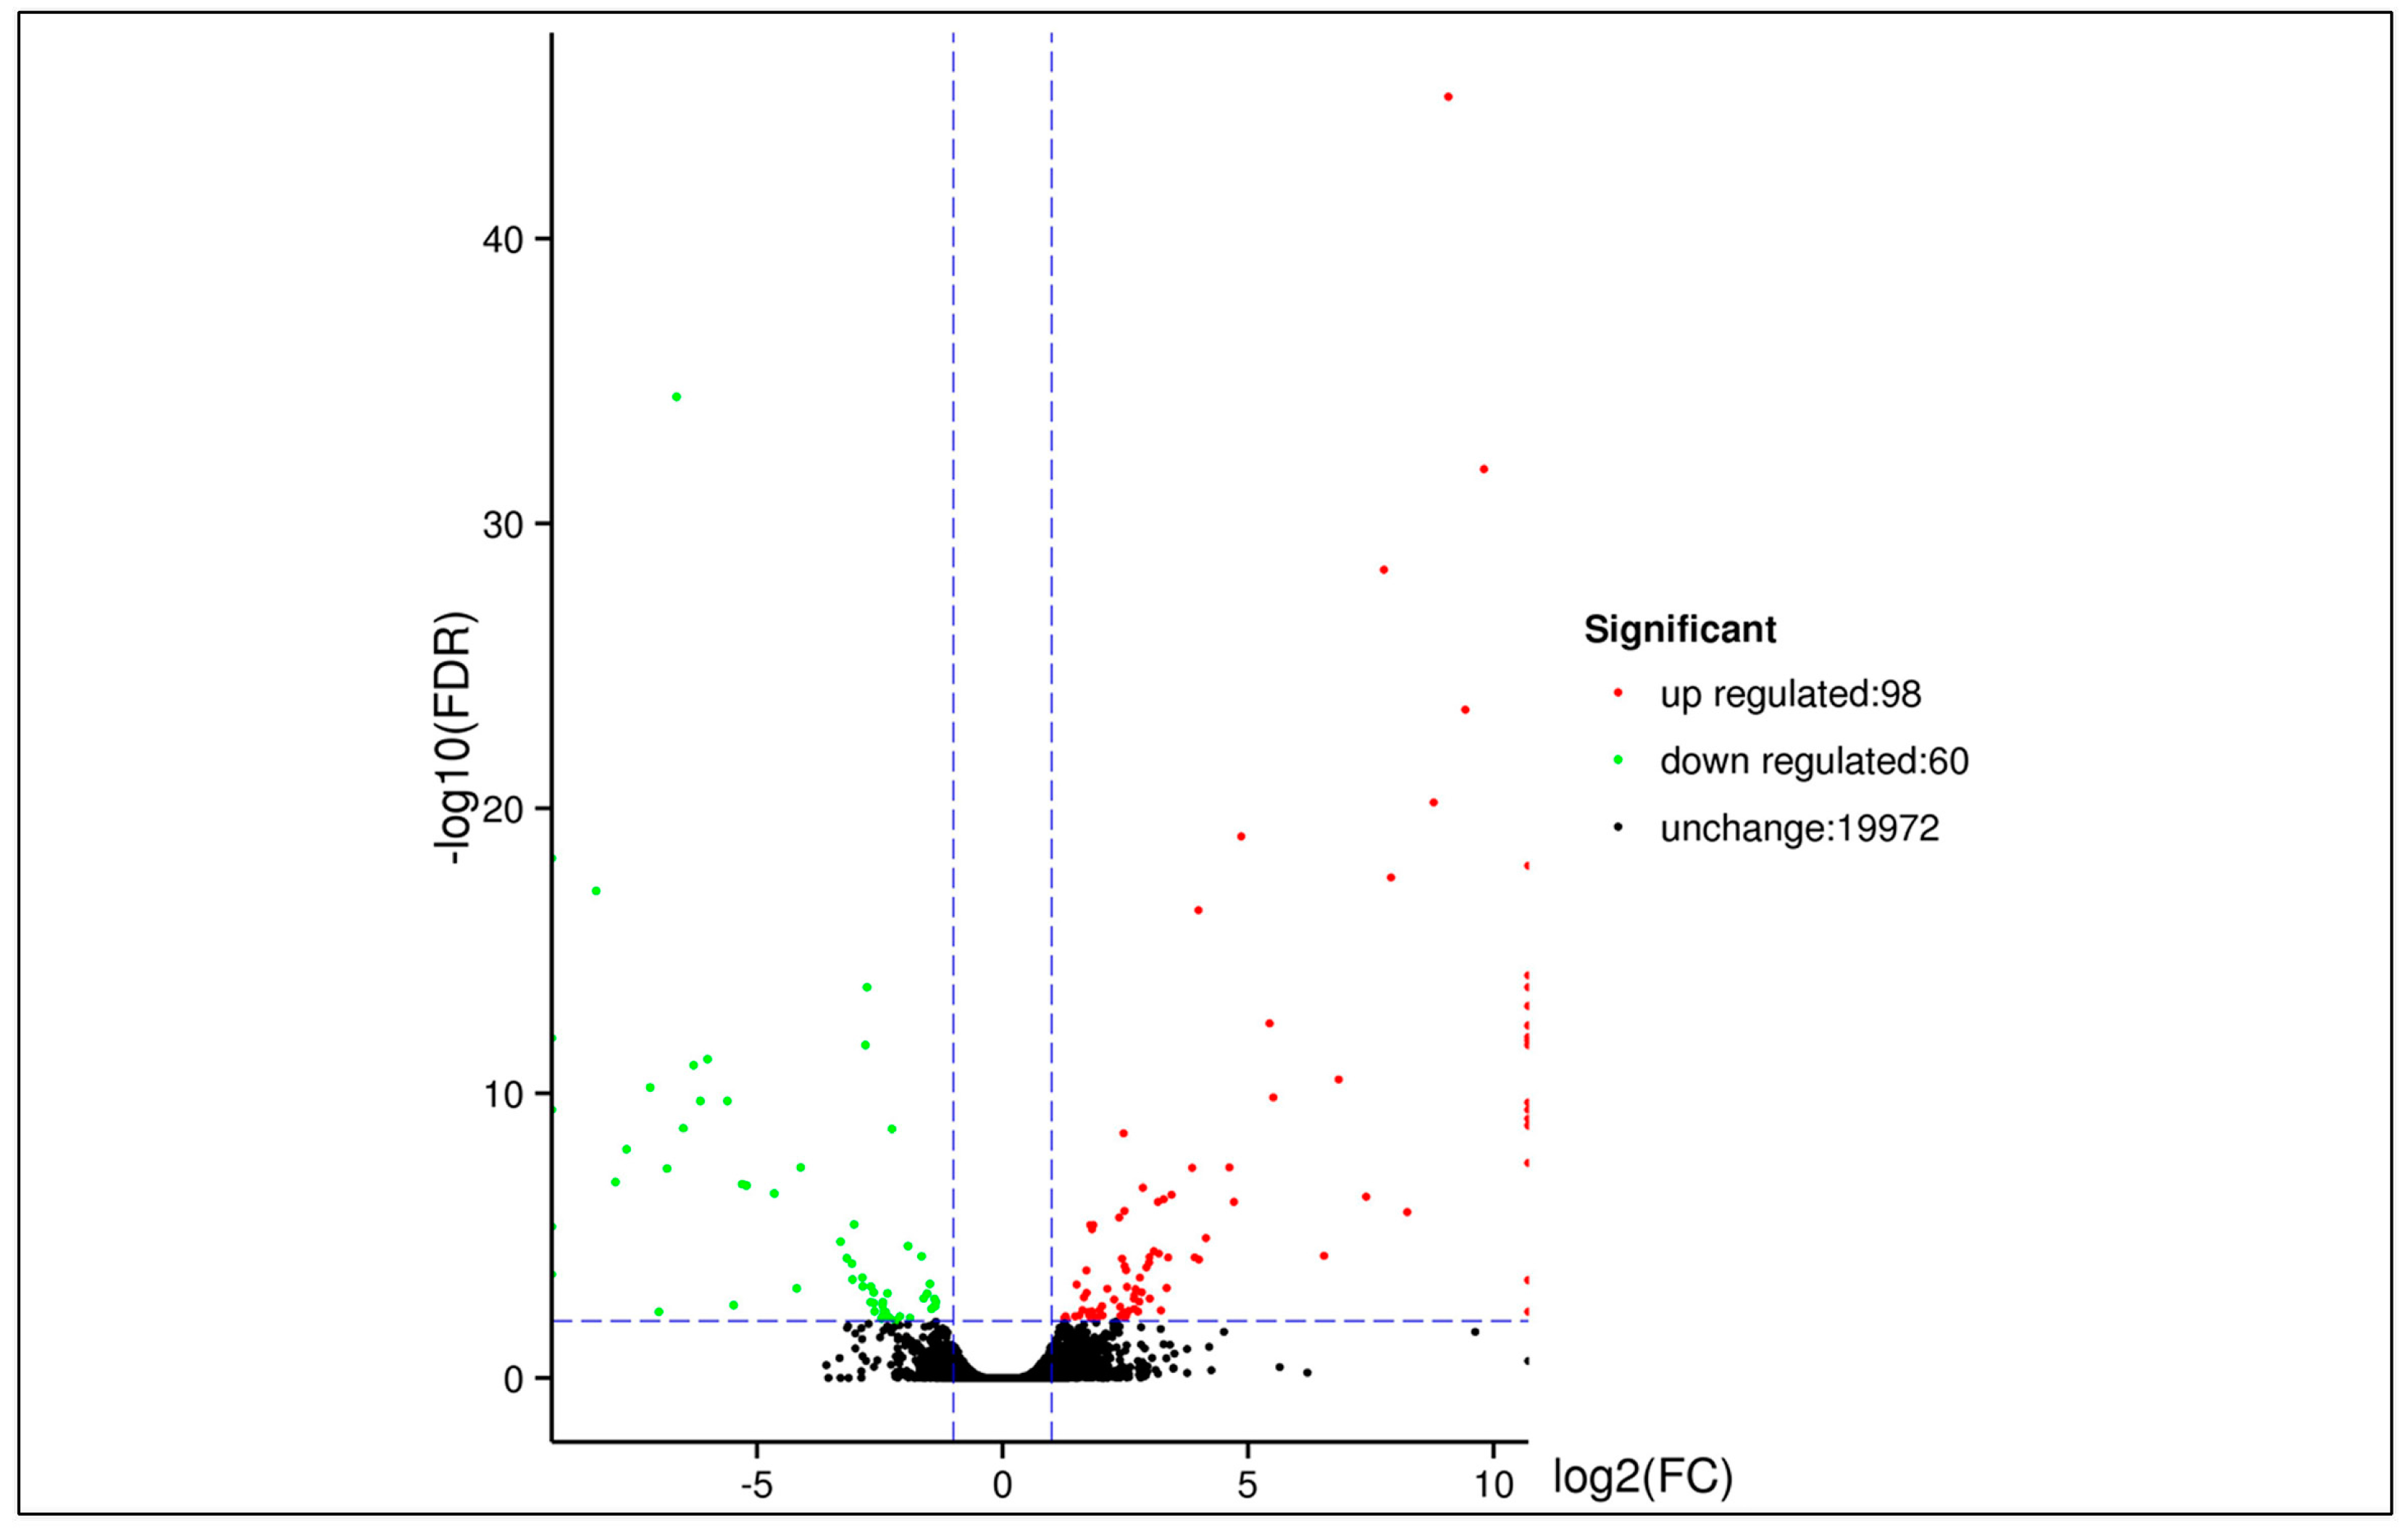
3.5. DEGs between Two Samples

The analysis showed that a few of the unigenes were significantly affected between the two varieties. The Volcano plot showed the number of DEGs between the two samples (Figure 7). We identified 158 unigenes as DEGs, including 98 up-regulated and 60 down-regulated unigenes (Table 4 and Table S8).

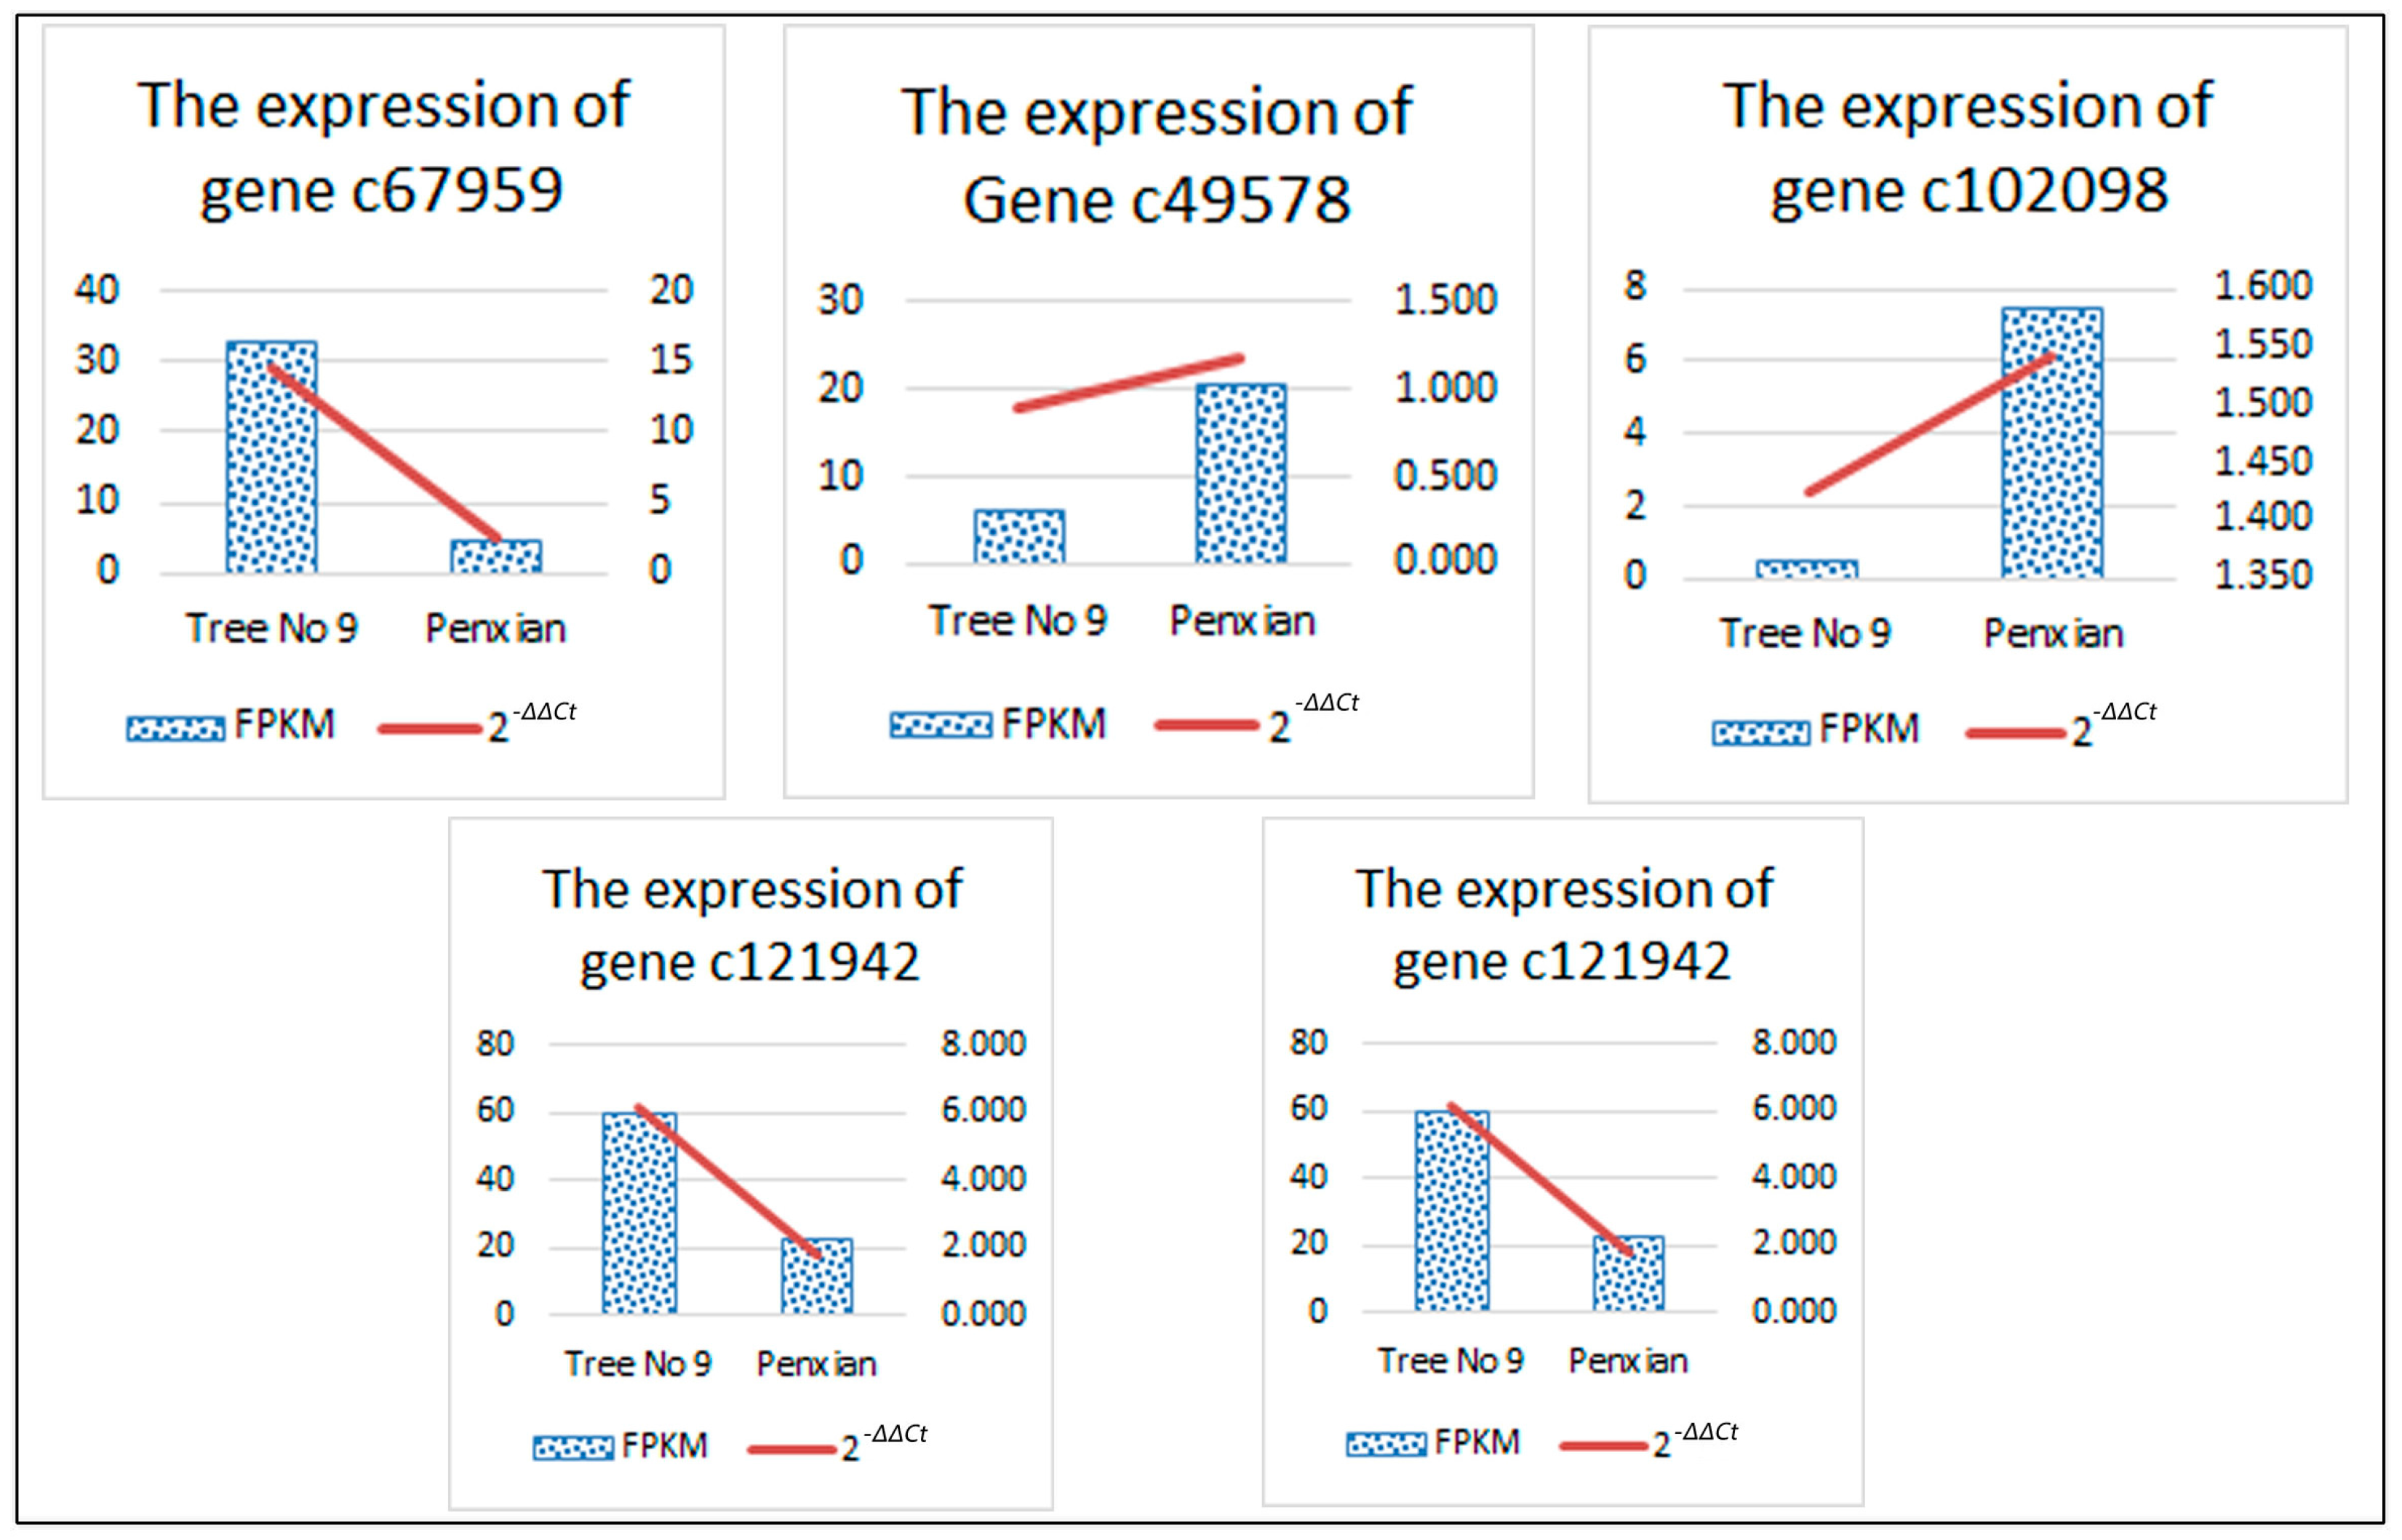
3.6. Confirmation of Solexa Expression Patterns by RT-qPCR

There are different expression genes between the two varieties. As there is a difference between the two varieties in terms of morphology, we suggest that the auxin in them is different. Therefore, the genes for plant hormone, apical dominance, and genes transcriptional factor were identified in the KEGG pathways (Table 5 and Table S1) from the DEGs. The genes concerning the CKX were down-regulated. The unigenes relating to ARR-A were up-regulated. Moreover, the unigenes for AHP related up. To take the basics of DEGs of high-throughput sequencing further and confirm it, we selected five genes to validate the expression patterns of them by RT-qPCR. As it was shown in Figure 8, the expression patterns were highly consistent with the RNA-Seq analysis.

4. Discussion

4.1. The Description of Pinus Bungeana Zucc. ex Endl. Transcriptome

Due to its low cost and high throughput, transcriptome sequencing is becoming a necessary method to perform gene discovery. The plants without a reference genome de novo transcriptome have been generated by illumine high throughput sequencing in recent years such as Liriodendron chinense (Hemsl.) Sarg. [29], Corchorus capsularis L. [30], Camelina sativa L. [31], and Chlorophytum borivilianum Santapau & R.R. Fern. [32], etc. The Pinus spp. are ancient species and important in modern landscape planting. In addition, the Pinus bungeana Zucc. ex Endl. is an endangered species [33]. Therefore, research on the new varieties of Pinus bungeana Zucc. ex Endl. is necessary. The new variety “Penxian” loses apical dominance completely, which is regulated by the factors related to plant hormones, including signal transduction and genes transcriptional factor. So, the transcriptome study not only enriched the lack of molecular data on Pinus bungeana Zucc. ex Endl., but also supplied materials for the research of apical dominance.

4.2. Transcriptome Assembly and Gene Annotation

In this paper, 42,667 (48.43%) unigenes out of 88,092 identified were annotated using BLAST searches of the public Nr [17], Swiss-Prot [18], GO [24], COG [19], and KEGG [22] databases. According to existing databases, more than 50% of unigenes were not annotated. Several reasons, such as assembly mistakes, short sequences not containing a protein domain, the deficiency of genomic information on the Pinus app., the unigenes without hits probably belonging to untranslated regions, non-coding RNA, etc., may lead to this result [34]. The unigenes without hits may be considered putative novel transcribed sequences because of the lack of Pinus app. transcriptomic information. So, this means a large collection of unigenes of Pinus and expression patterns is necessary.
The annotation for each hit unigene met the GO annotation in terms of biological process, molecular function, and cellular components groups (Figure 5). The categories such as the nucleotide binding (GO: 0000166), DNA binding (GO: 0003677), zinc ion binding (GO: 0008270), protein binding (GO: 0005515), ATP binding (GO: 0005524), metal ion binding (GO: 0046872), and the structural constituent of ribosome (GO: 0003735) were well identified, indicating the need for a large number of transcripts related to various biochemical processes. These gene annotations will make contributions to the discovery of other sibling species in Pinus app.

4.3. Identification of Transcription Factor Involved in Pinus Bungeana Zucc. ex Endl. Architecture Regulation

Transcription factors usually relate to plant architecture regulation. Transcript profiling can be a valid tool for the characterization of apical dominance-related transcriptional factors genes. To gather information of transcription factors genes family in Pinus bungeana Zucc. ex Endl., we retrieved all members of transcription factors gene family from Pfam and searched against databases of Pinus bungeana Zucc. ex Endl. DEGs as mentioned above. In total, we found two MADS-box transcription factors in Pinus bungeana Zucc. ex Endl. (Table 5). The two transcription factors were down-regulated in “Penxian”, but the opposite in “Tree No. 9”. Among the transcription factors identified from our data, MADS-box is one of the most important transcription factors due to its roles in Pinus bungeana Zucc. ex Endl. architecture regulation.

4.4. DEGs between the Two Varieties

The differences between the two varieties are apparent. Also, 158 unigenes expressed differently. Actually, the previous study including the two lacebark pine varieties, using SSR markers, showed that genetic difference exists between the samples of “Penxian” and “Tree No. 9” [35]. So, this research also goes a step further on the basis of the previous study, to develop a more unambiguous understanding of the morphology of Pinus bungeana. Additionally, among the DEGs, CKX (K00279, EC1.5.99.12, Figure S1), ARR-A (K14492, Figure S2), and AHP (K14490, Figure S2) were related to apical dominance. The function of CKX in the regulation of plant form was reported [36]. In rice, reduced expression of CKX caused CK accumulation in inflorescence meristems and increased the number of reproductive organs [37]. In transgenic Arabidopsis plants, the over expression of CKX creased CK breakdown and resulted in diminished activity of the vegetative and floral apical meristems and leaf primordia, as well as the root meristematic cell activity related to plant form [38]. ARR-A and AHP are in the same pathway, plant hormone signal transduction. ARR-A increased cytokinin sensitivity and resulted in weak morphological phenotypes [39]. Furthermore, AHP is the previous process in the pathway to the result of Cell division and Shoot initiation (Ko04075, Figure S1). In this paper, the CKX was down-regulated, whilst ARR-A and AHP were up-regulated, which may be the main reason for the difference between the two varieties. However, apical dominance is very complex, which is connected with not only the auxin and CK and their interactions in controlling the buds’ outgrowth, but also the buds’ status of dormancy and sustained that would be easily influenced by the environmental factors, such as light, photoperiod, carbon acquisition, and nutrients [11,40]. Moreover, this paper may promote a research approach on the function of CK and ARR-A in Pinus.

5. Conclusions

In this study, 88,092 unigenes with an average length of 758 bp were obtained. In addition, 42,667 unigenes acquired were BLAST, resulting in 48.43% unigenes showing similarity to known protein databases. A total of 3323 putative microsatellites (including 1717 mononucleotides), covering 2829 perfect SSR loci, and 163 loci in a compound form. The DEGs related to CKX, ARR-A, AHP, and the MADS-box transcription factors between the two varieties are validated by RT-qPCR. This will provide support to for the classical hypothesis of apical dominance. The transcriptome data in this study will contribute to further gene discovery and functional exploration for Pinus significative characterization in deeper genetic breeding.

Supplementary Materials

The following are available online at https://www.mdpi.com/1999-4907/9/3/156/s1, Table S1: The detail sequence of the selected five transcripts, Table S2: The specific primer for RT-qPCR, Table S3: The Unigene Number Annotated in the Public Database Searches, Table S4: Nr Homologous Species Distribution, Table S5: GO Classification of all unigenes, Table S6: Frequency of identified SSR motifs, Table S7: The details of the 2352 SSR primer pairs, Table S8: The details of the 158 DEGs, Figure S1: The pathway map of ko00908, Figure S2: The pathway map of ko04075. The dataset is available from the NCBI Short Read Archive (SRA) with an accession number SRX2024410 (https://www.ncbi.nlm.nih.gov/sra/SRX2024410).

Acknowledgments

We are grateful to the supporting funding from the National Natural Science Foundation of China (31370667), National Key Technology of China (2013BA001B06) and Inner Mongolia Hesheng Institute of Ecological Sciences & Technology (Hesheng2014).

Author Contributions

B.L. and Y.Z. conceived and designed the experiments; Q.C. performed the experiments, conducted the data analysis. and wrote the manuscript; F.L. contributed the plant material; P.H. analyzed the data; W.G. revised the manuscript.

Conflicts of Interest

The authors declare no conflict of interest.

References

  1. Stinchcombe, J.R.; Hoekstra, H.E. Combining population genomics and quantitative genetics: Finding the genes underlying ecologically important traits. Heredity 2008, 100, 158–170. [Google Scholar] [CrossRef] [PubMed]
  2. Andersen, J.R.; Lubberstedt, T. Functional markers in plants. Trends Plant Sci. 2003, 8, 554–560. [Google Scholar] [CrossRef] [PubMed]
  3. Novaes, E.; Drost, D.R.; Farmerie, W.G.; Pappas, G.J., Jr.; Grattapaglia, D.; Sederoff, R.R.; Kirst, M. High-throughput gene and snp discovery in eucalyptus grandis, an uncharacterized genome. BMC Genom. 2008, 9, 312. [Google Scholar] [CrossRef] [PubMed]
  4. Kim, J.S.; Moon, J.F.; Lim, S.H.; Kim, J.C. Applications of next generation sequencing in molecular ecology of non-model organisms. Heredity 2011, 107, 1–15. [Google Scholar] [CrossRef]
  5. Wang, Z.; Gerstein, M.; Snyder, M. Rna-seq: A revolutionary tool for transcriptomics. Nat. Rev. Genet. 2009, 10, 57–63. [Google Scholar] [CrossRef] [PubMed]
  6. Trapnell, C.; Williams, B.A.; Pertea, G.; Mortazavi, A.; Kwan, G.; van Baren, M.J.; Salzberg, S.L.; Wold, B.J.; Pachter, L. Transcript assembly and quantification by rna-seq reveals unannotated transcripts and isoform switching during cell differentiation. Nat. Biotechnol. 2010, 28, 511–515. [Google Scholar] [CrossRef] [PubMed]
  7. Cline, M. Concepts and terminology of apical dominance. Am. J. Bot. 1997, 84, 1064. [Google Scholar] [CrossRef] [PubMed]
  8. Cline, M.G. Execution of the auxin replacement apical dominance experiment in temperate woody species. Am. J. Bot. 2000, 87, 182–190. [Google Scholar] [CrossRef] [PubMed]
  9. Tanaka, M.; Takei, K.; Kojima, M.; Sakakibara, H.; Mori, H. Auxin controls local cytokinin biosynthesis in the nodal stem in apical dominance. Plant J. Cell Mol. Biol. 2006, 45, 1028–1036. [Google Scholar] [CrossRef] [PubMed]
  10. Reig, C.; Farina, V.; Mesejo, C.; Martínez-Fuentes, A.; Barone, F.; Agustí, M. Fruit regulates bud sprouting and vegetative growth in field-grown loquat trees (Eriobotrya japonica lindl.): Nutritional and hormonal changes. J. Plant Growth Regul. 2014, 33, 222–232. [Google Scholar] [CrossRef]
  11. Dun, E.A.; Ferguson, B.J.; Beveridge, C.A. Apical dominance and shoot branching. Divergent opinions or divergent mechanisms? Plant Physiol. 2006, 142, 812–819. [Google Scholar] [CrossRef] [PubMed]
  12. Booker, J.; Chatfield, S.; Leyser, O. Auxin acts in xylem-associated or medullary cells to mediate apical dominance. Plant Cell 2003, 15, 495–507. [Google Scholar] [CrossRef] [PubMed]
  13. Tamas, I.A. Hormonal Regulation of Apical Dominance; Springer: Dordrecht, Netherlands, 1995; pp. 393–410. ISBN 978-0-7923-2985-5. [Google Scholar] [CrossRef]
  14. Werner, T.; Motyka, V.; Strnad, M.; Schmulling, T. Regulation of plant growth by cytokinin. Proc. Natl. Acad. Sci. USA 2001, 98, 10487–10492. [Google Scholar] [CrossRef] [PubMed]
  15. Werner, T.; Nehnevajova, E.; Kollmer, I.; Novak, O.; Strnad, M.; Kramer, U.; Schmulling, T. Root-specific reduction of cytokinin causes enhanced root growth, drought tolerance, and leaf mineral enrichment in arabidopsis and tobacco. Plant Cell 2010, 22, 3905–3920. [Google Scholar] [CrossRef] [PubMed]
  16. Grabherr, M.G.; Haas, B.J.; Yassour, M.; Levin, J.Z.; Thompson, D.A.; Amit, I.; Adiconis, X.; Fan, L.; Raychowdhury, R.; Zeng, Q. Full-length transcriptome assembly from RNA-Seq data without a reference genome. Nat. Biotechnol. 2011, 29, 644. [Google Scholar] [CrossRef] [PubMed]
  17. Deng, Y.; Jianqi, L.I.; Songfeng, W.U.; Zhu, Y.; Chen, Y.; Fuchu, H.E. Integrated nr database in protein annotation system and its localization. Comput. Eng. 2006, 32, 71–72. [Google Scholar]
  18. Apweiler, R.; Bairoch, A.; Wu, C.H.; Barker, W.C.; Boeckmann, B.; Ferro, S.; Gasteiqer, E.; Huang, H.; Lopez, R.; Maqrane, M.; et al. Uniprot: The universal protein knowledgebase. Nucleic Acids Res. 2004, 32, D115–D119. [Google Scholar] [CrossRef] [PubMed]
  19. Tatusov, R.L.; Galperin, M.Y.; Natale, D.A.; Koonin, E.V. The cog database: A tool for genome-scale analysis of protein functions and evolution. Nucleic Acids Res. 2000, 28, 33–36. [Google Scholar] [CrossRef] [PubMed]
  20. Finn, R.D.; Coggill, P.; Eberhardt, R.Y.; Eddy, S.R.; Mistry, J.; Mitchell, A.L.; Potter, S.C.; Punta, M.; Qureshi, M.; Sangrador-Vegas, A.; et al. The pfam protein families database: Towards a more sustainable future. Nucleic Acids Res. 2016, 44, D279–D285. [Google Scholar] [CrossRef] [PubMed]
  21. Altschul, S.F.; Madden, T.L.; Schaffer, A.A.; Zhang, J.; Zhang, Z.; Miller, W.; Lipman, D.J. Gapped blast and psi-blast: A new generation of protein database search programs. Nucleic Acids Res. 1997, 25, 3389–3402. [Google Scholar] [CrossRef] [PubMed]
  22. Kanehisa, M.; Goto, S.; Kawashima, S.; Okuno, Y.; Hattori, M. The KEGG resource for deciphering the genome. Nucleic Acids Res. 2003, 32, D277. [Google Scholar] [CrossRef] [PubMed]
  23. Conesa, A.; Gotz, S.; Garcia-Gomez, J.M.; Terol, J.; Talon, M.; Robles, M. Blast2go: A universal tool for annotation, visualization and analysis in functional genomics research. Bioinformatics 2005, 21, 3674–3676. [Google Scholar] [CrossRef] [PubMed]
  24. Ashburner, M.; Ball, C.A.; Blake, J.A.; Botstein, D.; Butler, H.; Cherry, J.; Davis, A.; Dolinski, K.; Dwight, S.; Eppig, J.; et al. Gene ontology: Tool for the unification of biology. The gene ontology consortium. Nat. Genet. 2000, 25, 25–29. [Google Scholar] [CrossRef] [PubMed]
  25. Xie, C.; Mao, X.; Huang, J.; Ding, Y.; Wu, J.; Dong, S.; Kong, L.; Gao, G.; Li, C.Y.; Wei, L. Kobas 2.0: A web server for annotation and identification of enriched pathways and diseases. Nucleic Acids Res. 2011, 39, W316–W322. [Google Scholar] [CrossRef] [PubMed]
  26. Wu, J.; Mao, X.; Cai, T.; Luo, J.; Wei, L. Kobas server: A web-based platform for automated annotation and pathway identification. Nucleic Acids Res. 2006, 34, W720–W724. [Google Scholar] [CrossRef] [PubMed]
  27. Rice, P.; Longden, I.; Bleasby, A. Emboss: The european molecular biology open software suite. Trends Genet. TIG 2000, 16, 276–277. [Google Scholar] [CrossRef]
  28. Livak, K.J.; Schmittgen, T.D. Analysis of relative gene expression data using real-time quantitative PCR and the 2ΔΔCT method. Methods 2012, 25, 402–408. [Google Scholar] [CrossRef] [PubMed]
  29. Yang, Y.; Xu, M.; Luo, Q.; Wang, J.; Li, H. De novo transcriptome analysis of Liriodendron chinense petals and leaves by illumina sequencing. Gene 2014, 534, 155–162. [Google Scholar] [CrossRef] [PubMed]
  30. Zhang, L.; Ming, R.; Zhang, J.; Tao, A.; Fang, P.; Qi, J. De novo transcriptome sequence and identification of major bast-related genes involved in cellulose biosynthesis in jute (Corchorus capsularis L.). BMC Genom. 2015, 16, 1062. [Google Scholar] [CrossRef] [PubMed]
  31. Mudalkar, S.; Golla, R.; Ghatty, S.; Reddy, A.R. De novo transcriptome analysis of an imminent biofuel crop, Camelina sativa L. Using illumina GAIIX sequencing platform and identification of SSR markers. Plant Mol. Biol. 2014, 84, 159. [Google Scholar] [CrossRef] [PubMed]
  32. Kalra, S.; Puniya, B.L.; Kulshreshtha, D.; Kumar, S.; Kaur, J.; Ramachandran, S.; Singh, K. De novo transcriptome sequencing reveals important molecular networks and metabolic pathways of the plant, Chlorophytum borivilianum. PLoS ONE 2013, 8, e83336. [Google Scholar] [CrossRef] [PubMed]
  33. Yang, Y.X.; Wang, M.L.; Liu, Z.L.; Zhu, J.; Yan, M.Y.; Li, Z.H. Nucleotide polymorphism and phylogeographic history of an endangered conifer species Pinus bungeana. Biochem. Syst. Ecol. 2016, 64, 89–96. [Google Scholar] [CrossRef]
  34. Fu, N.; Wang, Q.; Shen, H.L. De novo assembly, gene annotation and marker development using illumina paired-end transcriptome sequences in celery (Apium graveolens L.). PLoS ONE 2013, 8, e57686. [Google Scholar] [CrossRef] [PubMed]
  35. LI, B.; Meng, Q.; Li, Y.; Dong, W.; Zheng, Y. Identification and evaluation of germplasm resources of Pinus bungeana. Hunan For. Sci. Technol. 2016, 43, 1–7. [Google Scholar] [CrossRef]
  36. Galuszka, P.; Frebort, I.; Sebela, M.; Sauer, P.; Jacobsen, S.; Pec, P. Cytokinin oxidase or dehydrogenase? Mechanism of cytokinin degradation in cereals. Eur. J. Biochem. 2001, 268, 450–461. [Google Scholar] [CrossRef] [PubMed]
  37. Ashikari, M.; Sakakibara, H.; Lin, S.; Yamamoto, T.; Takashi, T.; Nishimura, A.; Angeles, E.R.; Qian, Q.; Kitano, H.; Matsuoka, M. Cytokinin oxidase regulates rice grain production. Science 2005, 309, 741–745. [Google Scholar] [CrossRef] [PubMed]
  38. Werner, T.; Motyka, V.; Laucou, V.; Smets, R.; Van, O.H.; Schmülling, T. Cytokinin-deficient transgenic arabidopsis plants show multiple developmental alterations indicating opposite functions of cytokinins in the regulation of shoot and root meristem activity. Plant Cell 2003, 15, 2532–2550. [Google Scholar] [CrossRef] [PubMed]
  39. To, J.P.; Haberer, G.; Ferreira, F.J.; Deruere, J.; Mason, M.G.; Schaller, G.E.; Alonso, J.M.; Ecker, J.R.; Kieber, J.J. Type-a arabidopsis response regulators are partially redundant negative regulators of cytokinin signaling. Plant Cell 2004, 16, 658–671. [Google Scholar] [CrossRef] [PubMed]
  40. Ferguson, B.J.; Beveridge, C.A. Roles for auxin, cytokinin, and strigolactone in regulating shoot branching. Plant Physiol. 2009, 149, 1929–1944. [Google Scholar] [CrossRef] [PubMed]
Figure 1. The plant morphology of two Pinus bungeana varieties. (a) The new variety named Penxian; (b) the ordinary variety named ’Tree No. 9’.
Forests 09 00156 g001
Figure 2. The length distributions of the unigenes.
Forests 09 00156 g002
Figure 3. The Unigene Number Annotated in the Public Database Searches.
Forests 09 00156 g003
Figure 4. Nr Homologous Species Distribution.
Forests 09 00156 g004
Figure 5. GO Classification of all unigenes.
Forests 09 00156 g005
Figure 6. COG Function Classification of Consensus Sequence.
Forests 09 00156 g006
Figure 7. The Volcano Plot of DEGs.
Forests 09 00156 g007
Figure 8. The expression of each gene by RT-qPCT and RNA-Seq.
Forests 09 00156 g008
Table 1. Statistical table of all samples sequencing data.
SamplesRead NumberBase NumberGC Content% ≥ Q30
Tree No. 9-124,713,9136,226,575,67345.7791.77
Tree No. 9-225,402,7586,399,644,06045.7891.68
Tree No. 9-324,731,0976,230,626,71745.6491.45
Penxian-124,088,2306,068,870,10246.4891.26
Penxian-225,067,3256,315,681,34545.8891.68
Penxian-323,679,8875,966,576,47345.5391.51
Total/average147,683,21037,207,974,37045.8591.56
Table 2. Unigenes Quantity and Percentage of Length.
Unigenes LengthTotal NumberPercentage
200–30031,78336.08%
300–50020,02022.73%
500–100016,91719.20%
1000–200011,78413.38%
2000+75888.61%
Total Number88,092
Total Length66,791,509
N50 Length1357
Mean Length758
Table 3. The SSR Results.
Motif TypesRepeat Number
5678910>10TotalPercent
Dinucleotide02481448467693464640.2%
Trinucleotide562197861610086253.7%
Tetra 66800200764.7%
Penta11003000140.9%
Hexa610100080.5%
Total6454542301047069341606100.0%
Percent40.2%28.3%14.3%6.5%4.4%4.3%2.1%100.0%
Table 4. The DEG Unigenes Count.
DEG SetAll DEGUp-RegulatedDown-Regulated
Tree No.9 vs. Penxian1589860
Table 5. The Unigenes in DEGs by KEGG.
Unigene IdPathwayEntryAnnotated Gene NameRegulatedlog2FC
c67959ko00908K00279CKXDOWN−2.759074002
c49578ko04075K14492ARR-AUP1.709013026
c102098ko04075K14490AHPUP3.914710727
c121942 K09264MADS-box transcription factorDOWN−1.385954738
c91025−5.475015097

