Article

Combining Decision Support Approaches for Optimizing the Selection of Bundles of Ecosystem Services

1
Forest Research Centre, School of Agriculture, University of Lisbon, Tapada da Ajuda, 1349-017 Lisboa, Portugal
2
US Department of Agriculture, Forest Service, Pacific Northwest Research Station, Corvallis Forestry Sciences Laboratory, 3200 SW Jefferson Way, Corvallis, OR 97331, USA
3
School of Sciences and Technology, Mathematics Department, University of Evora Colégio Luís António Verney, Rua Romão Ramalho, 59, 7000-671 Évora, Portugal
*
Author to whom correspondence should be addressed.
Forests 2018, 9(7), 438; https://doi.org/10.3390/f9070438
Submission received: 24 May 2018 / Revised: 18 July 2018 / Accepted: 19 July 2018 / Published: 21 July 2018

Abstract

:
This study examines the potential of combining decision support approaches to identify optimal bundles of ecosystem services in a framework characterized by multiple decision-makers. A forested landscape, Zona de Intervenção Florestal of Paiva and Entre-Douro and Sousa (ZIF_VS) in Portugal, is used to test and demonstrate this potential. The landscape extends over 14,388 ha, representing 1976 stands. The property is fragmented into 376 holdings. The overall analysis was performed in three steps. First, we selected six alternative solutions (A to F) in a Pareto frontier generated by a multiple-criteria method within a web-based decision support system (SADfLOR) for subsequent analysis. Next, an aspatial strategic multicriteria decision analysis (MCDA) was performed with the Criterium DecisionPlus (CDP) component of the Ecosystem Management Decision Support (EMDS) system to assess the aggregate performance of solutions A to F for the entire forested landscape with respect to their utility for delivery of ecosystem services. For the CDP analysis, SADfLOR data inputs were grouped into two sets of primary criteria: Wood Harvested and Other Ecosystem Services. Finally, a spatial logic-based assessment of solutions A to F for individual stands of the study area was performed with the NetWeaver component of EMDS. The NetWeaver model was structurally and computationally equivalent to the CDP model, but the key NetWeaver metric is a measure of the strength of evidence that solutions for specific stands were optimal for the unit. We conclude with a discussion of how the combination of decision support approaches encapsulated in the two systems could be further automated in order to rank several efficient solutions in a Pareto frontier and generate a consensual solution.

1. Introduction

Decision support systems (DSS) originated as important tools to aid decision-makers in business administration and industrial management in the 1960s [1]. DSS technologies were subsequently widely adopted in many other disciplinary areas, including natural resource management, in which DSS had become widespread by the mid-1980s [2]. Spatial DSS in particular began evolving in the late 1990s, coinciding with significant advances in geographic information systems (GIS) and computing power in this timeframe [3]. The Ecosystem Management Decision Support (EMDS) system was one of the earliest examples of a spatial DSS for environmental analysis and planning [4,5], but the system has steadily evolved since that time, and remains in wide use up to the present [6]. The EMDS system is an application framework for constructing DSS for integrated, multiscale analysis and planning [7]. It supports landscape-level analyses through logic and decision engines integrated with the ArcGIS® geographic information system (GIS, ArcGIS 10.5, 2017, Environmental Systems Research Institute, Redlands, CA, USA), and the open source GIS systems QGIS, MapWindow, and DotSpatial.
The logic engine evaluates landscape data against a logic model designed in the NetWeaver Developer® system (NetWeaver2 Developer, 2017, Rules of Thumb, PA, USA) [8] to derive logic-based interpretations of complex ecosystem conditions, such as watershed conditions, wildfire potential, and landscape integrity. Logic modeling can be defined as a form of knowledge-based reasoning in which expert or tacit knowledge is used to construct a representation of how to think about and solve a problem [9]. In the EMDS context, in particular, logic is used to reason about the meaning of environmental states (e.g., given the data from the prescriptions on a management area, what can we infer about the score of each stand with respect to the criteria values for each nondominated solution?). EMDS decision models are built with Criterium DecisionPlus® (CDP, version 4.0, 2014, InfoHarvest, Seattle, WA, USA), which implements the Analytical Hierarchy Process (AHP; [10]), the Simple Multi-Attribute Rating Technique (SMART; [11]), or their combination. The AHP belongs to the general class of multicriteria decision models (MCDMs; [12]), while SMART derives from the closely related field of multiattribute utility theory (MAUT; [13]). Engines that implement Multi-Criteria Decision Methods (MCDM) solutions in particular have become increasingly common in contemporary DSS architectures for environmental decision support, beginning in about 1995, either as stand-alone MCDM solutions or as MCDM components of larger systems such as EMDS. In contrast, the use of engines that implement formal logic in environmental decision support is less common in contemporary systems. The latter have often been built by encapsulating growth and yield models and management planning methods rather than logic approaches [14]. However, logic processing has remained at the core of EMDS functionality since 1995 because of its capability to model the relatively large, complex, and often abstract problems associated with decision support for ecosystem management and adaptive management [6].
On the other hand, the web-based DSS SADfLOR builds from the experience of developing decision support systems to enhance forestry and natural resource management planning [15,16,17]. Its modular structure encompasses an information management module that encapsulates a web GIS and that is instrumental to organize administrative, geographic, and inventory forestry data. A simulation module projects the forest over time according to management options defined by stakeholders. It generates the management problem decision space. The latter is translated into a resource capability model by a matrix generator submodule. Decision-makers and stakeholders may input information that is translated into policy models (e.g., constraints on ecosystem services flows). An optimization module brings together the resource capability and the policy models. This module may be used to generate a solution to the management-planning problem by an a priori preference modeling multiple-criteria approach (e.g., goal programming). It may be used further to provide stakeholders and decision-makers with information about trade-offs between ecosystem services and trigger the application of an a posteriori preference modeling a multiple-criteria method (e.g., Pareto frontier). In this case, decision-makers can interact with the Pareto frontier submodule, analyze trade-offs, and select various nondominated solutions according to their preferences. In contexts characterized by multiple decision-makers, this submodule may be used to facilitate negotiation and consensus building (e.g., as seen in Reference [18]). Nevertheless, diverse and conflicting preferences and objectives suggest the potential of combining the multiple-criteria functionality of both the web-based SADfLOR and CDP and NetWeaver to further enhance the negotiation of solutions.
A multicriteria decision problem involves choosing one among various nondominated alternatives on how well those alternatives rate against a chosen set of structured criteria [19]. Thus, CDP and NetWeaver as multicriteria DSS can be used to compare the performance of multiple alternative solutions following a predefined model with criteria values resulting from the optimization process of SADfLOR. Both knowledge-based DSS are useful to solve this problem. NetWeaver is based on fuzzy logic networks that are well suited as logic frameworks for integrating model results from various analytical systems, such as simulators, linear programs, Bayesian belief networks, and production-rule systems [20]. On the other hand, CDP provides extensive support for implementing this decision process, including setting priorities, explaining the derivation of conclusions, checking model robustness, and providing trade-off analyses. The criteria are weighted in terms of importance to the decision-maker and, in the end, after the evaluation by the model, the alternatives are ordered by their decision scores as a prioritized ranking of alternatives by preference [19].
In the present study, we describe the use of a combination of decision support approaches encapsulated in the EMDS and the web-based SADfLOR systems to recommend optimal selections of alternative management combinations in the study area. Firstly, we use a spatially explicit multiple-criteria method within SADfLOR to generate both the decision space and the criteria space of the management-planning problem. This decision approach presents ecosystem services trade-off information in the form of Pareto frontiers to support the negotiation of alternative bundles of ecosystem services In the first aspatial phase of the analysis, we use the CDP component of EMDS to support further this negotiation by performing a multicriteria decision analysis (MCDA) that assesses the aggregate performance of selected points on the Pareto frontier for the study area as a whole. In the second spatial phase of the analysis, the NetWeaver component of EMDS is used to recommend selection of specific points on the Pareto frontier in specific landscape units of the study area. In the discussion, we conclude by considering the advantages and complexities of employing a hybrid DSS such as EMDS/SADfLOR to realize the potential of the combination of the decision approaches to support collaborative forest ecosystem management planning.

2. Materials and Methods

2.1. Study Area

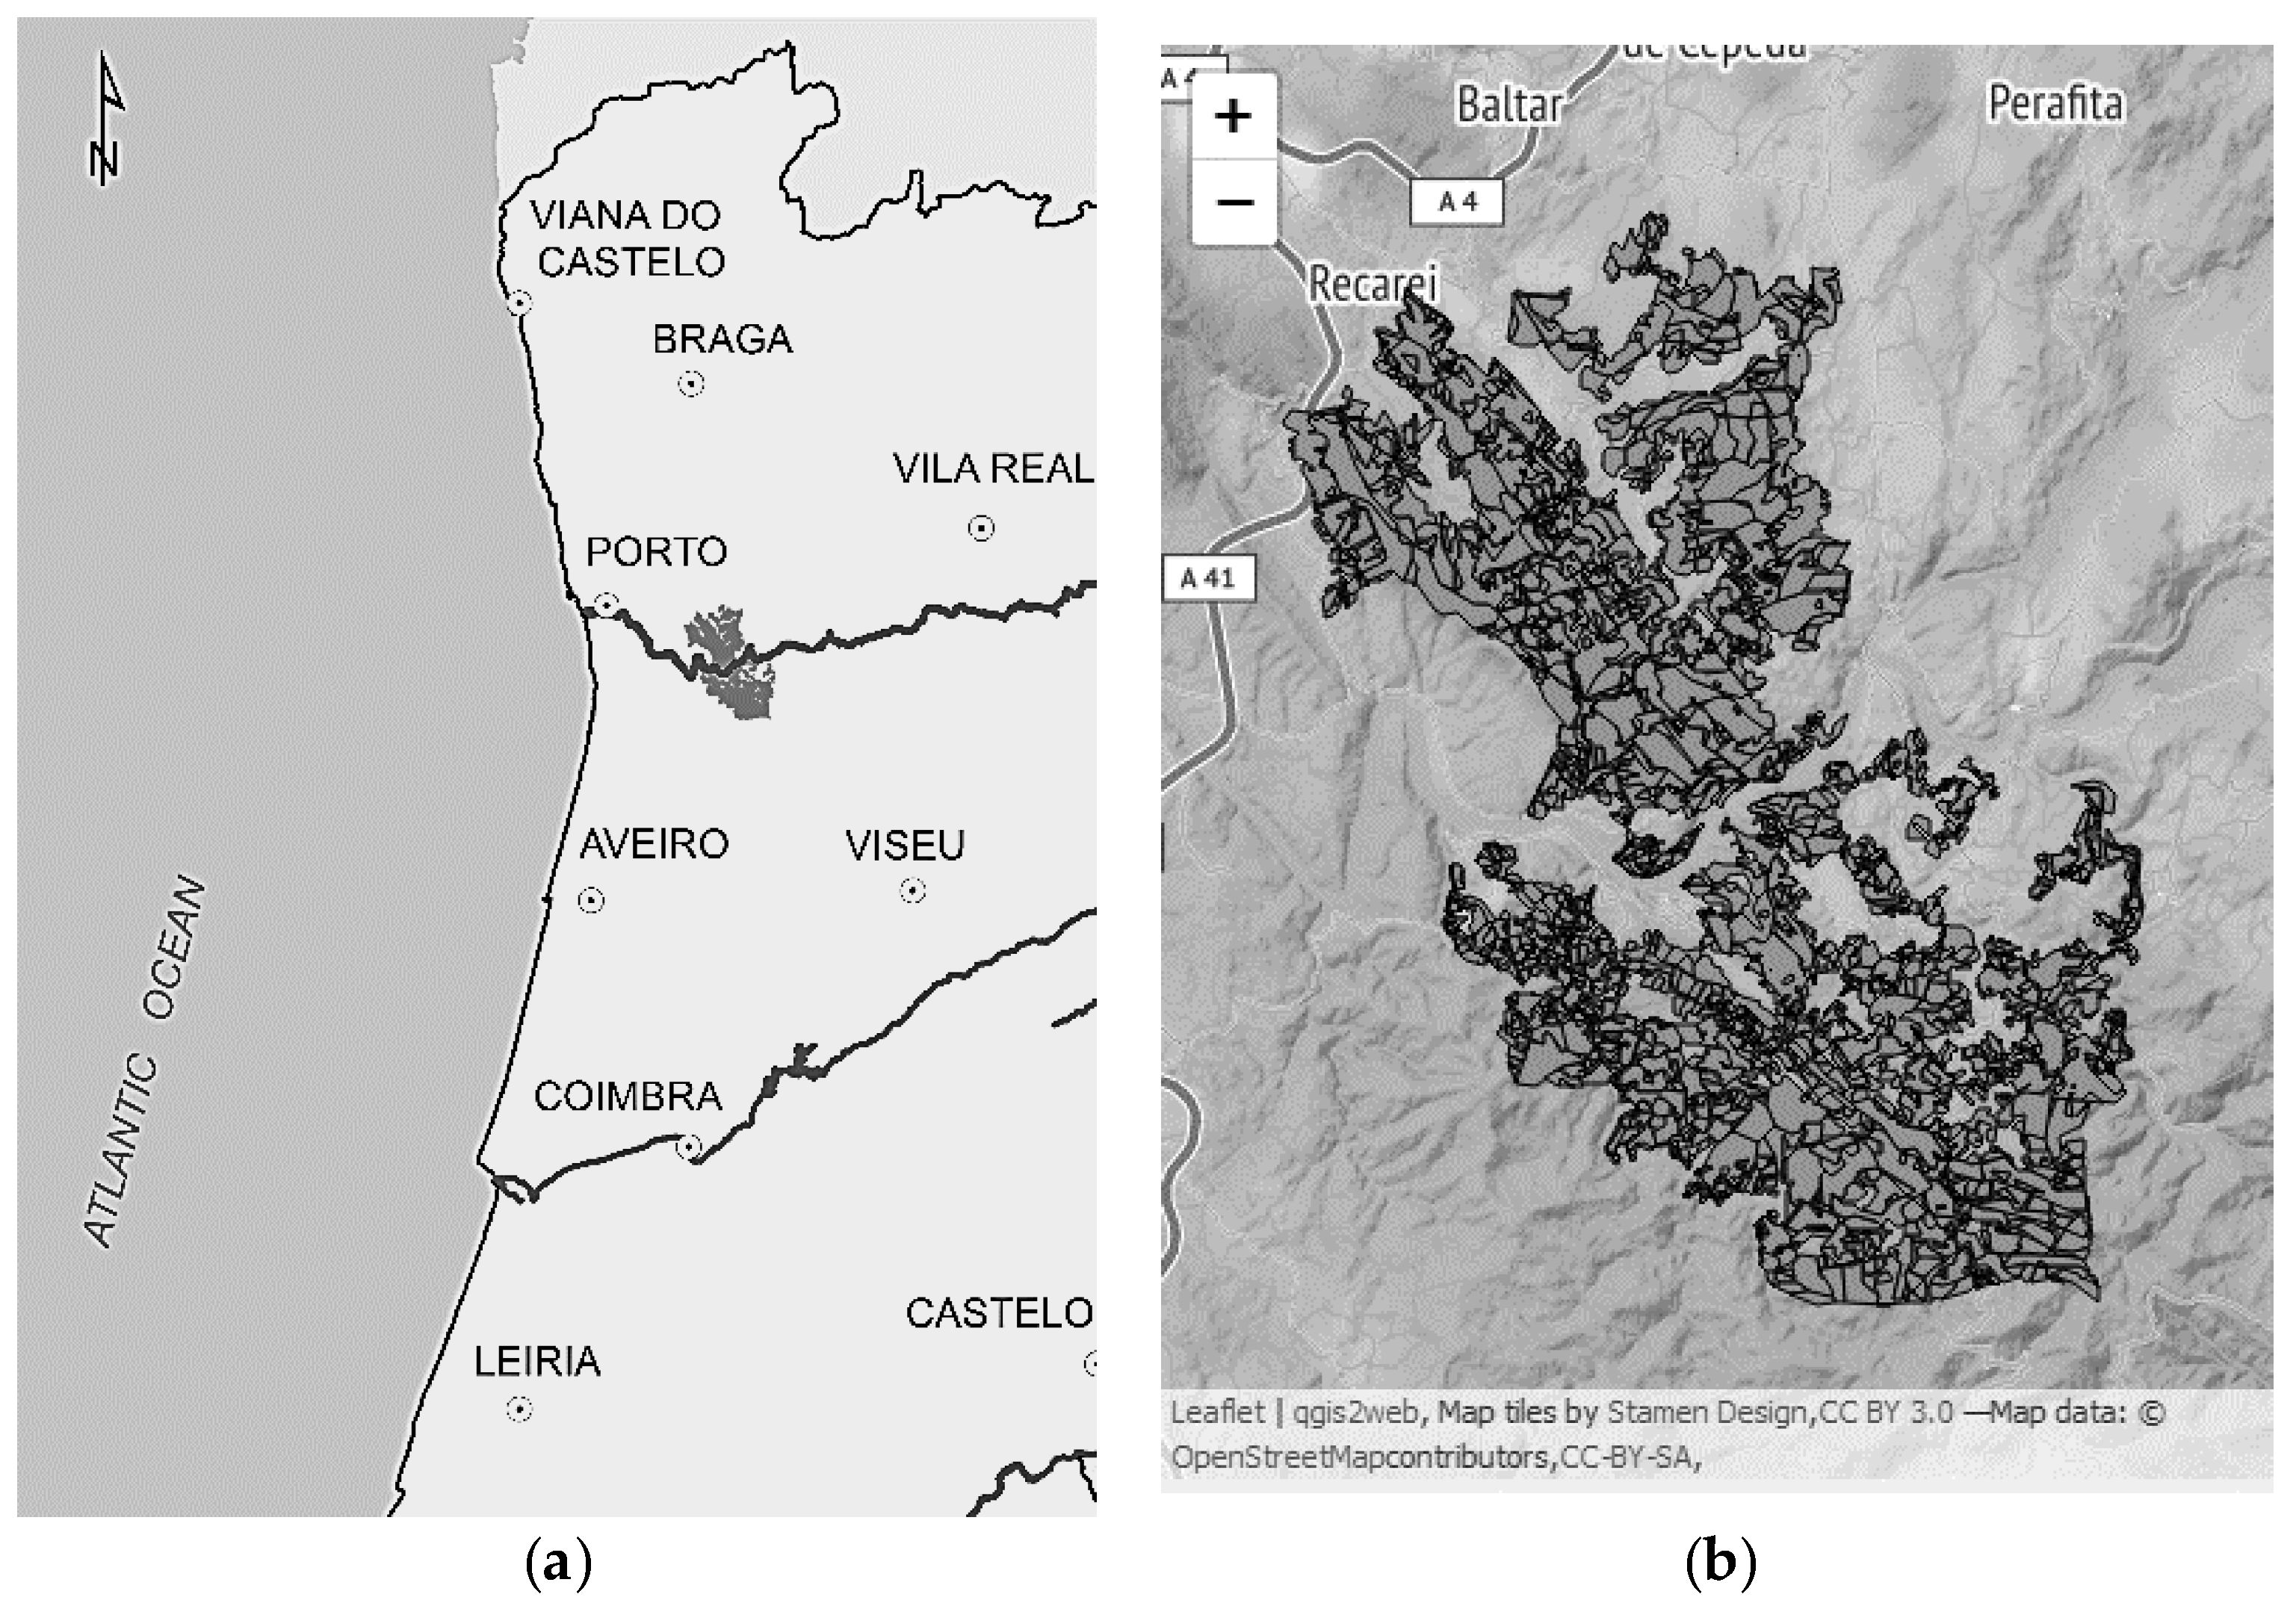
For this study, we considered the Zonas de Intervenção Florestal (ZIF) Paiva and Entre-Douro e Sousa (ZIF_VS), located in northwestern Portugal (Figure 1). The maximum elevation reaches about 700 m, yearly average temperatures range between 10 °C and 15 °C, and the main soil types are anthrosols, leptosols, and regosols. It spans three counties (Castelo de Paiva, Penafiel, and Paredes), covering an area of about 14,388 ha, and it is classified into 1976 stands for forest management purposes. The area is dominated by pure eucalypt (Eucalyptus globulus Labill) stands and mixed stands of eucalypt and maritime pine (Pinus pinaster Ait.)—about 66% and 33% of the ZIF_VS area, respectively, and hardwoods (mainly chestnut in 1% of the case study area). Community (local parish) property accounts for 35% of the ZIF_VS area. Medium and large private properties (area greater than 5 ha) extend over 60% of the ZIF_VS area. The remaining 5% is owned by small or very small forest owners [19]. The stands are managed by each landowner with the support of the Local Forest Owners Association that is responsible for the development of the joint landscape-level management plan. The most important products are eucalypt pulpwood and maritime pine sawlogs, but the range of ecosystem services includes further hardwood (chestnut) sawlogs, carbon sequestration, and biodiversity. ZIF Paiva stands belong to 185 associated landowners, while ZIF_VS has 191 associated landowners. The web-based SADfLOR DSS has evolved with the involvement and participation of several stakeholders, ranging from the Instituto da Conservação da Natureza e das Florestas (ICNF), to the forest industry and nongovernmental organizations (e.g., forest owners associations) [15,21]. It was used to simulate all ZIF_VS stand-level prescriptions (59,133) over a 90-year planning horizon.

2.2. Overview of Decision Tools and Analytical Steps

In this work, we focused on the integrated application of three decision support approaches encapsulated in two DSS. The decision support approaches were: a multiple-criteria Pareto frontier method available in the web-based SADfLOR DSS, an aspatial strategic MCDA method available in the Criterium DecisionPlus (CDP) component of the EMDS DSS, and a spatial logic-based approach available in the NetWeaver component of EMDS.
The web-based tool encapsulates a multicriteria mathematical programming model and displays the trade-offs between ecosystem services in the form of Pareto frontiers. This analysis supports the selection of packages of ecosystem services according to the preferences of decision-makers. For that purpose, the ecosystem services are classified by the tool into two sets of criteria. The first includes wood products (e.g., total wood), while the second includes nonwood products as well as nonmarket services (e.g., biodiversity). The interface of the web-based tool asks the decision maker whether the provision of each ecosystem service (criteria) is to be maximized or minimized. After the selection by decision-makers of the list of ecosystem services to maximize or minimize in the bundle, the tool launches the process for generating the Pareto frontiers (e.g., as in References [22,23]). This information provides a basis for the negotiation of the packages of ecosystem services to be supplied by the decision-makers [18]. These packages correspond to nondominated points in the Pareto frontier. After its selection, the web-based tool triggers the solution of the multicriteria mathematical programming problem associated to each point, i.e., it retrieves the management plan that may convey the corresponding package of services.
In this study, an aspatial strategic MCDA in CDP and a spatial logic-based approach in NetWeaver were both used to choose the best nondominated solution among a set of alternatives generated by the Pareto frontier tool in SADfLOR. CDP is an MCDA DSS that is useful for ranking alternatives based on how well each rates against a set of decision criteria [24]. CDP implements both the analytic hierarchy process (AHP; [10,25]) and SMART [11] techniques. We use the AHP method to derive weights on criteria and subcriteria by the pair-wise comparison technique, but we use SMART to score the performance of the attributes of alternatives. The combined use of AHP and SMART offers the advantage of eliminating, or at least greatly reducing, the well-known problem of rank reversal of alternatives in the classic AHP approach, in which scores on attributes of alternatives are derived by pair-wise comparisons [24]. NetWeaver provides a logic-based framework that is useful to evaluate the conflicting alternative solutions chosen by different (groups of) decision-makers. It has two features with respect to the learning process: NetWeaver models provide detailed, permanent documentation about how we conceive that a system should be evaluated, and the modular architecture of logic models is well suited to the incremental, evolutionary adaptation of the models as knowledge changes [
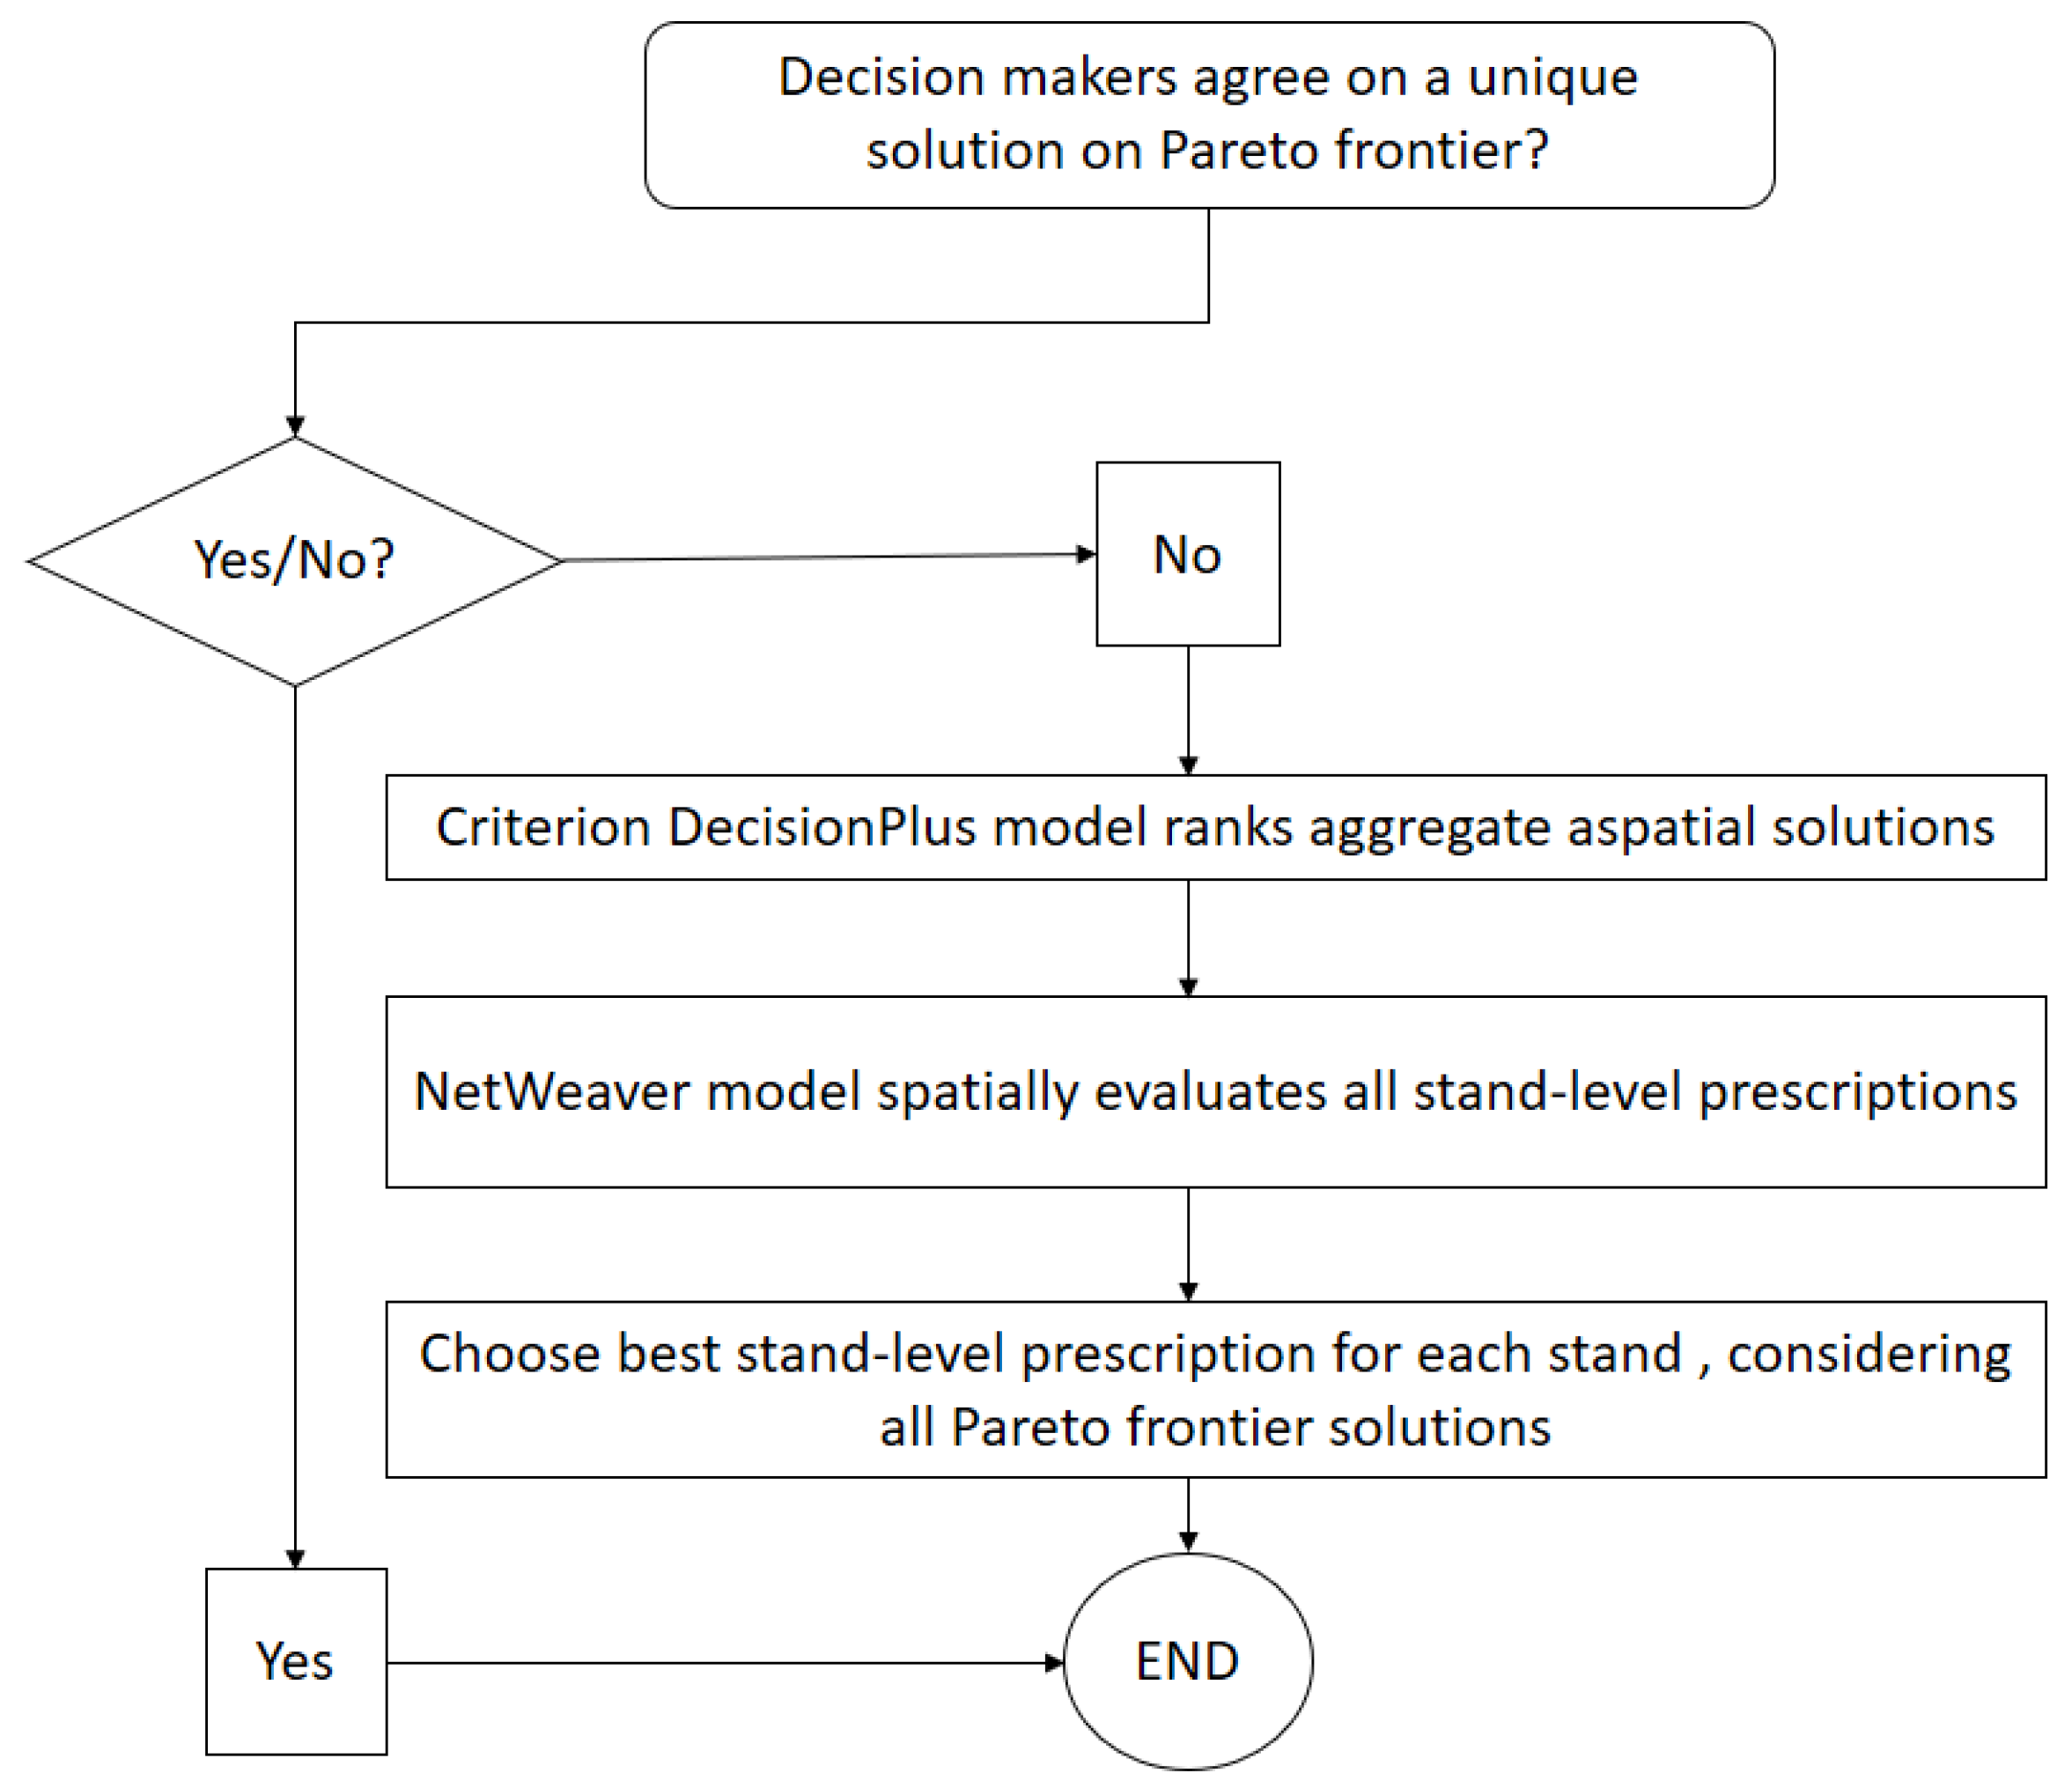
24]. The overall analysis was performed in three steps:
  • Generation of the criteria space and selection of six alternative points on the Pareto frontier for subsequent analysis.
  • Aspatial multiple-criteria decision analysis of the aggregate performance of points on the Pareto frontier for the entire study region.
  • Spatial logic-based assessment of points on the Pareto frontier for individual stands of the study area.
Details of these three analytical steps are presented in the next three subsections and a flow chart of this methodology is provided (Figure 2).

2.3. The Criteria Space and the Pareto Frontier

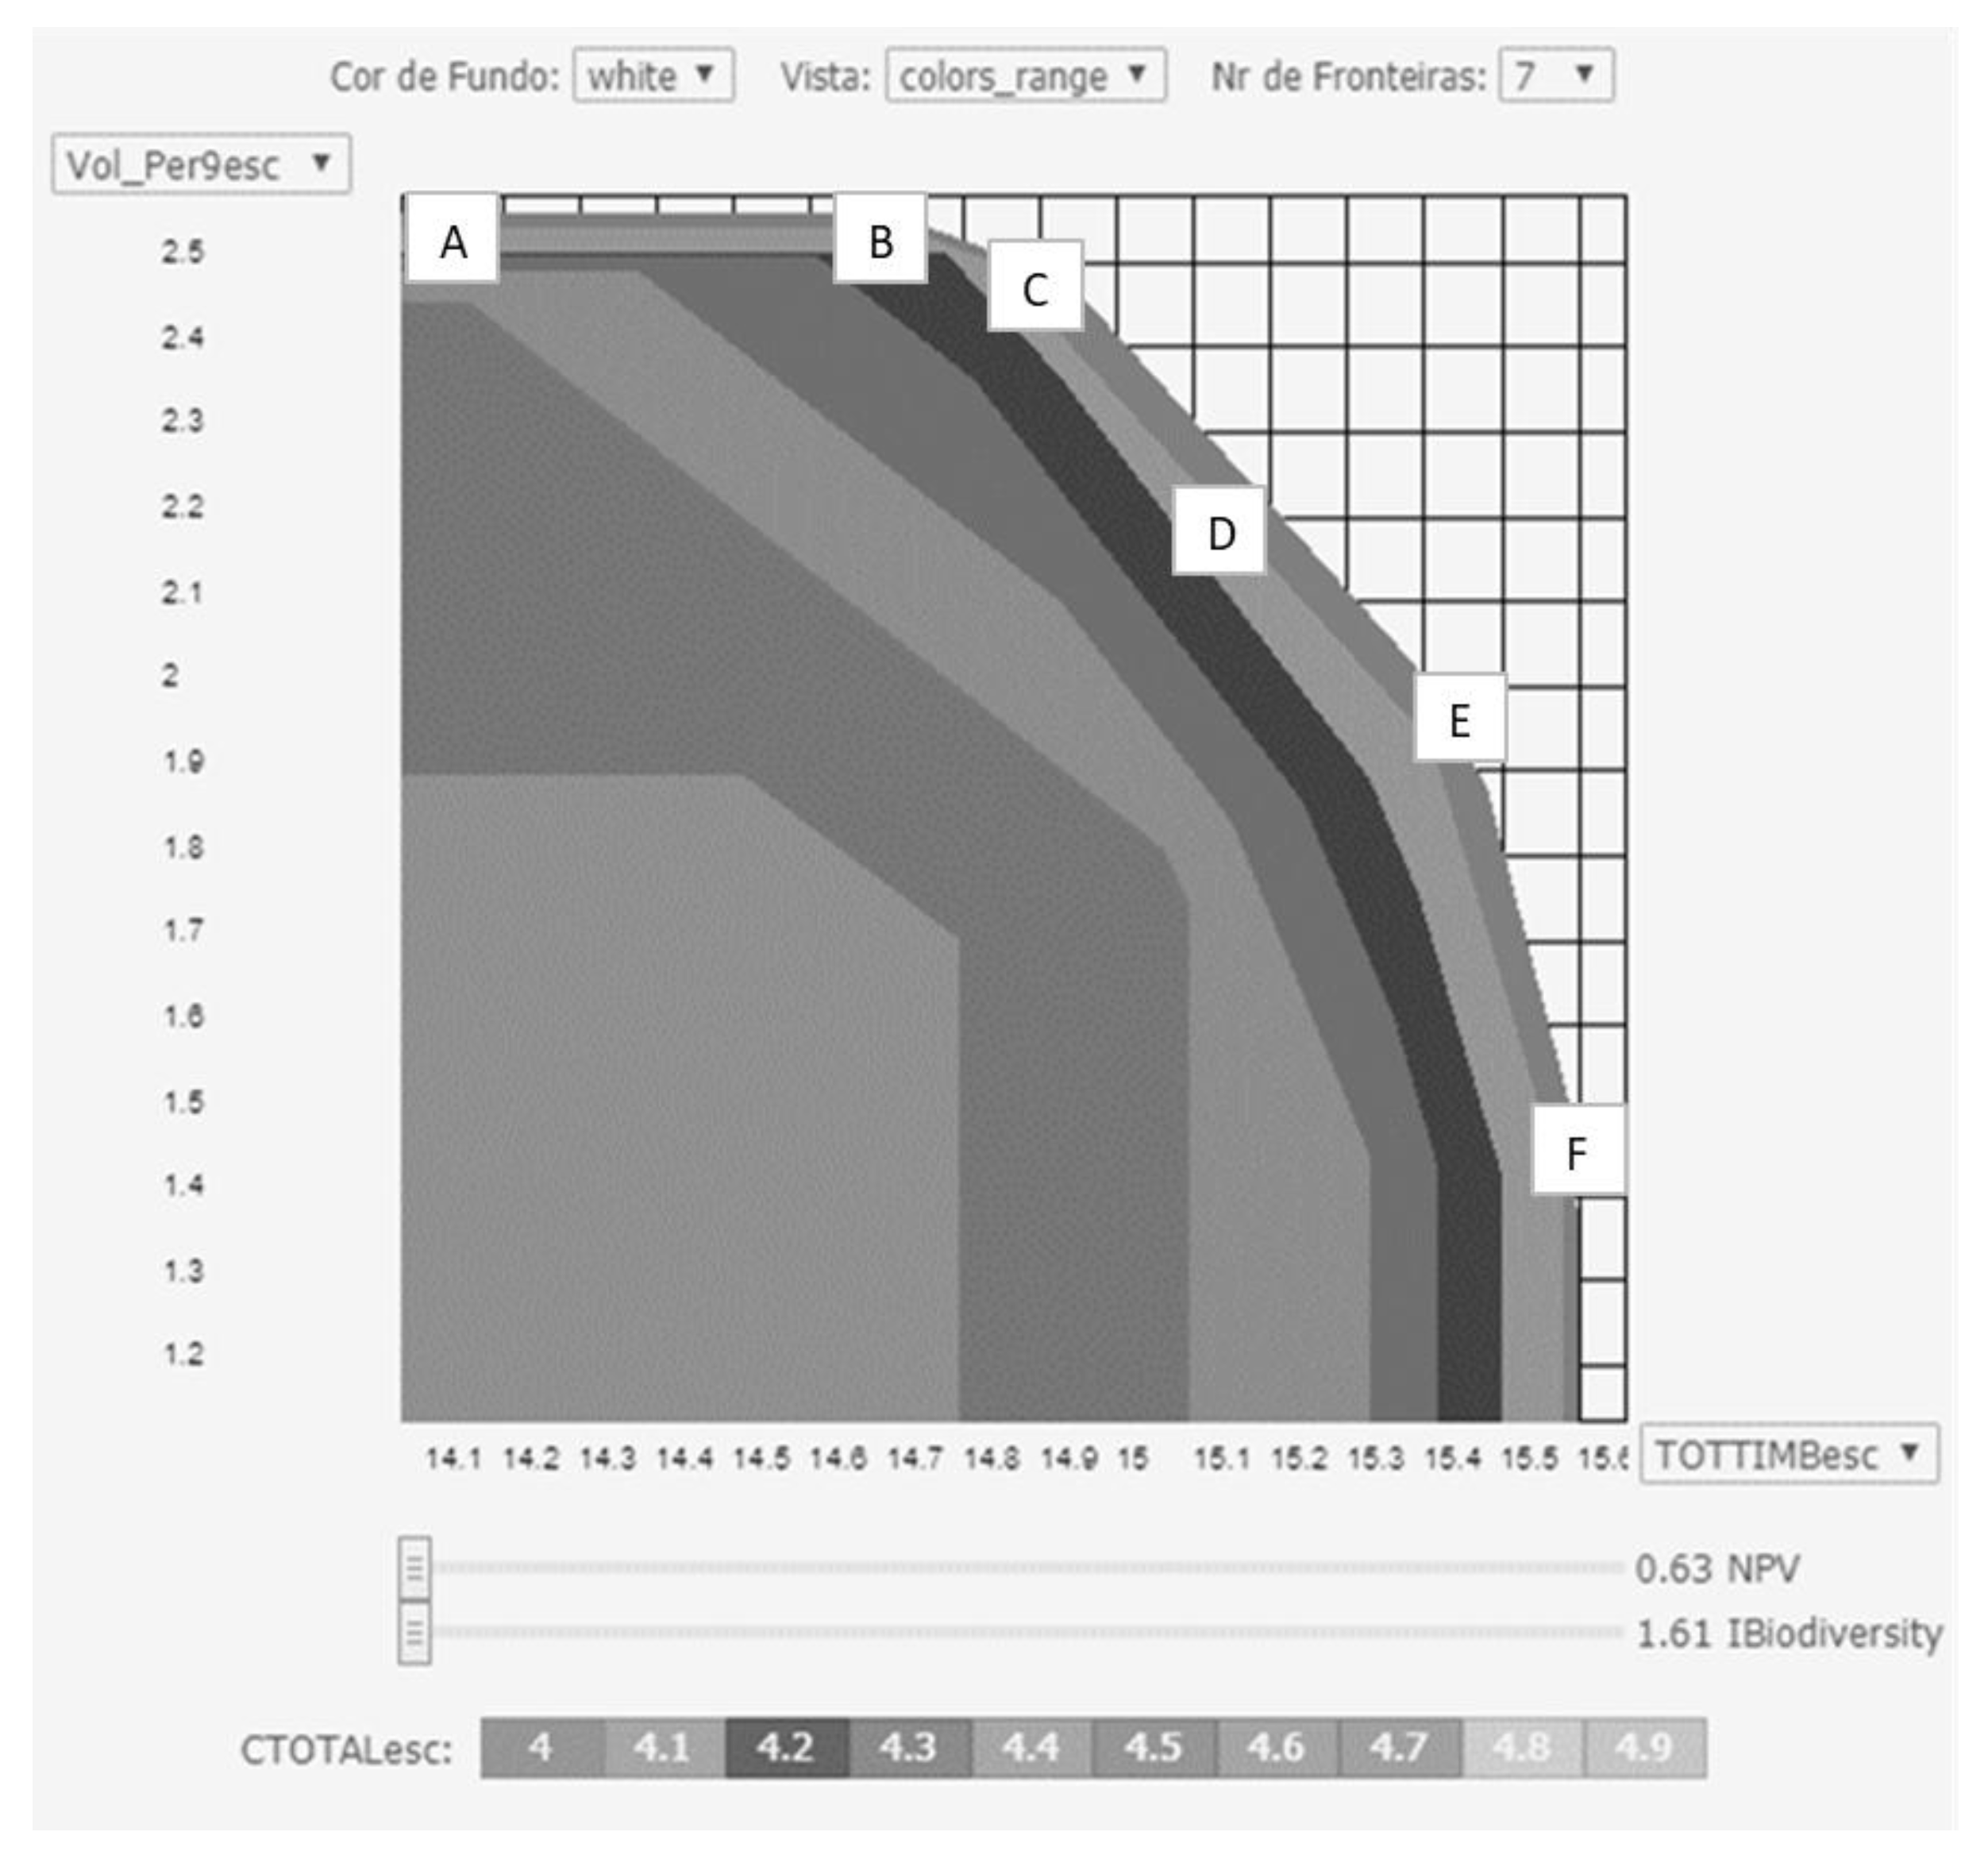
A multicriteria mathematical programming method within the web-based SADfLOR was used to define the forest management planning decision space. This was translated into the corresponding criteria space and Pareto frontiers by the interactive decision map technique. In this application, we emulated a negotiation process for the selection of six bundles of ecosystem services (six points in Pareto frontiers) for further analysis. The tool read this information and triggered the solution by the multicriteria mathematical programming method to find the corresponding six management plans.

2.4. Aspatial Multiple-Criteria Decision Analysis

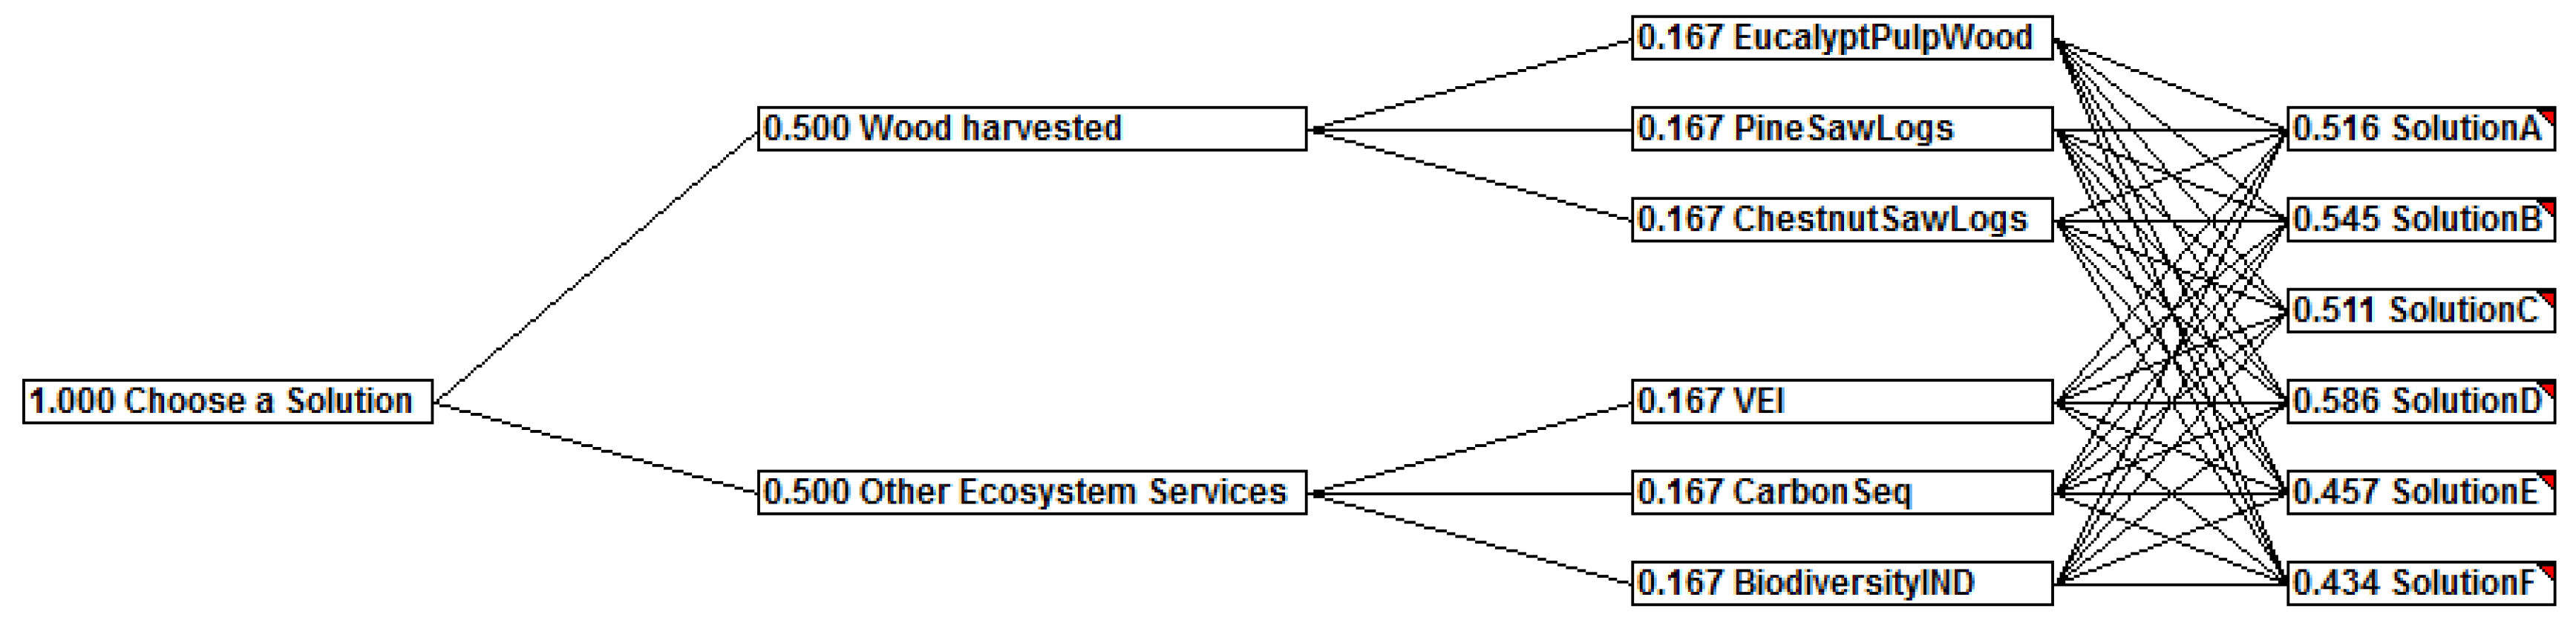
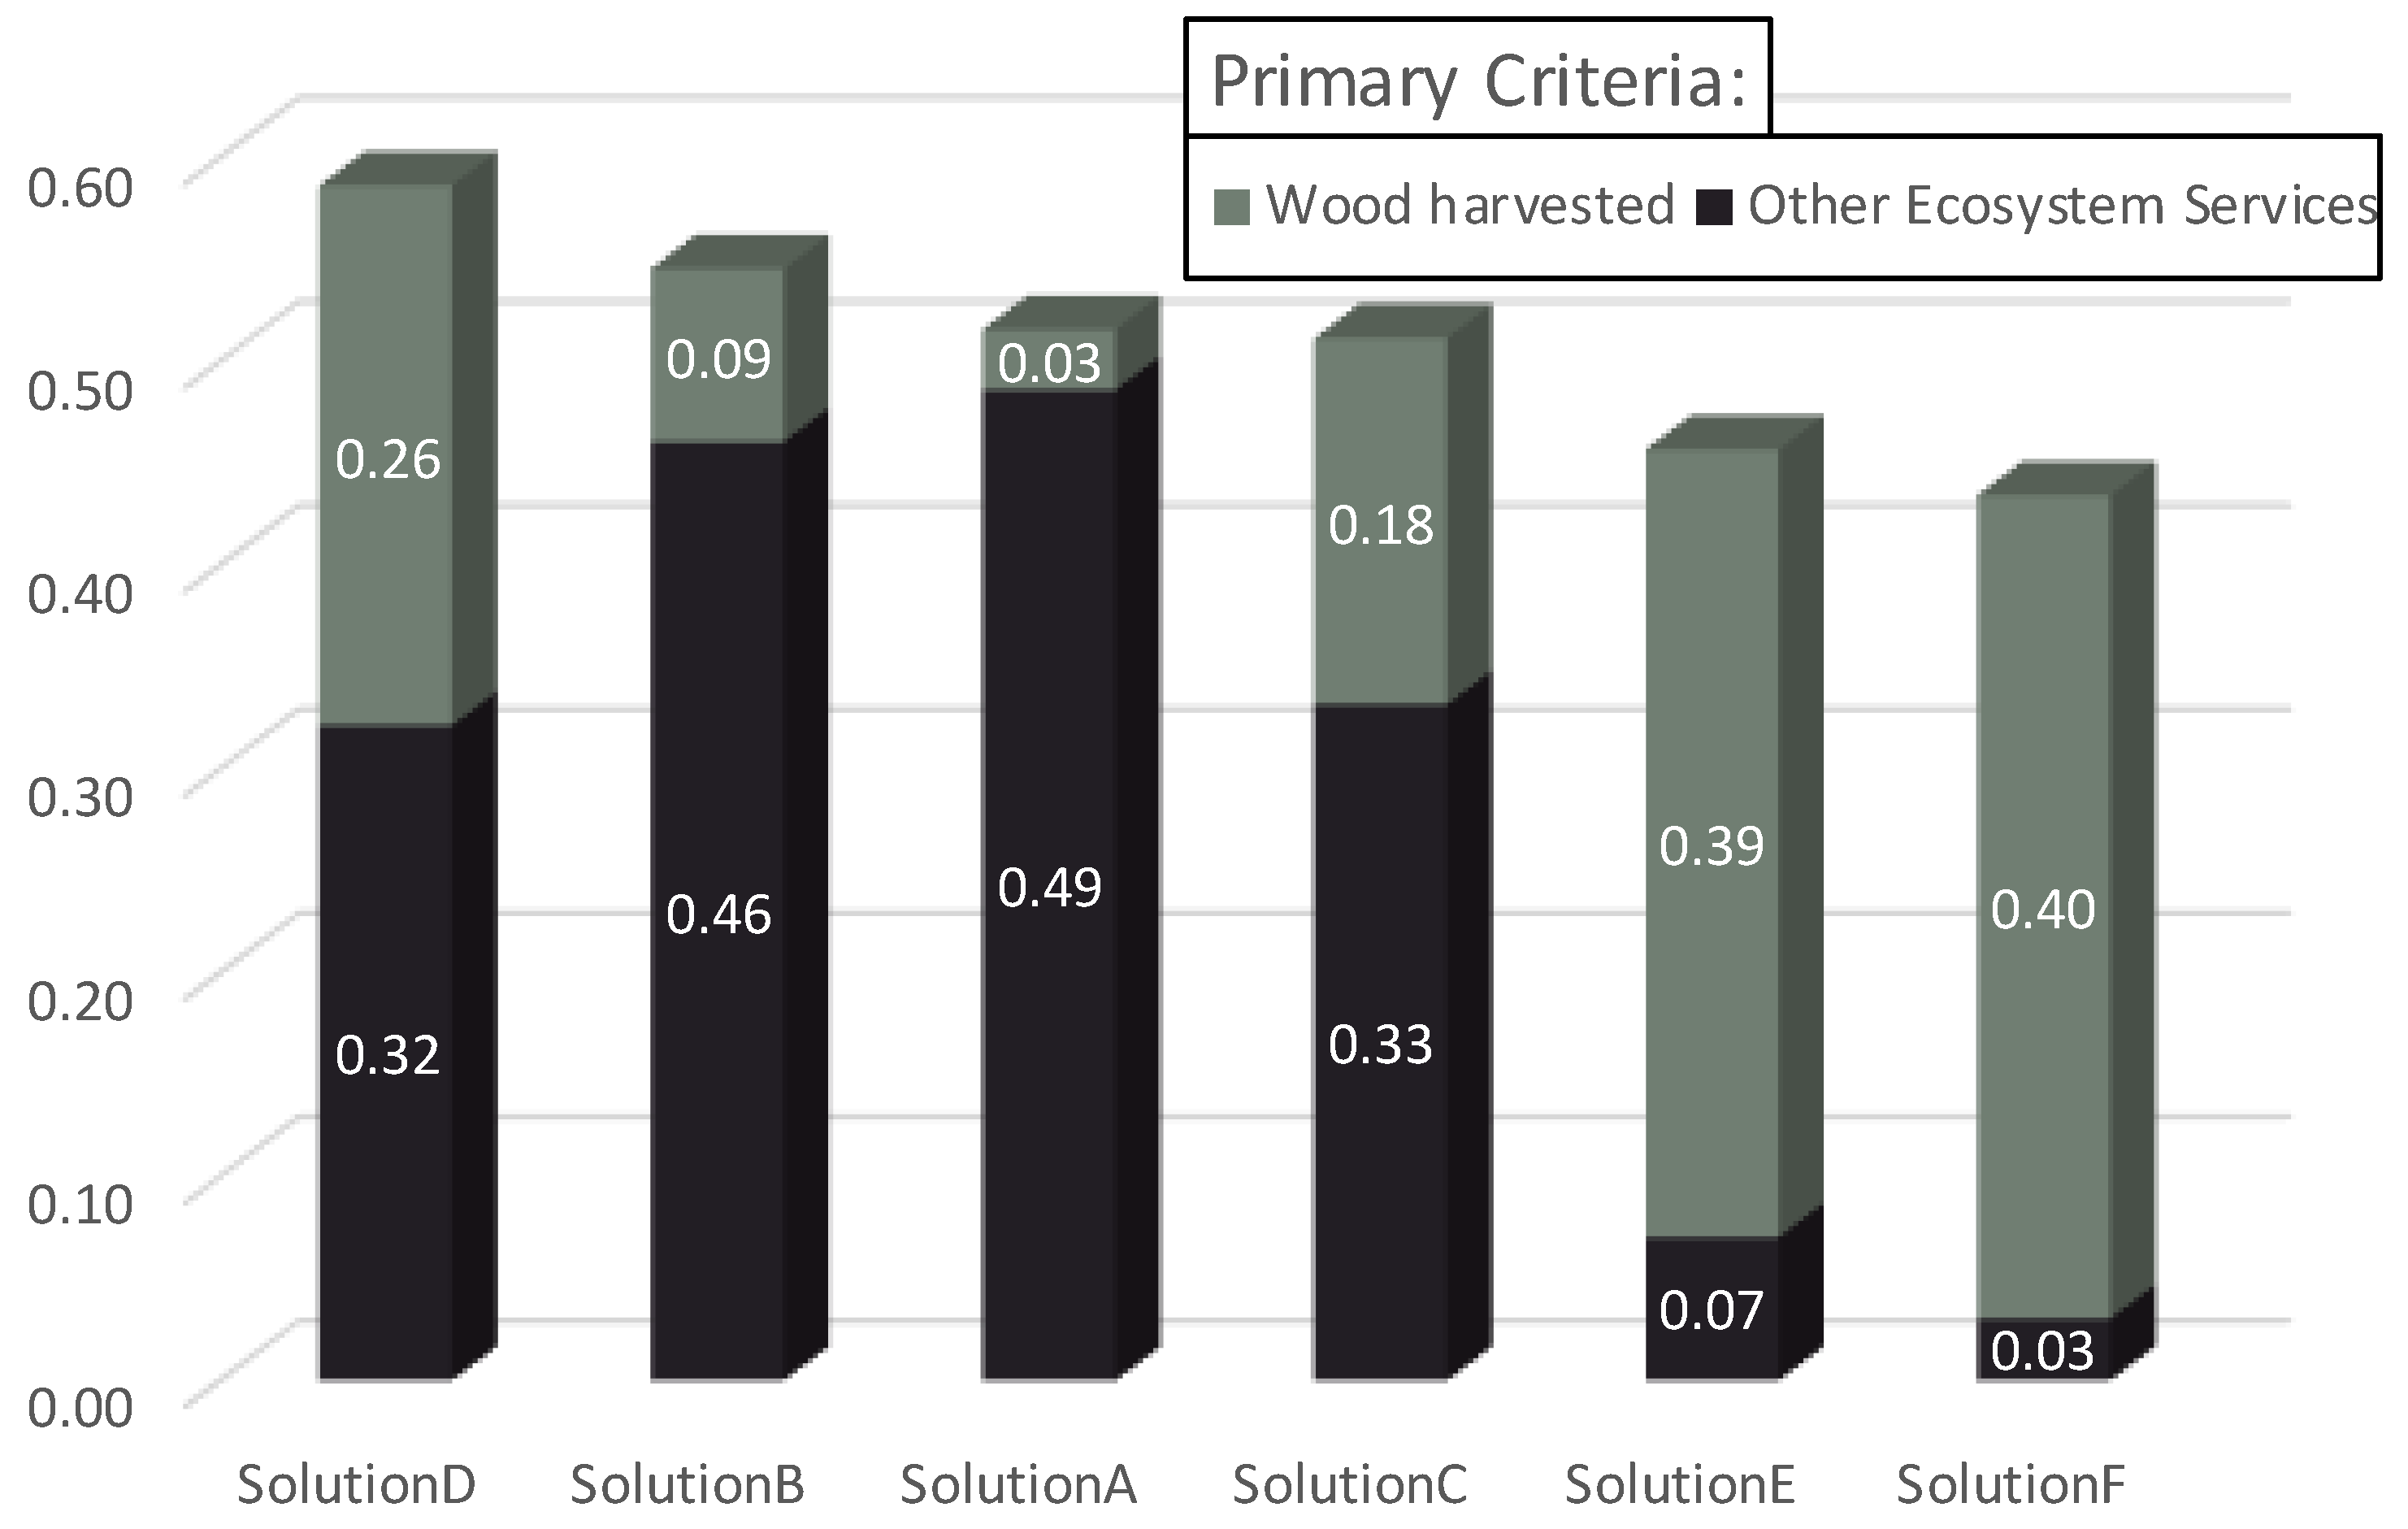
A multiple-criteria decision analysis model within the CDP component of EMDS was used to compare the performance of multiple points on the Pareto frontier with respect to criteria and weights determined by a decision-maker or group of decision-makers. In this aspatial model, we considered the same criteria used in the first analytical step, but with solution variables aggregated into two primary sets of criteria: Wood Harvested and Other Ecosystem Services. In practice, the criteria weights will vary individually by decision-maker or by consensus in the case of a group. However, for purposes of demonstration in this study, we assumed a consensus across all decision-makers, in which the primary criteria are equally weighted. The key analysis metric for CDP is a measure of utility that expresses the preference among Pareto points, given the weight assigned to the primary criteria in the CDP model. Note that this a classical strategic MCDA analysis in which the alternatives are the aggregate results summarized by alternative solution points on the Pareto frontier.

2.5. Spatial Logic-Based Assessment of Points on the Pareto Frontier for Individual Stands

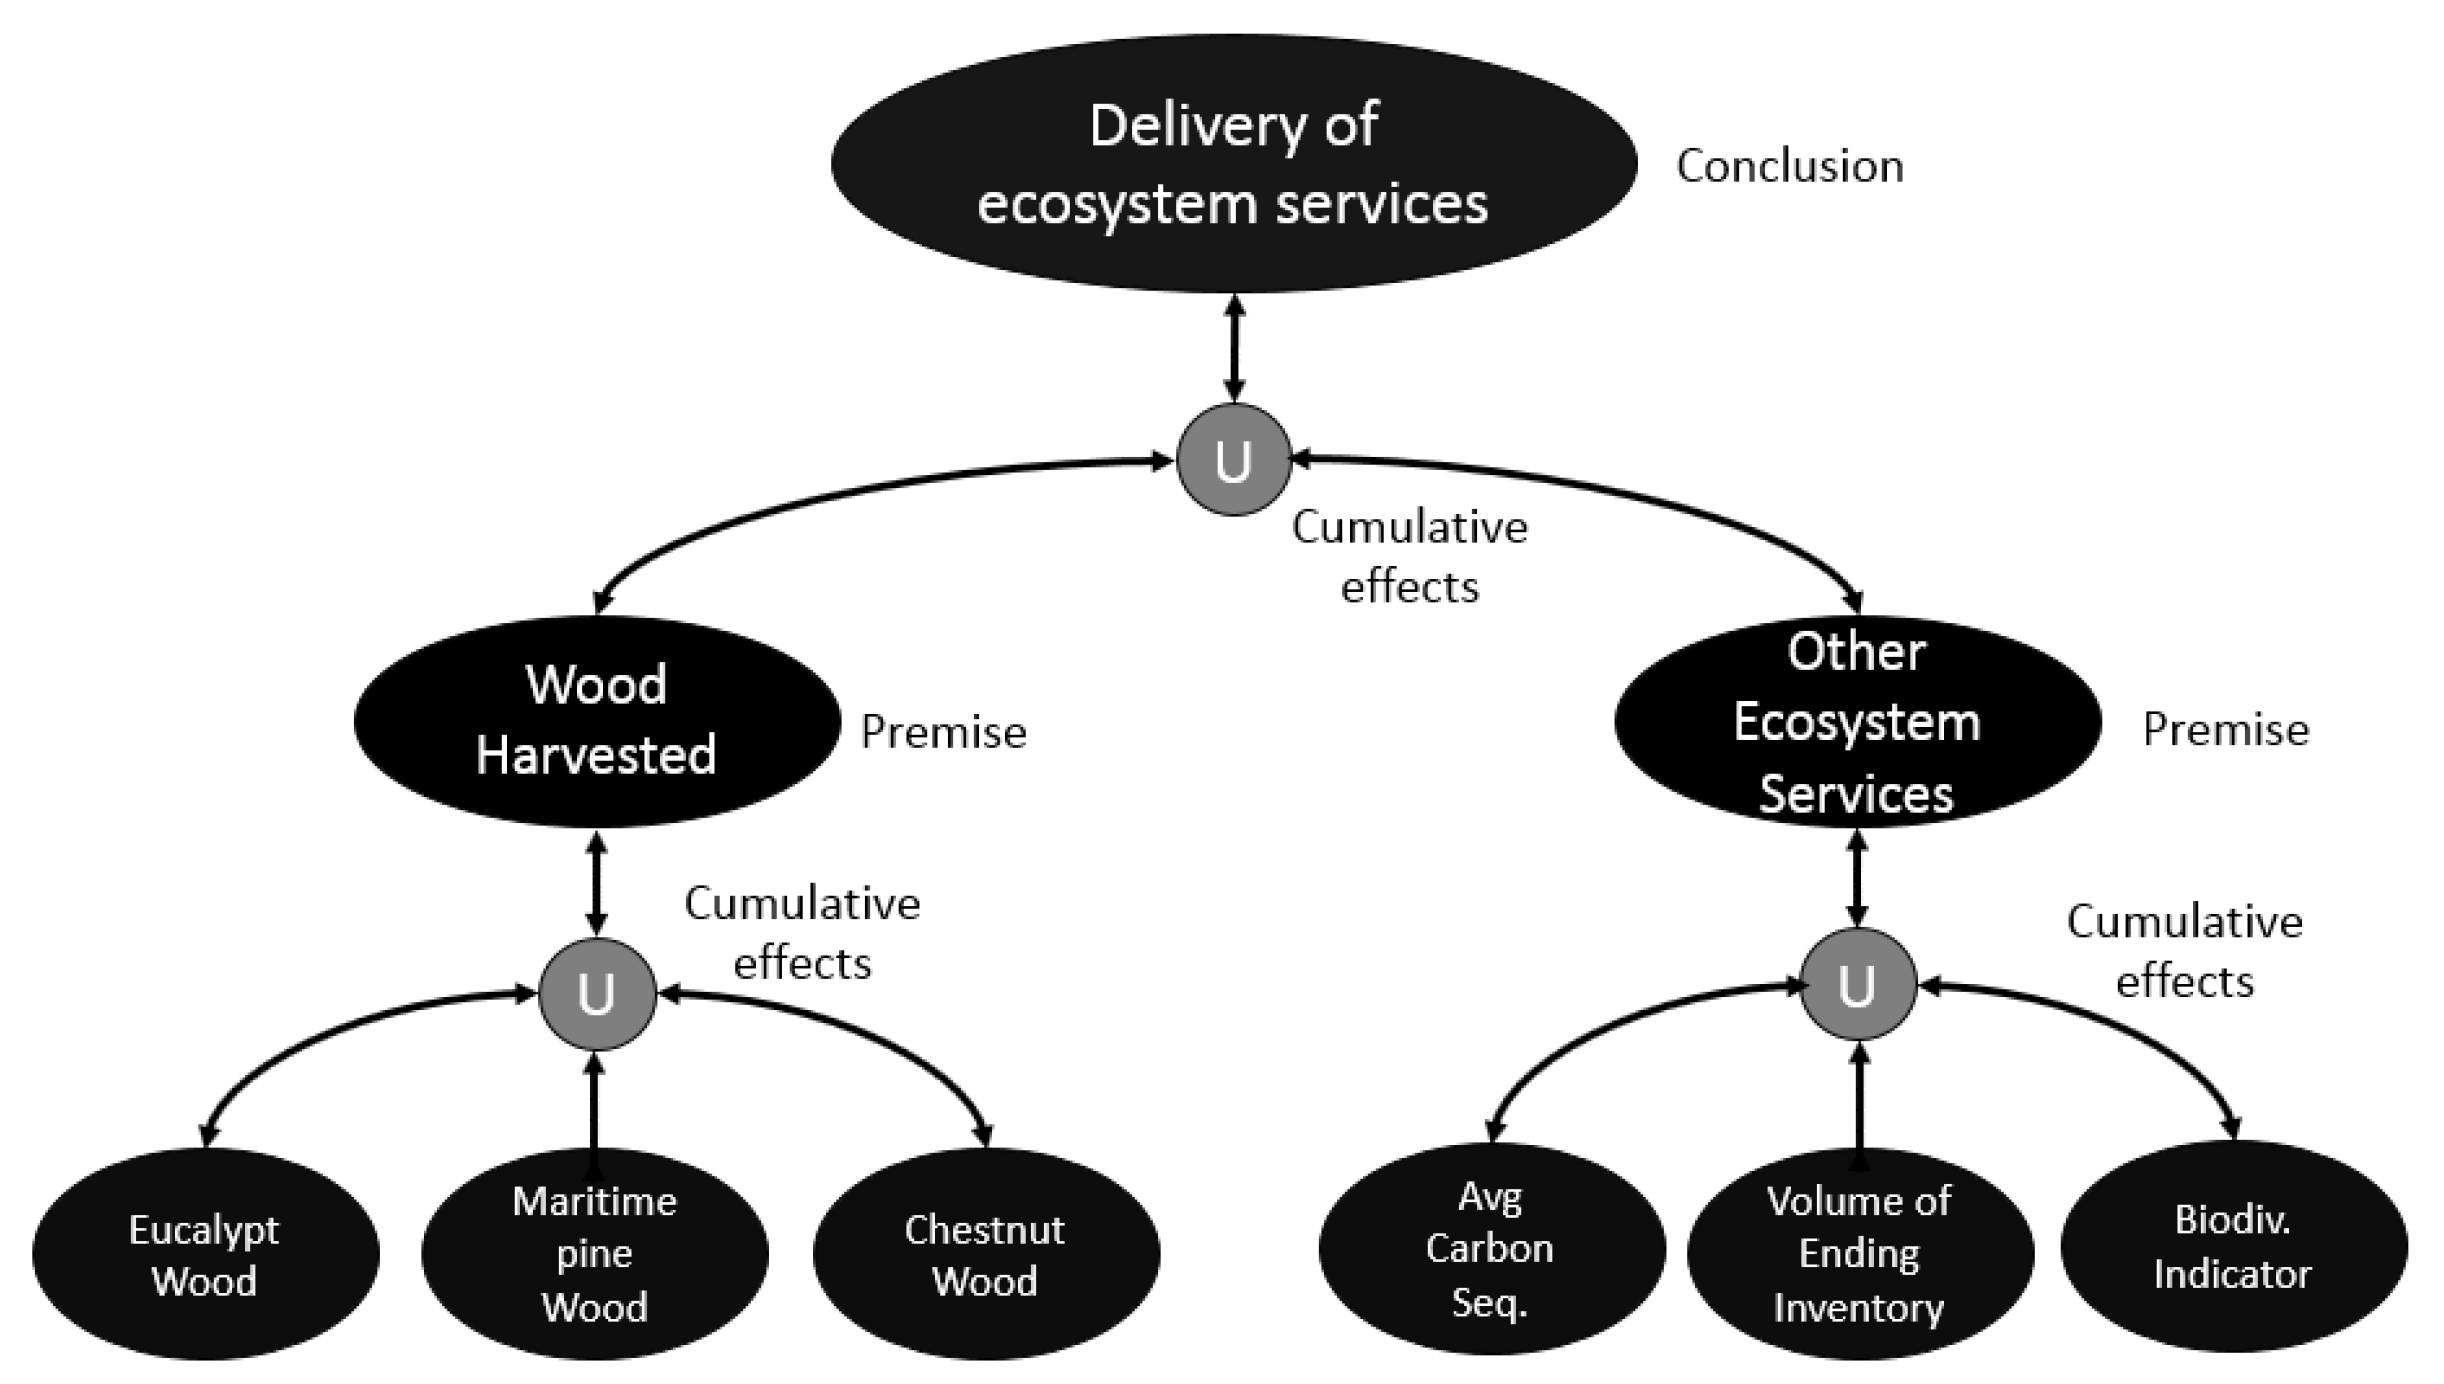
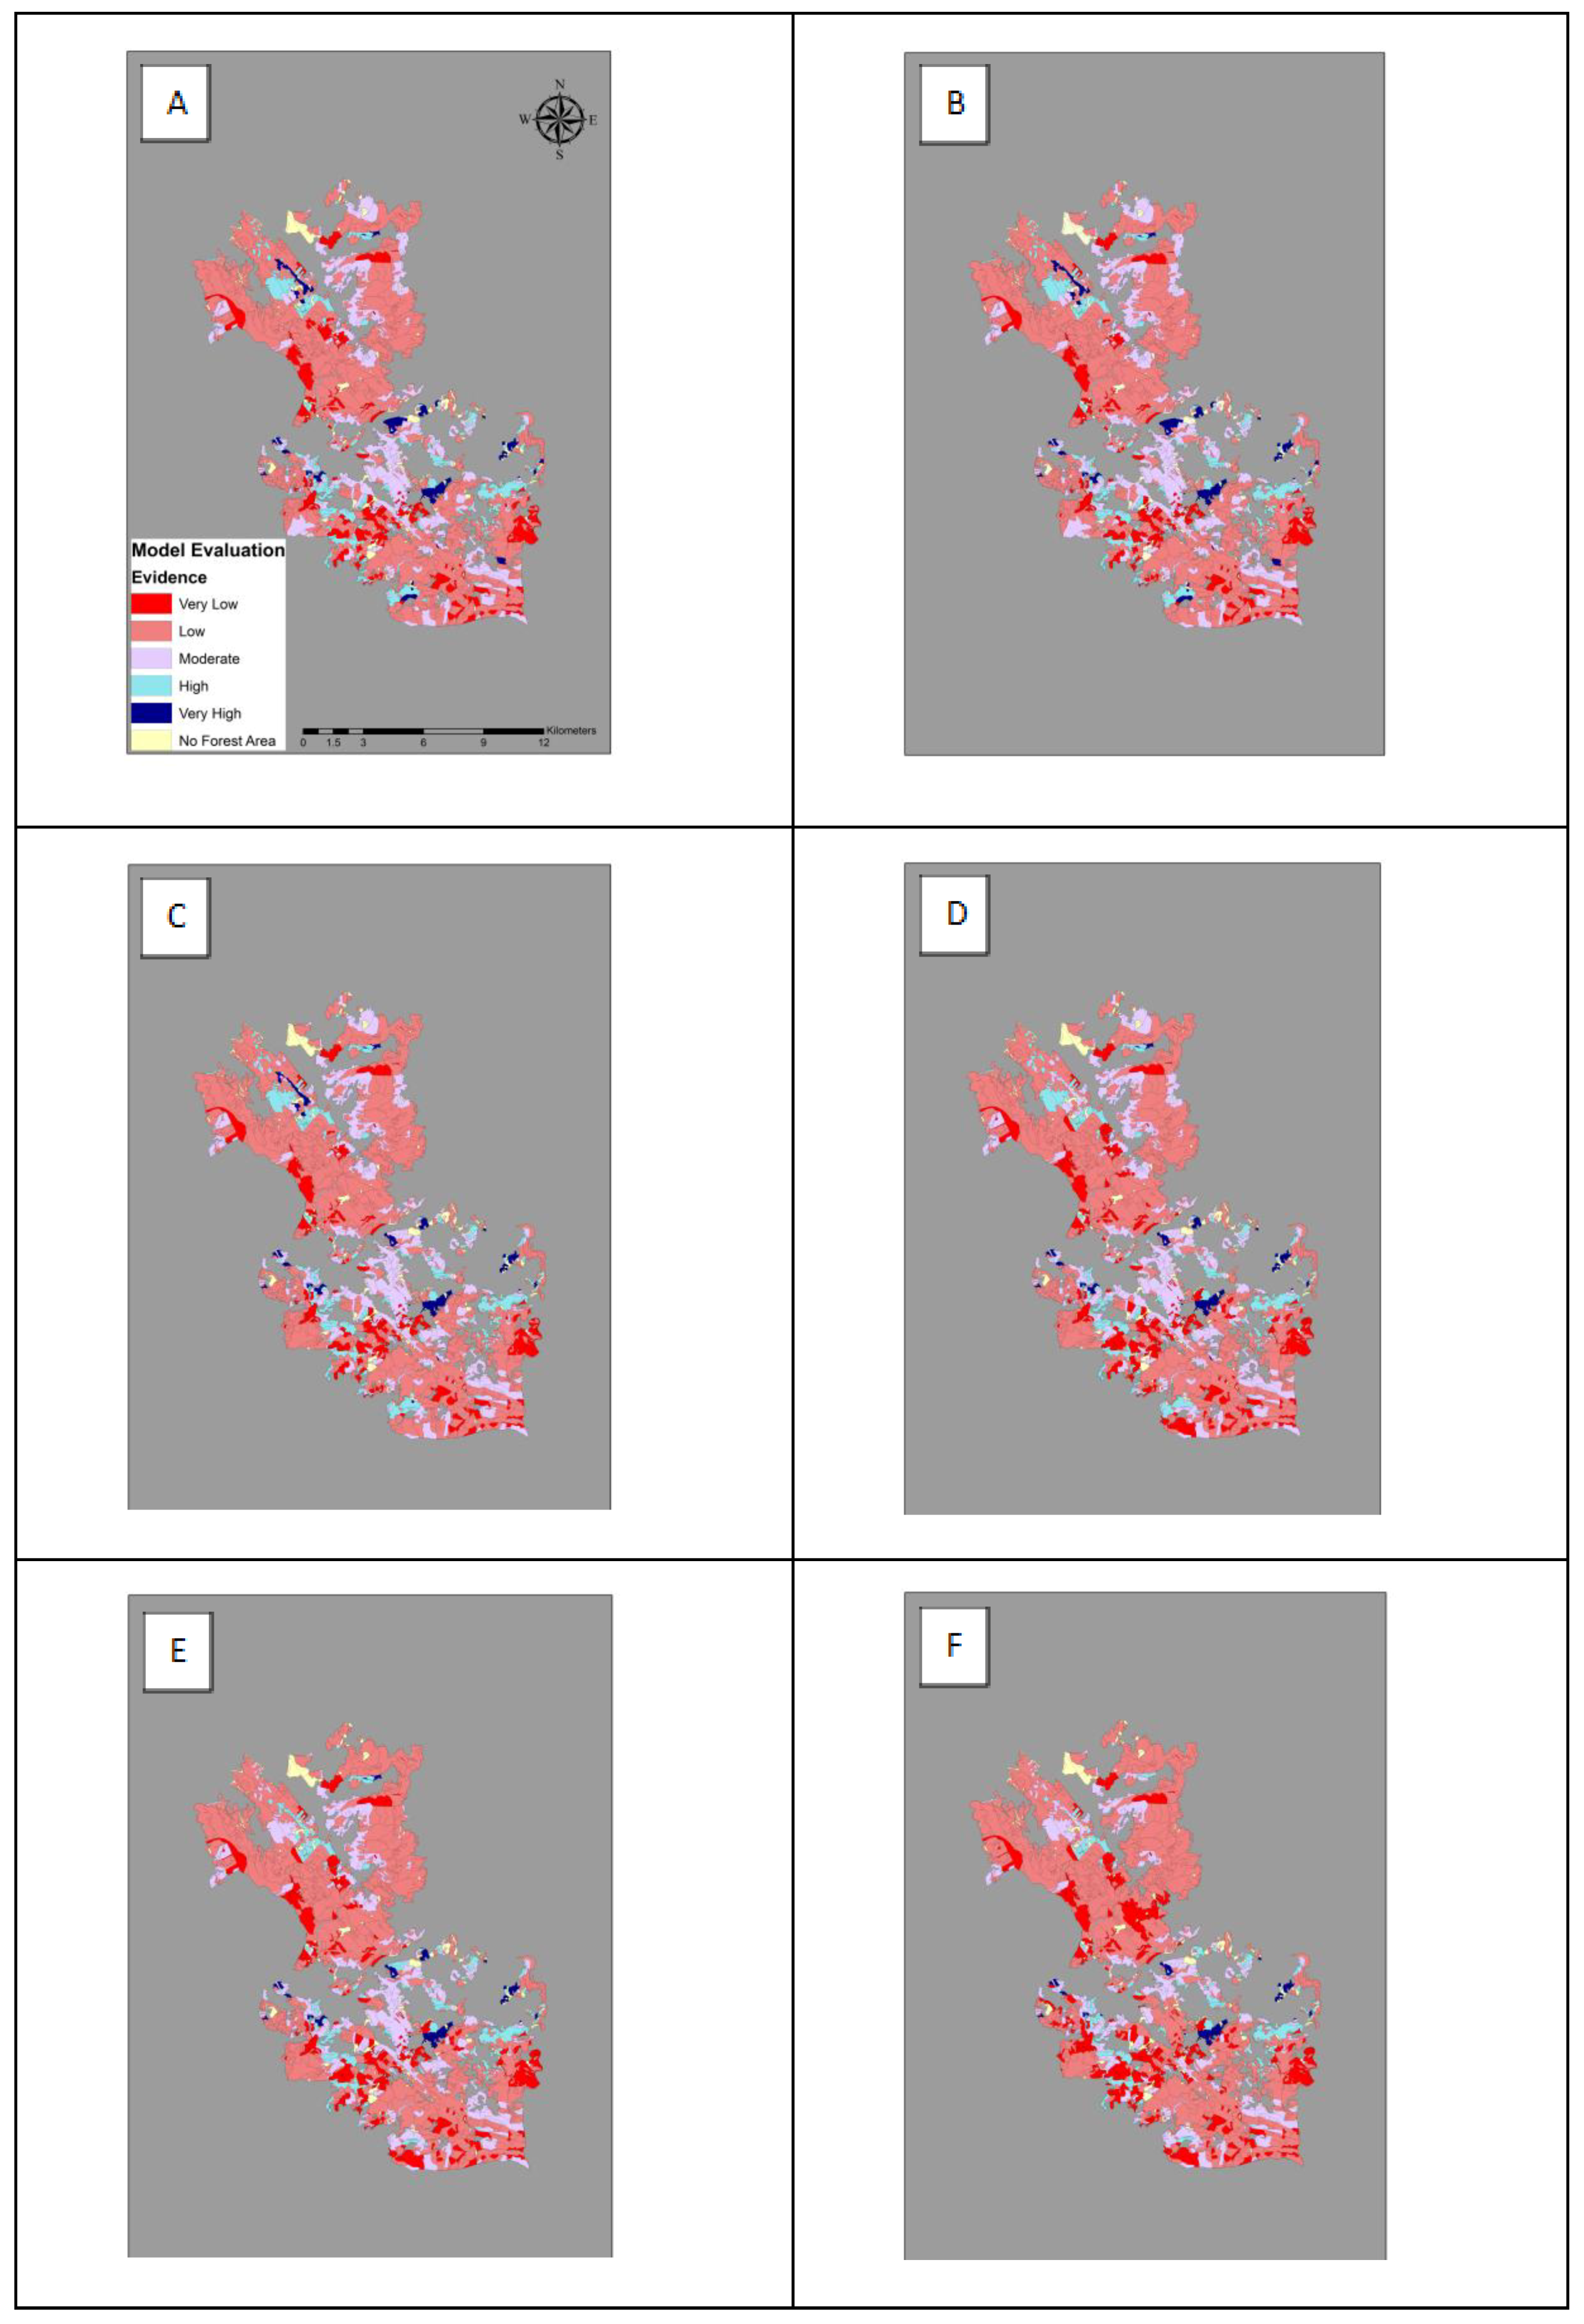
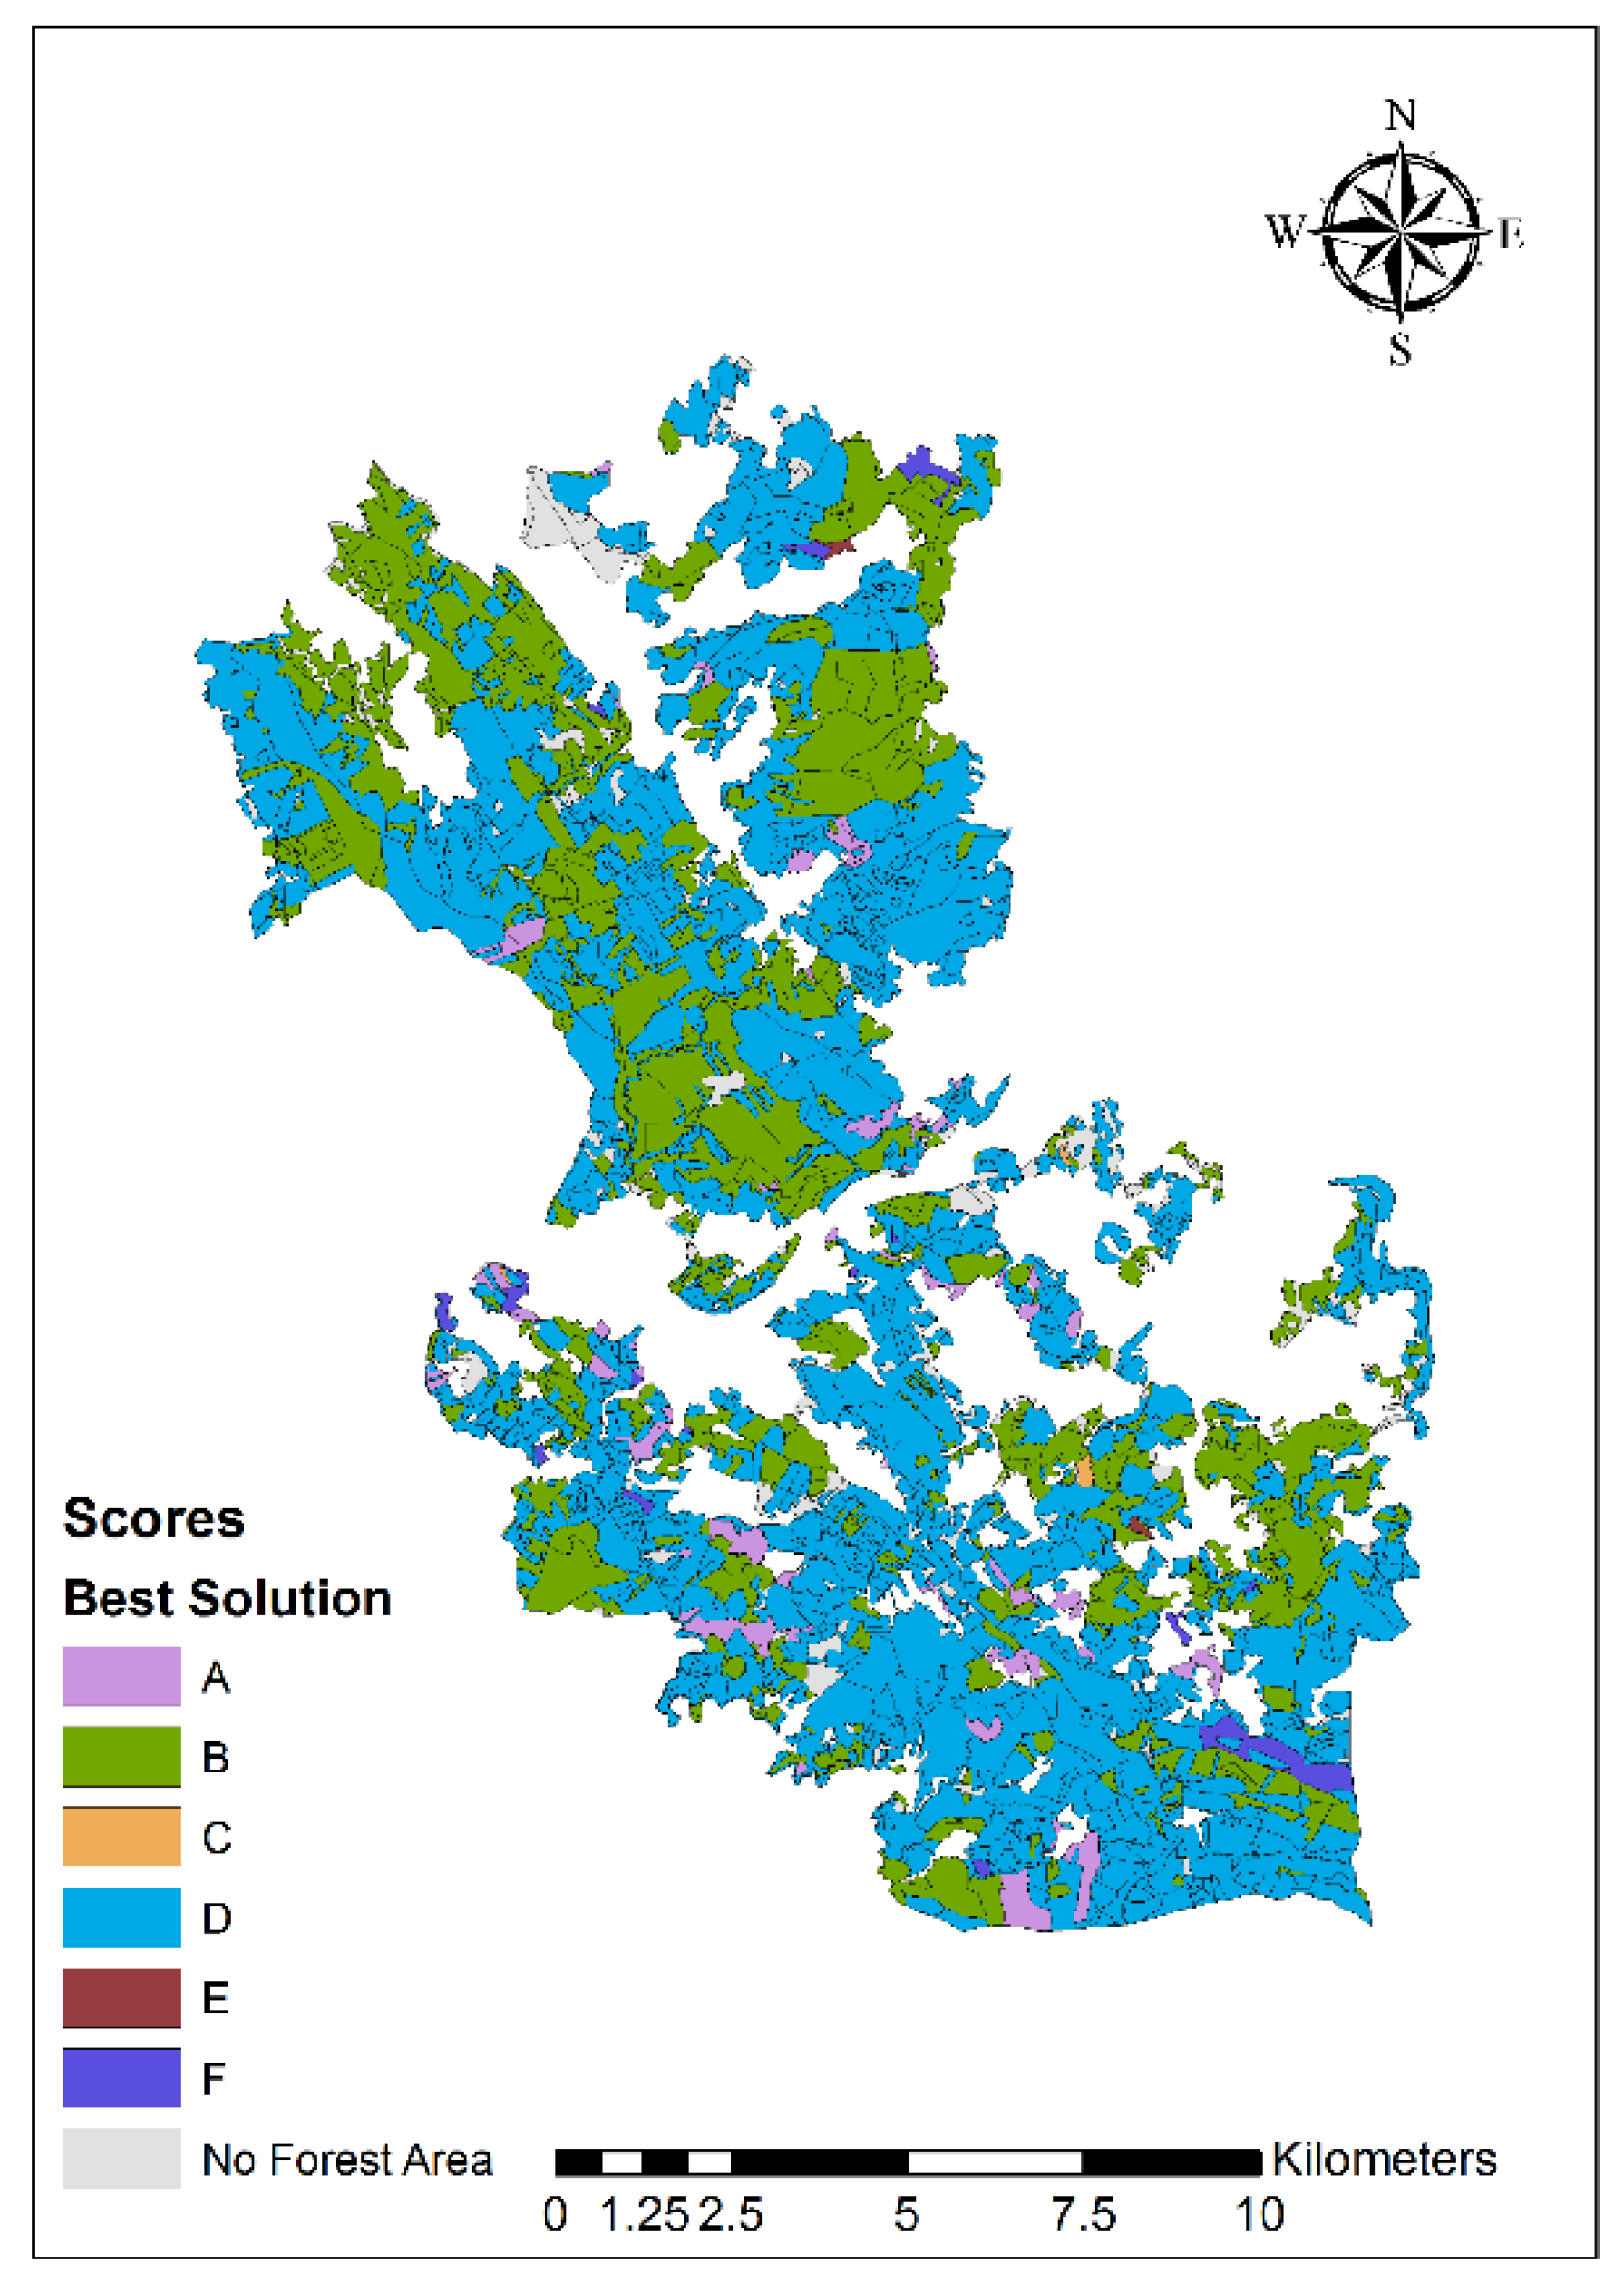
In the final step of the analysis, we used the weights developed in the second analytical step in a logic model that was executed by the NetWeaver component of EMDS to assess performance of the delivery of ecosystem services at the scale of individual stands. Each of the six nondominated points from the Pareto solution was associated with a map that was evaluated in EMDS, because the input data vary with the Pareto point selected. The NetWeaver model is structurally and computationally equivalent to the CDP model, but the key NetWeaver metric is a measure of strength of evidence. In this application, the topmost logic topic in the model was evaluating evidence that a particular Pareto solution delivers ecosystem services in a stand. One map of NetWeaver outcomes was generated in EMDS for each Pareto point. Maps are symbolized in terms of degree of evidence that the solution delivers ecosystem services. This analysis disaggregated the strategic MCDA analysis to individual stands.
The data inputs to NetWeaver included the ecosystem services target values in the six bundles selected by stakeholders and the corresponding management plans (e.g., one prescription per stand). Each data input to NetWeaver was evaluated by a fuzzy membership function that returned the strength of evidence that the observed stand-level value contributed to delivery of ecosystem services. Fuzzy membership functions in NetWeaver were scaled to the interval [–1, 1], in which –1 indicates no evidence, and 1 indicates full evidence. For each data input, the function was normalized to the observed data by setting the X-value corresponding to an evidence value of –1 as the minimum of the data distribution, considering the data range in the variable across all six Pareto solutions and all land stands. In general, data values were significantly right-skewed, so the X-value corresponding to an evidence value of 1 was set to the 90th percentile of the distribution for each input in order to provide a more useful distribution of outcomes on each input variable.

3. Results

3.1. The Criteria Space and the Pareto Frontier

The participation of various forest actors in forest decisions is increasingly relevant to strategic forest management and planning. Decision-makers interact with the Pareto frontier tool and can get several nondominated solutions according to their preferences and compare them to different levels of ecosystem services achieved, taking into account the trade-offs between them. When we have various (groups of) decision-makers, it may well happen that, even after the display of production possibility frontiers and trade-off information, no consensual solution is arrived at. In this case, there will be no single point on the Pareto frontier for the management area that provides a solution simultaneously optimal for the differing preferences of the decision-makers. In this research, we assumed that this was indeed the case and we emulated the selection of six solutions corresponding to preferences of six groups of decision-makers (Figure 3). The solutions corresponding to the six points in the Pareto frontier (Table 1) resulted from the maximization of the five criteria: Total Wood (harvested volume and thinned volume), Volume of Ending Inventory, Average Carbon Sequestration (the aboveground carbon pool: stem, leaves, branches, and bark), Net Present Value, and Biodiversity Indicator (IBiodiversity). In this research, the value of IBiodiversity is a function of the stand age and composition and ranges from 1 to 5.
There are interesting trade-offs and findings (Table 1). This set of solutions was chosen for representing different possible choices of decision-makers, with some variations of the values for each criterion in the decision map. The growth of Total Wood from point A to point F is mainly explained by the increase in values of Eucalypt Wood. On the other hand, it seems that, as Maritime Pine Wood is decreasing, Chestnut Wood is increasing, and vice-versa. In fact, there is another trade-off between these ecosystem services due to the possibility of conversion of Maritime Pine stands into Chestnut stands in the first three periods of planning horizon. Although the Net Present Value (NPV) was included as a criterion to be optimized, it does not vary much in the selected solutions, and it does not seem to have a strong trade-off with the remaining data inputs.
The values of IBiodiversity are relatively low. However, the main species in this case study is Eucalyptus globulus, and this is the species among all considered species with the lowest values of biodiversity, so the values for average IBiodiversity are consistent with this observation. Generally, we can see that the Average Carbon Sequestration reaches higher levels when we have lower values of Total Wood, which makes sense given the nature of this data input. Another relevant point is the fact that the NPV tends to have higher values when the levels of Total Wood are higher. In fact, one of the most important effects for the NPV is due to the profit of harvested volume or thinned volume that is sold, in this case, as standing wood.

3.2. Aspatial Multiple-Criteria Decision Analysis of the Pareto Frontier

The aspatial MCDA model designed in CDP considers the ecosystem services from the six nondominated solutions (Table 1) as attributes, which are aggregated into two groups of decision criteria: Wood Harvested and Other Ecosystem Services (Figure 4). Total Wood is not included in the MCDA model because it is a linear combination of the values of the three species, and NPV is not included as it reflects wood sales and it is vary correlated with wood harvested criteria (Table 1). The six nondominated solutions (A–F) represent the model alternatives, whose attribute values have been aggregated over land stands in the study area. The overall goal of this model is to identify the solution that provides the best combination of ecosystem services. Weights on the two criteria and weights for the contributions of attributes under each criterion were treated as equal strictly for demonstration purposes. Considering the large number of landowners who might represent at least several distinct stakeholder groups, use of equal weighting can be thought of as a default specification for a potentially diverse set of owner perspectives. In this context, the model ranked first solution D (0.586) (Figure 4), partly as a consequence of its higher contribution to the average carbon stock.
The analysis of model sensitivity in CDP demonstrated that the resulting model was somewhat sensitive with respect to identifying solution D as the top-rated alternative, given that the most sensitive criterion/attribute combination had a critical crossover value of 6.4%. In other words, the absolute value of the weight on the most sensitive combination would have to increase by only 6.4% before solution B would outrank solution D. The convention, recommended by References [10,25] is that the most sensitive combination in the sensitivity analysis should have a crossover value of at least ±10% to robustly conclude that the top-ranked alternative is indeed the best. Considering the contributions of the primary criteria to the overall decision score, it can be seen that solutions A to D are more or less comparable in terms of the overall decision score for each alternative, but there are significant differences among these four alternatives in terms of their contributions to other ecosystem services, and solutions A to D clearly perform better than either solution E or F with respect to other ecosystem services (Figure 5).

3.3. Spatial Analysis of Pareto Points for Individual Stands

Results from the previous section showed that solution D performed best with respect to delivery of ecosystem services when we consider the aggregate performance of each solution for the entire study area over the 90-year planning horizon. In the spatial phase of the analysis, we next look at how the six nondominated solutions performed at the scale of individual stands. For the spatial analysis, we used a NetWeaver model (Figure 6), executed in EMDS, that was structurally and computationally equivalent to the aspatial CDP model (Figure 4) to evaluate performance for each stand (Figure 7).
Due to the combination of the map scale and the five-class map symbology (Figure 7; [−1;−0.6], very low; ]−0.6;−0.2], low; ]−0.2;0.2] moderate; ]0.2;0.6] high; ]0.6;1] very high), the performance of the six solutions appears very similar, although a close examination of outcomes reveals small differences in the optimal solution choice for individual stands (see the set of map enlargements in the Figure 7). To better discriminate among the performance of solutions at the scale of stands, scores for all solutions were compiled into a single map layer and stands were coded according to the best solution (Figure 8). Pareto solutions D (1229 polygons) and B (623 polygons) clearly dominate the map (Figure 8), with a few scattered occurrences of solution A (64 polygons), F (16 polygons), C (3 polygons), and E (2 polygons). The corresponding solution in the criteria space is characterized by the highest values of average carbon stock and biodiversity and the lowest net present value (Table 1).

4. Discussion

The present study demonstrates how knowledge-based decision support approaches encapsulated in the EMDS can be used to complement the multicriteria decision methods within the Pareto frontiers tool of SADfLOR, when the two DSS are employed in a simple collaborative way. Importantly, no additional programming was required because the two EMDS components, CDP and NetWeaver, both received outputs more or less directly from SADfLOR, with only minimal data processing needed for data exchange between the two systems. To briefly summarize the analytical steps used in this study, we first obtained the six nondominated solutions from the multiple-criteria Pareto frontiers approach in SADfLOR (Figure 3); next, an aspatial MCDA analysis with CDP was conducted to assess the aggregate performance of Pareto solutions A–F over all stands for the 90-year planning horizon with respect to delivery of ecosystem services (Figure 4), and; finally, a NetWeaver logical model version of the CDP model (Figure 6) was run in the EMDS system to assess the performance of the Pareto solutions at the scale of individual stands (Figure 6 and Figure 7).
Pareto frontier applications have been used to study various forestry and natural resources phenomena related to several ecosystem services and forest management and planning. Authors in Reference [26] developed a Pareto frontier approach to assess trade-offs between timber-related criteria and spatial conditions correlated to other ecosystem services. Authors in Reference [27] used a production possibility frontier-based approach to evaluate the effects of bioenergy production on timber production potential and biodiversity. SADfLOR was built from forest ecosystem decision support system architectures [15,16,17] to evolve a Pareto frontier module that encapsulates the Feasible Goals Method/Interactive Decision Maps technique for interactive visualization of the web-based Pareto frontier [23,28]. Former developments of this multiple-criteria approach included the analysis of trade-offs between cork- and timber-related products at the regional level [22] and the analysis of trade-offs between timber-related products and a wide range of nonwood forest products [18] and regulatory services [29] at the landscape level.
The multiple-criteria method was developed further by this research to include three wood products and a subset of other ecosystem services (e.g., biodiversity, average carbon stored). Moreover, its collaborative planning functionality [18] was enhanced by the combination with other decision support approaches encapsulated in EMDS.
When there is only one decision-maker, or a group of decision-makers with similar preferences, the choice of only a single point on the Pareto frontier may be relatively easy. Nevertheless, in contexts characterized by multiple decision-makers, this may no longer be the case. Further negotiation may be needed to achieve a consensual solution. In this research, we have emulated such a situation where various (groups of) decision-makers with different preferences identify several optimal (nondominated) solutions in the criteria space (SADfLOR; Figure 3). So, the follow-on application of the classical aspatial strategic decision model in CDP (Figure 4) was used to elicit weights assigned by decision-makers to the ecosystem services and extend the analysis to compare the performance of six alternative Pareto solutions with respect to these preferences and the corresponding provisioning of ecosystem services (Figure 5). Although the CDP model in our study was relatively small and simple, being limited to consideration of a few provisioning services, the approach is readily extendible to more complex models that also consider supporting, cultural, and regulating services.
In this study, for demonstration purposes, the CDP and NetWeaver analyses were each conducted with a single model. More realistically, the present work could be extended to account for different weighting preferences among stakeholder groups. For example, Delphi methods could be used in conjunction with the CDP model structure to distinguish weighting preferences among a few to several stakeholder groups. With the groups being identified, the landscape of the whole study area could be partitioned according to the stakeholder groups and customized analyses run for each stakeholder group. It might also be of interest to the full group of all landowners in the association to reassemble the separate maps of outcomes from NetWeaver into a single composite map. This is easy to do in EMDS.
Finally, this study demonstrated the collaborative application of the SADfLOR and EMDS systems, but this collaboration required a modest amount of human intervention in terms of moving data between the systems, so an interesting question to pose is, “Is it feasible to automate the interoperability of the two systems?” The answer is a qualified yes. The EMDS system was rearchitected between 2012 and 2015, and is now built on the Microsoft Windows Workflow Foundation [30]. As a result, it is now relatively easy to integrate new analytical components into EMDS, albeit with a moderate amount of coding still required. For example, two new analytical engines were added into the EMDS architecture in the past year to support Bayesian network processing and Prolog-based decision trees. However, in the next year or two, EMDS will also integrate an open-source workflow editor, such as Trident [31], which will greatly simplify the task of integrating third-party analytical components into its architecture [32]. It is probably fair to say that open architecture DSS supported by workflow engines that simplify extensibility of DSS are the way of the future in continuing DSS development for environmental analysis and planning.

5. Conclusions

The provision of a wide range of ecosystem services requires a landscape-level management planning approach that may integrate temporal and spatial interactions between stand level management options. Nevertheless, landscape-level management planning often requires the negotiation of ecosystem services target values and corresponding management plans. This is complicated in contexts characterized by multiple stakeholders with diverse preferences. In this manuscript we demonstrated the potential of the combination of Pareto frontiers approaches within SADfLOR and EMDS decision modules to strengthen the collaborative planning process and to support the negotiation needed to reach a consensual solution.

Author Contributions

M.M., K.R., and J.G.B. conceived this work; M.M., K.R., and J.G.B. developed the methodology; M.M, K.R., and V.B. are responsible for processing and software development; M.M., K.R., and S.M. participated in validation of data; M.M., K.R., and J.G.B. wrote, reviewed, and edited this paper.

Disclaimer

Responsibility for the information and views set out in this article/publication lies entirely with the authors. The use of trade or firm names in this publication is for reader information and does not imply endorsement by the U.S. Department of Agriculture of any product or service.

Acknowledgments

This research has received funding from the European Union’s Horizon 2020 Research and Innovation Programme (grant agreement No. 676754) (ALTERFOR), from the Marie Skodowska-Curie Research and Innovation Staff Exchange (RISE) within the H2020 Work Programme (H2020-MSCA-RISE-2015), project Models and decision Support tools for integrated Forest policy development under global change and associated Risk and Uncertainty (SUFORUN), which specifically funded the collaboration of the authors, and by project LISBOA-01-0145-FEDER-030391 with the title ‘Forest ecosystem management decision-making methods—an integrated bio-economic approach to sustainability’ (BIOECOSYS). The authors would like to thank the Portuguese Science Foundation for funding through the Forest Research Center Project UID/AGR/00239/2013 as well as the Post Doc grant of Susete Marques SFRH/BPD/96806/2013 and the Ph.D. grant of Marco Marto SFRH/BD/108225/2015.

Conflicts of Interest

The authors declare no conflict of interest.

References

  1. Marques, A.F.; Borges, J.G.; Sousa, P.; Pinho, A.M. An enterprise architecture approach to forest management support systems design: An application to pulpwood supply management in Portugal. Eur. J. For. Res. 2011, 130, 935–948. [Google Scholar] [CrossRef]
  2. Reynolds, K.M. (Ed.) Sustainable Forestry: From Monitoring and Modelling to Knowledge Management and Policy Science; CABI: Wallingford, UK, 2007. [Google Scholar]
  3. Fedra, K.; Reitsma, R.F. Decision support and geographical information systems. In Geographical Information Systems for Urban and Regional Planning; Springer: Dordrecht, The Netherlands, 1990; pp. 177–188. [Google Scholar]
  4. Reynolds, K.M. EMDS Users Guide (Version 2.0): Knowledge-Based Decision Support for Ecological Assessment; US Department of Agriculture, Forest Service, Pacific Northwest Research Station: Portland, OR, USA, 1999; Volume 470.
  5. Reynolds, K.M.; Johnson, K.N.; Gordon, S.N. The science/policy interface in logic-based evaluation of forest ecosystem sustainability. For. Policy Econ. 2003, 5, 433–446. [Google Scholar] [CrossRef]
  6. Reynolds, K.M.; Hessburg, P.F.; Bourgeron, P.S. Making Transparent Environmental Management Decisions; Springer: Berlin/Heidelberg, Germany, 2014. [Google Scholar] [CrossRef]
  7. Reynolds, K.M.; Paplanus, S.; Miller, B.; Murphy, P. Design features behind success of the Ecosystem Management Decision Support System and future development. Forests 2015, 6, 27–46. [Google Scholar] [CrossRef]
  8. Miller, B.J.; Saunders, M.C. The NetWeaver Reference Manual; Pennsylvania State University: College Park, PA, USA, 2002. [Google Scholar]
  9. Chen, C. Information visualization. Wiley Interdiscip. Rev. Comput. Stat. 2010, 2, 387–403. [Google Scholar] [CrossRef]
  10. Saaty, T.L. How to make a decision: The analytic hierarchy process. Interfaces 1994, 24, 19–43. [Google Scholar] [CrossRef]
  11. Kamenetzky, R.D. The relationship between the analytic hierarchy process and the additive value function. Decis. Sci. 1982, 13, 702–713. [Google Scholar] [CrossRef]
  12. Martins, H.; Borges, J.G. Addressing collaborative planning methods and tools in forest management. For. Ecol. Manag. 2007, 248, 107–118. [Google Scholar] [CrossRef]
  13. Keeney, R.L.; Raiffa, H. Decision Analysis with Multiple Conflicting Objectives; Wiley& Sons: New York, NY, USA, 1976. [Google Scholar]
  14. Borges, J.G.; Nordström, E.M.; Garcia-Gonzalo, J.; Hujala, T.; Trasobares, A. (Eds.) Computer-Based Tools for Supporting Forest Management. The Experience and the Expertise World-Wide; Department of Forest Resource Management, Swedish University of Agricultural Sciences: Umeå, Sweden, 2014; 503p. [Google Scholar]
  15. Borges, J.G.; Falcao, A.O.; Miragaia, C.; Marques, P.; Marques, M. A Decision Support System for Forest Ecosystem Management in Portugal. In Systems Analysis in Forest Resources; Springer: Dordrecht, The Netherlands, 2003; pp. 155–163. [Google Scholar] [CrossRef]
  16. Falcão, A.; Borges, J.G. Designing decision support tools for Mediterranean forest ecosystems management: A case study in Portugal. Ann. For. Sci. 2005, 62, 751–760. [Google Scholar] [CrossRef]
  17. Garcia-Gonzalo, J.; Borges, J.G.; Palma, J.H.N.; Zubizarreta-Gerendiain, A. A decision support system for management planning of Eucalyptus plantations facing climate change. Ann. For. Sci. 2014, 71, 187–199. [Google Scholar] [CrossRef]
  18. Borges, J.G.; Marques, S.; Garcia-Gonzalo, J.; Rahman, A.U.; Bushenkov, V.; Sottomayor, M.; Carvalho, P.O.; Nordström, E.M. A multiple criteria approach for negotiating ecosystem services supply targets and forest owners’ programs. For. Sci. 2017, 63, 49–61. [Google Scholar] [CrossRef]
  19. Reynolds, K.M. Integrated decision support for sustainable forest management in the United States: Fact or fiction? Comput. Electron. Agric. 2005, 49, 6–23. [Google Scholar] [CrossRef]
  20. Reynolds, K.M. Using a logic framework to assess forest ecosystem sustainability. J. For. 2001, 99, 26–30. [Google Scholar]
  21. Reynolds, K.M.; Twery, M.; Lexer, M.J.; Vacik, H.; Ray, D.; Shao, G.; Borges, J.G. Decision support systems in forest management. In Handbook on Decision Support Systems; Burstein, F., Holsapple, C., Eds.; International Handbooks on Information Systems Series; Springer: Berlin/Heidelberg, Germany, 2008; Volume 2, pp. 499–534. [Google Scholar] [CrossRef]
  22. Borges, J.G.; Garcia-Gonzalo, J.; Bushenkov, V.; McDill, M.E.; Marques, S.; Oliveira, M.M. Addressing multicriteria forest management with Pareto frontier methods: An application in Portugal. For. Sci. 2014, 60, 63–72. [Google Scholar] [CrossRef]
  23. Garcia-Gonzalo, J.; Bushenkov, V.A.; McDill, M.E.; Borges, J.G. A decision support system for assessing trade-offs between ecosystem management goals. An application in Portugal. Forests 2015, 6, 65–87. [Google Scholar] [CrossRef]
  24. Reynolds, K.M. Landscape evaluation and planning with EMDS 3.0. In Proceedings of the 2002 ESRI User Conference, San Diego, CA, USA, 9–12 July 2002; Environmental Systems Research Institute: Redlands, CA, USA, 2002. [Google Scholar]
  25. Saaty, T.L. The Decision Maker for Leaders; RWS Publications: Pittsburgh, PA, USA, 1990. [Google Scholar]
  26. Tóth, S.F.; McDill, M.E. Finding efficient harvest schedules under three conflicting objectives. For. Sci. 2009, 55, 117–131. [Google Scholar] [CrossRef]
  27. Kärkkäinen, L.; Kurttila, M.; Salminen, O.; Viiri, H. Effects of energy wood harvesting on timber production potential and biological diversity in North Karelia, Finland. For. Sci. 2014, 60, 1077–1088. [Google Scholar] [CrossRef]
  28. Lotov, A.; Bushenkov, V.A.; Kamenev, G.K. Interactive Decision Maps: Approximation and Visualization of Pareto Frontier; Springer Science & Business Media: Berlin/Heidelberg, Germany, 2013; Volume 89. [Google Scholar]
  29. Marques, S.; Marto, M.; Bushenkov, V.; McDill, M.; Borges, J. Addressing wildfire risk in forest management planning with multiple criteria decision making methods. Sustainability 2017, 9, 298. [Google Scholar] [CrossRef]
  30. Chappell, D. The Workflow Way: Understanding Windows Workflow Foundation. 2009. Available online: http://msdn.microsoft.com/en-us/library/dd851337.aspx (accessed on 13 April 2018).
  31. Trident Team. Project Trident: A Scientific Workflow Workbench. 2011. Available online: http://tridentworkflow.codeplex.com/ (accessed on 13 April 2018).
  32. Paplanus, S.; Miller, B.; Murphy, P.; Reynolds, K.; Saunders, M. EMDS 5.0 and Beyond. In Making Transparent Environmental Management Decisions: Applications of the Ecosystem Management Decision Support System; Reynolds, K.M., Hessburg, P.F., Bourgeron, P.S., Eds.; Springer: Berlin/Heidelberg, Germany, 2014; Chapter 13. [Google Scholar] [CrossRef]
Figure 1. Zona de Intervenção Florestal (ZIF) Paiva and Entre-Douro e Sousa. (a) location of the study area in Portugal; (b) classification of the study area into stands.
Forests 09 00438 g001
Figure 2. Decision support flowchart.
Forests 09 00438 g002
Figure 3. Trade-offs between three criteria. In the x-axis TOTTIMBesm Total Wood (106 m3). In the y-axis, Vol_Per9esc, Volume of Ending Inventory (106 m3). Each of the seven decision maps corresponds to a level of CTOTALesc, Carbon Sequestration (105 Mg year−1). The other criteria, Net Present Value (108 €; NPV; on the first slider) and Biodiversity Indicator ([0, 5] (IBiodiversity; on the second slider) have been fixed at 0.63 and 1.61, respectively. Solutions A–F correspond to six alternative sets of criteria values.
Forests 09 00438 g003
Figure 4. The Criterium DecisionPlus (CDP) model to choose the best nondominated point from the Pareto frontier.
Forests 09 00438 g004
Figure 5. Contributions of primary decision criteria (Figure 4) to the overall CDP utility score for the six solutions (A to F) from the Pareto frontier analysis (Figure 3).
Forests 09 00438 g005
Figure 6. NetWeaver model to assess delivery of ecosystem services for individual stands. Data inputs at the stand level vary by Pareto solution (A–F), so this model is evaluated in EMDS with a separate assessment for each Pareto solution (Figure 7). Each oval represents a logic topic. Gray topics shown at the bottom of the diagram are elementary topics that evaluate data inputs with fuzzy membership functions.
Forests 09 00438 g006
Figure 7. Evaluation of individual stands for solutions A to F from the Pareto frontier (Figure 3) with the values of variables per ha using the same NetWeaver model used for evaluating the best point (Figure 6). The percentile 90 was used as the maximum.
Forests 09 00438 g007
Figure 8. Best solution (A to F from Pareto frontier) for each stand, based on NetWeaver scores for each solution from the NetWeaver model (Figure 7).
Forests 09 00438 g008
Table 1. Selected results for ecosystem services for the planning horizon of 90 years a for the Zonas de Intervenção Florestal Paiva and Entre-Douro e Sousa (ZIF_VS).
Ecosystem ServiceUnitPoint APoint BPoint CPoint DPoint EPoint FFinal Solution
Total Wood106 m314.451714.722614.918415.200815.452615.594814.4762
Maritime Pine Wood105 m34.39134.45875.09335.35234.85345.43983.3605
Eucalypt Wood106 m313.464413.724313.856614.109614.305414.422613.6267
Chestnut Wood106 m30.16040.16010.14180.14180.24680.18620.1560
Volume of Ending Inventory106 m32.56592.56262.47842.15081.91261.43482.5350
Average Carbon Sequestration105 Mg year14.41484.41154.40734.41974.36154.36374.5049
Net Present Value1080.65750.65420.650.66240.64650.65960.6490
Value of Biodiversity Indicator[0, 5]1.6571.65561.64651.64681.64251.64461.6682
a The positions of the solution points, A to F, are shown in Figure 1.

