Article

Impacts of a High Nitrogen Load on Foliar Nutrient Status, N Metabolism, and Photosynthetic Capacity in a Cupressus lusitanica Mill. Plantation

Co-Innovation Center for Sustainable Forestry in Southern China, Nanjing Forestry University, 159 Longpan Road, Nanjing 210037, China
*
Author to whom correspondence should be addressed.
Forests 2018, 9(8), 483; https://doi.org/10.3390/f9080483
Submission received: 3 July 2018 / Revised: 31 July 2018 / Accepted: 8 August 2018 / Published: 9 August 2018
(This article belongs to the Section Forest Ecophysiology and Biology)

Abstract

:
At present, anthropogenic nitrogen deposition has dramatically increased worldwide and has shown negative impacts on temperate/boreal forest ecosystems. However, it remains unclear how an elevated N load affects plant growth in the relatively N-rich subtropical forests of Southern China. To address this question, a study was conducted in a six-year-old Cupressus lusitanica Mill. plantation at the Scientific Research and Teaching Base of Nanjing Forestry University, with N addition levels of N0 (0 kg ha−1 year−1), N1 (24 kg ha−1 year−1), N2 (48 kg ha−1 year−1), N3 (72 kg ha−1 year−1), N4 (96 kg ha−1 year−1), and N5 (120 kg ha−1 year−1). Leaf physiological traits associated with foliar nutrient status, photosynthetic capacity, pigment, and N metabolites were measured. The results showed that (1) N addition led to significant effects on foliar N, but had no marked effects on K concentration. Furthermore, remarkable increases of leaf physiological traits including foliar P, Ca, Mg, and Mn concentration; photosynthetic capacity; pigment; and N metabolites were always observed under low and middle-N supply. (2) High N supply notably decreased foliar P, Ca, and Mg concentration, but increased foliar Mn content. Regarding the chlorophyll, photosynthetic capacity, and N metabolites, marked declines were also observed under high N inputs. (3) Redundancy analysis showed that the net photosynthesis rate was positively correlated with foliar N, P, Ca, Mg, and Mn concentration; the Mn/Mg ratio; and concentrations of chlorophyll and N metabolites, while the net photosynthesis rate was negatively correlated with foliar K concentration and N/P ratios. These findings suggest that excess N inputs can promote nutrient imbalances and inhibit the photosynthetic capacity of Cupressus lusitanica Mill., indicating that high N deposition could threaten plant growth in tropical forests in the future. Meanwhile, further study is merited to track the effects of high N deposition on the relationship between foliar Mn accumulation and photosynthesis in Cupressus lusitanica Mill.

1. Introduction

Accelerating industrialization and the excess use of nitrogen (N) fertilizer has caused a significant increase of reactive N (Nr) in deposition, both regionally and globally, since the beginning of the industrial revolution [1,2,3]. In the past few decades, China has become the world’s largest creator and emitter of reactive nitrogen, followed by North America and Europe [4,5]. In China, from 1910 to 2010, the reactive N from anthropogenic sources increased from 9.2 Tg N year−1 to 56 Tg N year−1, and is predicted to be 63 Tg by the year 2050 [6,7]. In addition, atmospheric N deposition in Southern China has been reported to range from 30 to 73 kg N ha−1 year−1, which is comparable to the highest level of N deposition in Europe and the USA [8,9]. The data reported by many researchers suggest that increased atmospheric N deposition may lead to a cascade of detrimental effects on the global N cycle, the health of human and terrestrial/aquatic ecosystems, the greenhouse gas balance, and biological diversity [10,11,12,13,14,15,16,17,18]. The increased N deposition has become an environmental concern worldwide.
Nitrogen is the main limiting nutrient in terrestrial ecosystems and has important implications for plant growth and development [19]. In N-limited forests, both field and laboratory studies have illustrated that adequate increments of atmospheric N deposition could satisfy the plant demand for N, which would increase soil nitrogen availability, improve plant nutrient status, and stimulate photosynthetic capacity [20,21,22,23]. However, when N deposition exceeds the nutritional demands of the plants, excessive N deposition remarkably threatens forest ecosystem properties and processes, resulting in soil acidification, nutrient imbalance, and inorganic N toxicity, as well as a decline in plant growth and biodiversity [24,25,26,27,28,29]. At Harvard Forest in central Massachusetts, USA, Magill et al. (2000) reported that the woody biomass production of a pine stand was significantly reduced in a high N plot [30]. At the Dinghushan biosphere reserve, Lu et al. (2010) found that high-level N deposition significantly reduced understory vegetation diversity [22]. Mao et al. (2018) also found that the photosynthetic nitrogen use efficiency of Cryptocarya concinna Hance, Cryptocarya chinensis (Hance) Hemsl., and Randia canthioides Champ. remarkably declined in the excessive N plot at the Dinghushan biosphere reserve [24]. Forest decline caused by excessive N deposition has been well-illustrated, which allowed us to further evaluate the adverse impacts of this substantial and continuing N deposition on the forest ecosystems. In these studies, foliar physiological traits such as foliar nutrient status, N metabolism, and photosynthesis, were considered as important indicators of environmental stress and have gained more and more attention.
Leaf physiological traits can reflect the ecological strategies of plants and determine the response of plants to environmental factors [31]. A number of studies have indicated that leaf physiological traits associated with foliar nutrient status, N metabolism, and photosynthesis are more sensitive to environmental stress when compared with morphological symptoms [24,32,33,34,35]. Variation in leaf physiology has proven to be of great value for tackling many important ecological questions in the field of forestry [36,37,38]. Until now, the responses of foliar nutrient status, N metabolism, and photosynthesis to elevated N deposition have mainly been conducted in N-limited temperate and boreal forests [27,39,40]. However, it remains unclear as to how excess N deposition affects forest ecosystems in tropical and subtropical areas.
Cupressus lusitanica Mill., one of the fast-growing coniferous species, is widely distributed in many countries around the world. Cupressus lusitanica Mill. is an eco-economic tree species, which is valuable for timber and carbon sequestration [41]. In the past few decades, Cupressus lusitanica Mill. has become one of the dominant tree species in the shelterbelt construction program of the Yangtze River Watershed [42]. Inorganic N wet deposition (Ndep) of the Yangtze River Delta has been reported to range from 2 to 50 kg ha−1 year−1, which exceeds the critical load of most forest ecosystems [43]. In this study, changes of foliar nutrient status, N metabolism, and photosynthetic capacity in a Cupressus lusitanica Mill. plantation along a gradient of stimulated N deposition were investigated. The three main objectives of this study were: (1) to determine the effects of excessive N deposition on foliar nutrient status and the photosynthesis of Cupressus lusitanica Mill.; (2) to investigate the effects of excessive N deposition on foliar N metabolism; and (3) to estimate the potential relationship between photosynthetic traits and foliar nutrient status under increasing N inputs, and investigate the relationship between N metabolites and photosynthetic traits under increasing N inputs.

2. Materials and Methods

2.1. Study Area

The study area (118°51′ to 119°14′ E, 31°23′ to 31°48′ N) is located in the Scientific Research and Teaching Base of Nanjing Forestry University, in Baima County, Nanjing, Jiangsu Province, China. It has a subtropical monsoon climate with a mean annual temperature of 15.5 °C, and a mean annual average precipitation value of 1037 mm. Ndep was approximately 20–25 kg ha−1 year−1 in Jiangsu Province from the 1990s to 2000s [7]. In April 2016, the basic soil physicochemical properties of the sampling layer (0–20 cm) were as follows: the pH value was 5.77 ± 0.03, the soil bulk density was 1.44 ± 0.02 g cm−3, the soil organic carbon concentration (SOC) was 1.52% ± 0.06%, the total nitrogen concentration (TN) was 0.13% ± 0.005%, and the soil available phosphorus concentration was 20.85 ± 0.012 mg kg−1.
The site was hand planted following a 2.5 × 2.5 m spacing plan with two-year-old Cupressus lusitanica Mill. seedlings in March 2012. The trees came from the same variety (no statistical differences detected) in all plots prior to treatment imposition. Mean tree height measured in April 2016 was approximately 5.57 ± 0.94 m, and mean diameter at breast height (DBH) was approximately 4.97 ± 0.64 cm.

2.2. Experimental Design and Sample Collection

In this study, the dosage of six N addition levels was N0 (0 kg ha−1 year−1), N1 (24 kg ha−1 year−1), N2 (48 kg ha−1 year−1), N3 (72 kg ha−1 year−1), N4 (96 kg ha−1 year−1), and N5 (120 kg ha−1 year−1). All six treatments were arranged in a randomized block design with three replicates (20 × 20 m, 10 m buffer strip). Based on the growing character of Cupressus lusitanica Mill. conducted by Qin et al. (2016) [44], Gu (2011) [45], and Bao (2012) [46], one year’s amount of added nitrogen was divided into two portions: one portion (44%) in the early-growth season (early April) and the other portion (56%) in the fast-growing season (early August). This method was also adopted by many other researchers [47,48,49]. Urea was applied in early April 2016, early August 2018, early April 2017, and early August 2017. Urea was applied by weighing and dissolving in 20 L water via a backpack sprayer. Control plots received an equivalent volume of water.
The sampling time was in August 2017. Fresh foliar samples were collected from the 2017 first flush cohort growing on a 2016 first flush branch after the new foliage had elongated (June or July). Seven fully elongated fascicles were pruned from the mid-crown of the five random trees in each replicate per treatment plot and mixed as one composite sample. All foliar samples were placed on dry ice in the field to stop enzymatic activity, and stored at −20 °C until further analysis of the foliar soluble protein and free amino acid.

2.3. Photosynthesis Measurements

An Li-6400 photosynthetic instrument (Li-Cor Inc., Lincoln, NE, USA) was used to measure the net photosynthesis rate (Pn), stomatal conductance to water vapor (Gs), transpiration rate (Tr), and intercellular CO2 concentration (Ci) in early August 2017. The measurements were made on sunny days at 08:30–11:30 am. During the photosynthetic characteristics measurements, the assimilation chamber temperature was maintained at 25 °C ± 1.4 °C, the relative humidity was 85% ± 9%, the cylinder supply CO2 concentration was 400 μmol mol−1, and the light intensity of the artificial light source was 1200 μmol m−2 s−1. The photosynthetic characteristics measurements were conducted on mature healthy leaves of the fully-extended branches at a high position in the canopy.
Chlorophyll concentrations were analyzed using the methods of Wellburn (1994): after pigment extraction with 80% acetone, absorbance of the solution was measured at 663 and 646 nm wavelengths (Shimadzu UV-1800, Kyoto, Japan) [50].

2.4. Leaf Soluble Protein and Free Amino Acid Determination

Fresh leaves were homogenized in 50 mmol L−1 sodium phosphate buffer (pH 7.8) containing 2 mmol L−1 ethylenediaminetetraacetic acid (EDTA) and 80 mmol L−1 ascorbic acid. The homogenates were centrifuged at 15,000× g for 20 min at 4 °C, and the supernatant was used to analyze the leaf soluble protein according to Xu and Zhou (2006) [51].
Free amino acid was extracted according to Barnett (1966) [52], quantified based on an external standard, and measured with an amino acid auto analyzer (HITACHI 835-50, Tokyo, Japan).

2.5. Determination of Foliar Nutrient Status

The leaves were washed with deionized water, fixed for 30 min at 105 °C, dried to a constant weight at 70 °C, and finally crushed and passed through a 100-mesh sieve. Foliar N concentration was determined by an elemental analyzer (Vario Max, Elementar, Germany). A total of 0.5 g powder sample was digested with concentrated H2SO4–HClO4 (Dong et al., 1996), and the concentrations of foliar P, K, Ca, Mg, and Mn were measured via Atomic Emission Spectrometer (ICP-AES) (Perkin Elmer Optima 5300DV, Shelton, CT, USA).

2.6. Statistical Analysis

All results were reported as means ± standard errors (SE) for the three replicates. Statistical differences between values were determined by Duncan’s multiple comparisons and one-way analysis of variance (ANOVA). Redundancy analysis (RDA) was applied to identify the relationship between leaf physiological traits and foliar nutrient status by using CANOCO software 5.0 (Microcomputer Power, Ithaca, NY, USA). Clustering analysis was used to classify the responses of leaf physiological traits to different N rates in two or three dimensions by using SPSS 20.0 (Statistical Graphics Crop, Princeton, NJ, USA).

3. Results

3.1. Effects of Different N Depositions on Foliar Nutrient Status

Compared to those without N input (N0), concentrations of foliar N and P were significantly increased in leaves receiving stimulated N deposition (p < 0.05). The highest N treatment (N5) resulted in a significant (p < 0.05) decline in foliar N and P concentrations compared to N4 treatment (Table 1). Elevated N addition caused a decrease in foliar K concentration. Except for the foliar Ca concentration in the N5 treatment (0.52% when compared with 0.64% for the N0 treatment), the mean values of foliar Ca concentration were significantly higher in other N treatments than those in the control treatment. Except for the foliar Mg concentration in N4 and N5 treatments (0.14% and 0.13% when compared with 0.16% for the N0 treatment, respectively), the mean values of foliar Mg concentration were significantly higher in other N treatments than those in the control treatment. However, foliar Mn concentration notably increased along the gradient of N addition, despite the fact that needle concentrations of N, P, Ca, and Mg decreased in the N5 treatment (Table 1).
The foliar N/P ratio was always significantly or marginally significantly lower in the N treatments than in the N0 treatment. However, the foliar N/Mg and Mn/Mg ratios were increased by N addition, and the highest value of foliar N/Mg and Mn/Mg ratios appeared at the rate of N5 (Table 1).

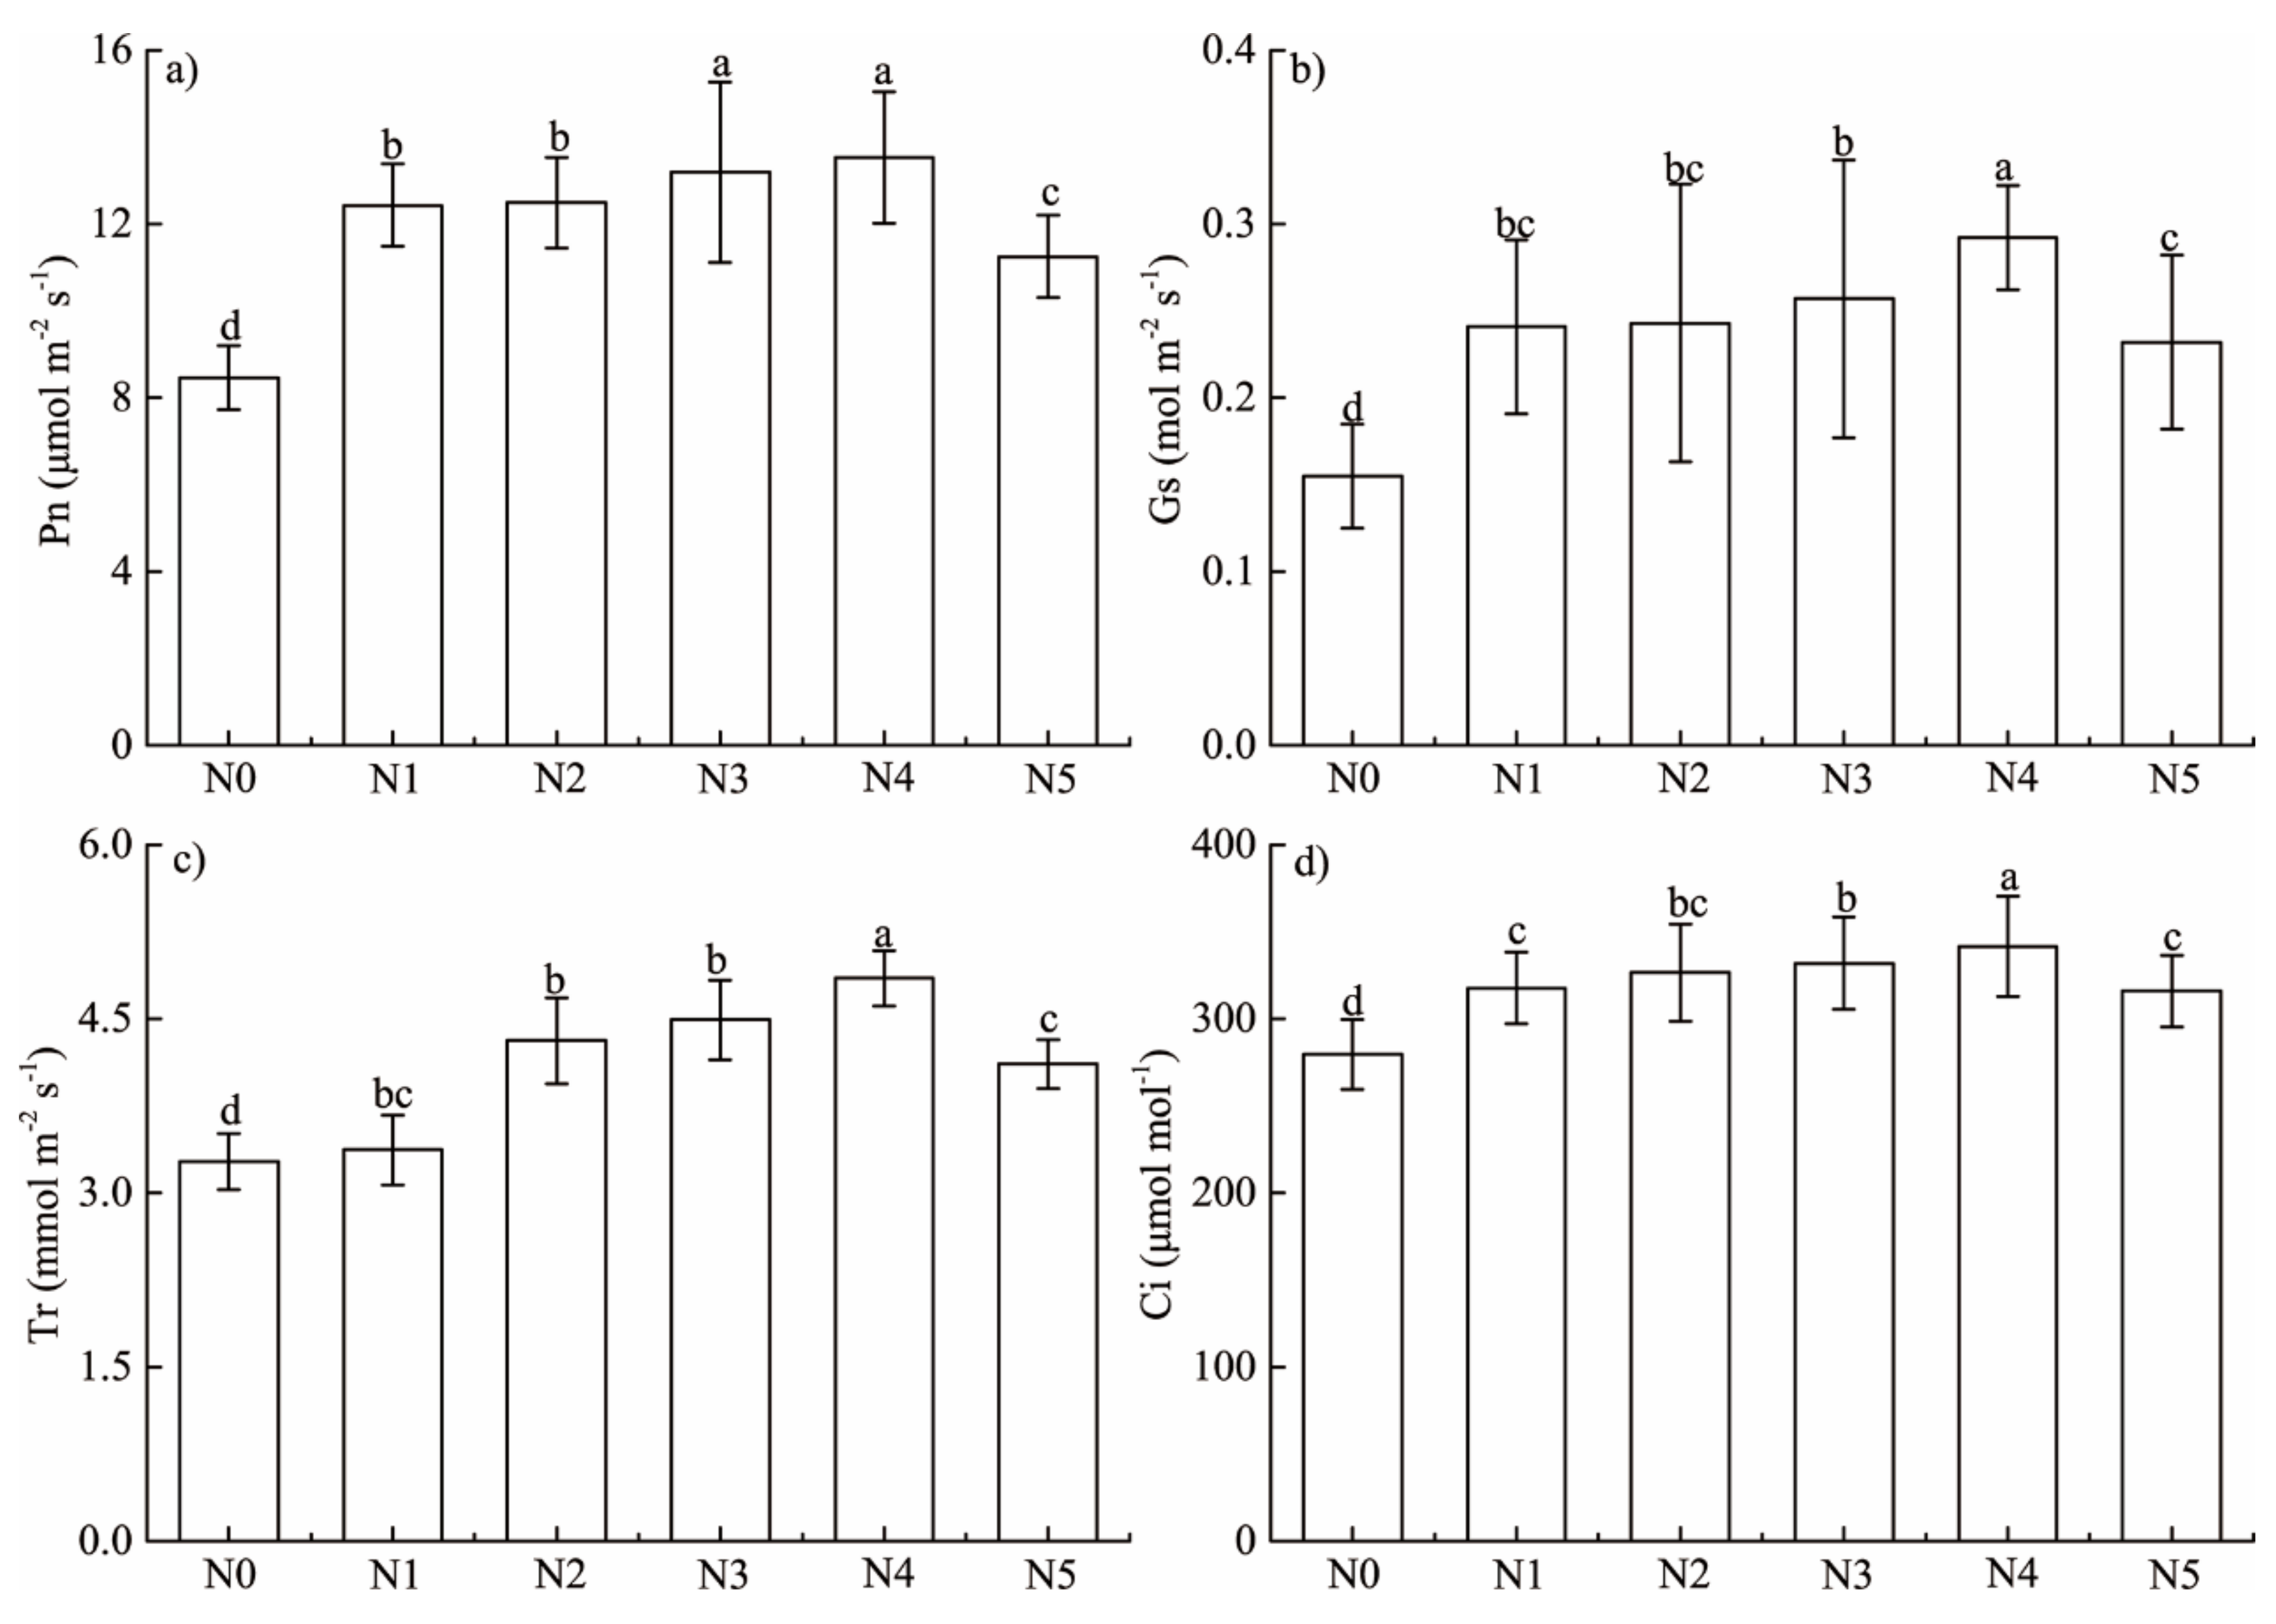
3.2. Responses of Leaf Photosynthetic Parameter and Pigment to Stimulated N Deposition

Compared to the N0 treatment, Pn, Gs, Tr, and Ci at 400 μmol mol−1 CO2 were significantly increased in leaves receiving N additions from N1 to N4, reaching a maximum in N4 treatment (Figure 1). However, Pn, Gs, Tr, and Ci were significantly lower in the N5 treatment than those in the N4 treatment.
Except for the foliar chlorophyll b concentration in the N1 treatment (0.09 mg g−1 when compared with 0.12 mg g−1 for the control treatment), the mean values of foliar chlorophyll a and chlorophyll b concentrations were significantly or marginally significantly higher in other N treatments than in the N0 treatment (Table 2). Both chlorophyll a concentration and chlorophyll b concentration were significantly higher in the N4 treatment than in other N treatments. Consequently, a similar pattern was observed for the chlorophyll a + b concentration. Regarding the chlorophyll a/b ratio, the mean value was significantly lower in the N5 treatment than in the other N treatments (Table 2).

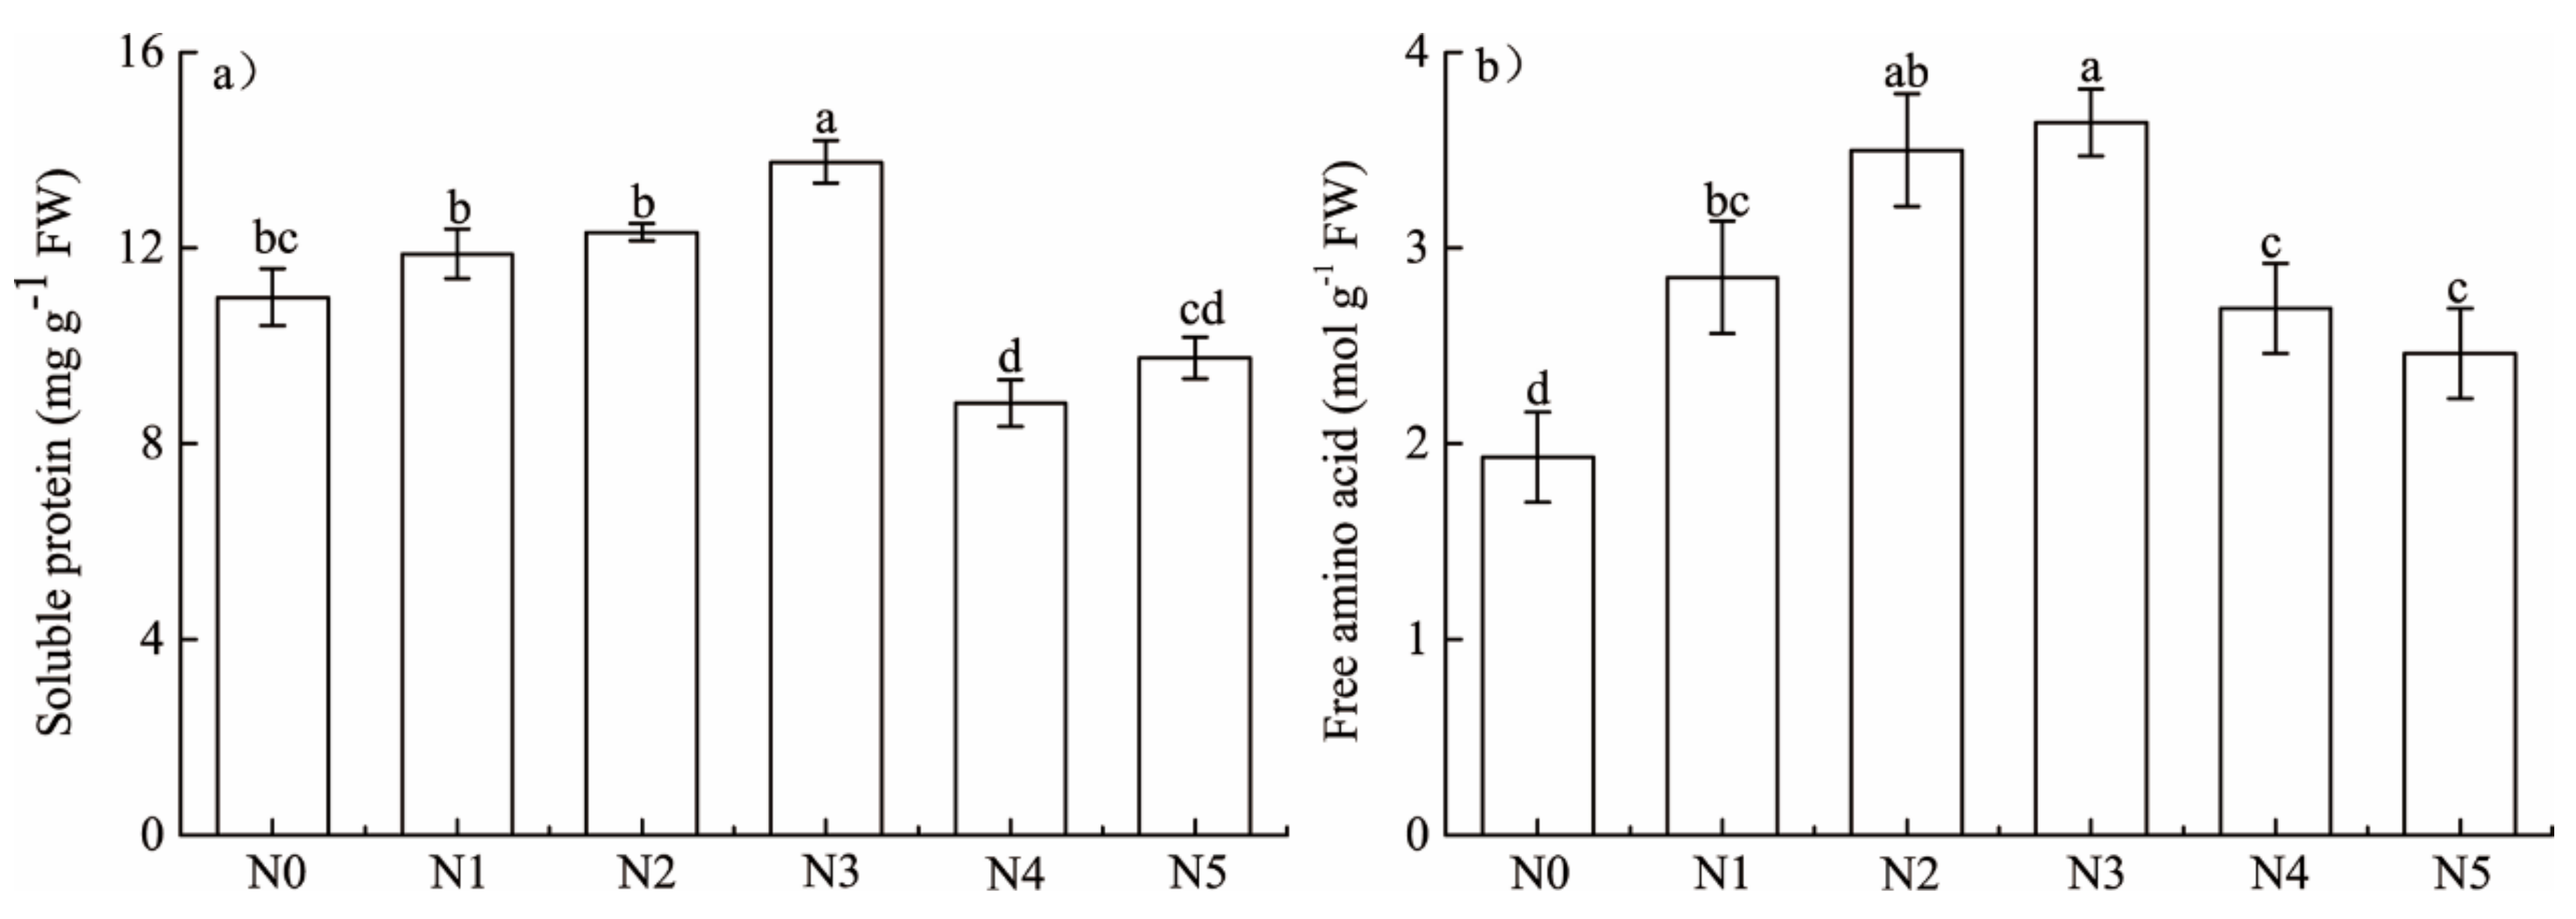
3.3. Effects of N Addition on Foliar Soluble Protein and Free Amino Acid

Soluble protein showed an increase in leaves receiving N additions from N1 to N3. It reached a maximum in N3 treatment (p < 0.05, vs. N0), and subsequently significantly declined in N4 and N5 treatments (p < 0.05, vs. N3). A similar pattern was observed for free amino acid (Figure 2). The mean values of soluble protein in the N4 and N5 treatments were remarkably lower than in the control treatment (8.83 and 9.75 mg g−1 fresh weight (FW) when compared with 10.99 mg g−1 FW for the control treatment, respectively), while the mean values of free amino acid in the N4 and N5 treatments were notably higher than in the control treatment (2.69 and 2.46 mol g−1 FW when compared with 1.93 mol g−1 FW for the control treatment, respectively).

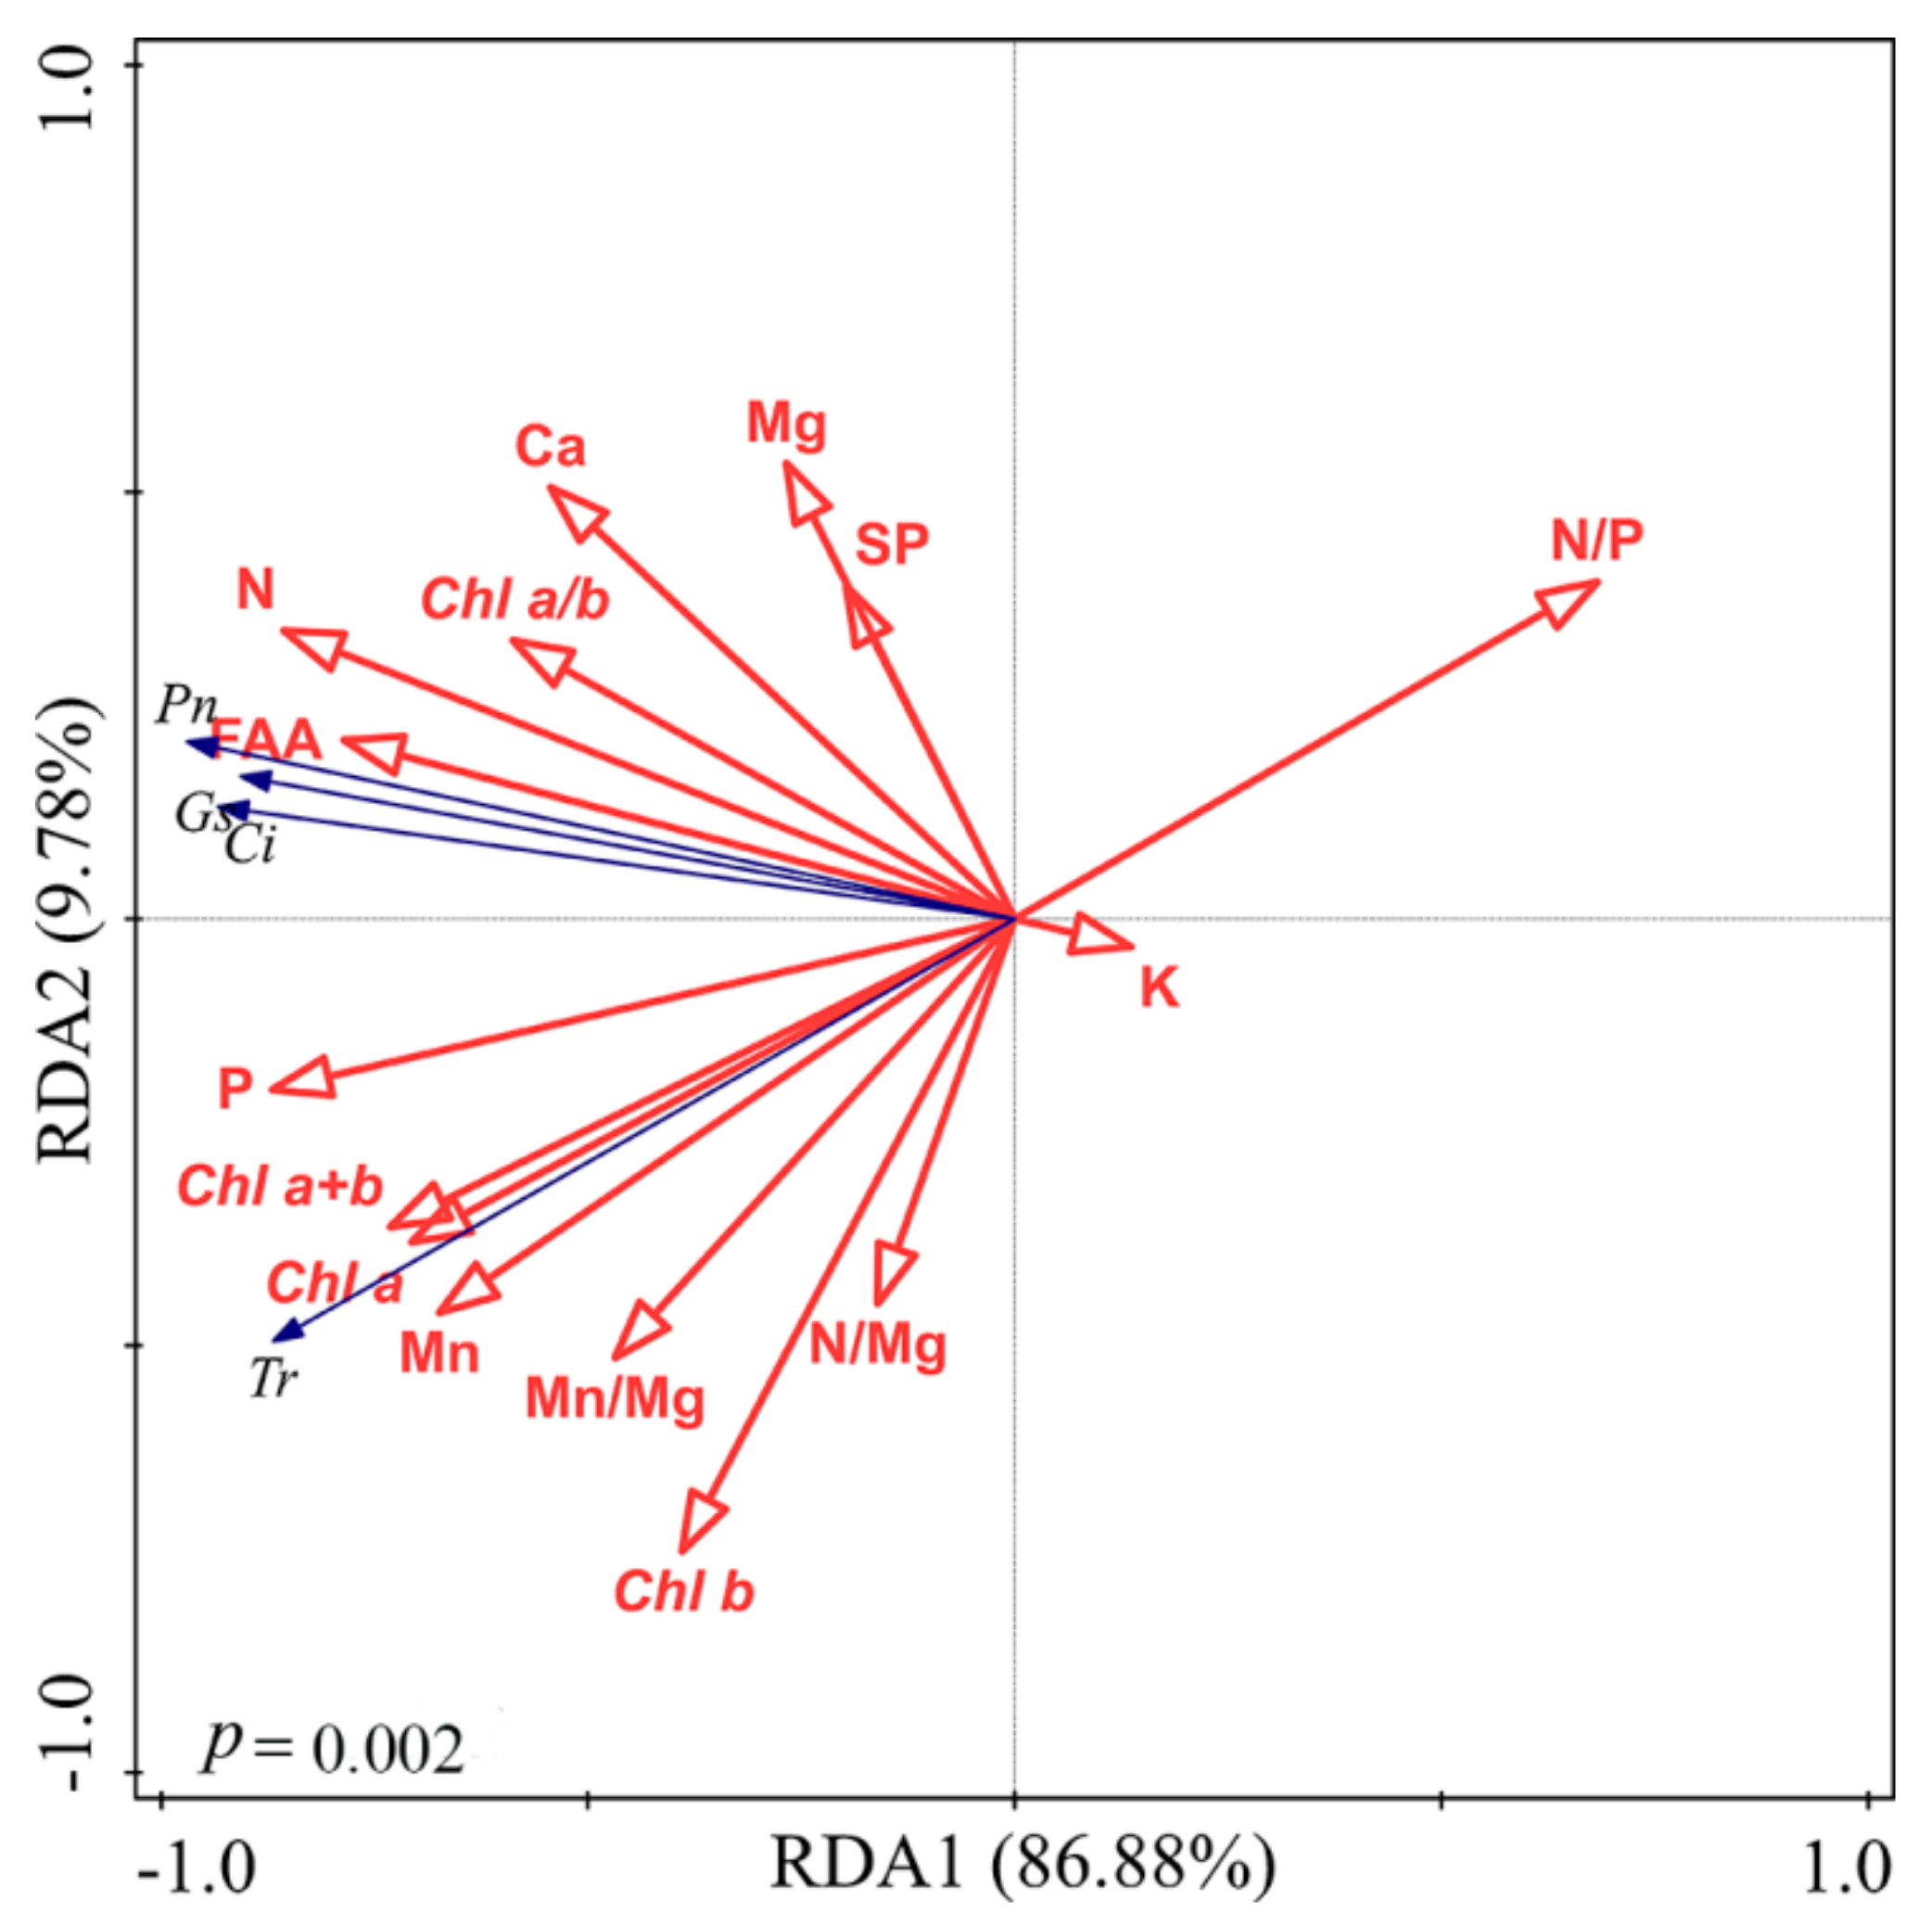
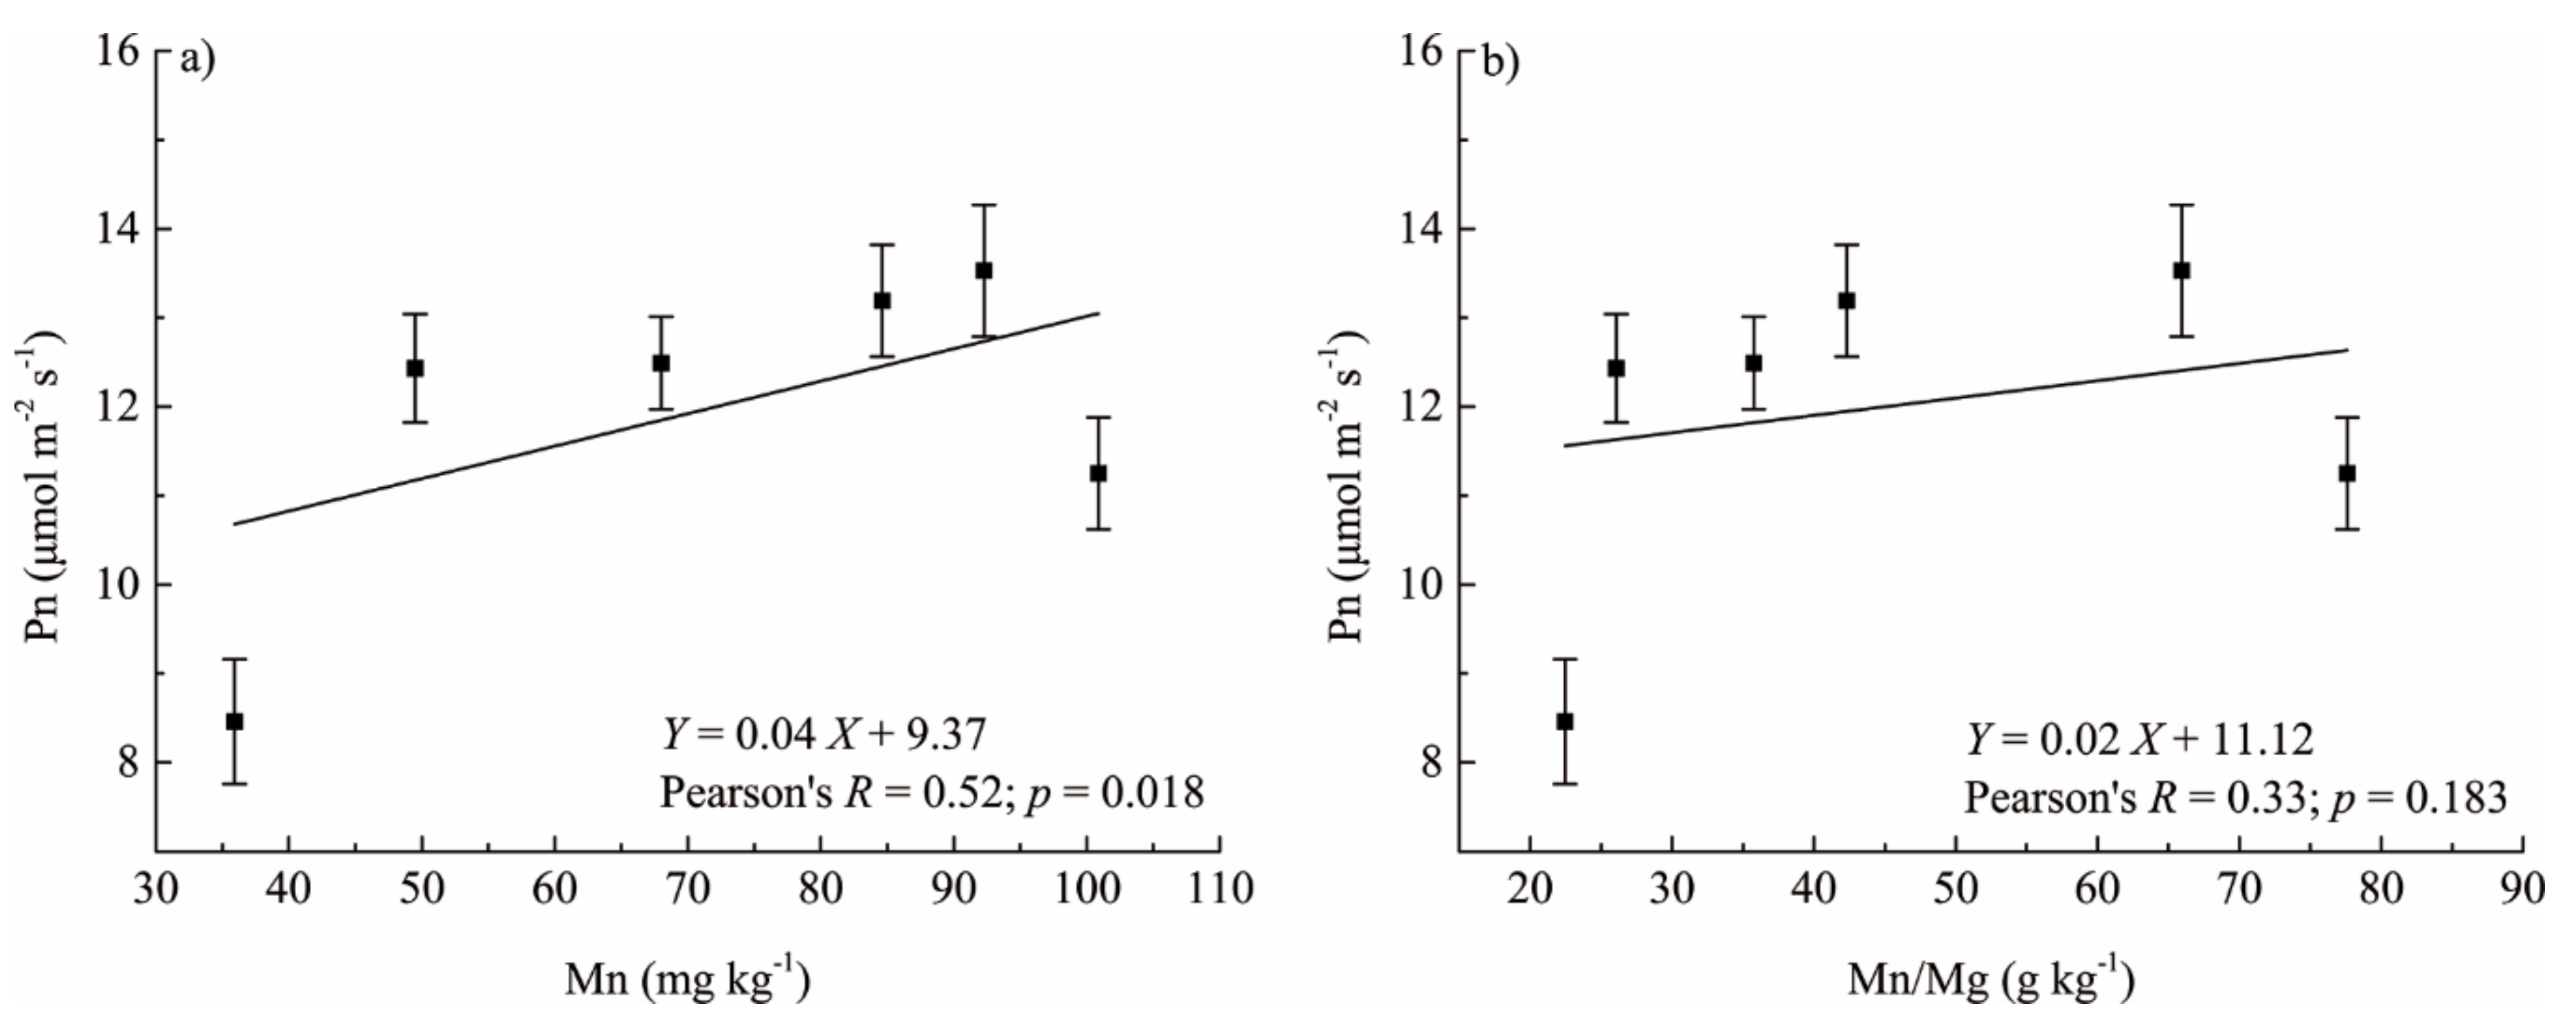
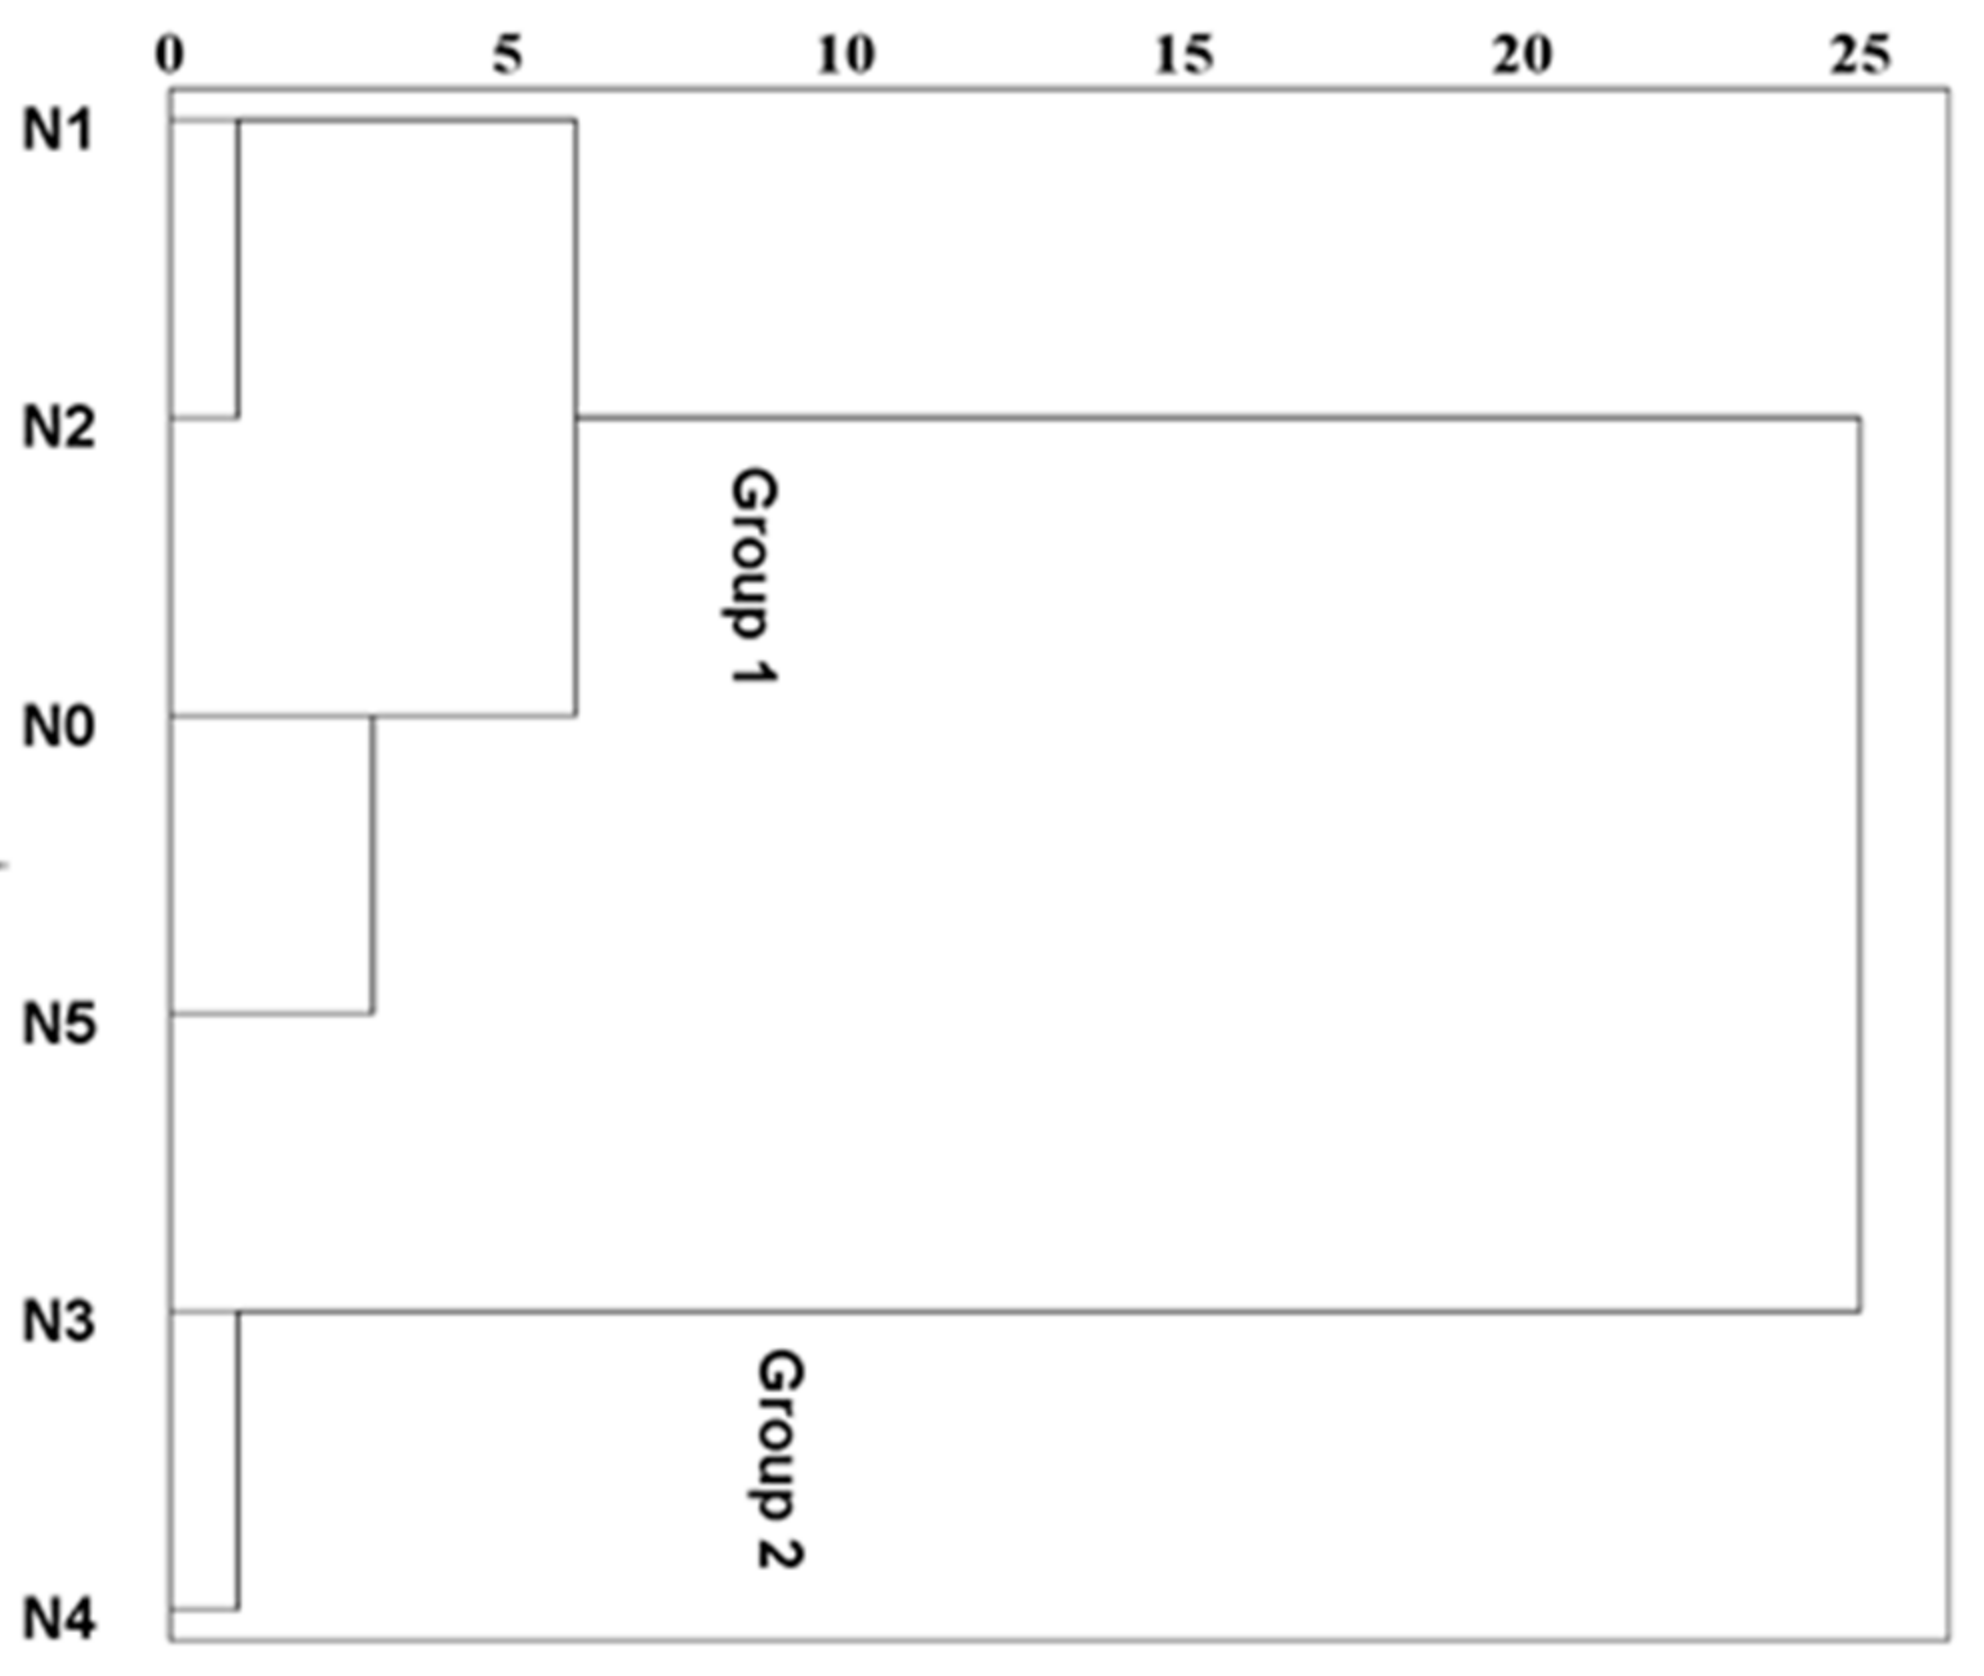
3.4. Multivariate Analysis

Regarding the relationships between foliar nutrient status, N metabolites, and photosynthetic parameters, the redundancy analysis ordination biplot is shown in Figure 3. In the RDA of foliar nutrient status and N metabolites with the photosynthetic parameters as the explanatory variables, Axis 1 accounted for 86.88% of the variation in the dataset, with 9.78% of the variation accounted for by Axis 2 (Figure 3). Foliar K concentration and foliar N/P ratio formed negative associations with the photosynthetic parameter (Pn, Gs, Tr, Ci). Foliar Mn/Mg ratio; needle concentrations of N, P, Ca, Mg, Mn; free amino acid; and chlorophyll were positively correlated with Pn, Gs, Tr, and Ci.
Correlation analysis was performed to complement the relationships between the foliar Mn concentration, Mn/Mg ratio, and net photosynthesis rate found in RDA. Figure 4 revealed a positive relationship between the net photosynthetic rate and foliar Mn concentration (p = 0.018) and Mn/Mg ratio (p = 0.183).
Cluster analysis was used to classify the effects of N treatments on foliar physiological traits. Figure 5 has shown that the effects of N1 and N2 were similar, the effects of N0 and N5 were similar, and the effects of N3 and N4 were similar. In this study, the tree diagram was divided into two groups (Figure 5). Group 1 consisted of N1 and N2 (low-N addition), and N0 and N5 (high-N addition) treatments, suggesting relatively low leaf physiological traits. These results also indicate the importance of the moderate N supply in the studied area. Group 2 contained the N3 and N4 treatments (middle-N addition). The mentioned N3 and N4 treatments seemed to result in better leaf physiological traits.

4. Discussion

4.1. Responses of Foliar Elements and N Metabolites

This study was conducted to provide scientific information on the responses of Cupressus lusitanica Mill. leaf physiological traits to different levels of N addition in terms of foliar nutrient status, photosynthetic parameters and pigment, soluble protein, and free amino acid. The results showed that elevated N deposition led to significant increases in foliar N concentrations under low- and middle-N addition. This result was in line with the findings of Mao et al. (2018) [24], where N addition significantly increased foliar N in N-rich subtropical forest ecosystems. Contrary to the increase in foliar N content under high N deposition shown in Mao et al. (2018) [24], our results revealed that the foliar N concentration of Cupressus lusitanica Mill. showed a significant decrease at a high N deposition rate when compared to middle-N addition. The potential reasons for this could involve the following. Firstly, it has been suggested that foliar N is directly related to soil N supply [53], which could be influenced by N-induced soil acidification [54] and decreasing litter decomposition [55]. In this study, the soil total N concentration was significantly lower in the N5 treatment than in the N4 treatment (0.17% ± 0.02% for the N5 treatment when compared with 0.22% ± 0.01% for the N4 treatment). Decreases in soil N availability in turn led to declines in foliar N concentration. Secondly, some studies have suggested that the dilution effects of needle element concentrations due to increases in needle mass are expected to decrease the N concentration [56,57].
This study further found that N enrichment had little effect on foliar K concentration, which was consistent with in-site fertilization experiments in Northwestern USA [58]. However, foliar P, Ca, and Mg concentration significantly decreased under high-level N deposition. In line with numerous reports [24,59,60], these results indicate that excess N-induced soil acidification resulted in plant nutrient imbalance. In fact, after a two-year N supply, the average value of soil pH decreased from 5.7 to 4.5 in the N5 plot. Soil acidification caused by the nitrification of NH4+ and subsequent NO3 leaching may trigger the leaching of base cations, exacerbating cation depletion. In addition, the decreased root uptake of K, Ca, and Mg may arise from ion competition with NH4+ [57]. Significant increases in the N/Mg ratio resulting from high N deposition (Table 1) further supported nutrient imbalance. Declines in the concentrations of foliar K, Ca, and Mg concentration resulting from strong antagonism have been frequently reported in many tree species [57,61,62]. Our findings suggest that the N-induced soil base cation depletion could affect the nutrient supply to plants, which provides new insight into nutrient imbalance in tropical forests.
In this study, concentrations of free amino acid and soluble protein showed increases under low- and medium-level N addition (Figure 2), indicating that short-term (two years) N addition may lead to increases of foliar N assimilation in N-rich subtropical forests. This result was further supported by other N deposition studies, where plants growing in N-rich ecosystems still had the capacity to assimilate external inorganic N inputs [24,25,63]. However, concentrations of free amino acid and soluble protein were significantly lower under high N addition than in middle-level N (Figure 2). This result is supported by numerous reports [24,27,52], where photosynthesis, starch accumulation, and protein synthesis were all inhibited to some degree during high N deposition. To mitigate inorganic N toxicity, plants always regulate the N metabolism level by allocating substantial N to protein, chlorophyll, and/or amino acids [23,27,64]. Consequently, concentrations of free amino acid were significantly higher in the N5 treatment than in the control plot (Figure 2b). However, concentrations of soluble protein were significantly lower in the N5 treatment than in the control plot (Figure 2a). The loss in soluble protein may be due to the observed increases in free amino acid, which may act as a storage compound for both carbon and nitrogen during high N deposition.

4.2. Responses of Foliar Photosynthetic Capacity

This study further found that low- and middle-level N addition led to a significant increase in photosynthetic parameters (Figure 1). This could be attributed to the significant increases of leaf N. Up to 75% of leaf nitrogen is found in the chloroplasts, and most of it is invested in ribulose bisphosphate carboxilase [65,66]. Consequently, under the condition of high nitrogen availability, significant increases in chlorophyll content and Rubisco activity account for notably higher photosynthesis (Figure 1). However, photosynthetic parameters were notably reduced under high N supply in the Cupressus lusitanica Mill. plantation (Figure 1). These results were supported by the findings in N-limited temperate forests [34,67,68], where an adequate N supply generally increased photosynthetic capacity, but net photosynthesis and growth were suppressed by excessive N addition. The reduction in photosynthetic efficiency may be due to the following three reasons.
First, a high N supply significantly decreased stomatal conductance and the transpiration rate (Figure 1b,c), which generally limited CO2 entry and net photosynthesis [33]. In this study, we observed that reductions of stomatal conductance and the transpiration rate occurred simultaneously with a decline in the net photosynthesis rate (Figure 1). Furthermore, a significant reduction of stomatal conductance under high N deposition may lead to inhibition effects on the CO2 photosynthetic assimilation capacity, which is positively related to the net photosynthesis rate [69].
Second, concentrations of chlorophyll significantly decreased under high N deposition. Glutamate is considered as one of the starting materials for chlorophyll a biosynthesis [70], and its synthesis is reliant on the activity of glutamine synthetase (GS, E.C.6.3.1.2) [71]. The glutamine synthetase activity was previously shown to be the limiting step of the photo-respiratory pathway [72]. In this study, GS activity was significantly lower in the N5 treatment than in the N4 treatment (0.33 μmol s−1 L−1 ± 0.01 for the N5 treatment when compared with 0.37 μmol s−1 L−1 ± 0.02 for the N4 treatment). This conclusion indicated that high N deposition (120 kg ha1 year1) resulted in a significant decline in GS activity. A significant reduction in GS activity led to a decrease in glutamate synthesis, which in turn resulted in a decline in chlorophyll a biosynthesis. Chlorophyll b is synthesized from chlorophyll a by the oxidation of a methyl group on the B ring of the latter molecule to a formyl group at that position [73,74]. Thus, a significant reduction of chlorophyll a concentrations under high N deposition led to a decrease in concentrations of chlorophyll b. The above processes were supported by our findings, showing that significant reductions in chlorophyll a, chlorophyll b, and Pn were found under high-level N addition (Table 2, Figure 1a). In line with numerous studies [40,69,75,76], Figure 3 revealed a positive relationship between the net photosynthetic rate and chlorophyll concentration. This finding further supported that photosynthetic capacity was reduced by declines in chlorophyll concentration.
Third, the increasing availability of N resulted in nutrient imbalances. Soil base cation competition was supported by a notable increase in the ratios of N/base cations (Table 1). Further correlation analysis revealed a negative relationship between the net photosynthetic rate and the ratios of N/P (Figure 3), which indicated that an increasing foliar N/P ratio may reduce photosynthetic capacity. In addition, NH4+ uptake by the roots may have an antagonistic effect on the uptake of K+, Ca2+, and Mg2+ [26]. Several studies have reported that foliar Ca and Mg concentrations play a vital role in regulating concentrations of chlorophyll and rubisco [19,20,30]. Consequently, reductions in foliar Ca and Mg concentration were always accompanied by decreases of net photosynthesis [24,25,77].
Manganese (Mn) is an essential mineral element for the normal growth and development of plants and plays a vital role in chlorophyll synthesis [78]. Several studies have reported that an adequate increment of manganese led to an increase in the growth and physiology of plants [79]. However, the structural breakdown of chloroplasts may occur under Mn deficiency conditions, and excessive Mn may result in severe reductions in net photosynthesis, chlorophyll concentration, and transpiration [80]. Soil acidification caused by excessive N input increased in foliar Mn concentration [81,82]. Significant increases in foliar Mn concentration were also accompanied by notable decreases in foliar Mg concentration and remarkable increases in the foliar Mn/Mg ratio (Table 1). Several studies have illustrated that increases in the foliar Mn concentration may decrease the binding capacity of Mg2+ to rubisco, leading to an inhibition effect on rubisco activity [61,83,84]. Nakaji et al. (2001) also found that a foliar Mn/Mg ratio above a critical threshold decreased the specific rubisco activity of Pinus densiflora Siebold & Zucc. seedlings [61]. These inhibition effects on rubisco activity may induce reductions of the net photosynthetic rate. However, Figure 4 revealed a positive relationship between the net photosynthetic rate and foliar Mn concentration (p = 0.018) and Mn/Mg ratio (p = 0.183). This conclusion indicated that reductions in the net photosynthetic rate may not be due to increases in the foliar Mn concentration and Mn/Mg ratio. Our results may be attributed to the physiological responses of Cupressus lusitanica Mill. to Mn accumulation. So far, less is known about the effects of Mn accumulation on photosynthesis in Cupressus lusitanica Mill. Additionally, the critical threshold of the foliar Mn/Mg ratio in Cupressus lusitanica Mill. needs further exploration.

5. Conclusions

The present study examined the responses of foliar nutrient status, photosynthetic properties, and N metabolites to different-level N depositions in a Cupressus lusitanica Mill. plantation. The results showed that two years of N addition led to significant increases in foliar N, but no significant increases in K concentration. Concentrations of foliar P, Ca, and Mg showed marked increases under low and middle-N supply, while they notably decreased under high N deposition. Nitrogen addition also significantly increased the photosynthesis capacity under low- and middle-N supply. However, the photosynthetic parameters and chlorophyll concentration significantly declined at a high N deposition rate. Similar to the alterations of photosynthetic parameters, high N deposition resulted in a significant decline in N accumulation, mainly as soluble protein and free amino acid, while soluble protein and free amino acid markedly increased under low- and middle-N supply. This study further found that the reductions of photosynthetic capacity were correlated with increases of the foliar K concentration and foliar N/P ratio, and decreases of the foliar N, P, Ca, and Mg concentration; foliar Mn/Mg ratio; and free amino acid. Furthermore, a significantly positive relationship between the net photosynthesis rate and foliar Mn concentration was found. These findings suggest that excess N inputs can promote nutrient imbalances and inhibit the photosynthetic capacity of Cupressus lusitanica Mill., indicating that high N deposition could threaten plant growth in tropical forests in the future. Meanwhile, tracking the effects of high N deposition on the relationship between foliar Mn accumulation and photosynthesis in Cupressus lusitanica Mill. merits further study.

Author Contributions

R.L. and Y.L. designed the study and conducted the field trial; R.L., Y.L., Y.W., and X.P. were responsible for collecting the samples and laboratory analysis; R.L. was responsible for the statistical analyses with contributions from F.W.; and R.L. wrote the paper.

Funding

This study was carried out with the support of the Jiangsu Provincial Forestry Sanxin Project under Grant No. LYSX[2015]20 and Priority Academy Program Development of Jiangsu Higher Education Institution (PAPD).

Conflicts of Interest

The authors declare no conflict of interest.

References

  1. Erisman, J.W.; Galloway, J.N.; Seitzinger, S.; Bleeker, A.; Dise, N.B.; Petrescu, A.R.; Leach, A.M.; de Vries, W. Consequences of human modification of the global nitrogen cycle. Philos. Trans. R. Soc. B 2013, 368. [Google Scholar] [CrossRef] [PubMed]
  2. Kim, T.; Lee, K.; Najjar, R.G.; Jeong, H.; Jeong, H.J. Increasing N abundance in the northwestern Pacific Ocean due to atmospheric nitrogen deposition. Science 2011, 334, 505–509. [Google Scholar] [CrossRef] [PubMed]
  3. Galloway, J.N.; Townsend, A.R.; Erisman, J.W.; Bekunda, M.; Cai, Z.; Freney, J.R.; Martinelli, L.A.; Seitzinger, S.P.; Sutton, M.A. Transformation of the nitrogen cycle: Recent trends, questions, and potential solutions. Science 2008, 320, 889–892. [Google Scholar] [CrossRef] [PubMed]
  4. Liu, X.; Zhang, Y.; Han, W.; Tang, A.; Shen, J.; Cui, Z.; Vitousek, P.; Erisman, J.W.; Goulding, K.; Christie, P. Enhanced nitrogen deposition over China. Nature 2013, 494, 459. [Google Scholar] [CrossRef] [PubMed]
  5. Liu, X.; Duan, L.; Mo, J.; Du, E.; Shen, J.; Lu, X.; Zhang, Y.; Zhou, X.; He, C.; Zhang, F. Nitrogen deposition and its ecological impact in China: An overview. Environ. Pollut. 2011, 159, 2251–2264. [Google Scholar] [CrossRef] [PubMed]
  6. Zhao, Y.; Zhang, L.; Chen, Y.; Liu, X.; Xu, W.; Pan, Y.; Duan, L. Atmospheric nitrogen deposition to China: A model analysis on nitrogen budget and critical load exceedance. Atmos. Environ. 2017, 153, 32–40. [Google Scholar] [CrossRef]
  7. Jia, Y.; Yu, G.; He, N.; Zhan, X.; Fang, H.; Sheng, W.; Zuo, Y.; Zhang, D.; Wang, Q. Spatial and decadal variations in inorganic nitrogen wet deposition in China induced by human activity. Sci. Rep. 2014, 4, 3763. [Google Scholar] [CrossRef] [PubMed]
  8. Lu, X.; Gilliam, F.S.; Yu, G.; Li, L. Long-term nitrogen addition decreases carbon leaching in nitrogen-rich forest ecosystems. Biogeosciences 2013, 10, 3931–3941. [Google Scholar] [CrossRef]
  9. Lü, C.; Tian, H. Spatial and temporal patterns of nitrogen deposition in China: Synthesis of observational data. J. Geophys. Res. Atmos. 2007, 112. [Google Scholar] [CrossRef] [Green Version]
  10. Clark, C.M.; Tilman, D. Loss of plant species after chronic low-level nitrogen deposition to prairie grasslands. Nature 2008, 451, 712. [Google Scholar] [CrossRef] [PubMed]
  11. Richter, A.; Burrows, J.P.; Nüß, H.; Granier, C.; Niemeier, U. Increase in tropospheric nitrogen dioxide over China observed from space. Nature 2005, 437, 129. [Google Scholar] [CrossRef] [PubMed]
  12. Matson, P.; Lohse, K.A.; Hall, S.J. The globalization of nitrogen deposition: Consequences for terrestrial ecosystems. AMBIO 2002, 31, 113–119. [Google Scholar] [CrossRef] [PubMed]
  13. Vitousek, P.M.; Aber, J.D.; Howarth, R.W.; Likens, G.E.; Matson, P.A.; Schindler, D.W.; Schlesinger, W.H.; Tilman, D.G. Human alteration of the global nitrogen cycle: Sources and consequences. Ecol. Appl. 1997, 7, 737–750. [Google Scholar] [CrossRef]
  14. Hawkins, B.J.; Jones, M.D.; Kranabetter, J.M. Ectomycorrhizae and tree seedling nitrogen nutrition in forest restoration. New For. 2015, 46, 747–771. [Google Scholar] [CrossRef]
  15. Soudzilovskaia, N.A.; Douma, J.C.; Akhmetzhanova, A.A.; Bodegom, P.M.; Cornwell, W.K.; Moens, E.J.; Treseder, K.K.; Tibbett, M.; Wang, Y.P.; Cornelissen, J.H.C. Global patterns of plant root colonization intensity by mycorrhizal fungi explained by climate and soil chemistry. Glob. Ecol. Biogeogr. 2015, 24, 371–382. [Google Scholar] [CrossRef]
  16. Rai, M.; Rathod, D.; Agarkar, G.; Dar, M.; Brestic, M.; Pastore, G.M.; Junior, M.R.M. Fungal growth promotor endophytes: A pragmatic approach towards sustainable food and agriculture. Symbiosis 2014, 62, 63–79. [Google Scholar] [CrossRef]
  17. Simard, S.W.; Beiler, K.J.; Bingham, M.A.; Deslippe, J.R.; Philip, L.J.; Teste, F.P. Mycorrhizal networks: Mechanisms, ecology and modelling. Fungal Biol. Rev. 2012, 26, 39–60. [Google Scholar] [CrossRef]
  18. Taylor, A.F.S.; Gebauer, G.; Read, D.J. Uptake of nitrogen and carbon from double-labelled (15N and 13C) glycine by mycorrhizal pine seedlings. New Phytol. 2004, 164, 383–388. [Google Scholar] [CrossRef]
  19. Binkley, D.; Högberg, P. Tamm Review: Revisiting the influence of nitrogen deposition on Swedish forests. For. Ecol. Manag. 2016, 368, 222–239. [Google Scholar] [CrossRef]
  20. Lu, X.; Mao, Q.; Mo, J.; Gilliam, F.S.; Zhou, G.; Luo, Y.; Zhang, W.; Huang, J. Divergent responses of soil buffering capacity to long-term N deposition in three typical tropical forests with different land-use history. Environ. Sci. Technol. 2015, 49, 4072–4080. [Google Scholar] [CrossRef] [PubMed]
  21. Talhelm, A.F.; Pregitzer, K.S.; Burton, A.J. No evidence that chronic nitrogen additions increase photosynthesis in mature sugar maple forests. Ecol. Appl. 2011, 21, 2413–2424. [Google Scholar] [CrossRef] [PubMed]
  22. Lu, X.K.; Mo, J.M.; Franks, G.; Zhou, G.; Fang, Y. Effects of experimental nitrogen additions on plant diversity in an old-growth tropical forest. Glob. Chang. Biol. 2010, 16, 2688–2700. [Google Scholar] [CrossRef] [Green Version]
  23. Bauer, G.A.; Bazzaz, F.A.; Minocha, R.; Long, S.; Magill, A.; Aber, J.; Berntson, G.M. Effects of chronic N additions on tissue chemistry, photosynthetic capacity, and carbon sequestration potential of a red pine (Pinus resinosa Ait.) stand in the NE United States. For. Ecol. Manag. 2004, 196, 173–186. [Google Scholar] [CrossRef]
  24. Mao, Q.; Lu, X.; Mo, H.; Gundersen, P.; Mo, J. Effects of stimulated N deposition on foliar nutrient status, N metabolism and photosynthetic capacity of three dominant understory plant species in a mature tropical forest. Sci. Total Environ. 2018, 610, 555–562. [Google Scholar] [CrossRef] [PubMed]
  25. Mao, Q.; Lu, X.; Wang, C.; Zhou, K.; Mo, J. Responses of understory plant physiological traits to a decade of nitrogen addition in a tropical reforested ecosystem. For. Ecol. Manag. 2017, 401, 65–74. [Google Scholar] [CrossRef]
  26. Lu, X.; Mao, Q.; Gilliam, F.S.; Luo, Y.; Mo, J. Nitrogen deposition contributes to soil acidification in tropical ecosystems. Glob. Chang. Biol. 2014, 20, 3790–3801. [Google Scholar] [CrossRef] [PubMed] [Green Version]
  27. Bubier, J.L.; Smith, R.; Juutinen, S.; Moore, T.R.; Minocha, R.; Long, S.; Minocha, S. Effects of nutrient addition on leaf chemistry, morphology, and photosynthetic capacity of three bog shrubs. Oecologia 2011, 167, 355–368. [Google Scholar] [CrossRef] [PubMed]
  28. Lu, X.K.; Mo, J.M.; Gundersern, P.; Zhu, W.X.; Zhou, G.Y.; De-Jun, L.I.; Xu, Z. Effect of stimulated N deposition on soil exchangeable cations in three forest types of subtropical China. Pedosphere 2009, 19, 189–198. [Google Scholar] [CrossRef]
  29. Warren, C.R.; Mcgrath, J.F.; Adams, M.A. Differential effects of N, P and K on photosynthesis and partitioning of N in Pinus pinaster needles. Ann. For. Sci. 2005, 62, 1–8. [Google Scholar] [CrossRef]
  30. Magill, A.H.; Aber, J.D.; Berntson, G.M.; McDowell, W.H.; Nadelhoffer, K.J.; Melillo, J.M.; Steudler, P. Long-term nitrogen additions and nitrogen saturation in two temperate forests. Ecosystems 2000, 3, 238–253. [Google Scholar] [CrossRef]
  31. Pérezharguindeguy, N.; Díaz, S.; Garnier, E.; Lavorel, S.; Poorter, H.; Jaureguiberry, P.; Bretharte, M.S.; Cornwell, W.K.; Craine, J.M.; Gurvich, D.E. New handbook for standardized measurement of plant functional traits worldwide. Aust. J. Bot. 2013, 61, 167–234. [Google Scholar] [CrossRef]
  32. Wang, M.; Zhang, W.; Li, N.; Liu, Y.; Zheng, X.; Hao, G. Photosynthesis and growth responses of Fraxinus mandshurica Rupr. seedlings to a gradient of simulated nitrogen deposition. Ann. For. Sci. 2018, 75, 1. [Google Scholar] [CrossRef]
  33. Zeng, J.; Sheng, H.; Liu, Y.; Wang, Y.; Wang, Y.; Kang, H.; Fan, X.; Sha, L.; Yuan, S.; Zhou, Y. High nitrogen supply induces physiological responsiveness to long photoperiod in Barley. Front. Plant Sci. 2017, 8, 569. [Google Scholar] [CrossRef] [PubMed]
  34. Tavarini, S.; Pagano, I.; Guidi, L.; Angelini, L.G. Impact of nitrogen supply on growth, steviol glycosides and photosynthesis in Stevia rebaudiana Bertoni. Plant Biosyst. Int. J. Deal. Asp. Plant Biol. 2016, 150, 953–962. [Google Scholar]
  35. Nakaji, T.; Takenaga, S.; Kuroha, M.; Izuta, T. Photosynthetic response of Pines densiflora seedlings to high nitrogen load. Environ. Sci. 2002, 9, 269–282. [Google Scholar]
  36. Zhang, X.; Davidson, E.A.; Mauzerall, D.L.; Searchinger, T.D.; Dumas, P.; Shen, Y. Managing nitrogen for sustainable development. Nature 2015, 528, 51. [Google Scholar] [CrossRef] [PubMed]
  37. Garnier, E.; Navas, M. A trait-based approach to comparative functional plant ecology: Concepts, methods and applications for agroecology. A review. Agron. Sustain. Dev. 2012, 32, 365–399. [Google Scholar] [CrossRef]
  38. Brussaard, L.; Caron, P.; Campbell, B.; Lipper, L.; Mainka, S.; Rabbinge, R.; Babin, D.; Pulleman, M. Reconciling biodiversity conservation and food security: Scientific challenges for a new agriculture. Curr. Opin. Environ. Sustain. 2010, 2, 34–42. [Google Scholar] [CrossRef]
  39. Rose, L.; Rubarth, M.C.; Hertel, D.; Leuschner, C. Management alters interspecific leaf trait relationships and trait-based species rankings in permanent meadows. J. Veg. Sci. 2013, 24, 239–250. [Google Scholar] [CrossRef]
  40. Elvir, J.A.; Wiersma, G.B.; Day, M.E.; Greenwood, M.S.; Fernandez, I.J. Effects of enhanced nitrogen deposition on foliar chemistry and physiological processes of forest trees at the Bear Brook Watershed in Maine. For. Ecol. Manag. 2006, 221, 207–214. [Google Scholar] [CrossRef]
  41. Hood, I.A.; Gardner, J.F.; Hood, R.J.; Smith, B.M.; Phillips, G.D. Pruning and cypress canker in New Zealand. Australas. Plant Pathol. 2009, 38, 472–477. [Google Scholar] [CrossRef]
  42. Cai, Q.; Wan, F.-X. Research on cold tolerance of Cupressus lusitanica Mill. seedling. J. Anhui Agric. Sci. 2014, 9, 51. (In Chinese) [Google Scholar]
  43. Shen, F.; Yuan, Y.; Fan, H.; Liu, W.; Liu, Y. Effects of elevated nitrogen deposition on soil organic carbon mineralization and soil enzyme activities in a Chinese fir plantation. Acta Ecol. Sin. 2012, 32, 517–527. (In Chinese) [Google Scholar] [CrossRef]
  44. Qin, Y.W.; Wan, F.X. Effect of fertilization on seedlings growth of provenience of Cupressus lusitanica Mill. For. Sci. Tech. 2016, 5, 115–119. (In Chinese) [Google Scholar]
  45. Gu, T.H. Research on Salt Tolerance and Adaptability of Cupressus lusitanica Mill. Master’s Thesis, Nanjing Forestry University, Nanjing, China, 2011. [Google Scholar]
  46. Bao, H. Studies on Growth Rhytm and Photosynthesis Characteristics of Cupressus lusitanica Mill. Master’s Thesis, Nanjing Forestry University, Nanjing, China, 2012. [Google Scholar]
  47. Hu, L. A Study on Fertilizer Effect of Populus tomentosa Carr. Plantation. Master’s Thesis, Beijing Forestry University, Beijing, China, 2010. [Google Scholar]
  48. Li, W. Growth and Physiological Responses of Betula platyphylla to Fertilization in Juvenile Plantation. Master’s Thesis, Northeast Forestry University, Changchun, China, 2015. [Google Scholar]
  49. Dang, Y.C. Soil Microorganism and Soil Enzyme Response of Fertilization in Young Poplar Forest. Master’s Thesis, Sichuan Agriculture University, Sichuan, China, 2012. [Google Scholar]
  50. Wellburn, A.R. The spectral determination of chlorophylls a and b, as well as total carotenoids, using various solvents with spectrophotometers of different resolution. J. Plant Physiol. 1994, 144, 307–313. [Google Scholar] [CrossRef]
  51. Xu, Z.Z.; Zhou, G.S. Nitrogen metabolism and photosynthesis in Leymus chinensis in response to long-term soil drought. J. Plant Growth Regul. 2006, 25, 252–266. [Google Scholar] [CrossRef]
  52. Barnett, N.M.; Naylor, A.W. Amino acid and protein metabolism in Bermuda grass during water stress. Plant Physiol. 1966, 41, 1222–1230. [Google Scholar] [CrossRef] [PubMed]
  53. Cleveland, C.C.; Townsend, A.R.; Taylor, P.; Alvarez Clare, S.; Bustamante, M.; Chuyong, G.; Dobrowski, S.Z.; Grierson, P.; Harms, K.E.; Houlton, B.Z. Relationships among net primary productivity, nutrients and climate in tropical rain forest: A pan-tropical analysis. Ecol. Lett. 2011, 14, 939–947. [Google Scholar] [CrossRef] [PubMed]
  54. Matson, P.A.; McDowell, W.H.; Townsend, A.R.; Vitousek, P.M. The globalization of N deposition: Ecosystem consequences in tropical environments. Biochemistry 1999, 46, 67–83. [Google Scholar]
  55. Lu, X.; Mo, J.; Gilliam, F.S.; Fang, H.; Zhu, F.; Fang, Y.; Zhang, W.; Huang, J. Nitrogen addition shapes soil phosphorus availability in two reforested tropical forests in southern China. Biotropica 2012, 44, 302–311. [Google Scholar] [CrossRef]
  56. Wallander, H.; Nylund, J. Effects of excess nitrogen and phosphorus starvation on the extramatrical mycelium of ectomycorrhizas of Pinus sylvestris L. New Phytol. 1992, 120, 495–503. [Google Scholar] [CrossRef]
  57. Schulze, E. Air pollution and forest decline in a spruce (Picea abies) forest. Science 1989, 244, 776–783. [Google Scholar] [CrossRef] [PubMed]
  58. VanderSchaaf, C.L.; Moore, J.A.; Kingery, J.L. The effect of multi-nutrient fertilization on understory vegetation nutrient concentrations in inland Northwest conifer stands. For. Ecol. Manag. 2004, 190, 201–218. [Google Scholar] [CrossRef]
  59. Jeong, J.; Jo, C.G.; Baek, G.W.; Park, J.; Ma, H.; Yoo, B.O.; Kim, C. Soil and the foliage nutrient status following soil amendment applications in a Japanese cypress (Chamaecyparis obtusa Endlicher) plantation. J. Sustain. For. 2017, 36, 289–303. [Google Scholar] [CrossRef]
  60. Wortman, E.; Tomaszewski, T.; Waldner, P.; Schleppi, P.; Thimonier, A.; Eugster, W.; Buchmann, N.; Sievering, H. Atmospheric nitrogen deposition and canopy retention influences on photosynthetic performance at two high nitrogen deposition Swiss forests. Tellus B Chem. Phys. Meteorol. 2012, 64. [Google Scholar] [CrossRef]
  61. Nakaji, T.; Fukami, M.; Dokiya, Y.; Izuta, T. Effects of high nitrogen load on growth, photosynthesis and nutrient status of Cryptomeria japonica and Pinus densiflora seedlings. Trees 2001, 15, 453–461. [Google Scholar]
  62. Diem, B.; Godbold, D.L. Potassium, calcium and magnesium antagonism in clones of Populus trichocarpa. Plant Soil 1993, 155, 411–414. [Google Scholar] [CrossRef]
  63. Gurmesa, G.A.; Lu, X.; Gundersen, P.; Mao, Q.; Zhou, K.; Fang, Y.; Mo, J. High retention of 15N-labeled nitrogen deposition in a nitrogen saturated old-growth tropical forest. Glob. Chang. Biol. 2016, 22, 3608–3620. [Google Scholar] [CrossRef] [PubMed]
  64. Näsholm, T.; Ericsson, A.; Nordén, L.G. Accumulation of amino acids in some boreal forest plants in response to increased nitrogen availability. New Phytol. 1994, 126, 137–143. [Google Scholar] [CrossRef] [Green Version]
  65. Hák, R.; Rinderle-Zimmer, U.; Lichtenthaler, H.K.; Nátr, L. Chlorophyll a fluorescence signatures of nitrogen deficient barley leaves. Photosynthetica 1993, 28, 151–159. [Google Scholar]
  66. Brown, H.R. A difference in N use efficiency in C3 and C4 plants and its implications in adaptation and evolution. Crop Sci. 1978, 18, 105–115. [Google Scholar] [CrossRef]
  67. Guo, J.; Wu, Y.; Wang, B.; Lu, Y.; Cao, F.; Wang, G. The effects of fertilization on the growth and physiological characteristics of Ginkgo biloba L. Forests 2016, 7, 293. [Google Scholar] [CrossRef]
  68. Yan, H.; Wu, Q.; Ding, J.; Zhang, S.R. Effects of precipitation and nitrogen addition on photosynthetically eco-physiological characteristics and biomass of four tree seedlings in Gutian Mountain, Zhejiang Province, China. Acta Ecol. Sin. 2013, 33, 4226–4236. [Google Scholar] [CrossRef]
  69. Boussadia, O.; Steppe, K.; Zgallai, H.; El Hadj, S.B.; Braham, M.; Lemeur, R.; Van Labeke, M. Effects of nitrogen deficiency on leaf photosynthesis, carbohydrate status and biomass production in two olive cultivars ‘Meski’and ‘Koroneiki’. Sci. Hortic. 2010, 123, 336–342. [Google Scholar] [CrossRef]
  70. Von Wettstein, D.; Gough, S.; Kannangara, C.G. Chlorophyll biosynthesis. Plant Cell 1995, 7, 1039. [Google Scholar] [CrossRef] [PubMed]
  71. Shah, J.M.; Bukhari, S.A.H.; Zeng, J.; Quan, X.; Ali, E.; Muhammad, N.; Zhang, G. Nitrogen (N) metabolism related enzyme activities, cell ultrastructure and nutrient contents as affected by N level and barley genotype. J. Integr. Agric. 2017, 16, 190–198. [Google Scholar] [CrossRef]
  72. Brestic, M.; Zivcak, M.; Olsovska, K.; Shao, H.B.; Kalaji, H.M.; Allakhverdiev, S.I. Reduced glutamine synthetase activity plays a role in control of photosynthetic responses to high light in barley leaves. Plant Physiol. Biochem. 2014, 81, 74–83. [Google Scholar] [CrossRef] [PubMed] [Green Version]
  73. Biswal, A.K.; Pattanayak, G.K.; Pandey, S.S.; Leelavathi, S.; Reddy, V.S.; Govindjee, X.; Tripathy, B.C. Light intensity-dependent modulation of chlorophyll b biosynthesis and photosynthesis by overexpression of chlorophyll a oxygenase (CAO) in tobacco. Plant Physiol. 2012. [Google Scholar] [CrossRef] [PubMed]
  74. Porra, R.J.; Schäfer, W.; Cmiel, E.; Katheder, I.; Scheer, H. Derivation of the formyl-group oxygen of chlorophyll b from molecular oxygen in greening leaves of a higher plant (Zea mays). FEBS Lett. 1993, 323, 31–34. [Google Scholar] [CrossRef] [Green Version]
  75. Cechin, I.; Fumis, T. Effect of nitrogen supply on growth and photosynthesis of sunflower plants grown in the greenhouse. Plant Sci. 2004, 166, 1379–1385. [Google Scholar] [CrossRef] [Green Version]
  76. Kalaji, H.M.; Oukarroum, A.; Alexandrov, V.; Kouzmanova, M.; Brestic, M.; Zivcak, M.; Samborska, I.A.; Cetner, M.D.; Allakhverdiev, S.I.; Goltsev, V. Identification of nutrient deficiency in maize and tomato plants by in vivo chlorophyll a fluorescence measurements. Plant Physiol. Biochem. 2014, 81, 16–25. [Google Scholar] [CrossRef] [PubMed]
  77. Laing, W.; Greer, D.; Sun, O.; Beets, P.; Lowe, A.; Payn, T. Physiological impacts of Mg deficiency in Pinus radiata: Growth and photosynthesis. New Phytol. 2000, 146, 47–57. [Google Scholar] [CrossRef]
  78. McHargue, J.S. The role of manganese in plants 1. J. Am. Chem. Soc. 1922, 44, 1592–1598. [Google Scholar] [CrossRef]
  79. Sherman, J.; Heerema, R.J.; VanLeeuwen, D.; Hilaire, R.S. Optimal manganese nutrition increases photosynthesis of immature Pecan trees. HortScience 2017, 52, 634–640. [Google Scholar] [CrossRef]
  80. Ohki, K. Manganese deficiency and toxicity effects on photosynthesis, chlorophyll, and transpiration in Wheat 1. Crop Sci. 1985, 25, 187–191. [Google Scholar] [CrossRef]
  81. Flückiger, W.; Braun, S. Nitrogen deposition in Swiss forests and its possible relevance for leaf nutrient status, parasite attacks and soil acidification. In Proceedings of the Nitrogen, the Confer-N-s: First International Nitrogen Conference, Noordwijkerhout, The Netherlands, 23–27 March 1998; pp. 69–76. [Google Scholar] [CrossRef]
  82. Wilson, E.J.; Skeffington, R.A. The effects of excess nitrogen deposition on young Norway spruce trees. Part II The vegetation. Environ. Pollut. 1994, 86, 153–160. [Google Scholar] [CrossRef]
  83. Houtz, R.L.; Nable, R.O.; Cheniae, G.M. Evidence for effects on the in vivo activity of ribulose-bisphosphate carboxylase/oxygenase during development of Mn toxicity in tobacco. Plant Physiol. 1988, 86, 1143–1149. [Google Scholar] [CrossRef] [PubMed]
  84. Jordan, D.B.; Ogren, W.L. A sensitive assay procedure for simultaneous determination of ribulose-1, 5-bisphosphate carboxylase and oxygenase activities. Plant Physiol. 1981, 67, 237–245. [Google Scholar] [CrossRef] [PubMed]
Figure 1. Effects of N treatments on the net photosynthesis rate (Pn, a), stomatal conductance (Gs, b), transpiration rate (Tr, c), and intercellular CO2 concentration (Ci, d) in leaves of Cupressus lusitanica Mill. Notes: Values shown are the mean ± S.E. (n = 3); Different letters indicate significant differences at p < 0.05 among different N treatments.
Forests 09 00483 g001
Figure 2. Effects of N treatments on the content of soluble protein (a) and free amino acid (b) in leaves of Cupressus lusitanica Mill. Notes: Values shown are the mean ± S.E. (n = 3); Different letters indicate significant differences at p < 0.05 among the different N treatments.
Forests 09 00483 g002
Figure 3. Redundancy analysis (RDA) of photosynthetic parameters and N metabolites, and foliar nutrient status. The angle and length of the arrows indicate the respective direction and strength of the relationship of the photosynthetic parameters and N metabolites, and foliar nutrient status. Abbreviations: SP, Soluble protein; FAA, Free amino acid.
Forests 09 00483 g003
Figure 4. Relationships between the net photosynthesis rate (Pn, a) and foliar Mn (b) concentration, and Mn/Mg ratio for Cupressus lusitanica Mill. Symbols represent the mean (±SE) values of Pn for the three replicate composites at a given nitrogen treatment.
Forests 09 00483 g004
Figure 5. Cluster analysis of the influence of different N levels on leaf physiological traits.
Forests 09 00483 g005
Table 1. Effects of different N supply rates on the mean (±SE) values of foliar nutrient status.
TreatmentN (%)P (%)K (%)Ca (%)Mg (%)Mn (mg kg−1)N/PN/MgMn/Mg (g kg−1)
N01.24 ± 0.01 c0.14 ± 0.01 c0.68 ± 0.05 a0.64 ± 0.03 c0.16 ± 0.02 b35.93 ± 3.30 d8.86 ± 1.01 a7.75 ± 0.28 b22.46 ± 2.17 e
N11.40 ± 0.04 a0.16 ± 0.01 ab0.63 ± 0.03 a1.19 ± 0.14 a0.19 ± 0.02 a49.51 ± 6.78 cd8.75 ± 1.10 ab7.37 ± 1.00 b26.06 ± 2.65 de
N21.40 ± 0.03 a0.17 ± 0.01 ab0.61 ± 0.02 a1.22 ± 0.03 a0.19 ± 0.01 a67.99 ± 7.31 bc8.23 ± 0.99 ab7.37 ± 0.22 b35.78 ± 4.00 cd
N31.39 ± 0.01 a0.19 ± 0.02 ab0.60 ± 0.02 a1.08 ± 0.15 ab0.20 ± 0.02 a84.61 ± 8.00 ab7.31 ± 1.00 ab6.95 ± 0.49 b42.31 ± 5.37 c
N41.39 ± 0.07 a0.22 ± 0.02 a0.58 ± 0.02 a0.94 ± 0.04 b0.14 ± 0.01 c92.29 ± 5.76 a6.32 ± 0.50 b9.93 ± 0.93 a65.92 ± 8.21 b
N51.33 ± 0.04 b0.15 ± 0.01 b0.58 ± 0.01 a0.52 ± 0.02 c0.13 ± 0.08 c100.87 ± 6.13 a8.86 ± 0.73 ab10.23 ± 0.56 a77.59 ± 7.13 a
Note: Different letters in each column represent significant differences between different N additions (p < 0.05; Duncan’s test).
Table 2. Effects of different N supply rates on the mean (±SE) values of foliar chlorophyll concentration.
TreatmentChl a (mg g−1)Chl b (mg g−1)Chl a + b (mg g−1)Chl a/b
N00.51 ± 0.01 bc0.12 ± 0.000 cd0.63 ± 0.01 c4.38 ± 0.11 bc
N10.58 ± 0.05 c0.09 ± 0.003 d0.67 ± 0.05 c6.80 ± 0.41 a
N20.59 ± 0.04 c0.13 ± 0.007 cd0.72 ± 0.04 c4.59 ± 0.37 b
N30.97 ± 0.07 a0.14 ± 0.008 b1.11 ± 0.10 a7.07 ± 0.45 a
N41.01 ± 0.01 a0.19 ± 0.002 a1.20 ± 0.01 a7.11 ± 0.19 a
N50.76 ± 0.05 b0.13 ± 0.01 bc0.89 ± 0.05 b3.97 ± 0.22 c
Note: Different letters in each column represent significant differences between different N additions (p < 0.05; Duncan’s test).

