3.2. Land Cover Change and Urban Expansion
The spatial pattern of urban expansion between 1972 and 2015 suggests that Dhaka and its neighboring areas have witnessed notable urban expansion in the peri-urban and suburban areas, accompanied by a significant recent increase in population growth.
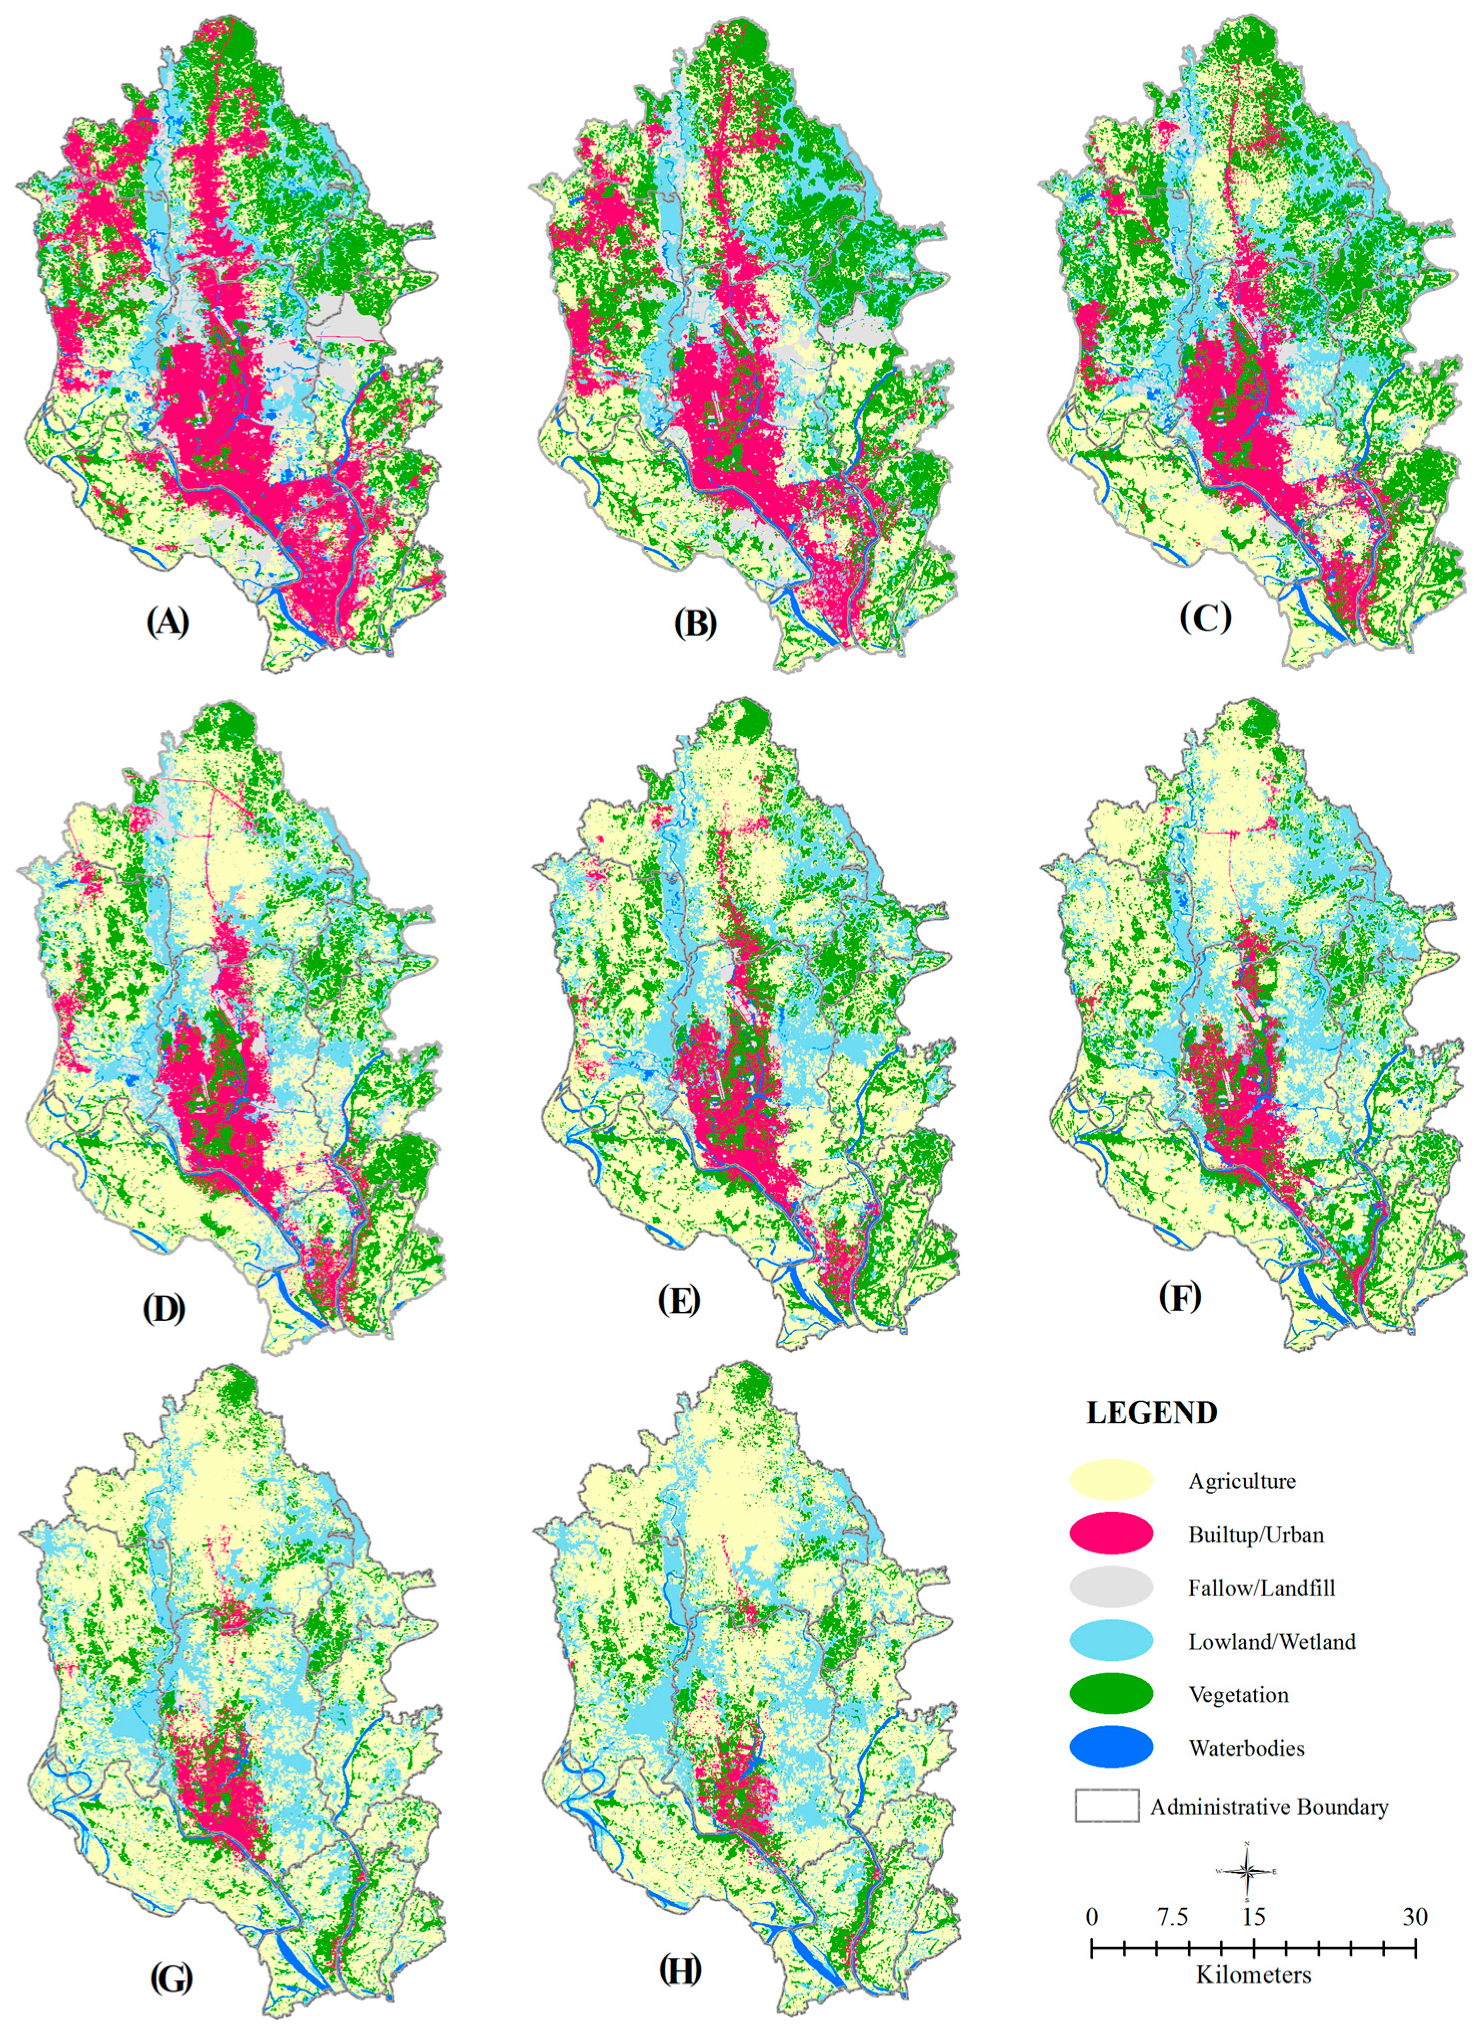
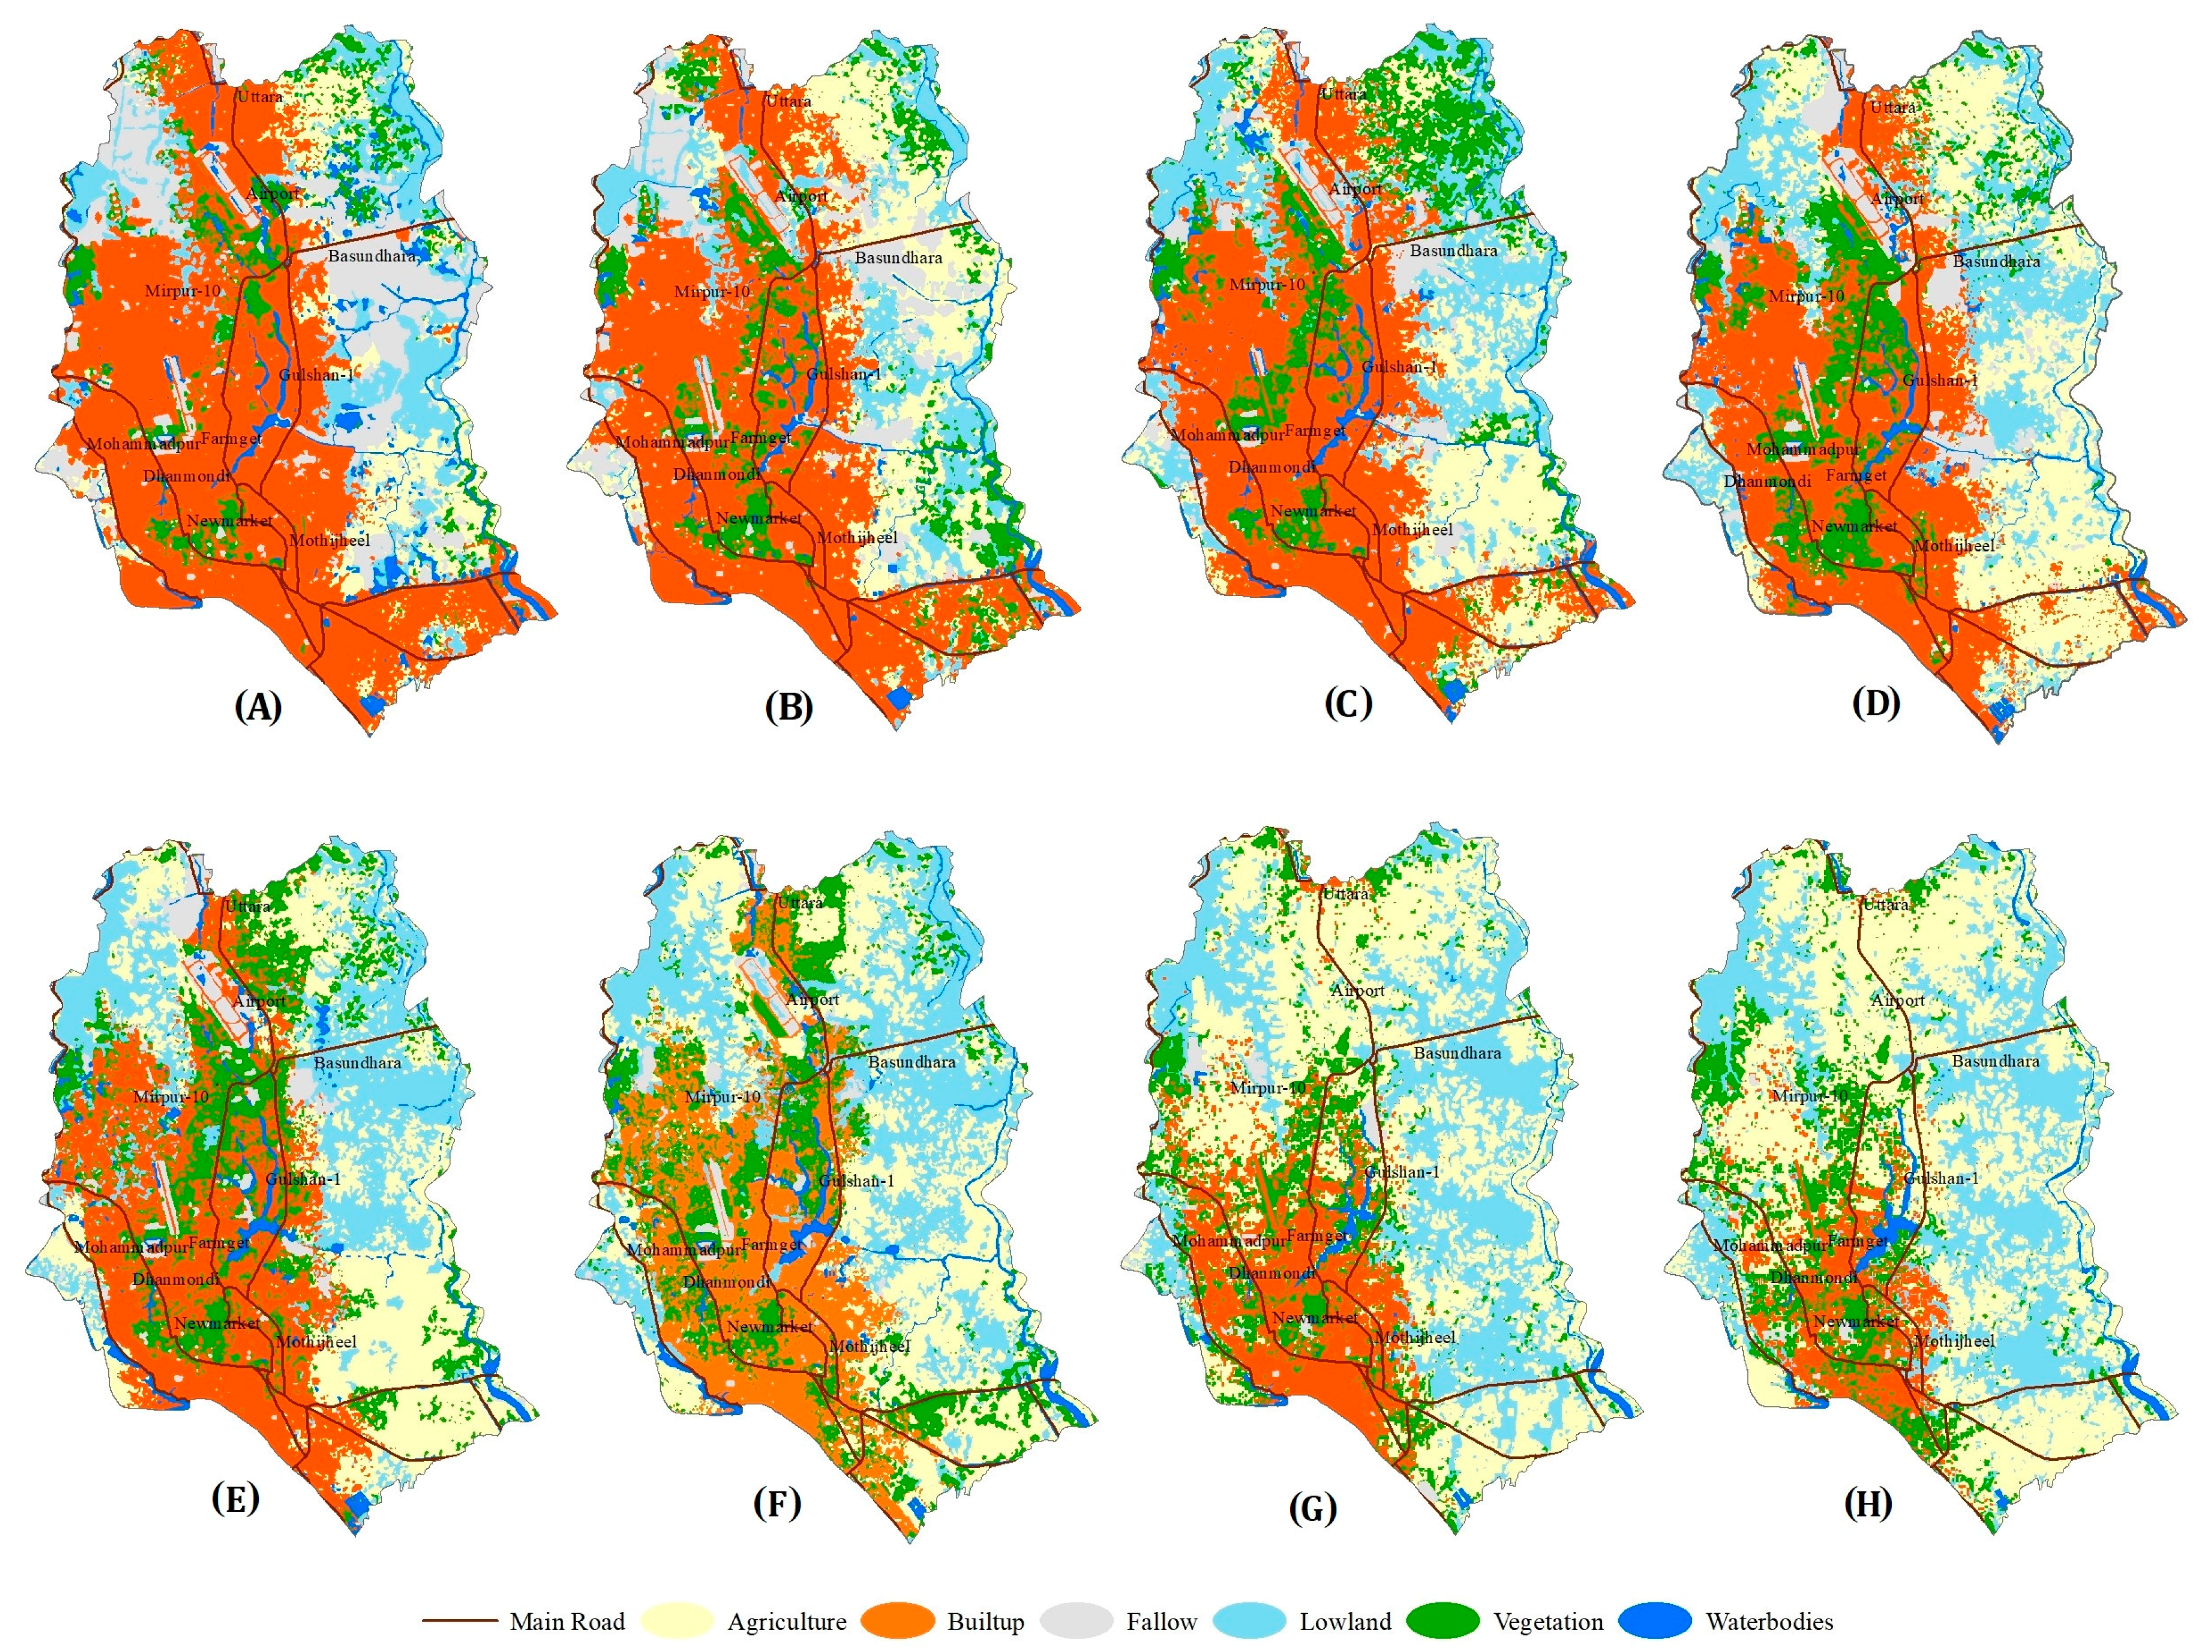
Figure 3 presents the land use and land cover maps of greater Dhaka for the eight time periods (e.g., 1972, 1980, 1990, 1995, 2000, 2005, 2010, and 2015). Each growth center in the following discussion is presented separately to identify areas with significant land cover transformation and facilitate a more detailed understanding of urban pattern and trajectories across the region.
Through a comparison of the land cover maps generated in this study, along with close investigation of historical topographic maps and the empirical literature, it has been observed that there are three primary growth centers in the study area, specifically Savar in the northwest, Naryangang in the east, and Dhaka in the center, located on the banks of the rivers Dhaleswari, Lakkhya, and Buriganga, respectively [
23,
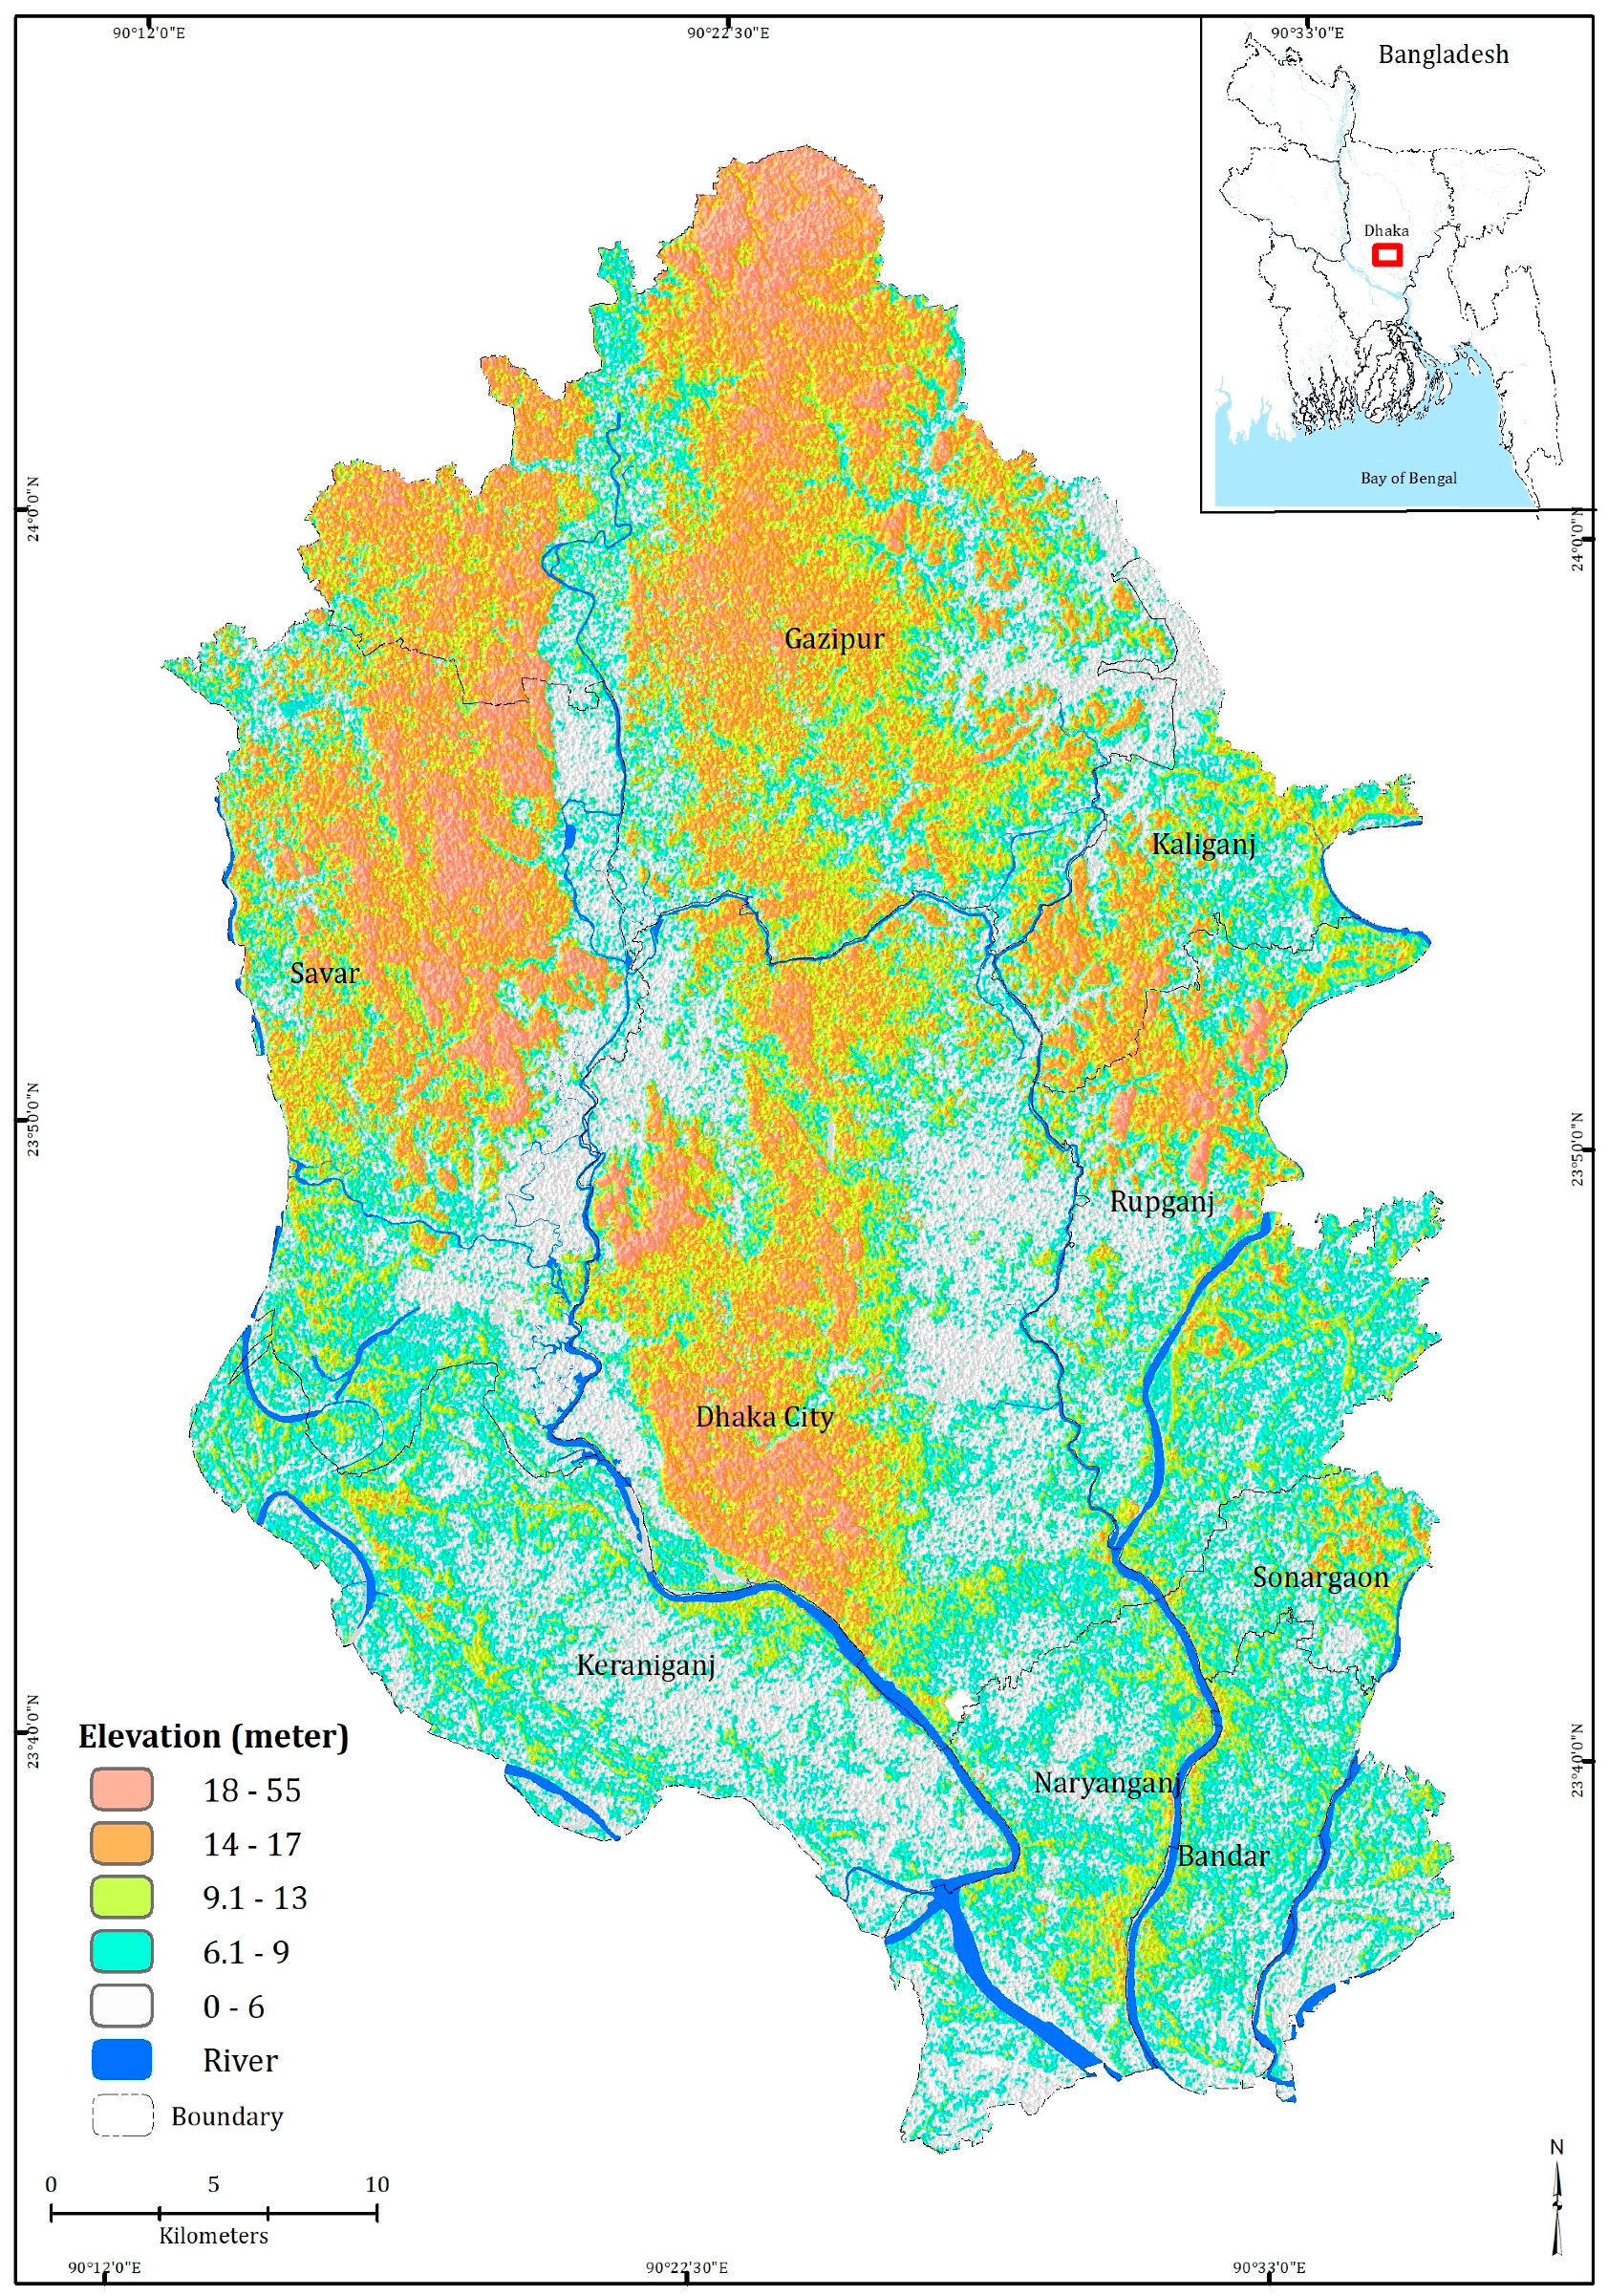
56]. These three mighty rivers fed the initial growth of these cities as they provided year-round navigable channels for trade, transportation, and commerce for the entire region. The area where the primary township developed was at a comparatively higher elevation than the surroundings (see
Figure 1), and was thus safe from erosion and flooding and easily serviced by a water linkage.
Dhaka’s urban growth gained momentum only after 1950 when a large influx of Muslim migrants from India [
22,
57] resulted in rapid population growth in the city territory, from 335,935 in 1951 to 556,712 in 1961, with a net growth rate of 65% [
58]. Such a huge and unexpected population explosion created enormous pressure on Dhaka’s existing housing and urban infrastructure and thus demanded land for further development that is away from the old city but readily available for housing and infrastructure development. As a result, major urban development projects during that time were initiated in the immediate north of the old city such as in Banani, Gulshan, and Baridhara, with 140 hectares, 290 hectares, and 150 hectares, respectively, acquired for high-class residential developments [
23]. In addition, another 500 acres of agricultural land was acquired in the northwest in Dhanmondi for high-class residential development, following the recommendation of a sub-committee created by the East Pakistan planning division in 1948. Although this residential plan was only partially executed, the impacts of these housing developments have been quite significant in terms of the physical structure and spatial dimension of the city. Since then the city has expanded northward and high-class residential areas are constantly attempting to keep themselves at the northern periphery of the city (
Figure 3).
The actual urban development in Dhaka, however, has increased drastically since 1971, when Dhaka became the national capital of the new sovereign state of Bangladesh. Even in the 1960s Dhaka was experiencing a very rapid population growth of over 6% annually, and this growth became much faster after 1971, with the population reaching 1,772,000 in 1974 from only 557,000 in 1961 [
58]. The thematic map of 1972 representing built-up areas during that time in Dhaka was approximately 2750 ha or 9% of the total DCC areas (
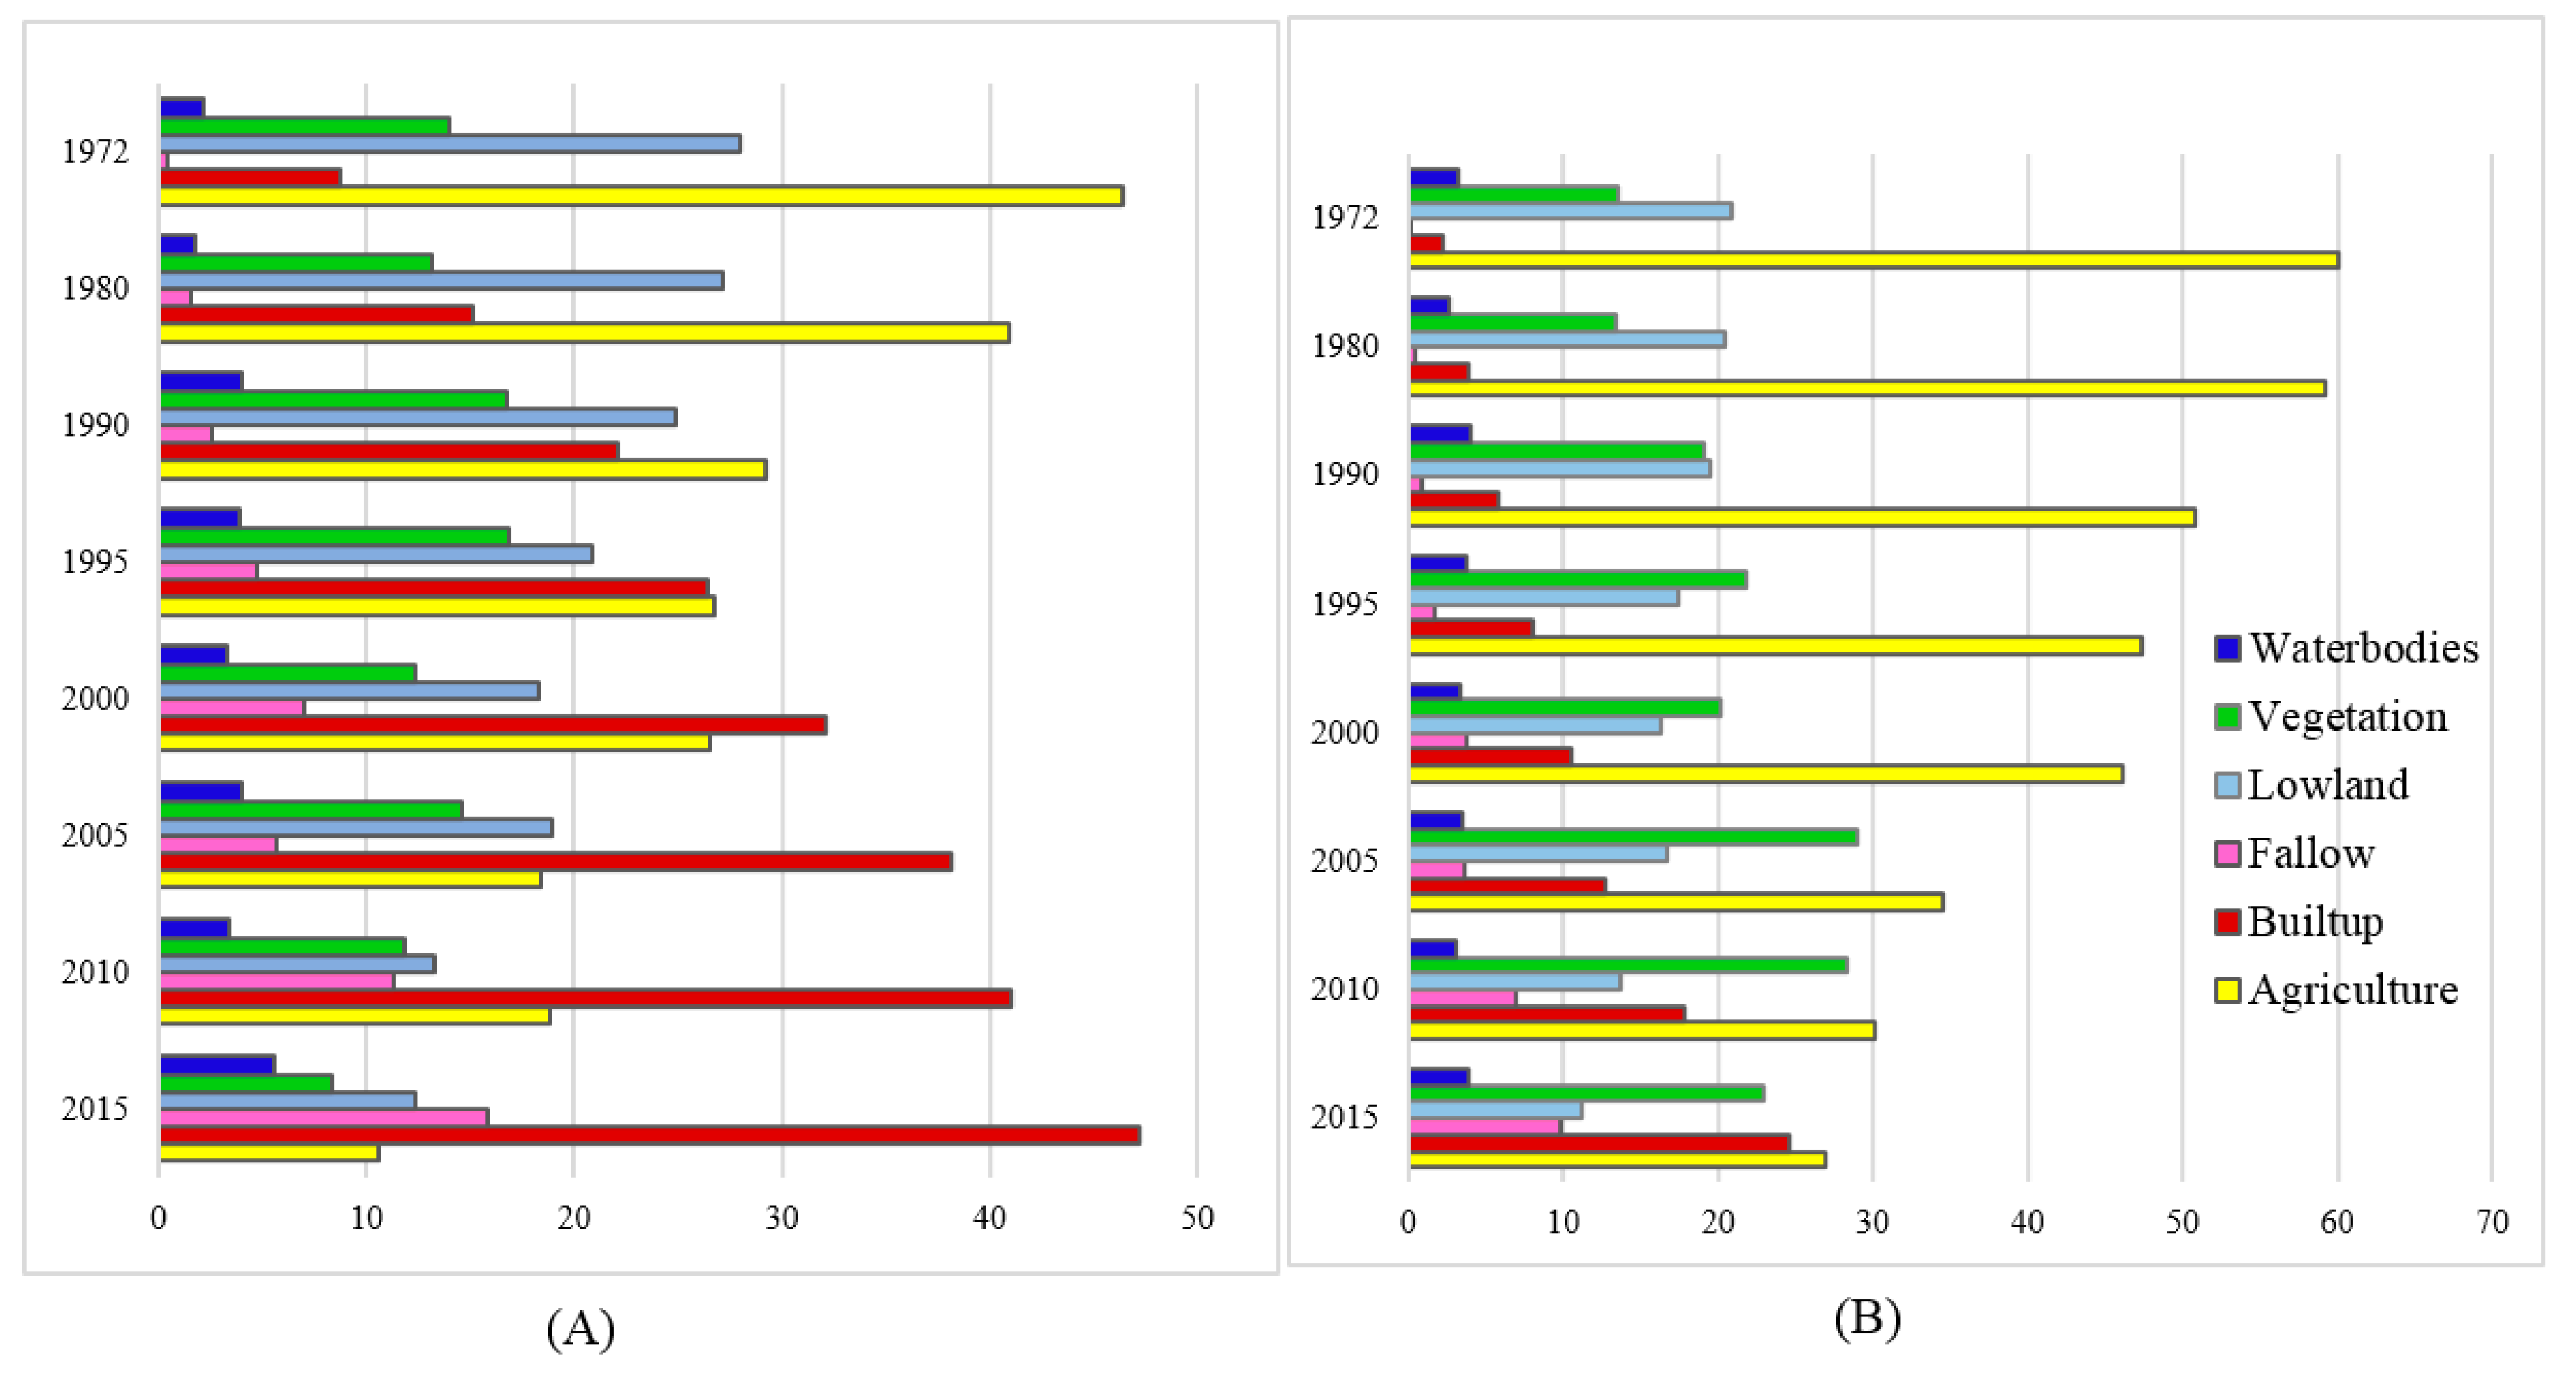
Table 4). Its immediate neighboring cities such as Gazipur, Naryanganj, and Savar were small townships with estimated built-up areas of approximately 243 ha, 238 ha, and 30 ha, respectively. Agricultural land (60%), lowland (21%), and vegetation cover (13%) were the dominant land cover types in 1972, and accounted for 96% of the study area. While in the DCC area those land cover classes were still higher contributors, their amounts were lowered to 47% for agricultural, 28% for lowland, and 14% for vegetation cover (
Figure 4).
Major built-up area in the DCC area in the early 1970s still occupied the core city, but also expanded beyond the old city limits. In the period between 1972 and 1980, the built-up area in the DCC area clearly headed towards the west and north of the existing growth center (
Figure 3 and
Figure 5). The total built-up area had by this time increased by 72%, while the population in the DCC areas increased to 3,248,000, with a net growth rate of 120% [
59,
60]. Later population growth slowed down, but it was still at a startling rate in the following period. For example, between 1980 and 1990, Dhaka’s population doubled in size from 3,248,000 in 1980 to 6,619,000 in 1990, with an estimated population growth rate of 104% [
61] and built-up growth rate of 46% during the same period.
By this time, Dhaka experienced dense development and clear expansion towards the north, northeast, and northwest by engulfing remnants of open and undeveloped land in core city areas (
Figure 5). Developed land, as seen in this period (1980–1990), clearly expanded to Adabar, Mirpur-1, Mirpur-11 and Airport in the north and further north to the banks of the Turag River. A visible amount of developed land, as seen in 1990 maps of Tongi bazar (Gazipur) and the surrounding industrial areas, were the main impetus for urban development (
Figure 3). The expansion of the city to the east and west was limited due to the presence of a huge depression between Dhaka and Savar, which resulted in major development having to occur in other directions, such as the rapid expansion along the north–south corridor of Dhaka City. While beyond the city limits to the north and northwest crosses into depression areas, vast lands were rural and agriculture in use, actively working as hinterland for Dhaka and yet to be incorporated within the full continuum of urban development by 1990.
Although built-up areas were small patches of the whole study area during the early period of this study, they rapidly increased in size in the following years, due in part to the booming business of export-oriented garment industries in Bangladesh. This type of business expansion had enormous impacts on urban growth in and around Dhaka as it contributed to industrialization and job opportunities in the cities, and spurred the mass movement of the surplus population away from the countryside [
23]. As elevated land in the city has already been urbanized during the rapid urban development since the 1980s, such industrial expansion coupled with residential development could only expand to the north (Tongi-Gazipur) or by reclaiming the vast depression land in the east and west of the core city. As a result, arable and wetland areas, mainly located adjacent to the existing urban edge, have become the target of urban expansion, particularly since the 1990s. As such, land filling was triggered in the outskirts of the capital, engulfing canals, paddy fields, waterways, and the vast depression areas in the east and west of the city. As observed from land cover maps of 1990, major landfilling areas are identified in several locations such as in Khilkhet (Bashundhara Residential Area) and Mirpur (Duaripara and Rupganj). As a result, landfill area increased its proportional share from 475 hectares in 1980 to 801 hectares in 1990 in the DCC area (
Table 4). As population pressure with industrial development continued to increase in the city limits, landfilling battles on the city outskirts concurrently increased at a rapid rate in the following decades. For example, fallow land reached 2144 hectares in 2000 and 4067 hectares in 2015 with a net growth rate of 45% and 127%, respectively (
Table 4). The major landfilling areas are still identified in the eastern part of the city, such as Khilkhet in the Bashundahra Residential Area and other new locations at Aftabnagar, Banasree, and Karial (
Figure 5). Between 2000 and 2015, the study area observed landfills in all directions including the existing location, and continuous expansion of the area that had been previously filled up. However, this time landfilling extended to the southeast along the Dhaka–Naryanganj highway and to the east in Keraniganj, crossing the river of Buriganga.
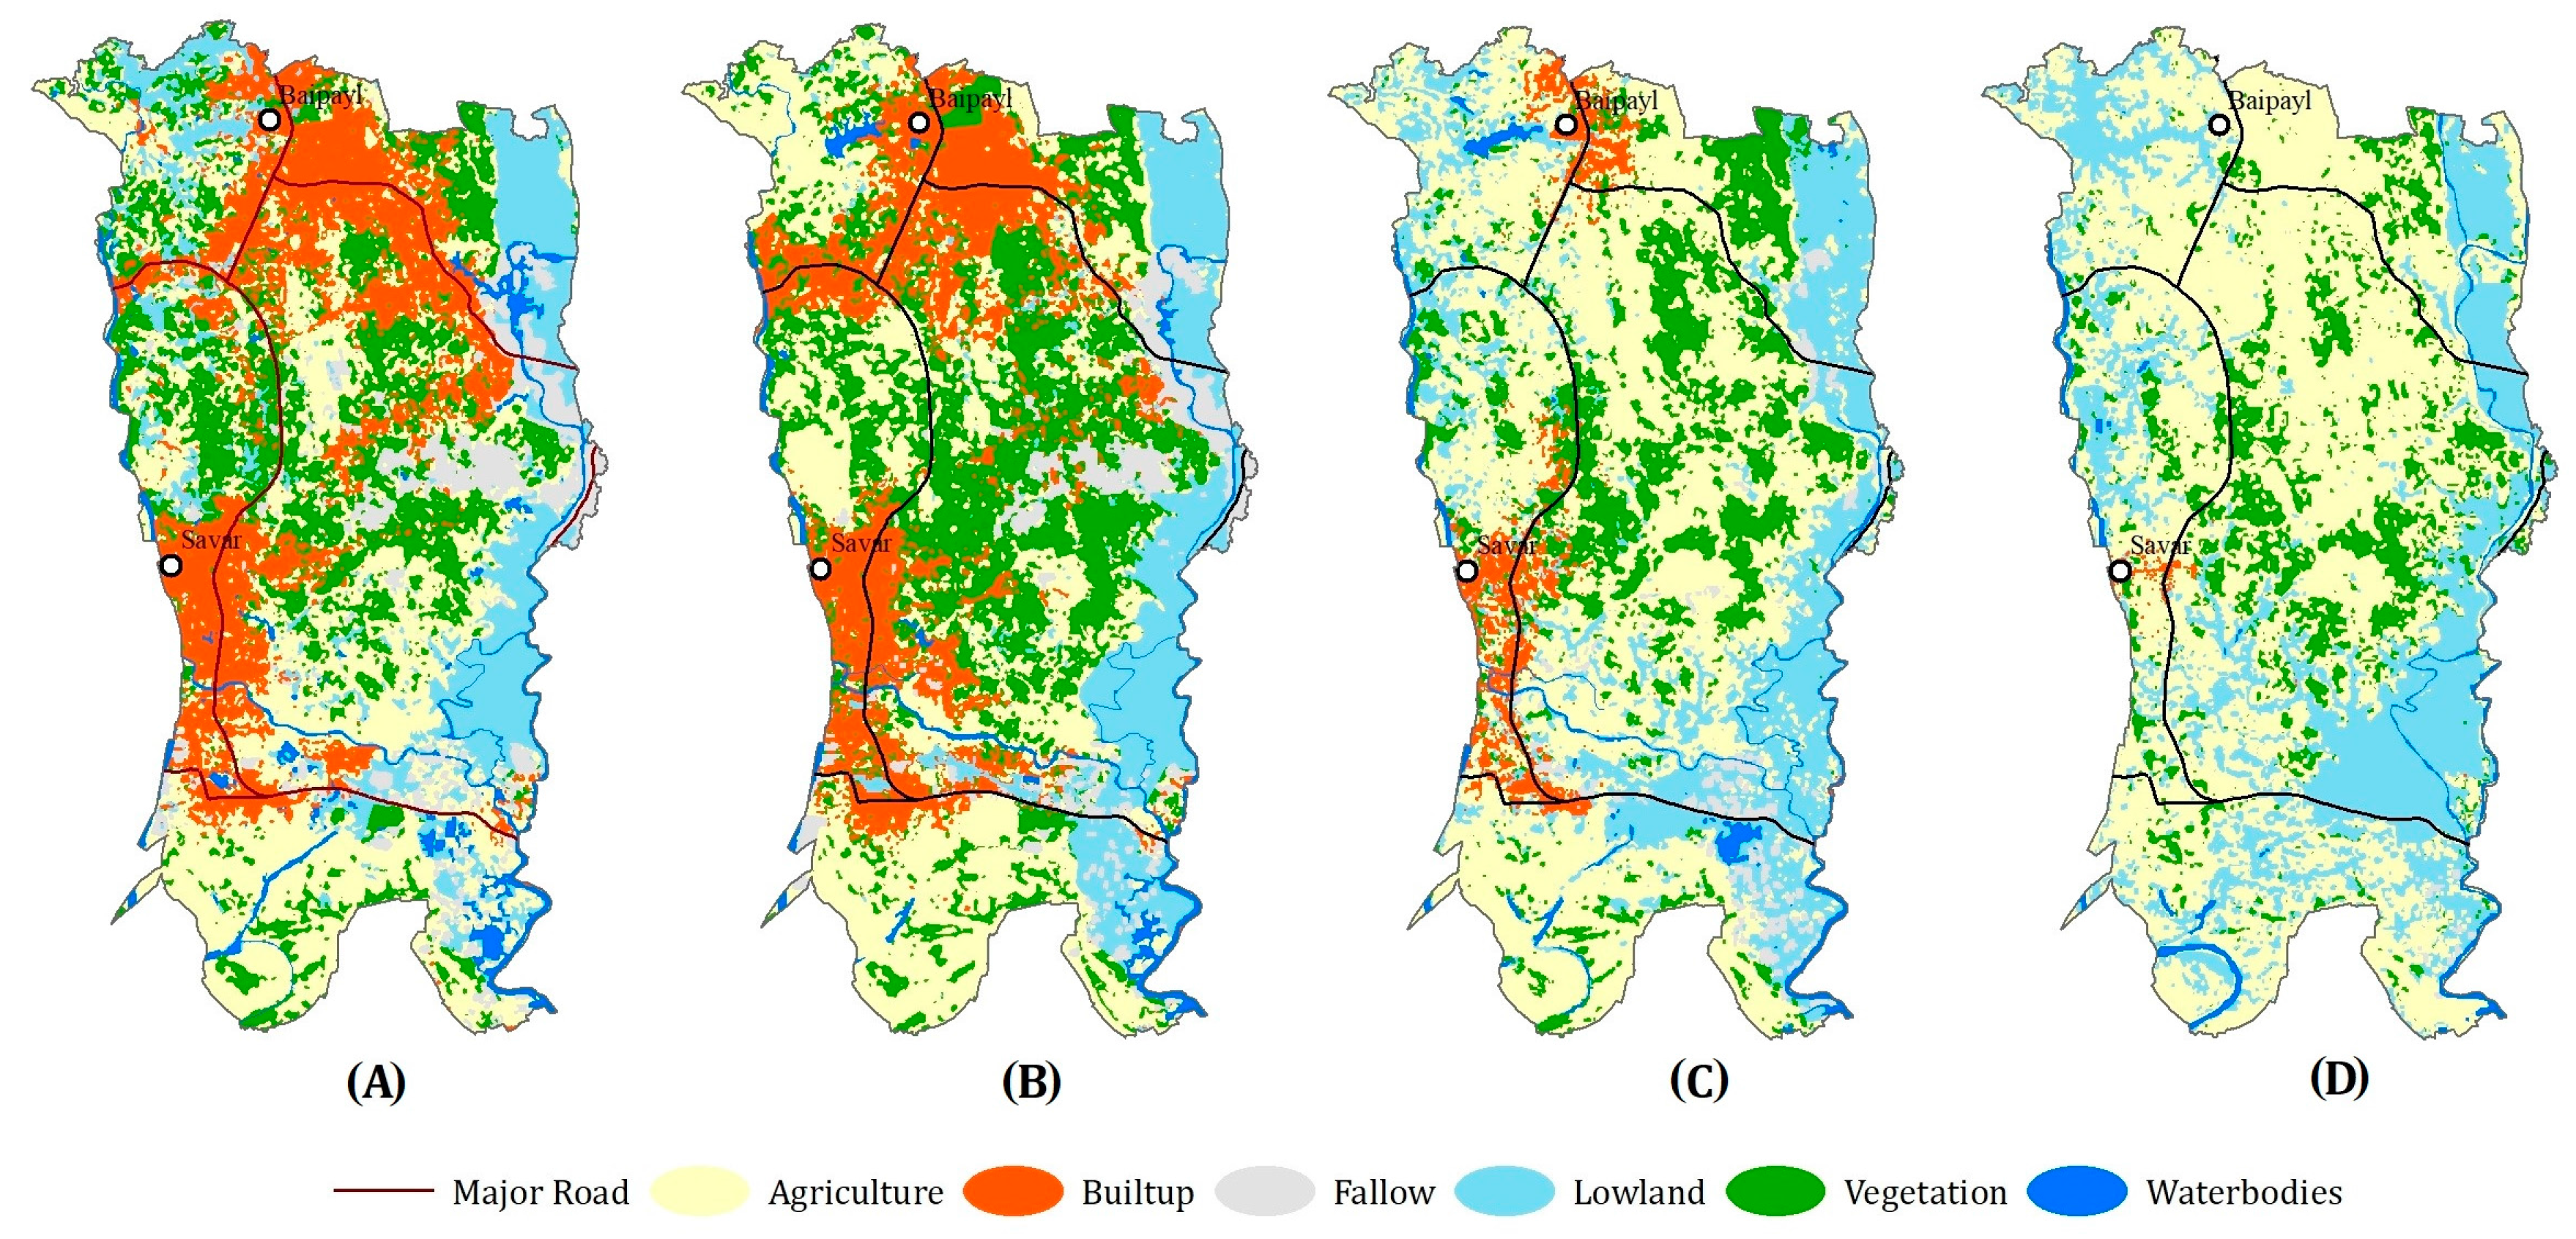
The initial urban development in Savar was on the northeast bank of the Dhaleswari River and the small township was located between the present Namabazar and Savar Thana (
Figure 6). The whole region to the north, east, and south was largely agricultural or marshy land. As estimated from the thematic map of 1972, approximately 14,580 hectares or 58% was agricultural and 6954 hectares or 27% of the total land area in Savar was lowland (
Table 5). An analysis of the land cover map of the Savar area reveals that the built-up area had increased between 1972 and 1980 by approximately 211%, while the population growth was around 92% (estimated from the 1974 to 1981 census) [
59].
The trend of urban growth in Savar continued in the following years, but the rate was substantially higher than in the past. For example, in the period between 1990 and 1995 the total urban growth in Saver was approximately 325%, with an annual increase rate of 34%. Later developed land doubled in size as it increased from 628 hectares in 1995 to 1274 hectares in 2000, with a net increase rate of 103%. Although developed land continued to increase, the rate of growth was higher in the period of 2005–2010; the total built-up area reached 4660 hectares in 2010, with a net growth rate of approximately 150%. Population growth in the same period was highest at around 130% between the 2001 and 2011 census periods [
62,
63].
In 1974 Savar was a city with 131,429 inhabitants [
58], but urban development pressure in Savar resulted from the establishment of a number of planned large-scale industrial zones, such as the Dhaka Export Processing Zone in Dhamsona in the early 1990s and heavy industrial plants in Nayarhat in the mid-1970s. As a result, the population swelled, due mainly to a great influx of rural migrants looking for work in the booming industrial sectors in Savar [
23,
57]. In addition, a number of establishments with growing tourism importance such as Jahanginrangar University, the Savar Cantonment, the Atomic Energy Center, and the National Memorial, have further reinforced development of Savar.
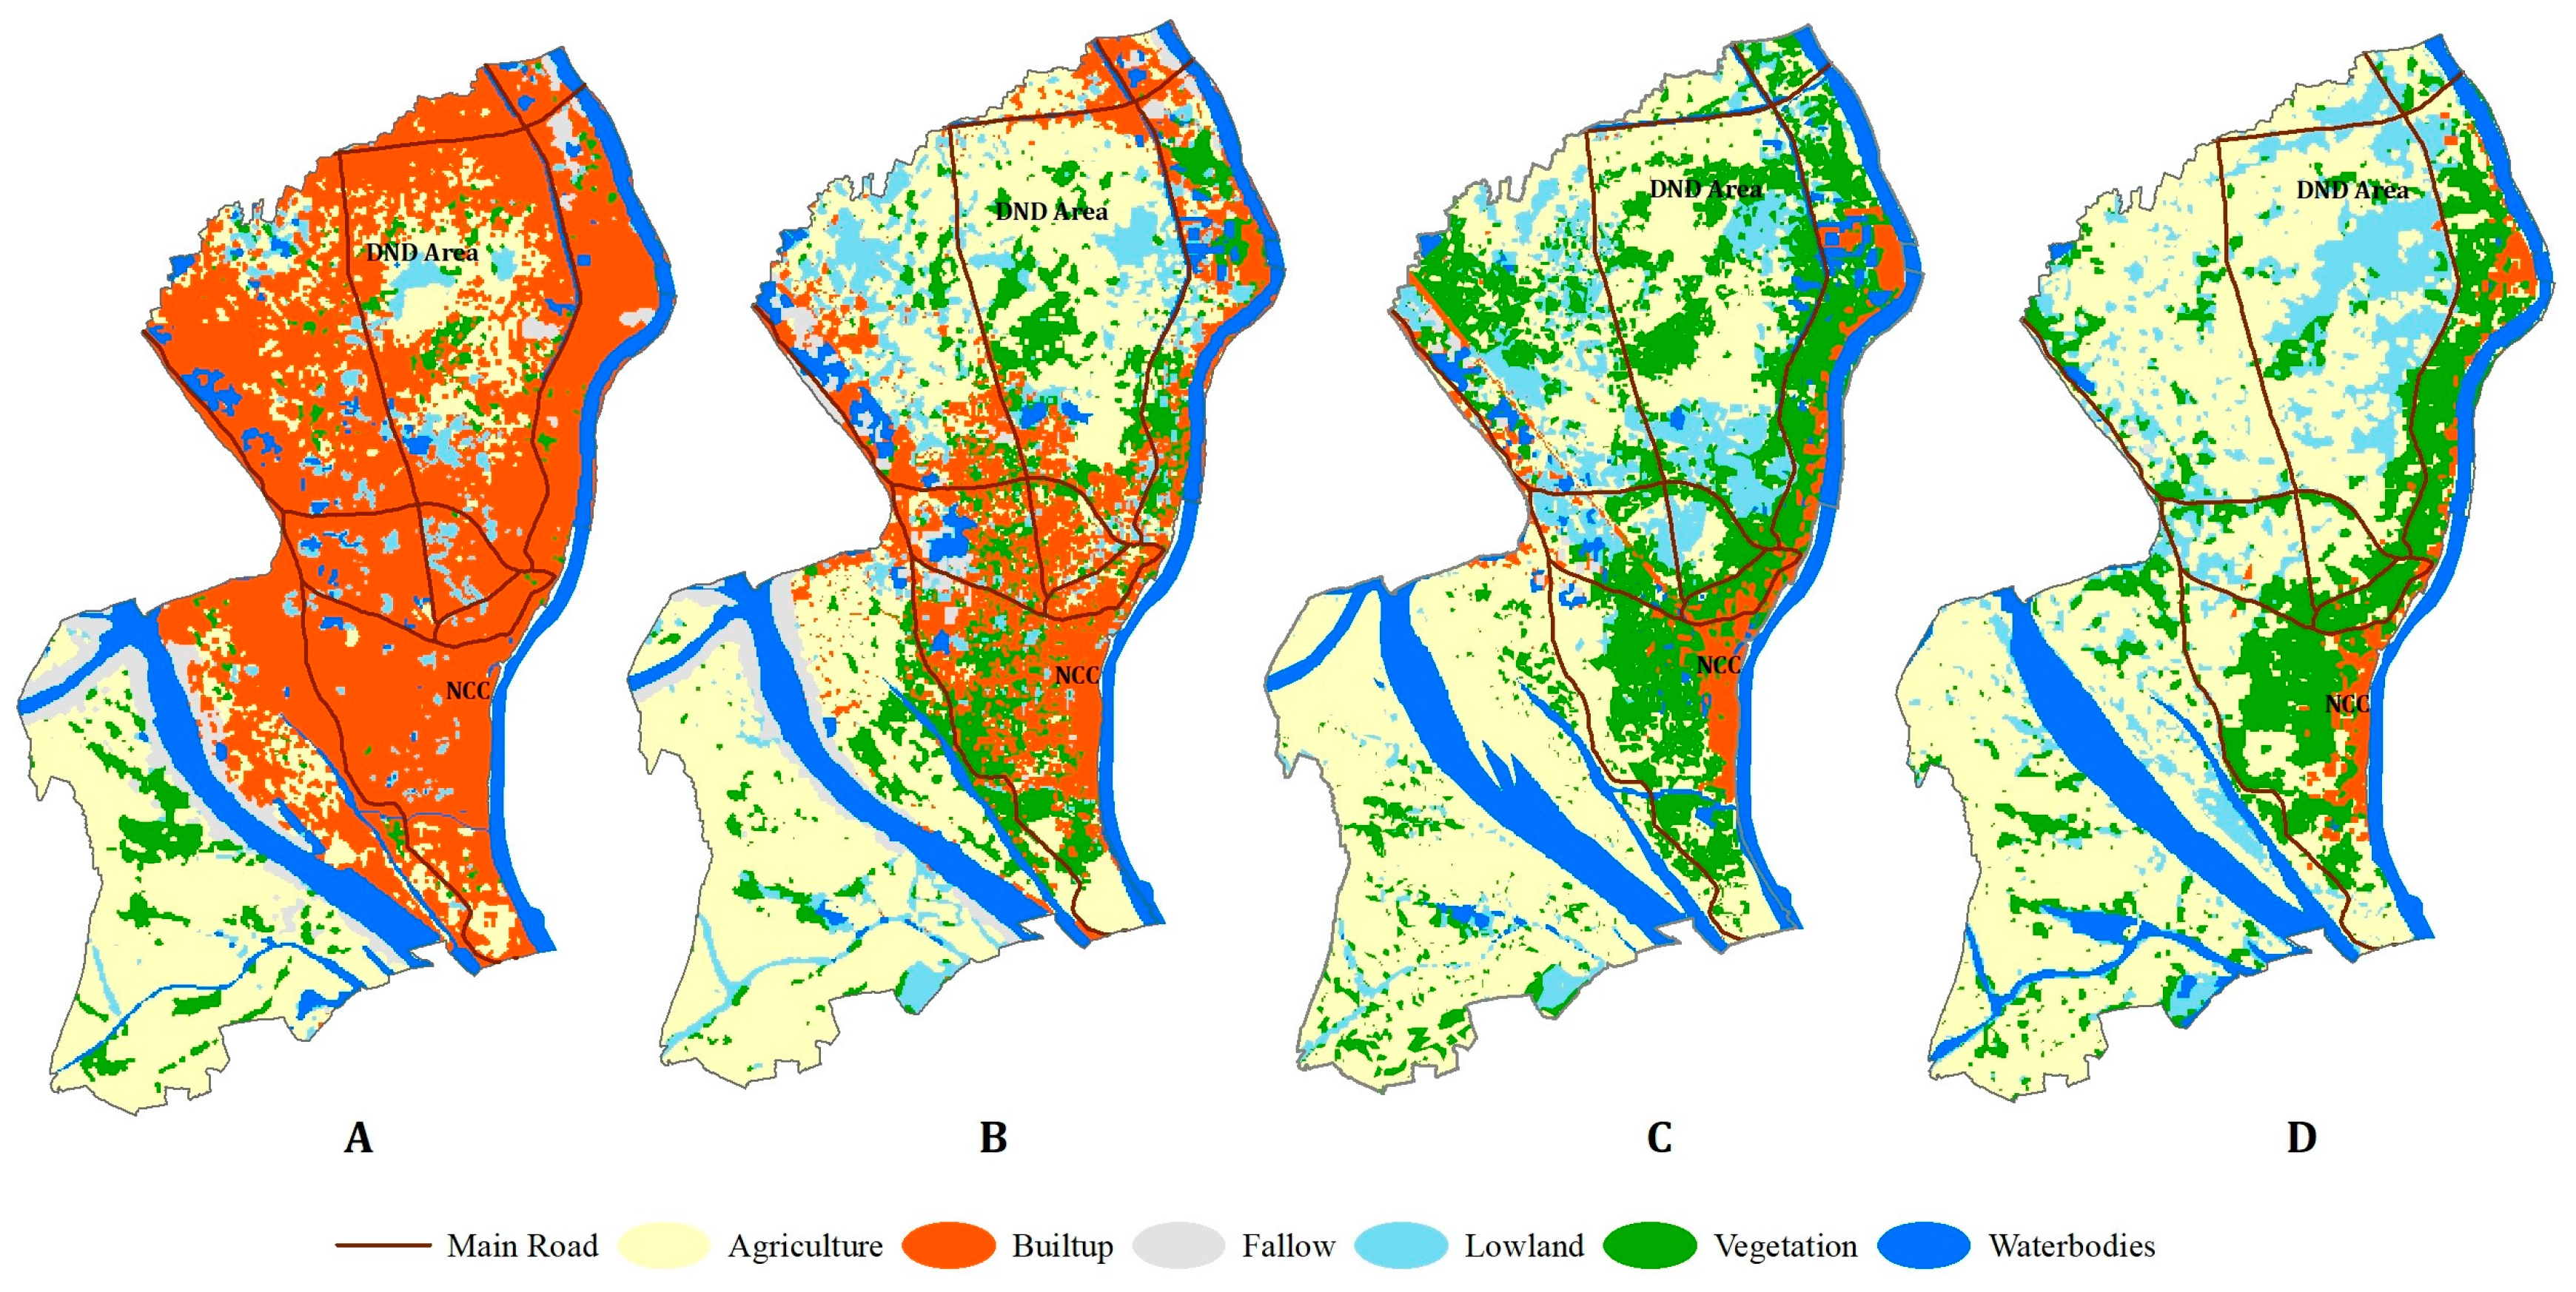
The southeastern city of Naryanganj was mainly known in the past as a salt trading center and for having the largest jute mill, high numbers of cotton mills, and other large-scale industrial plants. In its initial period, urban development was limited to the eastern and western banks of the Lakkhya river, as seen in the land cover map of 1972 (
Figure 7): approximately 238 hectares of land were covered with built-up area (
Table 6). The outer peripheral expansion of this city in the south was up to the Kashipur River and towards the north up to the Adamjee EPZ. Later, expansion of huge cotton industries in the early 1990sn along with other large-scale industrial development, meant the city underwent rapid urbanization to accommodate the growing number of workers and associated infrastructure development. As a result, between 1980 and 1990 the built-up area increased to 83%. This time the city is expanding towards the northwest, following the old axis of the Dhaka–Naryanganj highway, but, due to physical constraints such as the river Buriganga to the south and the flood-prone swampy land to the north, urban development away from the road was slow.
Nevertheless, due to the aftermath of the 1988 floods, this swampy land in the northwest outskirts of Naryanganj city and southeast periphery of Dhaka City, literally called Dhaka Naryanganj Demra (DND) flood protection dam, originally meant to protect the land from flooding and improve agricultural production, became the main target of residential development [
64]. As a result, a large area in the DND area experienced rapid and chaotic urban development, which resulted in rapid land conversion from agricultural–lowland to residential development (
Figure 7). Built-up area, therefore, increased from 612 hectares in 1990 to 1720 hectares in 2000, a net growth rate of 181%. The developed land in Narayanganj is expanding much faster in recent times due to the establishment of several planned industrial estates in Enayetnagar, Fatullaha, Adamje, Kachpur, and Panchabati, which has made the city one of the largest urban agglomerations in the region.
Beyond the Buriganga River, Keraniganj was primarily rural and dominated by various agricultural types. The built-up area estimated from the land cover map of 1972 (
Figure 3) was approximately 138 hectares, while agricultural was around 12,305 hectares or 70% of the total land in Keraniganj. However, these areas have undergone rapid urbanization in recent times due to several connecting bridges over Buriganga, which established a quick gateway to Dhaka and the rest of the south Keraniganj. The major urban development in Keraniganj is now found in the immediate south bank of Buriganga, in such locations as Zinzira, Ragunathpur, Mandail, Kalindi, Barisur, Dakpara, Kaliganj, and up towards Mirerbag. In addition, the area also houses a number of small- and medium-scale manufacturing industries, warehouses, and lower-income residences. These manufacturing industries, along with ongoing massive-scale residential development projects in Ekuria, are making this area urbanize rapidly in recent times. As shown in the land cover map for 1990 to 2015 (
Figure 3), the total built-up area in Keraniganj increased by 764%, while fallow land increased by 1052% (
Table 7).
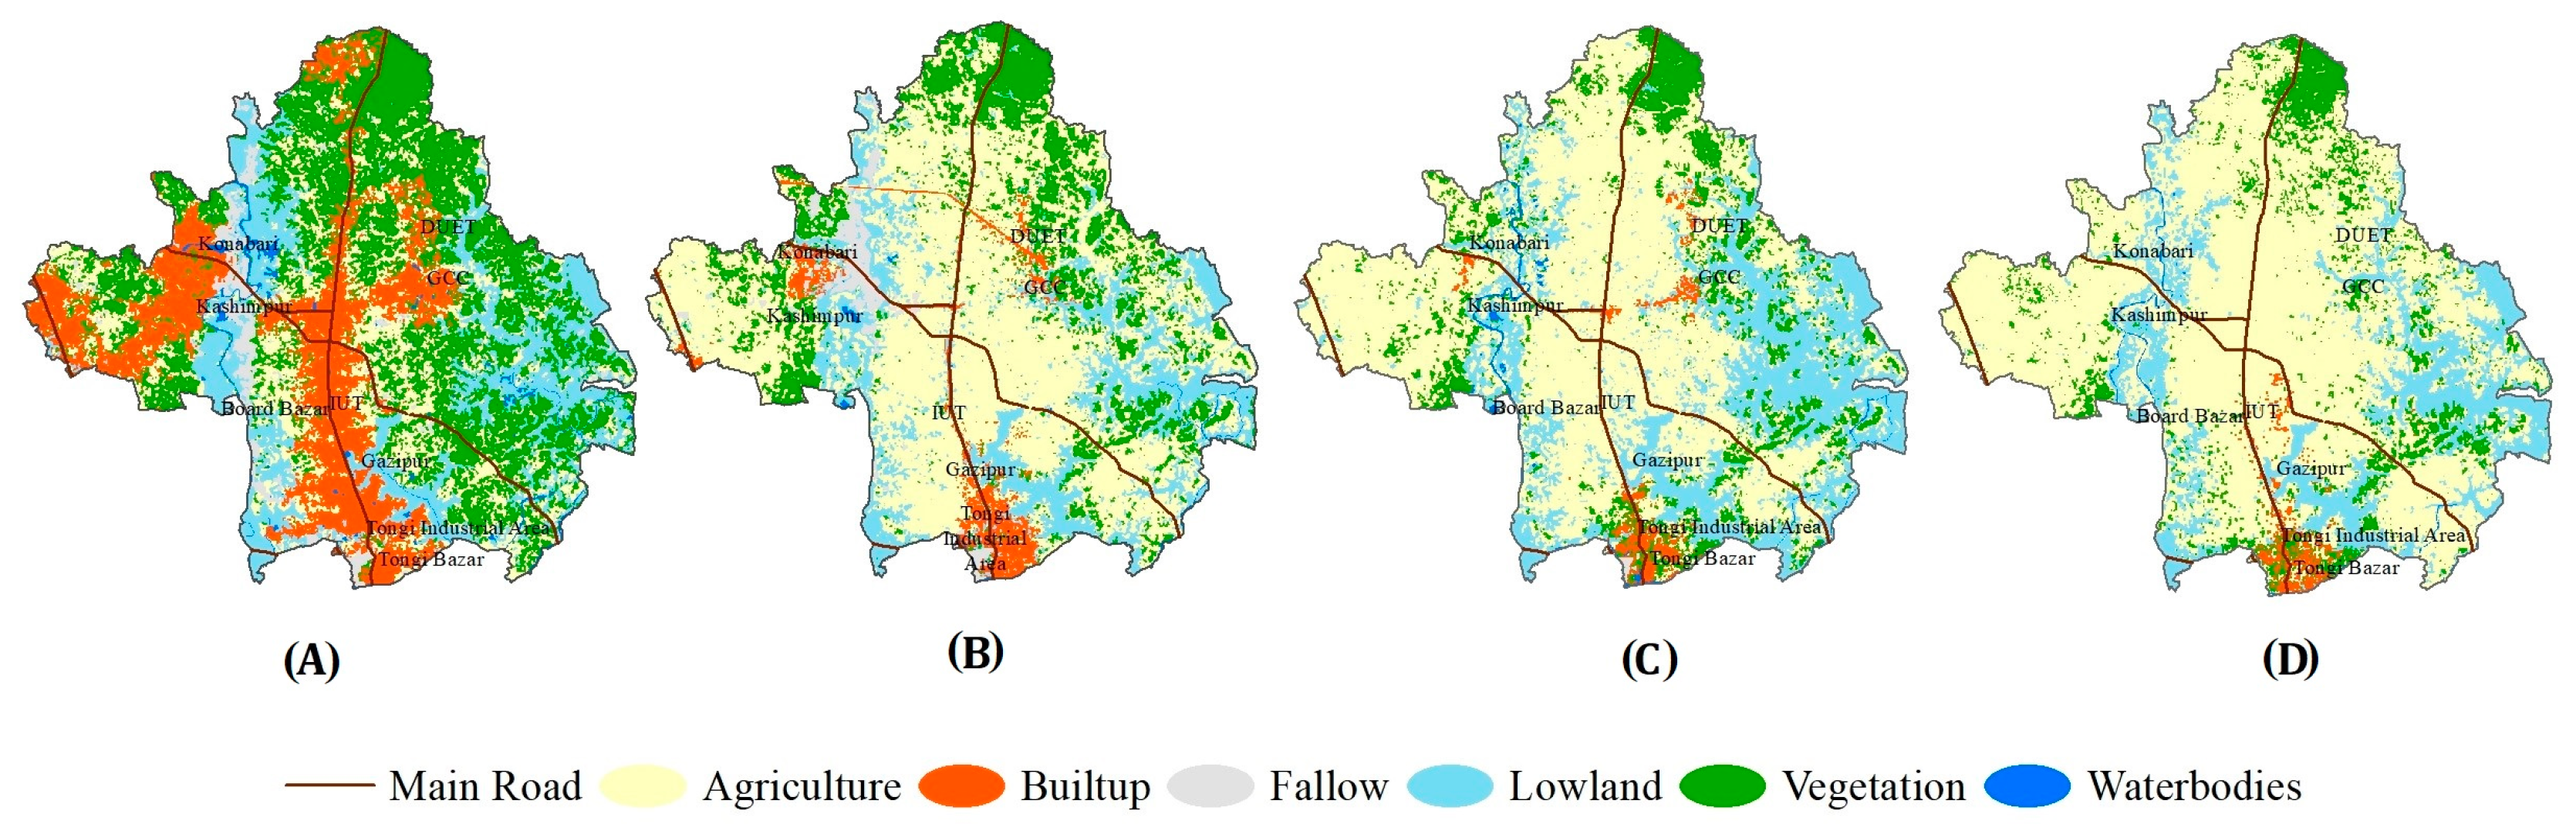
The area statistics derived from the land cover maps reveal that urban growth in the northern outskirts of Dhaka city in Gazipur (
Figure 8) increased significantly, from 243 hectares in 1972 to 7640 hectares in 2015, with a total growth rate of 3038% (
Table 7). This built-up growth rate is substantially higher than any other urban center studied here. Among the eight time periods, the highest urban growth in the region was recorded in the 1972–1980 and 2005–2010 periods at the rate of 145% and 100%, respectively. This growth can be attributed to both industrial development and expansion and human population growth in the region. Specifically, this area contains five universities, a high-tech park, a number of government, semi-government, and private offices, and the largest concentration of garment manufacturing industries in the countree. Due to the availability of flood-free, low-cost land with close proximity to the core city area, Gazipur has become the main target of both residential and industrial development in recent times. As a result, arable agricultural land and lowland cover types have been converted to developed land very quickly. As observed in the 43-year period, the total agricultural land dropped to 6784 hectares by 2015 from 25,186 hectares in 1972, a 73% decrease. The land cover statistics also suggest that vegetation cover in the region has increased over the 43-year study period; however, except for the forest cover in the north, this increase in vegetation is actually an increase in peri-urban settlement. These settlements are covered with homestead vegetation, as is typical across Bangladesh.
In the smallest administrative unit, Bandar, which is located on the eastern bank of the Shitallakhya River, the dominant land cover change is an increase in developed land (
Figure 3). While the dominant land use is agriculture (41%), the land cover maps for the last 43 years show that developed land increased from 98 hectares in 1972 to 1532 hectares in 2015, with a net growth rate of 910%. The greatest increase is observed between 1995 and 2000, when the total built-up growth was 137% (
Table 7). Within this conversion to developed land, the largest portion is industrial and port-related infrastructure development, which has expanded along the eastern bank of the Shitallakhya River in a north–south direction. This built-up expansion was mainly at the expense of agricultural land as the total area of agricultural land declined at a rate of approximately 34%, from 3549 hectares to 2362 hectares, across the period. The landfill area during the same period also increased substantially, from only 2 hectares in 1972 to 175 hectares in 2015. Much of these landfills are comprised of brickfields, which are expanding east and south out from the center.
Among the other three connecting growth centers (i.e., Soanrgaon, Rupganj, and Kaliganj) in this study, increasing cover of developed land was documented in Soanargaon and Rupganj, both of which are located in the southeast and east of the study area (
Figure 1 and
Figure 3). The development of Sonargaon was historically significant as it was the capital of Bangladesh in the 15th century. The urban development of this historic city gained momentum in recent times due to the significant increase of tourism-related services, educational institutions, and various private residential development projects. As such, developed land in Sonargaon has increased rapidly between 2000 and 2015, from 185 hectares to 851 hectares, with a net growth rate of 360%. Similarly, in Rupganj, urban area markedly increased from 197 hectares in 2000 to 1287 hectares in 2015, a net growth rate of 553% (
Table 7). Additionally, the landfill area in Rupganj has increased since 1990, with 738 hectares in 2000 from only 30 hectares in 1990. This growth remained constant in the following year but at an accelerated rate, i.e., it reached 1840 hectares in 2010 and 3082 hectares in 2015 with total growth at a rate of 149% and 67%, respectively. Kaliganj in the northeast of this study area is a predominantly agricultural, rural, and peri-urban settlement (53% in total). The land use survey of 2006 estimates that 23% of the total land of Tongi, Gazipur, Kaliganj, and Rupganj was residential, including urban housing, rural homesteads, and informal housing; less than 1% is designated for industrial and commercial uses and 60% land is used for agricultural purposes [
65].The recent land use survey conducted by RDP, RAJUK 2013 [
66] estimated that residential land use comprises 36.5% of the current study area, while industrial and commercial uses comprise 2.6% and 1%, respectively. The total built-up area including residential, industrial, public facilities, road networks, commercial, and mixed use comprises 44% of the survey area, which closely aligns with our findings of 45% including urban and rural settlements (except for the small patches of forest in the north, vegetation classes in our study correspond with rural settlements, which account for almost 20%).
3.3. Urban Growth Trajectory Analysis
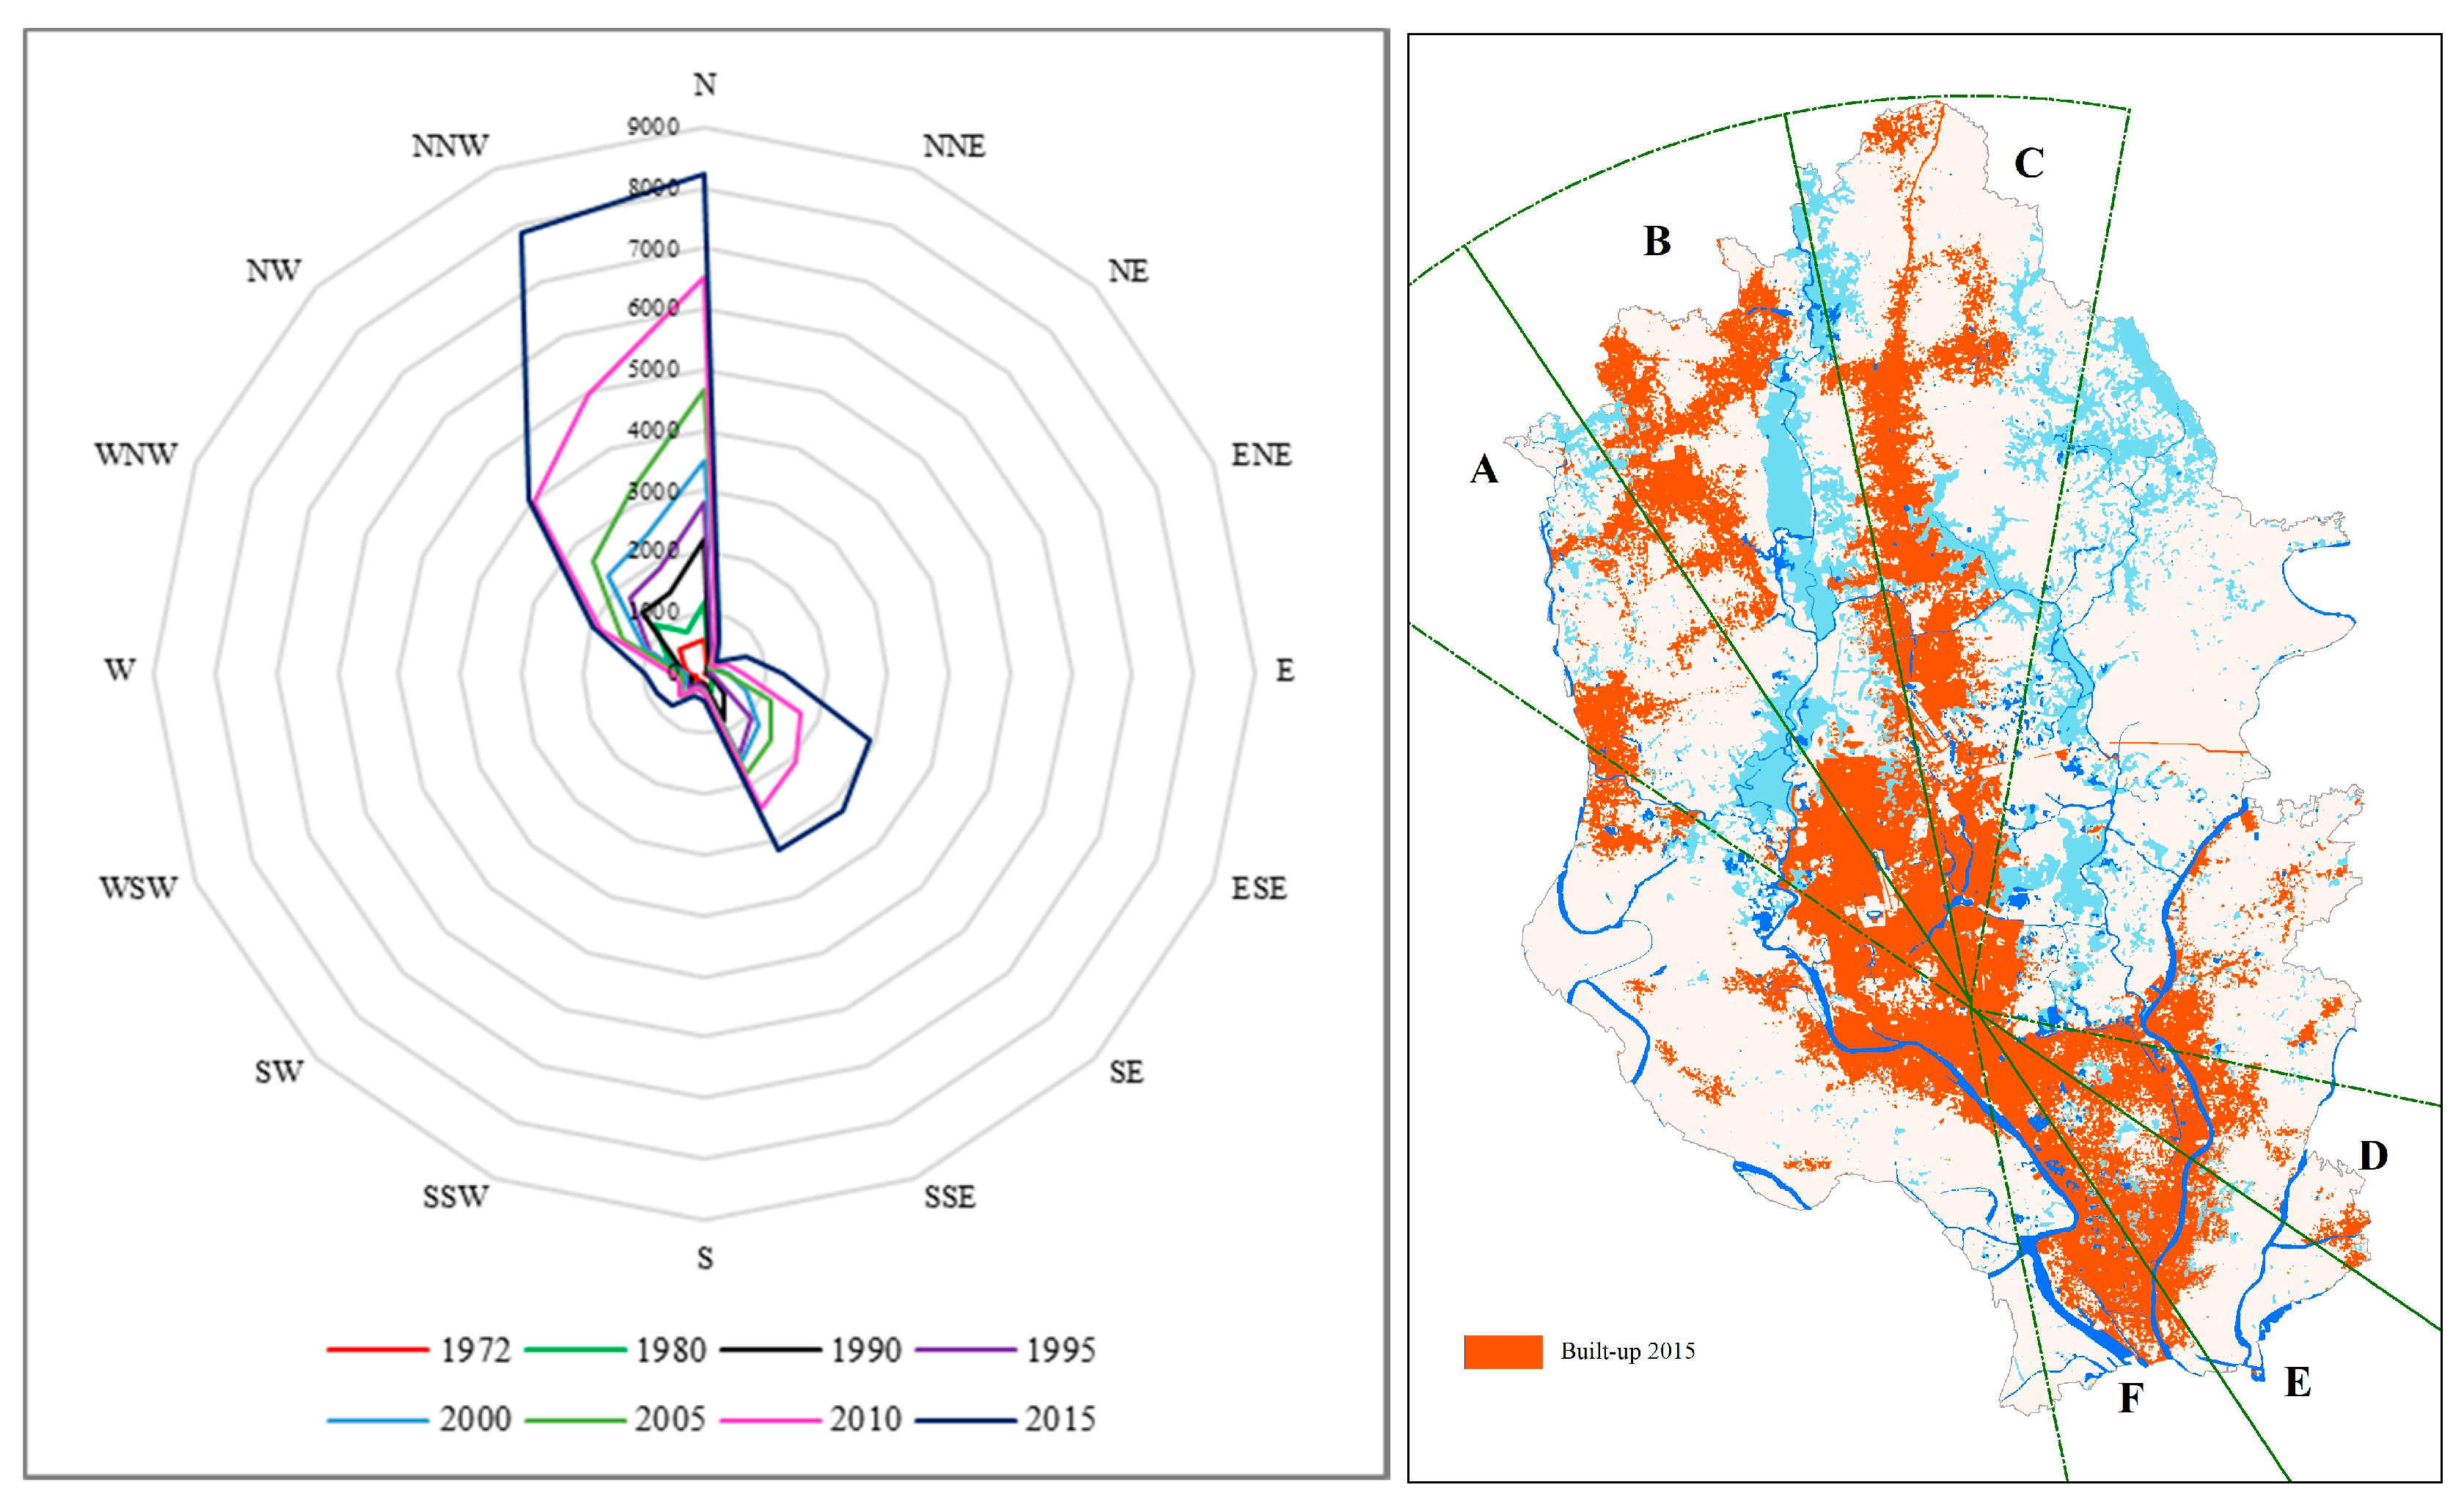
The spatial pattern of urban expansion between 1972 and 2015 suggests that Dhaka and its surrounding areas have experienced rapid urbanization, which has resulted in significant changes in land use over the 43-year period studied here. The spatial trajectory of urban expansion over the study period suggests that north, northwest, and southeast were the major directions experiencing urban development (
Figure 9). By contrast, southern and western expansion are relatively low since the southern and western zones are dominated by low-lying marshy land, which clearly constrained the growth of built-up areas in these directions. The urban growth was estimated from the thematic map over the 43-year period in the direction toward the north (35% expansion), along the Dhaka–Mymensingh highway (Tongi-Gazipur) and northwest (30% expansion), the Savar–Ashulia corridor along the Dhaka–Aricha highway, and also toward the southwest (25.6%) along the Dhaka–Narayanganj and Dhaka–Chittagong highways (
Figure 9). The development towards the north was significant due to comparatively flood-free land in that direction and particularly a number of development projects, such as shifting the airport from its old site at Tejgaon to its new site north of Kurmitola, which is about 10 km north of the old airport.
Another major development project is the Uttara Model Town located immediately north of the new airport. North of Uttara stands the industrial town of Tongi and beyond Tongi and Joydebpur has also been partly filled up with the establishment of two institutions of higher learning, the National University, and the Islamic University of Technology. Due to population growth and the subsequent expansion of trade and commerce, the current development of the city is radiating southwest, north, northeast, west, and northwest from the banks of the Burignaga River and extending into rural areas and beyond the outskirts. Dhaka’s recent growth has been linked with Narayanganj and Gazipur City, such that there are no gaps between Dhaka and those two connecting cities.
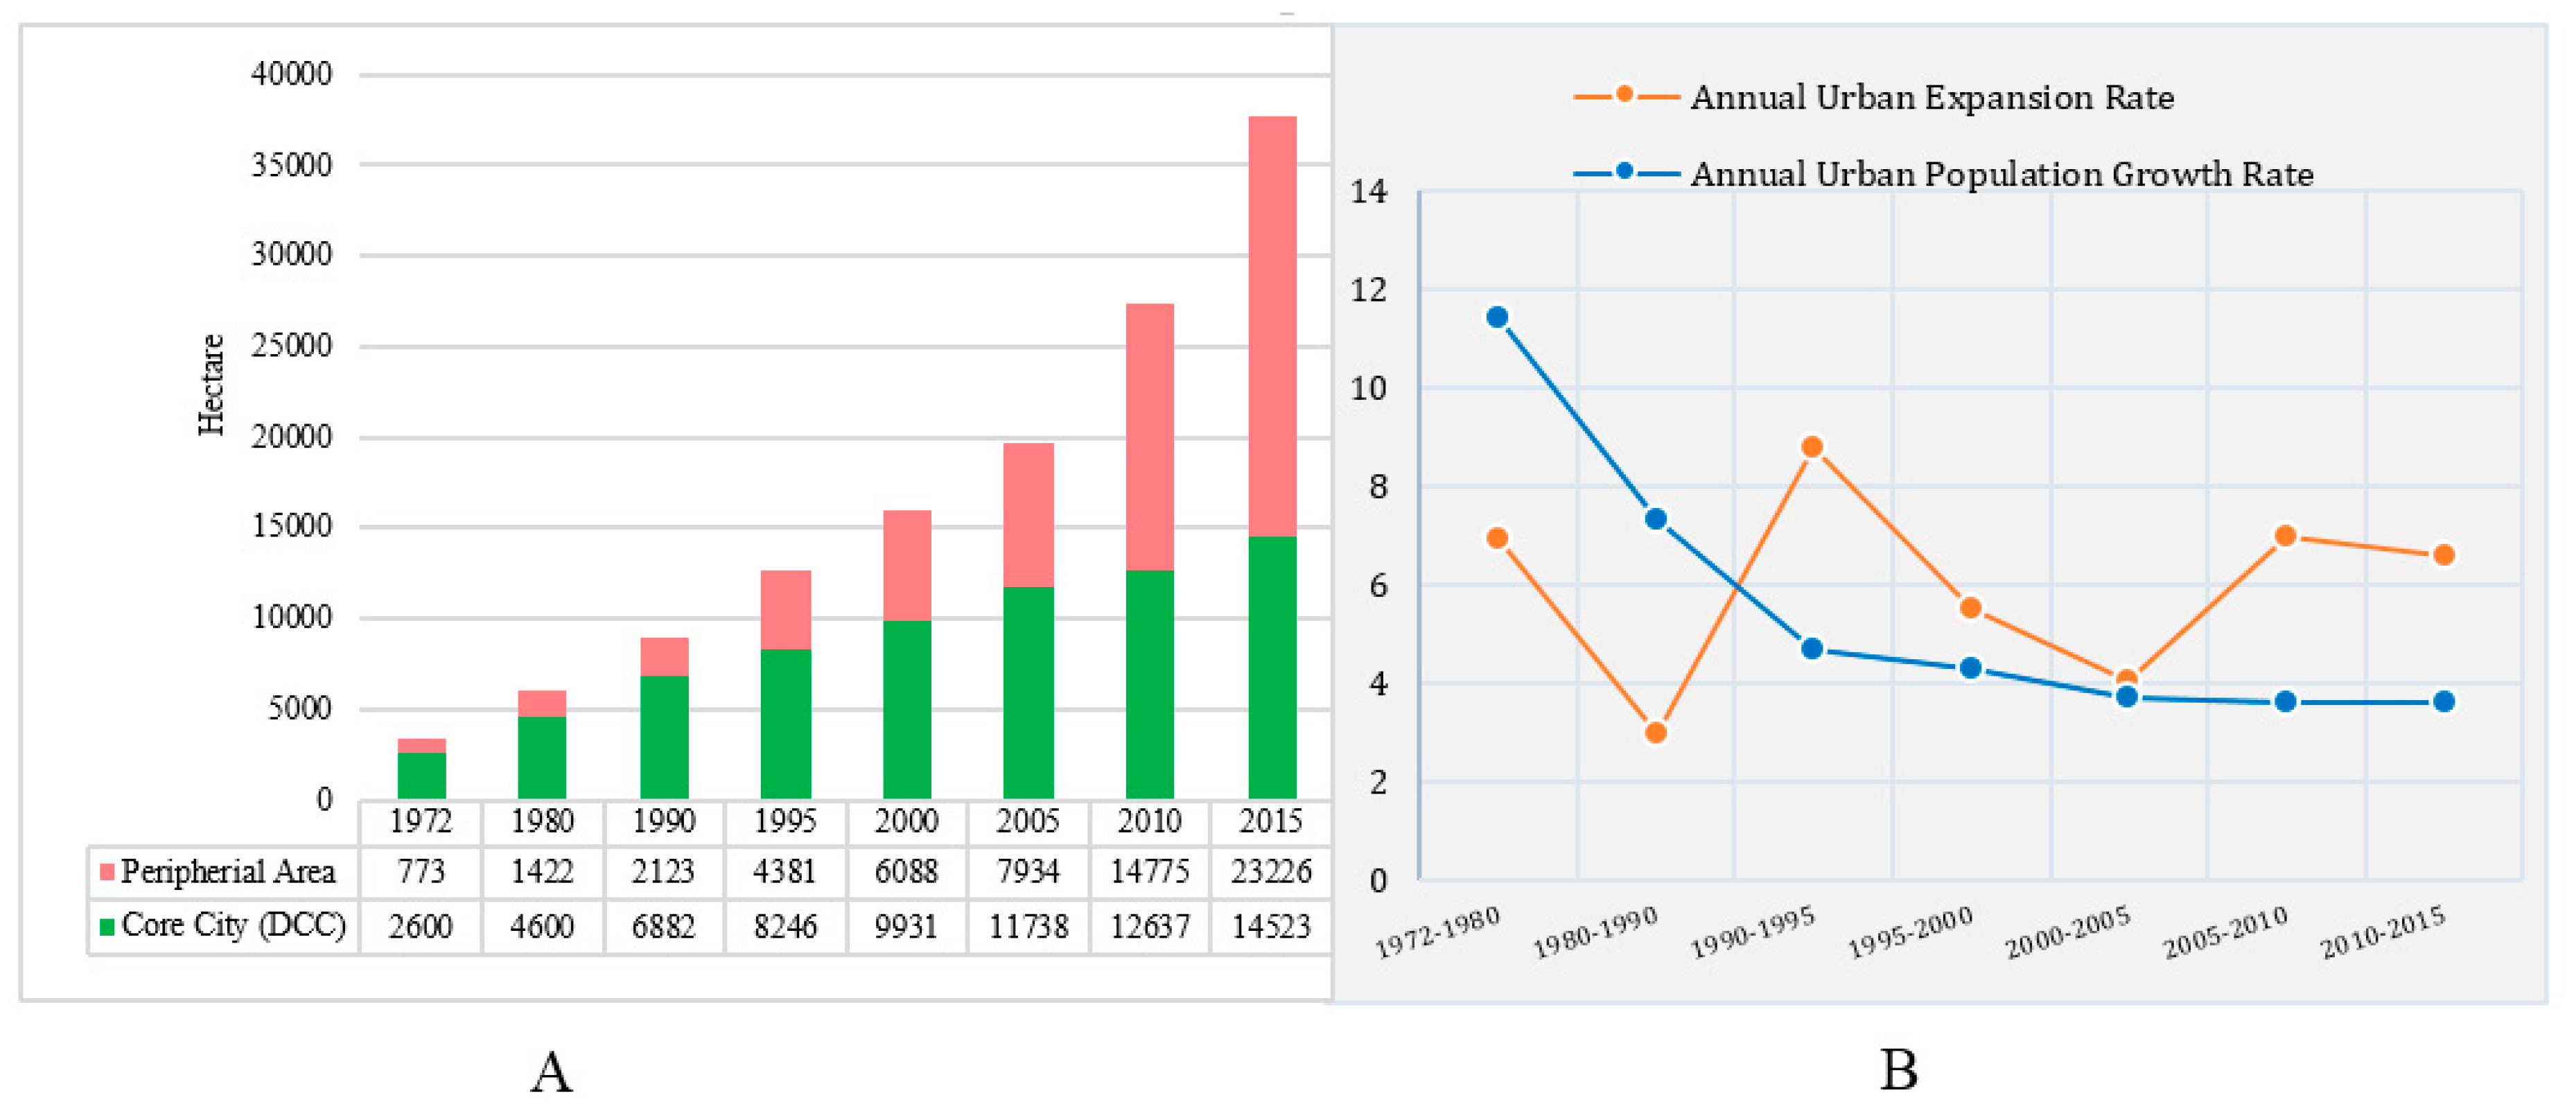
The spatial information derived from the time-series analysis land cover maps over the 43-year period shows that a continuous increase in built-up land occurred, at a rate much faster than the urban population growth in all connecting cities in this study. For example, between 1972 and 1980 and 1980 and 1990, the annual population growth rate was higher at 11.4% and 7.3%, respectively, while the urban expansion rate was only 7% and 3%, respectively (
Figure 10B). Later population growth continued to fluctuate around 3.5% per annum, but the urban expansion rate maintained stable growth trends at around 6% until the end of the study period. Another important feature of this urban growth, as presented in
Figure 10, is that peripheral growth was higher throughout the study period than the core city area (
Figure 10A). In the 43-year period the total peripheral growth rate was 2903%, while that of the core city area was 459%.
In this study we utilized eight dates of imagery to develop our time series with different sensors and spatial resolutions. Since these images were not captured at the same time, the water level in permanent reservoirs such as ponds, rivers, canals, and seasonal wetlands was variable. As can be seen, actual quantities of water bodies and wetlands do fluctuate in different periods; however, the general trend is that wetlands in peri-urban areas were encroached on heavily by agricultural pressure, brickfield expansion, or landfilling. The areas where these processes were taking place are identified in the land cover maps. A possible explanation for this rampant urban development and encroachment in the city outskirts is the lack of space in the core area for further development, combined with the somewhat inadequate public policies concerning these wetlands and their environmental protection.
The Greater Dhaka Area is a bustling megacity with more than 18 million people, making it one of the most populated cities in the world, with a density of 23,234 inhabitants per square kilometer within the core city area (DCC). Like other megacities in the developing world, such huge population growth in association with inadequate urban services and lack of authorities’ reign over growth management has led to an increase in environmental degradation, exponentially growing slums, and increases in pollution, poverty, disease, crime, land grabbing, corruption, and traffic congestion. Fifty-five government agencies work to provide civic services in Dhaka, all typically following their own trajectories in decision-making, which often leads to chaos among the differing authorities, rarely reflecting citizens’ wishes in the implementation of development plans. In terms of driving urban expansion, existing planning guides played little role compared to individual and corporate agents such as real-estate developers, industrial entrepreneurs, investors, and other vested groups. Real-estate developers and manufacturing investors, such as export-oriented garment manufacturers in the city outskirts, have been instrumental in shaping urban development in Dhaka. Hence, this study’s findings highlight that a rapidly growing city like Dhaka should be managed through the proactive protection of natural and ecologically sensitive areas, along with the involvement of landowners, locals, land developers, and multilevel stakeholders based on a shared long-term vision concerning the most desirable and sustainable urban growth for Bangladesh.


