Abstract
Innovation in the agro-food system has become a strategy increasingly used by companies as a means to increase their competitiveness and position themselves in the market. In this context, the objective of this work is to identify the attitudes and sensory perceptions of consumers towards food technology through two scales (food technology neophobia and domain specific innovativeness) and hedonic tastings. For this, a new product was selected in the market: powder to prepare rice with milk. Most consumers have attitudes toward low neophobia to products with food technology, but there is also some caution, a situation that is corroborated by the moderate predisposition towards innovations. Color and flavor attributes can make the difference in positive perceptions. It should not be forgotten that there is a segment of innovative consumers that represent a key market.
1. Introduction
Innovation in products is a strategy to achieve competitiveness in the food sector and meet corporate objectives. In order to be carried out, it is necessary that the managers of the company make a large investment of resources, not only economic, but of time and personnel. Hence, before launching this innovation to the market, many tests and investigations are carried out. Despite this, failure rates remain very high, around 80% [1,2,3,4,5]. In the particular case of Mexico it is 85% [6].
The success or failure of an innovation can be multifactorial and conditioned by culture, by rejection of new products, ethnocentrism, economic and social aspects, among others [7]. In this sense, when talking about new foods, many of them implement food technologies, a concept that some consumers generate aversion, so in recent years, the trend of research have focused on the analysis of consumer phobia toward products with food technology [8,9,10,11,12,13].
Cooperative research in food science, engineering and economics can generate technologies and market innovations that can serve as an impulse for commercialization and agro-industrial development. However, simply generating a promising technology is not enough to transform agriculture or consumer perception. Research must address the emerging limitations that the next generation of technology users can face, develop capabilities and continuously provide technical assistance until technology is mature [14].
Identifying population segments that are more or less neo-phobic and early adopters of food technologies plays an essential role in the success of a new product from a marketing standpoint. In this context, the objective of this paper is to identify the attitudes and sensorial perceptions of consumers towards food technologies. To achieve this, we used a traditional dessert with an innovative process: powder to prepare rice with milk. This seeks to generate information that is useful to the Mexican agro-industrial sector and to improve competitiveness, by offering goods that are demanded and meet the needs of individuals. To improve attributes such as price, practicality, etc., with respect to their competitors, which will allow them to maximize their profits. Since this sector has grown considerably in recent years, mainly due to its productivity, availability of raw materials, and the country’s capacity to serve as an export platform for more than 40 countries with which it has trade agreements [15].
This paper is the first to contribute to a better understanding of different perceptions of food technology innovations among Mexican consumers, specifically: (1) The results show that most consumers present attitudes towards a low neophobia to products with food technology; (2) There is a moderate predisposition towards food innovations and the classification of consumers is in the group of followers; (3) In the sensory analysis is found that rice-based dessert is accepted, however, there is an influence of the neophobia and innovativeness level on the perceptions of the participating individuals.
The present document is integrated by four more sections: Theoretical Background, Methodology, Results and Discussion.
2. Theoretical Background
2.1. Food Technology Neophobia
In the application of food technologies, public trust is a crucial and a fundamental aspect in their perception [16,17,18]. Negative attitudes toward food technologies may prevent widespread adoption and result in product failure [13]. All this forces us to question the future of the implicit categorizations that condition food tastes and rejections [19].
In this line, the authors Coppola and Verneau [20] developed an analysis on the main psychometric scales to measure the acceptance of food technologies (Table 1). The Food technology neophobia scale (FTNS) of Cox and Evans [8] aims to be a better tool for predicting consumers’ willingness to try new foods with technology than the Pliner and Hobden [21] food neophobia scale because it focuses on the use of technology rather than food [22].

Table 1.
Main psychometric scales.
The application of FTNS has been mostly limited to developed countries: Australia [8,9], Italy [10,11,20,25,26,27], Canada [7,22], South Korea [28] and Poland [29]. In the case of developing countries we find Brazil [12], Uganda [13] and Chile [30] with variability in the results between both contexts (developed and developing countries) without reaching consensus; therefore, possibilities are still being explored. The evidence on studies in Mexico is non-existent, therefore, this research is one of the first to provide guidelines in this line and allows to know the preferences of the Mexican consumer towards the products elaborated with food technology.
The most commonly used food technologies in recent studies have been: pasteurized fruit juice, high-pressure fruit juice processing, salads in modified atmosphere packaging, triploid prawns, genetically modified oilseeds and bioactive yoghurt [8,9], processed organic food, light and frozen [10,11,20,25] and the use of nanotechnology [12,22,26,28], vacuum packaging [7], fortified and functional products [27,29]. Some findings that have been obtained in a comparative way indicate that Brazilians are less neo-phobic than Australians and Canadians [9,12,22], the participants are unfamiliar with genetically modified food and nanotechnology, influenced by risk and perceived benefit as well as the level of confidence in the food industry [12,26], there is also a predictive effect between ethical values and ecological awareness with the intention of buying genetically modified food [28].
Although the FTNS is of recent appearance, it has been validated by Chen et al. [7], Evans et al. [9], Matin et al. [22], Verneau et al. [11] and Coppola et al. [25], although the small number of investigations do not allow the validation of their use in different contexts [13], particularly in the case of developing countries such as Chile, where FTNS has been reduced to a single factor which comprises nine items instead of 13 [30].
2.2. Domain-Specific Innovativeness
Innovation is considered a fundamental basis for development and competitiveness, so that ideas, methods, innovative structures, as well as new products or services are seen as important drivers of organizational and economic growth [31,32,33]. In this context, innovation is a technological and social change [34]. In order to innovate it is necessary to have a broad knowledge of the needs of consumers and from this perspective, some studies have related the adoption of new products with socioeconomic characteristics [35]. Younger consumers are more innovative than older ones [36,37,38,39]; The greater the socioeconomic status of the consumer, as well as the level of education, the greater the possibility of being more innovative.
Also the innovation is more accepted the lower the difference is in relation to the system of representations and the pre-existing culture [40] of the consumers, which is presented in a very marginal way and consumer distrust is a primary affective state linked to its survival instinct and is not modified by simple reasoning [41].
In this sense, some research indicates that the innovative tendency of the consumer (innovativeness) is a consistent predictor of the adoption of innovations [42,43,44], reflecting a predisposition to learn and adopt innovations (new products) within a Domain-Specific Innovativeness DSI [42], in such a way that innovative consumers have a greater propensity for consumption than the conservatives [45].
Falcao et al. [46] in their meta-analysis have related the DSI with seven elements based on a meta-analysis: (1) adoption of innovations; (2) attitude; (3) behavioral intent; (4) use of the product; (5) leadership of opinion; (6) opinion search and; (7) perception of risk, with significant results except for the search for opinion. Recent investigations have used it comparatively in different contexts [38,47,48,49,50], particularly in the case of Mexico, analyses have been made on innovative processes in some foods such as table grapes, pecans and maize [51,52]. However, from a consumer behavioral perspective, the application of the DSI scale is incipient, and we can find the studies of Terán et al. [39] and Salgado et al. [53] with interesting findings for marketing management.
2.3. Sensory Analysis
Sensory analysis of food is an examination of the organoleptic properties of a product feasible with the senses and is divided into three groups: descriptive, discriminative and consumer (hedonic tasting) [54]. In this work, only the hedonic tasting was applied, where the consumer is asked to assess the degree of general satisfaction that a product produces using a scale. From this point of view, consumers summarize their perception of ideas about authenticity and quality; this means the perfect adaptation to their culture and to their system of representations [40].
Sensory analysis has been an effective instrument for the quality control and acceptability of novel foods in investigations around the world such as: white strawberry [55], potato chips [56], soybean oil [57], fresh cheese [58], maracuya [59], corn tortilla [60], daily supplements [61], mandarin juice [62], sausages with orange peel flour [63], wine [64] and even in insects [65,66].
3. Methodology
The research is cross-sectional, exploratory with a quantitative approach. It consisted of three phases: (1) Product selection; (2) Design of the instrument and (3) Sensory analysis.
(1) Product selection
For the selection of the product a linear route was made by the supermarkets in which it was sought to find a product that would satisfy the food technology application feature and also be based on traditional Mexican food. The powder was selected to prepare rice with milk, although the product is of Spanish heritage, the Mexicans have adopted it. The product is produced by a Swiss multinational company. The processing technology is an artificial process of drying food by hot air action through industrial processes, in which the purpose is the partial or total removal of water contained in food. It is an instant dessert that offers time savings in its preparation, which turns out to be a trend in the market given the current needs and changes in consumption patterns. This position is reflected in the sector, in 2014, the processed food industry’s production in Mexico was 135.5 billion dollars, which represented 23.4% of the manufacturing GDP and 3.9% of the national GDP. Value added is 37.4% [15].
From a consumer perspective, desserts represent an important part of Mexico, in recent research of 91.3–95% of respondents like desserts, consider it a good gesture to have dessert when friends and family are invited home [67,68]; they are also accustomed to consuming them as part of breakfast or a snack [69].
(2) Instrument design
A measurement instrument was designed that was applied through a personal survey directed to the consumers to know their attitudes towards the new foods with technology, composed of: (1) FTNS scale (food technology neophobia scale) of Cox and Evans [8]; (2) Goldsmith and Hofacker [42] DSI (Domain-Specific Innovativeness) scale and; (3) sociodemographic aspects (gender, age, marital status, income level and educational level). The FTNS is integrated by 13 items that measures four factors: (1) technology in new foods is unnecessary; (2) risk perception; (3) healthy option and; (4) media information (Table 2) and is evaluated in Likert scale scores of five or seven points, with a range of possible scores of 13–65 and 13–91 [9], respectively. Before performing any analysis, the scores corresponding to the four items indicated with (I) must be inverted in order to obtain the same values. The higher this score, the greater the phobia of the individual to food technology.
Table 2.
FTNS scale.
The DSI scale contains six items (Table 3) and is evaluated on a Likert scale of five or seven points, with a range of possible scores of 6–30 and 6–42, respectively. A total score was calculated for each individual, which is obtained from the sum of the scores assigned to each of the items. As in the FTNS scale, it is recommended to invest three of the items (I) that make up the scale, in order to obtain valuations in the same direction. Once the scores have been obtained, consumers are segmented into innovators and followers.
Table 3.
DSI scale.
3.1. Sample
The formula for finite populations was used. For the calculation of the sample, the data of the National Institute of Statistics and Geography (INEGI) was taken as reference (Caborca Sonora population 81,309), establishing a sample of 266 surveys (95% confidence level and 6% margin of error) similar to other studies about FTNS and DSI [9,10,42,47]. The target market was people older than 18 years of age, from the upper middle (C+), middle (C), low middle (D) class of Caborca (Sonora, Mexico) based on the index of socioeconomic levels of the Mexican Association of Market Research and Public Opinion [70] which measures well-being.
The data collection was carried out in two phases: first, a pilot test for debugging the scales and second, the application of the final survey, carried out in the months of September to October 2015 by means of a simple random sampling. The information was obtained with the following criteria: Firstly, the invitation was made to consumers to participate by responding to a survey, once they agreed to collaborate they were offered a brief introduction and explanation of the research, and the survey was applied face to face. The interviewees were selected for being habitual consumers of desserts; they participated voluntarily and without remuneration.
The sample is composed of 71.4% women and 28.6% men, 32.7% are 36–44 years old, followed by the range of 25–35 years (25.2%); 41.7% are married and 30.5% single; 41.4% have university degrees and the level of family income is concentrated in $2000–$8000 per month (85%) (Table 4).
Table 4.
Demographic characteristics.
(3) Sensory analysis (hedonic tasting)
In the third stage, a sensorial analysis was performed, on 24 October 2015. A group of people (n = 23) who consumed rice pudding, over 18 years old, were selected. The test was performed in a specific room, with adequate lighting. Two trademark products were handled with different types of processes: (a) new process techniques, according to Bigliardi and Galati [71] and; (b) traditional, both of similar consistency and color to make the evaluations.
Two tastings were made, the first without showing the brand (blind tasting) and the second with showing the brand. This was in order to detect significant differences between one shot and another. Bottled water was served to be used between the samples. The scoring method was used, that is to say for each defined descriptor (taste, smell, color, texture, appearance and consistency), it was assigned a scale of numerical scores. The hedonic scale used for valuations was 0 (I do not like it at all) to 5 (I really like it).
3.2. Data Analysis
In order to measure the internal consistency of the scales used, a reliability analysis was performed using Cronbach’s alpha, which allowed the elimination of a series of variables for their adequacy. The analysis was carried out with the statistical package SPSS 20.0 (20.0, IBM Corp., IBM SPSS statistics for Macintosh, Armonk, NY, USA). Univariate analyzes were carried out to study the behavior of the variables individually, bivariate (ANOVA and Chi-square test) to know the differences between groups and multivariate (Exploratory Factorial) to debug the scale and group the items in several factors.
Once the measurement of both scales were obtained (TFNS and DSI), consumers were segmented in the FTNS scale in high and low food technology phobia and DSI in innovators and followers.
4. Results
We found that 53.2% of people surveyed know that the new powder is used to prepare rice with milk and the rest (46.8%) do not know of its existence in the market. On the FTNS, first, items were reversed (R) in the pilot test, the scale was eliminated with nine items out of 13 to be able to increase reliability. A factorial analysis was performed to determine the components that the population associates with the FTNS and to verify the original scale by means of the method of extraction of components with Varimax rotation. The Bartlett sphericity test was significant (p < 0.000) and the Kaiser–Meyer–Olkin (KMO) was 0.827 indicating the relevance of performing the analysis.
Of the four factors measured by the FTNS ((1) New food technologies are unnecessary; (2) Perception of risks; (3) Healthy choice and (4) Media information) in the study we only extracted two factors as a final solution; similar results are found in Chen et al. [7] and JeżEwska-Zychowicz and Królak [29]. Items with factor loads >0.4 were selected according to the suggestion of Steves [72]. The two factors explain the 62.24% of the data variability, which Hair et al. [73] consider admissible. Factor 1 (43.95%) relates to consumers’ perception of new food technologies and their risks and is composed of seven items that describe negatives attitudes towards new food; four items belong to factor 1 (new food technologies are unnecessary) and three items to factor 2 (perception of risks) of the original scale [8]. Contrary to factor 2 (18.28%) that reflects items where new food technologies are healthier choices (is composed by two items of the original scale). F1 has acceptable internal consistency measured by Cronbach’s Alpha (factor 1 α = 0.869) as proposed by Hair et al. [73] for exploratory studies; for F2 the reliability is moderate (factor 2 α = 0.615) this depends on the length of the scales [74] (Table 5).
Table 5.
Factorial Analysis.
It is observed that the mean values (quantified on a five-point Likert scale) are centered on the following. New food technologies reducing the natural quality of food (3.71). New products produced using new food technologies can help people to have a balanced diet (R) (3.61). New foods are no healthier than traditional foods (3.56) and new food technologies can have long-term negative effects on the environment (3.54), which suggests an attitude towards food aversion with technology (Table 5). However, it is a low phobia that the consumer presents, since when extracting the mean value of the FTNS is 29.19 and the median of 30 (typical deviation of 7064), i.e., individual scores equal to or below this value indicate that the respondent is relatively less phobic and thus tends to reject food technology less. Higher scores, on the other hand, indicate a relatively greater rejection of this type of product. Thus, the low phobia segment is formed by 66.5% of the sample and the high phobia segment by 33.5%. To know the differences between groups, a chi-square test was performed with significant results between segments at 5% (X2 = 0.000) (Figure 1).
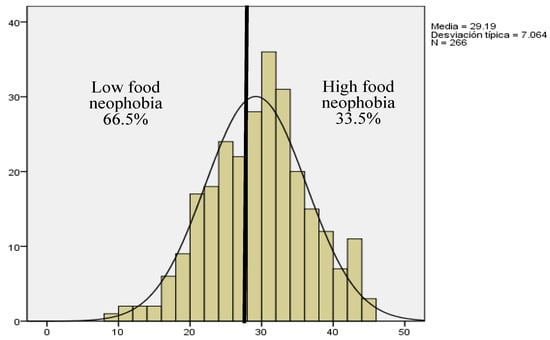
Figure 1.
Distribution of FTNS according to consumer ratings.
The FTNS has been correlated with sociodemographic variables (age, educational level and income level). It was found that age is positively related to factor 1. The technology in new foods is unnecessary and perception of risk; it is inferred that older people tend to perceive that technology in new foods is unnecessary and a perception of risk similar to the study by De Steur et al. [13]. The educational and income level is negatively related to healthy option factor 2, consumers with less studies and low economic level will perceive foods with technology as a healthy option (Table 6). In contrast, people with high education and income level will perceive new food technologies as a less healthy option.
Table 6.
Correlation between the FTNS and DSI scales and socio-demographic variables.
Some studies have found no significant relationship with the variables age, educational level and income level [7,8,9]. The difference in these results is probably the context of the country where the scale was applied, since they are developed countries and subscribes to this research are from a developing country. For the rest of the variables (marital status and sex) there are no significant correlations.
On the DSI, initially the pilot scale was scrubbed with three items out of six. To verify its unidimensionality [75], a factorial analysis was performed, obtaining a total explained variance of 83.81% in the first factor, given that a value greater than 40% is considered unidimensional [76], Bartlett’s sphericity test was significant and the KMO was 0.742. The internal consistency of the items measured by Cronbach’s alpha coefficient was α = 0.903, similar to that obtained in other studies [38,42,47,53].
The DSI has been correlated with sociodemographic variables (age, educational level and income level). It was found that age is negatively related to the adoption of innovations, that is, the older the individuals tested the innovative character decreases, similar results are presented in Leek et al. [77], Rogers [36], Tellis et al. [37], Barrena et al. [38] and Terán et al. [39].
In the case of the variables educational level and income there is a positive relation, to greater economic status and academic degree that the individual has, can trigger a greater innovative attitude (Table 6).
On the average values of the DSI (scored on a five-point Likert scale) the highest is centered on: “In general, I am the first of my circle of friends to buy new foods” (3.54) (Table 7). There was a moderate attitude towards innovations, the average value of the consumer was 8.41 and the median value was 8 (typical deviation of 1.51). The median was used as the cut-off point, so it was segmented to the consumers surveyed in innovators and followers, finding that 44.7% is innovative and 55.3% follow. To know the differences between groups, a chi-square test was performed with significant results between segments at 5% (X2 = 0.000) (Figure 2).
Table 7.
Mean score.
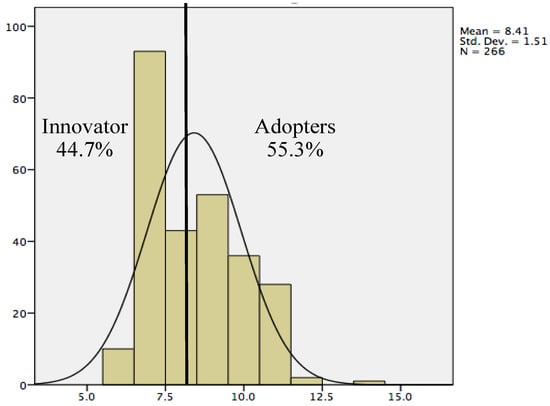
Figure 2.
Distribution of DSI according to consumer ratings.
Sensory Analysis (Hedonic Tasting)
The two blind/open samples were tasted and the ballots delivered were filled. The results show higher scores for the color (4.35) and appearance (4.35) of the rice with new milk; on the contrary, the taste (3.22) is the lowest evaluated of the traditional rice with milk. To know the differences between variables, a one-way ANOVA test was performed, which allowed the simultaneous study of the differences with a fixed level of significance. There are significant differences in color and appearance (Table 8).
Table 8.
ANOVA (test-blind).
A second open hedonic tasting was carried out, in which the brands of the compared products were made known, with the purpose of knowing if there is influence of the brands in the perception of the consumer. The findings are very interesting; the new rice with milk reduces its score in almost all variables and traditional rice with milk is maintained, which suggests that consumers do not have a good perception of the innovative product brand (instant desserts); however, the ANOVA does not present significant differences between the attributes (Table 9).
Table 9.
ANOVA (open test).
5. Discussion
Innovation in the agri-food system has become a strategy increasingly used by companies as a means to increase their competitiveness and position themselves in the market. Thus, some companies have initiated changes to generate what the market requires and thus be able to satisfy the needs and desires of consumers. In this context, the objective of this work was to identify the sensory attitudes and perceptions of consumers towards food technologies through two scales: food technology neophobia by Cox and Evans [8] and domain specific innovativeness of Goldsmith and Hofacker [42], and hedonic tastings, using the product rice with milk powder.
The main findings show that most consumers present attitudes towards a low neophobia to products with food technology, which is an important segment (66.5%) that manifests a need for innovative foods, but there is also caution, that is, there is a coexistence between a demand for modernity and for the natural [25]. That is, on the one hand, consumers perceive food with technology as unnecessary and at risk, but on the other hand, they consider that through the process of innovation, new foods can be healthier options. This situation is corroborated by the results of attitudes towards innovations, where there is a moderate predisposition towards new foods and the classification of consumers is in the group of followers (55.3%).
Regarding sensory perceptions, individuals identified the food product with their organs. Color and appearance were the attributes most valued in (new) rice with milk (test-blind); on the contrary, traditional rice with milk, had a low valuation in flavor, suggesting that the new product was more liked by the participating consumers. However, in the open test, the perception changes and the taste element is better evaluated in the traditional dessert, indicating that there is an influence of psychographic elements like low neophobia and the moderate innovativeness on the perception of the participating individuals. This finding plays an important role in shaping consumer acceptance, purchase and future consumption. In addition to the brand in the category of instant desserts which can also change the consumer perceptions. Thus, it can happen that a food has a high hedonic valuation but does not succeed in the market; conversely, it would be very difficult for a hedonic valuation to conquer a market for many efforts made by the marketing department.
As business implications, knowing the attitudes and perceptions of consumers presents an advantage for the introduction of new foods in the Mexican market to define differentiated strategies between segments. Strategies should be designed to improve consumer perception and confidence; several studies clearly indicate that there is a general lack of knowledge and understanding of new food technologies (for example: nanotechnology, cloning, genetic modification, agrobiotechnology, etc.) in terms of the presence and its application in food production in the agri-food industry [78]. In this line, consumers’ perceptions about the communication of new foods in the most innovative segments and with less neophobia can be studied by the company. Marketing efforts should be directed at informing the consumer about the elements of their new products specifically in terms of a healthy choice. Additionally, manufacturers’ area can improve the process of food, considering the appearance, texture, color and taste of foods. In the particular case of this study, we can make a difference in the positive perceptions of consumers and the inclination to purchase in such a way that there is no need to lose a segment of innovative consumers that represent a key market.
Limitations and Future Investigations
Finally, as limitations of this research, when focusing on rice with milk powder, the results cannot be generalized to other new foods; in the same way it must be taken into account that it is exploratory in nature and is confined to a region-specific study, and extrapolation to other settings should be done with caution. Another limitation was the moderate reliability (Cronbach’s alpha) of F2 (Healthy choice); this may be due to the fact that the coefficient is related to the standard deviation of the scores obtained by the subjects of the sample and the length of the scale. Also, it may be because the product analyzed is an instant dessert and people generally do not associate it with being a healthy food.
As future lines of research, the influence of brand perception in the consumers’ preferences can be analyzed to improve the adoption of technological food innovations. Therefore, it would be interesting to extend the scope of the research to other food innovations or to other markets. Particularly, to explore new food with technology of a healthy choice, i.e., organic processed food.
Acknowledgments
We would like to thank the University of Sonora and Northwest Biological Research Center of Mexico (CIBNOR) for the financial support for this research. We thank the time and effort that two anonymous reviewers devoted to improve an earlier version of our manuscript.
Author Contributions
Lizbeth Salgado-Beltrán, Luis F. Beltrán-Morales, Alma T. Velarde-Mendivil, María E. Robles-Baldenegro developed the idea. Lizbeth Salgado-Beltrán and María E. Robles-Baldenegro analyzed the data. Lizbeth Salgado Beltrán, Luis F. Beltrán Morales and Alma T. Velarde-Mendivil wrote the paper.
Conflicts of Interest
The authors declare no conflict of interest.
Abbreviations
The following abbreviations are used in this manuscript:
| FTNS | Food Technology Neophobia Scale |
| DSI | Domain-Specific Innovativeness |
| ANOVA | Analysis Of Variance |
References
- Barrena, R.; Sánchez, M. Nuevos alimentos, aceptación y efecto en el desarrollo agroalimentario según sexo. Agro Rev. 2013, 19, 87–102. Available online: https://www.saber.ula.ve/bitstream/123456789/37414/3/R36_A5_Barrena_y_Sanchez.pdf (accessed on 3 February 2015).
- Gourville, J.T. Eager Sellers and Stony Buyers: Understanding the Psychology of New-Product Adoption. Harv. Bus. Rev. 2006, 84, 98–106. Available online: https://hbr.org/2006/06/eager-sellers-and-stony-buyers-understanding-the-psychology-of-new-product-adoption (accessed on 3 February 2015). [PubMed]
- Gresham, G.; Hafer, J.; Markowski, E. Inter-functional market orientation between marketing deparments and technical deparments in the management of the new product development process. J. Behav. Appl. Manag. 2006, 8, 53–65. [Google Scholar]
- Stewart-Knox, B.; Mitchell, P. What separates the winners from the losers in new food product development? Trends Food Sci. Technol. 2003, 14, 58–64. [Google Scholar] [CrossRef]
- Grunert, K.G.; Valli, C. Designer-made meat and dairy products: Consumer-led product development. Livest. Prod. Sci. 2001, 72, 83–98. [Google Scholar] [CrossRef]
- Breakthrough Innovation: No Hay Una Receta Para El Éxito, Simplemente Se Debe Entender Al Consumidor. Available online: http://www.nielsen.com/mx/es/press-room/2014/breakthrough-innovation.html (accessed on 11 October 2016).
- Chen, Q.; Anders, S.; An, H. Measuring consumer resistance to a new food technology. A choice experiment in meat packaging. Food Qual. Preference 2013, 28, 419–428. [Google Scholar] [CrossRef]
- Cox, D.N.; Evans, G. Construction and validation of a psychometric scale to measure consumers’ fears of novel food technologies: The food technology neophobia scale. Food Qual. Preference 2008, 19, 704–710. [Google Scholar] [CrossRef]
- Evans, G.; Kermarrec, C.; Sable, T.; Cox, D.N. Reliability and predictive validity of the food technology neophobia scale. Appetite 2010, 54, 390–393. [Google Scholar] [CrossRef] [PubMed]
- Caracciolo, F.; Coppola, A.; Verneau, F. Validation of a psychometric scale to measure consumers’ fears of modern food technologies. Proc. Food Syst. Dyn. 2011, 160–174. [Google Scholar] [CrossRef]
- Verneau, F.; Caracciolo, F.; Coppola, A.; Lombardi, P. Consumer fears and familiarity of processed food. The value of information provided by the FTNS. Appetite 2014, 73, 140–146. [Google Scholar] [CrossRef] [PubMed]
- Vidigal, M.C.T.R.; Minim, V.P.R.; Simiqueli, A.A.; Souza, P.H.P.; Balbino, D.F.; Minim, L.A. Food technology neophobia and consumer attitudes toward foods produced by new and conventional technologies: A case study in Brazil. LWT Food Sci. Technol. 2015, 60, 832–840. [Google Scholar] [CrossRef]
- De Steur, H.; Odongo, W.; Gellynck, X. Applying the food technology neophobia scale in a developing country context. A case-study on processed matooke (cooking banana) flour in Central Uganda. Appetite 2016, 96, 391–398. [Google Scholar] [CrossRef] [PubMed]
- Abass, A.B.; Awoyale, W.; Alenkhe, B.; Malu, N.; Asiru, B.W.; Manyong, V.; Sanginga, N. Can food technology innovation change the status of a food security crop? A review of cassava transformation into “bread” in Africa. Food Rev. Int. 2016, 34, 87–102. [Google Scholar] [CrossRef]
- PROMEXICO. Alimentos Procesados, Diagnostico Sectorial. Available online: https://www.gob.mx/promexico/acciones-y-programas/alimentos-procesados (accessed on 10 October 2016).
- Costa, M.; Gil, M.J.; Trail, W.B. Consumers acceptance, valuation of and attitudes towards genetically modified food: Review and implications for food policy. Food Policy 2008, 33, 99–111. [Google Scholar] [CrossRef]
- Siegrist, M. Factors influencing public acceptance of innovative food technologies and products: Food innovation management. Trends Food Sci. Technol. 2008, 19, 603–608. [Google Scholar] [CrossRef]
- Visschers, V.H.M.; Meertens, R.M.; Passchier, W.F.; Devries, N.K. How does the general public evaluate risk information? The impact of associations with other risks. Risk Anal. 2007, 27, 715–722. [Google Scholar] [CrossRef] [PubMed]
- Maho, J.; Pynson, P. Cantines, comment s’en débarrasser? Autrement 1989, 108, 200–204. [Google Scholar]
- Coppola, A.; Verneau, F. An empirical analysis on technophobia/technophilia in consumer market segmentation. Agric. Food Econ. 2014, 2, 1–16. [Google Scholar] [CrossRef]
- Pliner, P.; Hobden, K. Development of a scale to measure the trait of food neophobia in humans. Appetite 1992, 19, 105–120. [Google Scholar] [CrossRef]
- Matin, A.H.; Goddard, E.; Vandermoere, F.; Blanchemanche, S.; Bieberstein, A.; Marette, S. Do environmental attitudes and food technology neophobia affect perceptions of the benefits of nanotechnology? Int. J. Consum. Stud. 2012, 36, 149–157. [Google Scholar] [CrossRef]
- Fife-Schaw, C.; Rowe, G. Public perceptions of everyday food hazards: A psychometric study. Risk Anal. 1996, 16, 487–500. [Google Scholar] [CrossRef] [PubMed]
- Bak, H. Education and public attitudes toward science: Implications for the “Deficit Model” of education and support for science and technology. Soc. Sci. Q. 2001, 82, 779–795. [Google Scholar] [CrossRef]
- Coppola, A.; Verneau, F.; Caracciolo, F. Neophobia in food consumption: An empirical application of the ftns scale in southern Italy. Ital. J. Food Sci. 2014, 26, 1–35. [Google Scholar]
- Sodano, V.; Gorgitano, M.T.; Verneau, F.; Vitale, C.D. Consumer acceptance of food nanotechnology in Italy. Br. Food J. 2016, 118, 714–733. [Google Scholar] [CrossRef]
- La Barbera, F.; Amato, M.; Sannino, G. Understanding consumers’ intention and behaviour towards functionalised food. Br. Food J. 2016, 118, 885–895. [Google Scholar] [CrossRef]
- Kim, Y.G.; Jang, S.Y.; Kim, A.K. Application of the theory of planned behavior to genetically modified foods: Moderating effects of food technology neophobia. Food Res. Int. 2014, 62, 947–954. [Google Scholar] [CrossRef]
- Jeżewska-Zychowicz, M.; Królak, M. Do Consumers’ Attitudes towards Food Technologies and Motives of Food Choice Influence Willingness to Eat Cereal Products Fortifi ed with Fibre? Pol. J. Food Nutr. Sci. 2015, 65, 281–291. [Google Scholar] [CrossRef]
- Schnettler, B.; Miranda-Zapata, E.; Miranda, H.; Velásquez, C.; Orellana, L.; Sepúlveda, J.; Lobos, G.; Sánchez, M.; Grunert, K.G. Psychometric analysis of the Food Technology Neophobia Scale in a Chilean simple. Food Qual. Preference 2016, 49, 176–182. [Google Scholar] [CrossRef]
- Escorsa Castells, P.; Valls i Passola, J. Tecnología e Innovación en la Empresa. Dirección y Gestión; Editorial UPC: Barcelona, Spain, 1997; p. 342. ISBN 9788483012253. [Google Scholar]
- Fagerberg, J. Innovation: A Guide to the Literature; Fagerberg, J., Mowery, D., Nelson, R., Eds.; The Oxford Handbook of Innovation, Oxford University Press: Oxford, UK, 2004; pp. 1–26. ISBN 9780199264551. [Google Scholar]
- Ahmed, P.K.; Shepherd, C.D.; Ramos Garza, L.; Ramos Garza, C. Administración de la innovación, 1st ed.; Pearson: London, UK, 2012; p. 320. ISBN 9786073208550. [Google Scholar]
- Earle, M.D. Innovation in the food industry. Trends Food Sci. Technol. 1997, 8, 166–175. [Google Scholar] [CrossRef]
- Michon, C.; O’sullivan, M.G.; Sheehan, E.; Delahunty, C.M.; Kerry, J.P. Study on the influence of age, gender and familiarity with the product on the acceptance of vegetal soups. Food Qual. Preference 2010, 21, 478–488. [Google Scholar] [CrossRef]
- Rogers, E.M. Diffusion of Innovation, 5th ed.; The Free Press: New York, NY, USA, 2003; p. 576. ISBN 978-0743222099. [Google Scholar]
- Tellis, G.J.; Yin, E.; Bell, S. Global consumer innovativeness: Cross-country differences and demographic commonalities. J. Int. Mark. 2009, 17, 1–22. [Google Scholar] [CrossRef]
- Barrena, R.; García, T.; López-Mosquera, N. Determinantes socioeconómicos y emocionales en el consumo de nuevos alimentos. In IX Congreso De Economía Agraria De La Asociación Española De Economía Agraria (AEEA); Castelldefelds: Barcelona, Spain, 2013. [Google Scholar]
- Terán, L.A.; Camarena, D.M.; Velarde, T.; Robles, J.C. Percepción del consumidor hermosillense hacia la innovación en un producto alimentario: El caso del yogur. Invurnus 2015, 10, 19–27. Available online: http://www.invurnus.uson.mx/articulo.php?art=99&rev=19 (accessed on 2 August 2015).
- Contreras, J.; Gracia, M. Alimentación y Cultura, Perspectivas Antropológicas, 1st ed.; Editorial Ariel: Barcelona, Spain, 2005; p. 505. ISBN 84-344-2223-9. [Google Scholar]
- Lambert, C.A. The new environmentalism’. Home Improv. Mark. 1996, 233, 30–35. [Google Scholar]
- Goldsmith, R.E.; Hofacker, C.H. Measuring Consumer Innovativeness. J. Acad. Mark. Sci. 1991, 19, 209–221. [Google Scholar] [CrossRef]
- Huotilainen, A.; Pirttilä-Backman, A.; Tuorila, H. How innovativeness relates to social representation of new foods and to the willingness to try and use such foods. Food Qual. Preference 2006, 17, 353–361. [Google Scholar] [CrossRef]
- Banterle, A.; Cavaliere, A.; Carraresi, L.; Stranıeri, S. Innovativeness in food small business: What is its relationship with marketing? Agric. Econom. 2011, 57, 474–483. Available online: http://www.agriculturejournals.cz/publicFiles/48731.pdf (accessed on 7 February 2015).
- Gao, T.; Rohm, A.J.; Sultan, F.; Huang, S. Antecedents of consumer attitudes toward mobile marketing: A comparative study of youth markets in the United States and China. Thunderbird Int. Bus. Rev. 2012, 54, 211–224. [Google Scholar] [CrossRef]
- Falcao, C.; Junior, W.; de Oliveira Santini, F.; Hoffmann, C. Domain-specific innovativeness: A meta-analysis in business and consumer. Rev. Adm. Inov. 2016, 13, 48–67. [Google Scholar] [CrossRef]
- Dutra, M.; Kluwe, L.; Cardozo, F.; Marques, L. Willingness to try innovative food products: A comparison between British and Brazilian consumers. Braz. Adm. Rev. 2009, 6, 50–61. Available online: http://www.scielo.br/scielo.php?script=sci_arttext&pid=S1807-76922009000100005&lng=pt&nrm=iso (accessed on 6 February 2015).
- Gurtner, S.; Soyez, K. How to catch the generation Y: Identifying consumers of ecological innovations among youngsters. Technol. Forecast. Soc. Chang. 2016, 106, 101–107. [Google Scholar] [CrossRef]
- Hung, Y.; De Kok, T.M.; Verbeke, W. Consumer attitude and purchase intention towards processed meat products with natural compounds and a reduced level of nitrite. Meat Sci. 2016, 121, 119–126. [Google Scholar] [CrossRef] [PubMed]
- Junior, W.; de Oliveira Santini, F.; Hoffmann, C.; Falcao, C. Experiential value and domain-specific innovativeness during freemium game usage: Effects on child well-being. Young Consum. 2016, 17, 64–77. [Google Scholar] [CrossRef]
- Deschamps, L.; Escamilla, G. Hacia la Consolidación de un Sistema Mexicano de Innovación Agroalimentaria. Instituto Interamericano de Cooperación para la Agricultura (IICA): Mexico City, México, 2010. Available online: https://www.redinnovagro.in/documentosinnov/Innovacion%20Agroalimentaria%20final.pdf (accessed on 5 August 2015).
- Moctezuma, G.; Espinosa, J.A.; Cuevas, V.; Jolalpa, J.L.; Romero, F.; Vélez, A.; Bustos, D. Innovación tecnológica de la cadena agroalimentaria de maíz para mejorar su competitividad estudio de caso en el estado de Hidalgo. Rev. Mex. Cien. Agric. 2010, 1, 101–110. [Google Scholar]
- Salgado, L.; Bravo, B.; Camarena, D.M. Adopción de nuevos productos con diseño sustentable: El caso de la salsa de guacamole. Intercie 2016, 41, 414–418. Available online: https://www.interciencia.net/wp-content/uploads/2017/10/414-SALGADO-41-6.pdf (accessed on 15 June 2016).
- Asociación Española de Normalización y Certificación AENOR. Análisis Sensorial de Alimentos. Metodología. Guía General (ISO 6658:2005); Segunda edición Editorial AENOR: Madrid, Spain, 2010. [Google Scholar]
- Adasme, C.; Spiller, A.; Díaz, J. Determinación de las Preferencias del Consumidor de la Región Metropolitana hacia la Frutilla Blanca (Fragaria Chiloensis). Un Análisis Conjunto y una Prueba Sensorial. Rev. Econom. Agric. 2006, 10, 1–10. Available online: https://www.econbiz.de/Record/determinación-preferencias-del-consumidor-región-metropolitana-hacia-frutilla-blanca-fragaria-chiloensis-análisis-conjunto-una-prueba-sensorial-adasme/10008802925 (accessed on 15 February 2015).
- Ortega, J.; Rueda, E.O. Características sensoriales de papas utilizadas durante el freído y calidad química y nutrimental de los aceites de soya, canola y cártamo alto en oleico utilizados. Invurnus 2017, 12, 23–29. Available online: http://www.invurnus.uson.mx/articulo.php?art=128&rev=24 (accessed on 23 January 2017).
- López, J.R.; Valerio, G.; Monroy, J.A.; Medina, L.A.; O’mahony, M.; Angulo, O. Evaluation of a Simpler and More Sensitive Sensory Method for Measuring Rancidity in Soybean Oil. Rev. Gra. Aceit. 2006, 57, 149–154. [Google Scholar] [CrossRef]
- Ochoa, A.A.; Hernández, J.A.; López, E.; García, H.S. Rendimiento, textura y aceptación sensorial de queso panela adicionado con estabilizantes. Univ. Cienc. 2013, 29, 277–286. Available online: http://www.scielo.org.mx/pdf/uc/v29n3/v29n3a6.pdf (accessed on 18 February 2015).
- De La Cruz, J.; Vargas, O.M.; Del Angel, O.; Garcia, H.S. Estudio de las características sensoriales, fisicoquímicas y fisiológicas en fresco y durante el almacenamiento refrigerado de maracuya Amarillo (Passiflora edulis Sims var. Flavicarpa Degener), para tres cultivares de Veracruz México. Rev. Iberoam. Tecnol. Post. 2010, 11, 130–142. Available online: http://www.redalyc.org/articulo.oa?id=81315809004 (accessed on 18 February 2015).
- López, O.A.; Hernández, J.A.; Cárdenas, A.; Beristain, C.I.; Garcia, H.S. Sensory evaluation of maize tortillas supplemented with L-Lysine and L-Tryptophan. Food Sci. Technol. Int. 1997, 3, 175–179. [Google Scholar] [CrossRef]
- Jimenez, M.; Garcia, S.; Beristain, C.I. Sensory evaluation of dairy products supplemented with microencapsulated conjugated linoleic acid (CLA). LWT Food Sci. Technol. 2008, 41, 1047–1052. [Google Scholar] [CrossRef]
- Carbonell, L.; Izquierdo, L.; Carbonell, I. Sensory analysis of Spanish mandarin juices. Selection of attributes and panel performance. Food Qual. Preference 2007, 18, 329–341. [Google Scholar] [CrossRef]
- Chaparro, J.; Castillejos, B.I.; Carmona, R.P.; Escalona, H.B.; Pérez, M.D.L. Evaluación sensorial de salchichas con harina de cáscara de naranja y/o penca de maguey. Nacamch 2013, 7, 23–40. Available online: http://cbs.izt.uam.mx/nacameh/v7n1/Nacameh_v7n1_023_ChaparroHdz.pdf (accessed on 16 February 2015).
- Veale, R.; Quester, P. Consumer sensory evaluations of wine quality: The respective influence of price and country of origin. J. Wine Econ. 2008, 3, 20–39. [Google Scholar] [CrossRef]
- House, J. Consumer acceptance of insect-based foods in the Netherlands: Academic and commercial implications. Appetite 2016, 107, 47–58. [Google Scholar] [CrossRef] [PubMed]
- Caparros Megido, R.; Sablon, L.; Geuens, M.; Brostaux, Y.; Alabi, T.; Blecker, C. Edible insects acceptance by Belgian consumers: Promising attitude for entomophagy development. J. Sens. Stud. 2013, 29, 14–20. [Google Scholar] [CrossRef]
- Mercawise. Hábitos de Consumo en Postres. Available online: https://www.mercawise.com/blog/estudios-de-mercado/habitos-en-el-consumo-de-postres/ (accessed on 10 October 2016).
- Barry Callebaut. Reportaje Encuesta Habitos Y Preferencias En El Consumo De Postres Y Chocolate En México. Available online: http://www.restaurantesdemexico.com.mx/3802/Reportaje_Encuesta__Habitos_Y_Preferencias_En_El_Consumo_De_Postres_Y_Chocolate_En_Mexico.html (accessed on 1 May 2017).
- Euromonitor. Ice Cream and Frozen Desserts in Mexico, Mexico. Available online: http://www.euromonitor.com/ice-cream-and-frozen-desserts-in-mexico/report (accessed on 10 October 2016).
- Mexican Association of Market Research and Public Opinion AMAI (2015) Niveles Socioeconómicos de México. Available online: http://www.amai.org (accessed on 18 August 2015).
- Bigliardi, B.; Galati, F. Innovation trends in the food industry: The case of functional foods. Trends Food Sci. Technol. 2013, 31, 118–129. [Google Scholar] [CrossRef]
- Steves, J.P. Applied Multivariate Statistics for the Social Science, 2nd ed.; Hillsdale: Hillsdale, MI, USA, 1992. [Google Scholar]
- Hair, J.; Anderson, R.; Tatham, R.; Black, W. Análisis Multivariante; Pearson Prentice Hall Madrid: Cd de Mexico, Mexico, 2007; ISBN 0139305874. [Google Scholar]
- Nunnally, J.C.; Bernstein, I.J. Psychometric Theory, 3st ed.; McGraw Hill: New York, NY, USA, 1994. [Google Scholar]
- Anderson, J.C.; Gerbing, D.W. Structural equation modeling in practice: A review and recommended two-step approach. Psychol. Bull. 1988, 103, 411–423. [Google Scholar] [CrossRef]
- Carmines, E.G.; Zeller, R.A. Reliability and Validity Assessment. In Sage University Paper Series on Quantitative Applications in the Social Sciences; Sage: Beverly Hills, CA, USA, 1979; pp. 7–17. ISBN 9780803913714. [Google Scholar]
- Leek, S.; Szmigin, I.; Carrigan, M. Older consumers and food innovation. J. Int. Food Agribus. Mark. 2001, 12, 71–89. [Google Scholar] [CrossRef]
- Vandermoere, F.; Blanchemanches, S.; Bieberstein, A.; Marette, S.; Roosen, J. The morality of attitudes toward nanotechnology: About God, techno-scientific progress, and interfering with nature. J. Nanopart. Res. 2010, 12, 373–381. [Google Scholar] [CrossRef] [PubMed]
© 2018 by the authors. Licensee MDPI, Basel, Switzerland. This article is an open access article distributed under the terms and conditions of the Creative Commons Attribution (CC BY) license (http://creativecommons.org/licenses/by/4.0/).