1. Introduction
The increasing demand by society for services and infrastructure (e.g., transport, energy, buildings) and the need to address environmental issues such as greenhouse gas emissions and resource consumption delivers a tension that is a fundamental challenge of the current time. Concepts such as Material Efficiency and the Circular Economy (CE) aim to address this challenge largely through the principle of delivering the same or greater functionality currently provided by materials, whilst using fewer resources. Much of the focus is on product-based strategies such as greater product durability and design of products to enable enhanced recovery of materials (including for recycling and reuse) at the end of product life [
1,
2,
3,
4,
5].
As these strategies are developed, modelled and tested, a simplified indicator of material efficiency or of material circularity may be a useful dimension within product design tools. However, an important question which should not be overlooked when seeking greater material circularity is that of what is worth recovering, or what is recovery worth? In other words, it is important that material efficiency strategies are also evaluated carefully in the environmental dimension, so that informed and optimal decisions about product design, service delivery and new business models can be made. Such environmental evaluations can be well made using Life Cycle Assessment (LCA), or at least by following the underlying principles of life cycle thinking.
Many materials are vital in enabling transport, energy generation and much of the other functionality required by current and future society. It is incumbent upon the materials sector to explore the strategies needed to deliver the functionality required of it in the most material efficient manner. Whilst the materials and manufacturing industries, for reasons of their own business sustainability, pursue initiatives on circular economy and material efficiency [
6,
7,
8], often relating to their products downstream of manufacture, there remain many opportunities to explore and develop further.
The question of how to quantify, attribute the benefits and identify opportunities in Circular Economy strategies such as refurbishment and product system reuse is one of growing interest and methodological debate [
9] and a number of tools (see
Table 1) already exist or are under development for this purpose. Case studies are often a useful way to illuminate answers to such research questions and to inform future strategies, design decisions and business models. In this paper, several of the existing tools for the assessment of material circularity, together with a life cycle carbon footprinting tool based on LCA principles, have been tested and compared using an example from the renewable energy sector.
1.1. Qualitative and Quantitative Tools for Measuring Material Efficiency
A number of tools exist for the assessment of product level material efficiency/circularity. These tools vary in complexity and methodology, from very simple qualitative tools to complex methods almost resembling full Life Cycle Assessment. The aim of such tools is to inform life cycle design decisions without the need for a full study.
Two summaries of material efficiency tools were recently published [
10,
11]. Based on these two publications, a collection of eight material efficiency measurement tools was assembled, as given in
Table 1.
For the purposes of this study, four of the tools (highlighted in italics) in
Table 1 (Material Circularity Index; Eco-Costs; Circular Economy Toolkit and Circular Economy Indicator Prototype) were selected and were applied to a case study to allow comparison with a life-cycle carbon footprinting tool. Details of the tools selected and reasons for their selection are given in the Method section.
1.2. Evaluating Material Efficiency Strategies Using Life Cycle Assessment
Material Efficiency strategies can be applied along the complete life cycle of a product. The manufacture, use and finally end-of-life of products all have some aspect of material efficiency associated with them. This is also the case for the circular economy, where material efficiency strategies have been evaluated through the use of indicators, which are directly linked to material flows across the product life cycle. Examples of such indicators include product life span, reuse rates and recycling rates. The common, underlying feature of circular economy indicators is that they typically focus on improving resource efficiency by diverting material away from landfill or incineration. Whilst there is often a strong connection between resource efficiency and indicators relating to reuse or recycling, it is less clear how such indicators correlate with wider environmental impacts. This is particularly the case where activities such as refurbishment, remanufacture or recycling are energy intensive when compared to the manufacture of the initial product. In addition, for scenarios based around extended product life, there are also potential trade-offs between environmental impacts in manufacture and durability. For example, a more durable engineering component might require greater processing in manufacture, leading to an increased environmental burden associated with production, but less over the whole life cycle when the benefits of extended use are accounted for.
In order to answer questions such as what is the environmental benefit of recycling, reuse or extending product life, and therefore what is worth recycling, reusing or maintaining in a circular economy, there is a strong argument for using environmental assessment methods such as LCA (and approaches based on LCA) to evaluate different scenarios.
2. Method
International standards [
12] set out the principles, framework, requirements and guidelines for carrying out LCA studies and the following sections describe how these have been applied in this study.
2.1. Goal of the Study
The primary goal of the study was to compare the results from a selection of tools for the measurement of material efficiency/circularity with a life-cycle carbon footprinting tool, based on LCA principles, with a focus on aspects of material recovery and life extension.
2.2. Scope and Functional Unit
A case study of a 10MW tidal energy installation was used to test the tools, with five scenarios applied. The study was cradle to grave, including recycling and other recovery of materials at end of each life. For each scenario, regular maintenance and the electricity generated during the use phase were assumed to be equivalent and so these elements were not included.
The expected operational lifetime of the individual tidal energy units upon which the case study was based was 25 years. In order to test the full range of scenarios selected, four lifetimes were required, hence the overall operational period was taken to be 100 years. Assuming an efficiency factor of 0.35 [
13], the energy generated over this period (the functional unit) was 3.1 TWh.
The life cycle carbon footprinting tool provided an output in terms of CO2 emissions only. Although this was deemed to be sufficient to meet the goal of the study, it is recognised that a full LCA study would provide a broader set of outputs in terms of environmental impact categories such as Global Warming Potential and Ozone Depletion Potential, upon which a more thorough comparison of scenarios could be based.
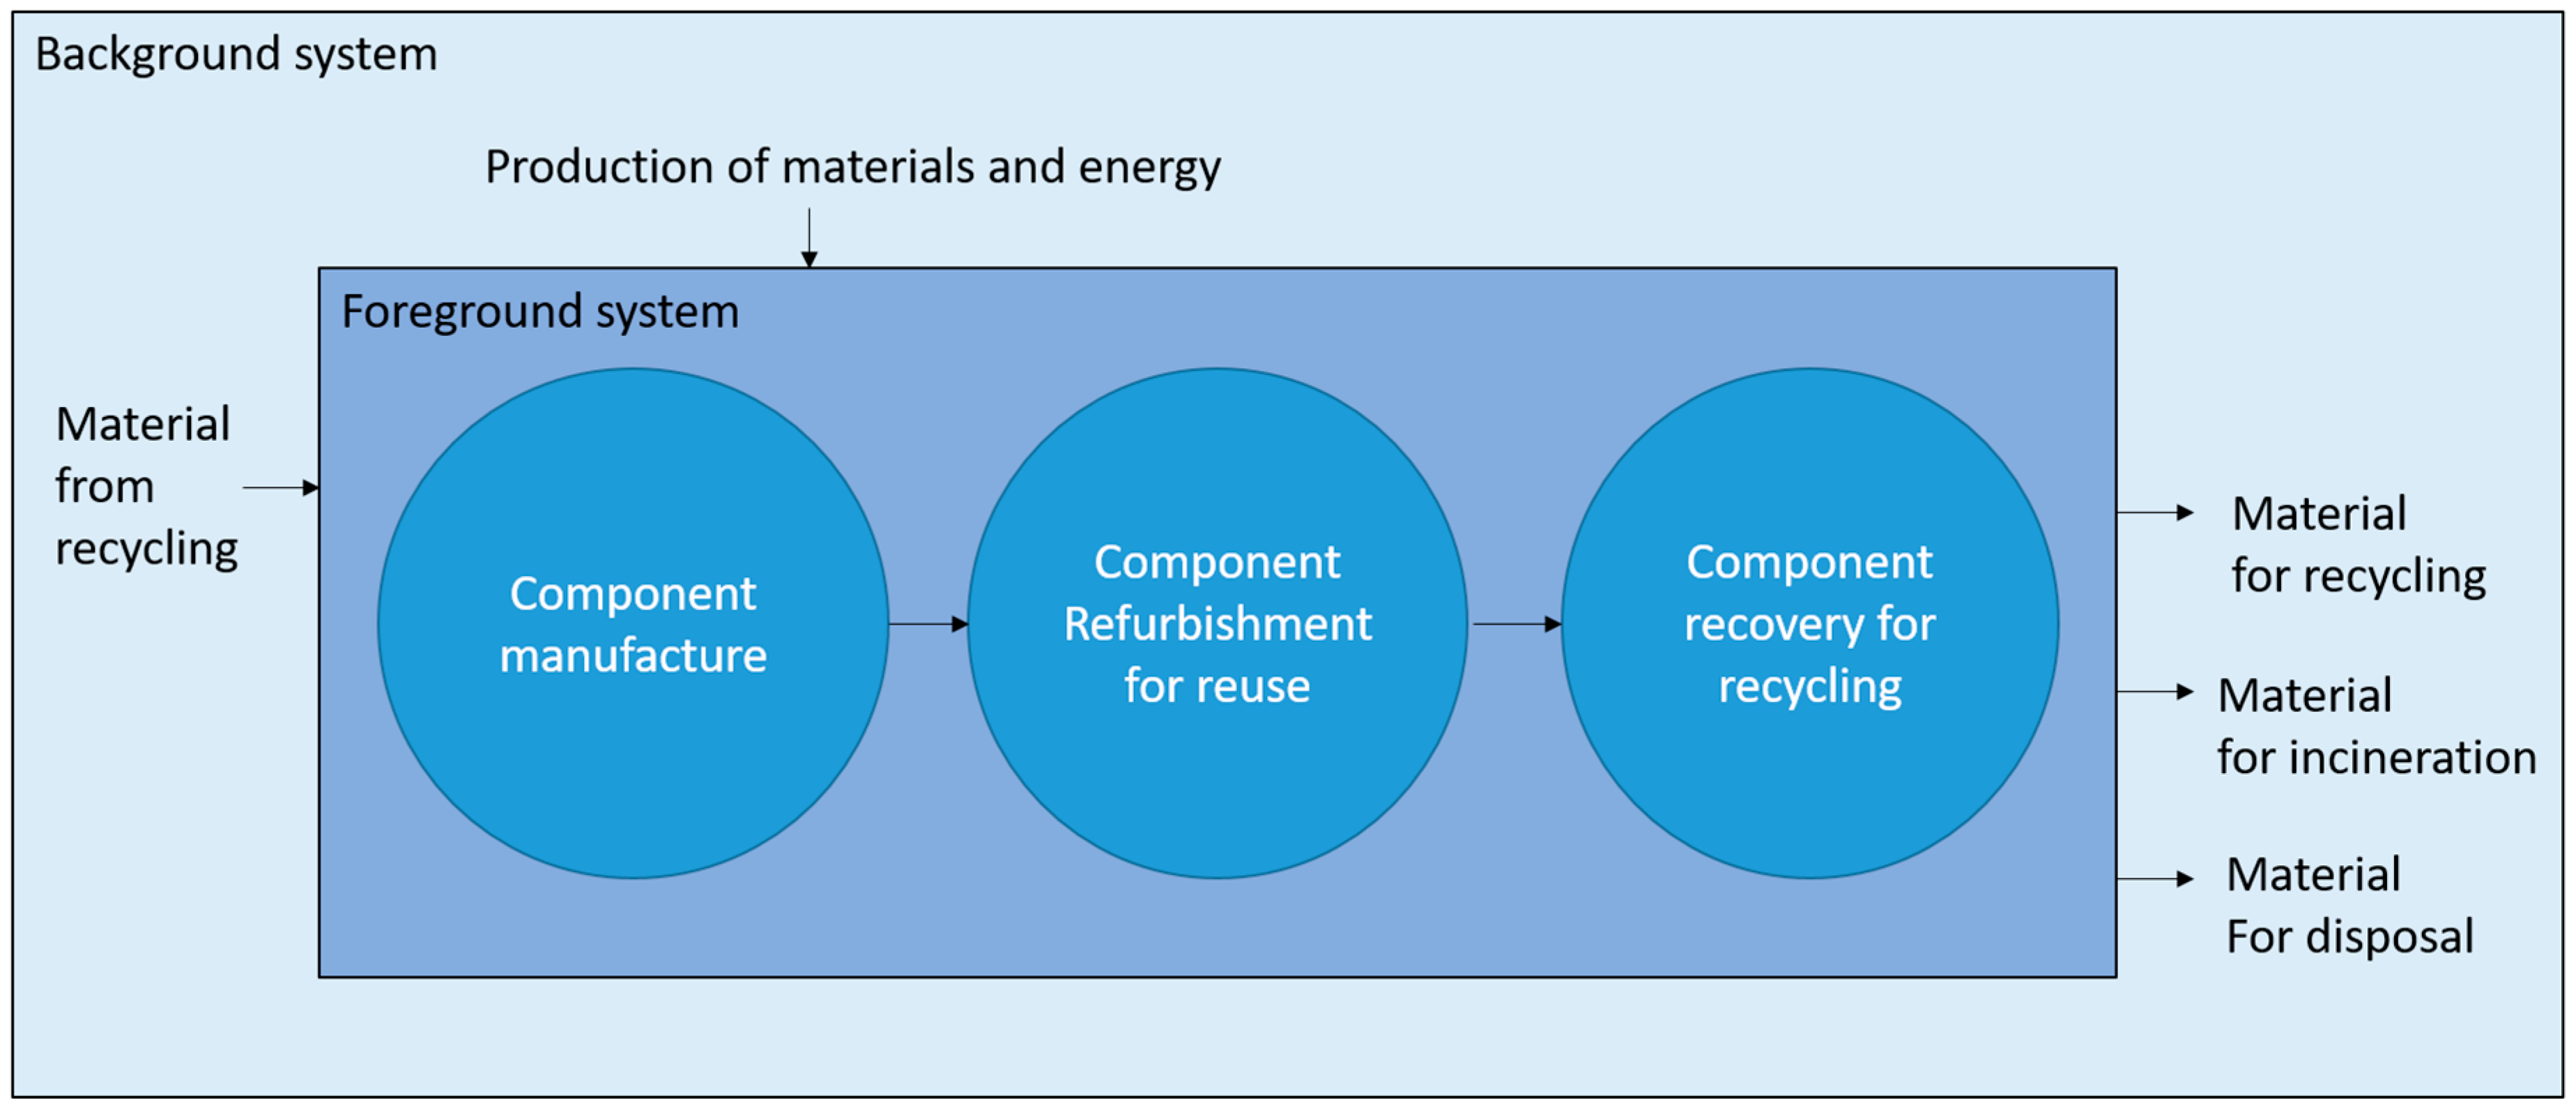
When developing an LCA (or LCA-based) study to evaluate scenarios relating to the circular economy, it is important to consider the system boundary of the study. A conventional system diagram, which includes manufacture, use and end-of-life disposal (a ‘cut-off’ approach) may not account for the upstream or downstream environmental burdens of recovered materials that cross the system boundary and are utilised by other products or processes. An effective LCA study therefore needs to have an extended system boundary, considering processes and products beyond the first life cycle, in order to evaluate each potential scenario.
LCA has been widely used for characterising the environmental benefits of recycling and organisations such as World Steel Association have recommended methods that can be used to evaluate the benefits of recycling steel products. Such approaches provide a useful starting point for evaluating scenarios relating to the circular economy and this paper explores how they can be further developed and applied not just to scenarios relating to recycling but also to reuse and extended product life.
2.3. Accounting for Recycling
When steel is recycled, it is remelted into steel which can be used in any product application, regardless of its origin, so steel that once was in a building can be recycled and used to make a car, a drinks can, or another building. This means that steel flows in open loop recycling systems, since the steel flows in different product loops. ISO 14044 [
12] states that
a closed-loop allocation procedure applies to closed-loop product systems. It also applies to open-loop product systems where no changes occur in the inherent properties of the recycled material. In such cases, the need for allocation is avoided since the use of secondary material displaces the use of virgin (primary) materials. Previous work [
14] has applied this principle to calculating the benefits of steel recycling, which forms the basis of the recycling methodology adopted by World Steel Association [
15]. An equation can be developed to account for either material that is recycled at end-of-life or for recycled content (the use of recyclate during manufacture).
where:
E: The LCI parameter or article relating to entire product life cycle after accounting for recycling
Eman: The LCI parameter or article relating to manufacture of a product containing a proportion of recycled content (R1)
Ev: The LCI parameter or article relating to 100% primary production
Erecycle: The LCI parameter or article relating to 100% secondary production
R1: The proportion of recycled content, which is used in manufacturing the product
R2: The recovery rate of material at end-of-life, which is recycled
Y: The efficiency, or yield, of the secondary production process.
2.4. Accounting for Reuse and Refurbishment
Steel reuse differs from recycling in that rather than the product being returned to a steel manufacturing site, for remelting, the product is used again in the same or other application. If the product is used again for the same application, then reuse can also be considered as an extension of product life. In some instances, it may be necessary to repair or refurbish the product before it is suitable for reuse. Reuse can therefore have multiple facets and approaches for modelling each possible scenario, within an LCA, will depend on the functional unit and the goal and scope of the study.
In this paper, the example of a tidal energy device is used to illustrate an approach for accounting for reuse. The study considers an installation, which is in operation for a period of 100 years and during this time-frame different scenarios are considered for reuse and extending the life of parts. The reused parts remain within the foreground system boundary, which differs from the parts that are destined for recycling. Material sent for recycling could enter a variety of different product systems and is therefore considered as part of the background system (
Figure 1). Equally, recycled material used in manufacture could have originated from any number of different end-of-life products.
Where the scenario includes both original parts and any subsequent reuse and refurbishment activities, the following equation can be developed:
where:
3. Evaluating Material Efficiency Strategies: A Case Study
In order to study the effectiveness of different material efficiency strategies, a case study was conducted based on a prototype tidal energy device. A tidal energy device is a renewable energy system designed to extract energy from the ebb and flow of tides in offshore areas with high tidal flow speed [
16]. The development of tidal stream power is currently at an earlier stage than more common renewable energy sources such as wind power, and a wide range of designs exist, though many of the most successful devices are of the three-blade horizontal axis type. Such devices are generally seabed-mounted and many designs at first glance resemble a wind turbine, though due to the relative densities of water and air, a tidal turbine has a much smaller rotor diameter than that of a similarly-rated wind turbine. Tidal turbines are often rated at 1–2 MW, and are envisaged to be installed in arrays conceptually similar to wind farms, of the order of 100 s of MW. The development of the first such arrays is currently underway off the coast of the UK, for example, the MeyGen array, which aims to install 398 MW of tidal generation capacity by 2020 [
17].
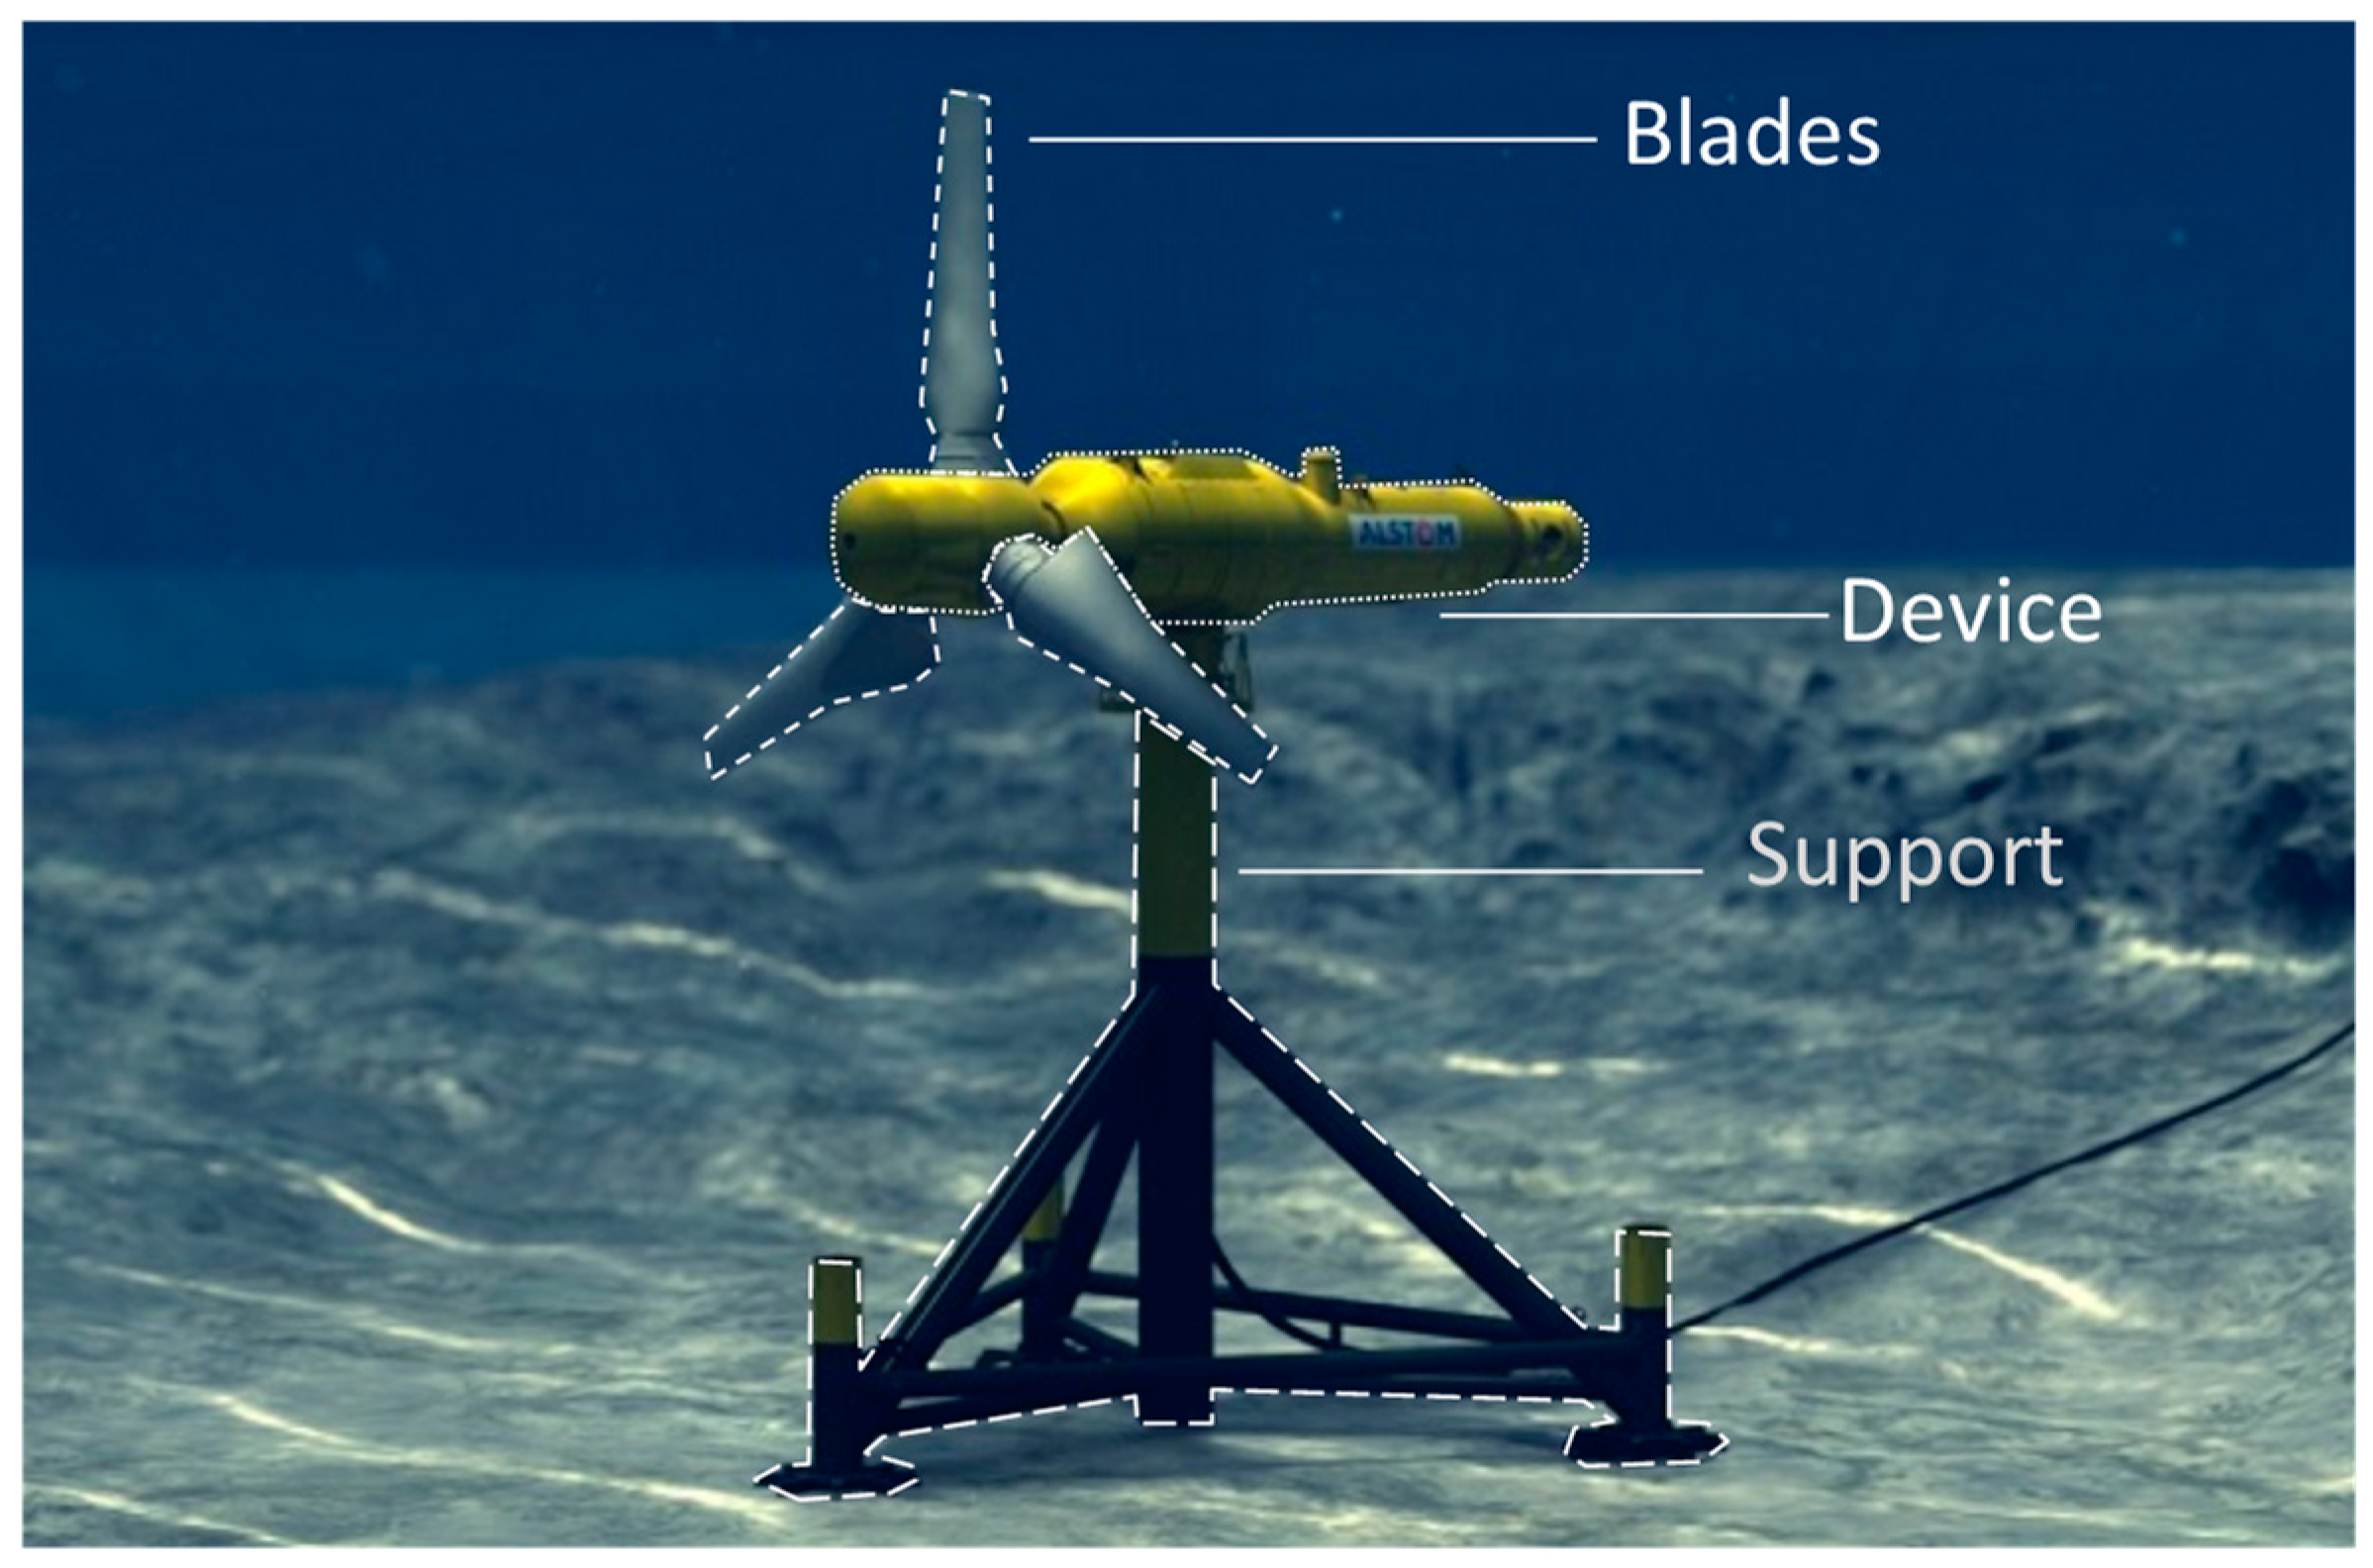
The prototype device used for the comparative study was a 1 MW rated device. For the purposes of this study, it was divided into three distinct sections: firstly, a ‘device’ section comprising the steel turbine body, internal electronic components and yaw rotation system; secondly, a ‘support’ section comprising the support structure, mounting system and foundations, and finally the composite turbine blades (‘blades’). In this case, the support structure was manufactured entirely of steel, and the mounting system was a steel and concrete piled foundation system. The tidal turbine is illustrated in
Figure 2.
By mass, the turbine device comprises approximately 52% mild steel, 35% stainless steel, 11% iron and 2% other materials. The support comprises 60% mild steel and 40% cementitious materials, and the blades are entirely made of a glass fibre-reinforced epoxy resin [
18].
The prototype device has a design life of 25 years and is rated at 1 MW, so four installations of ten devices are required to meet the functional unit. Transport to and from the installation site was assumed to be shared between the ten installed units.
A ‘business as usual’ case was initially established. In this case, the device and support would be replaced together after 25 years. In the business as usual case, current levels of recycling were assumed [
19], with no recycling or energy recovery from composite or cementitious materials. From this initial case, four further cases were developed. Cases were developed in which device and support lifetimes were extended to 50 years by either refurbishment after 25 years, or by life extension (in this case, it was assumed that structures were retired after 25 years for safety reasons, but could have a 50-year lifetime if safety factors were reduced). In the former case, the carbon emissions from the removal, refurbishment and re-installation of the support were included in the carbon footprint study, and where possible in the material efficiency tools. In cases with energy recovery from the composite blade materials, an embodied energy of 100 MW/kg [
19] and an energy recovery rate of 0.68 MWh/tonne [
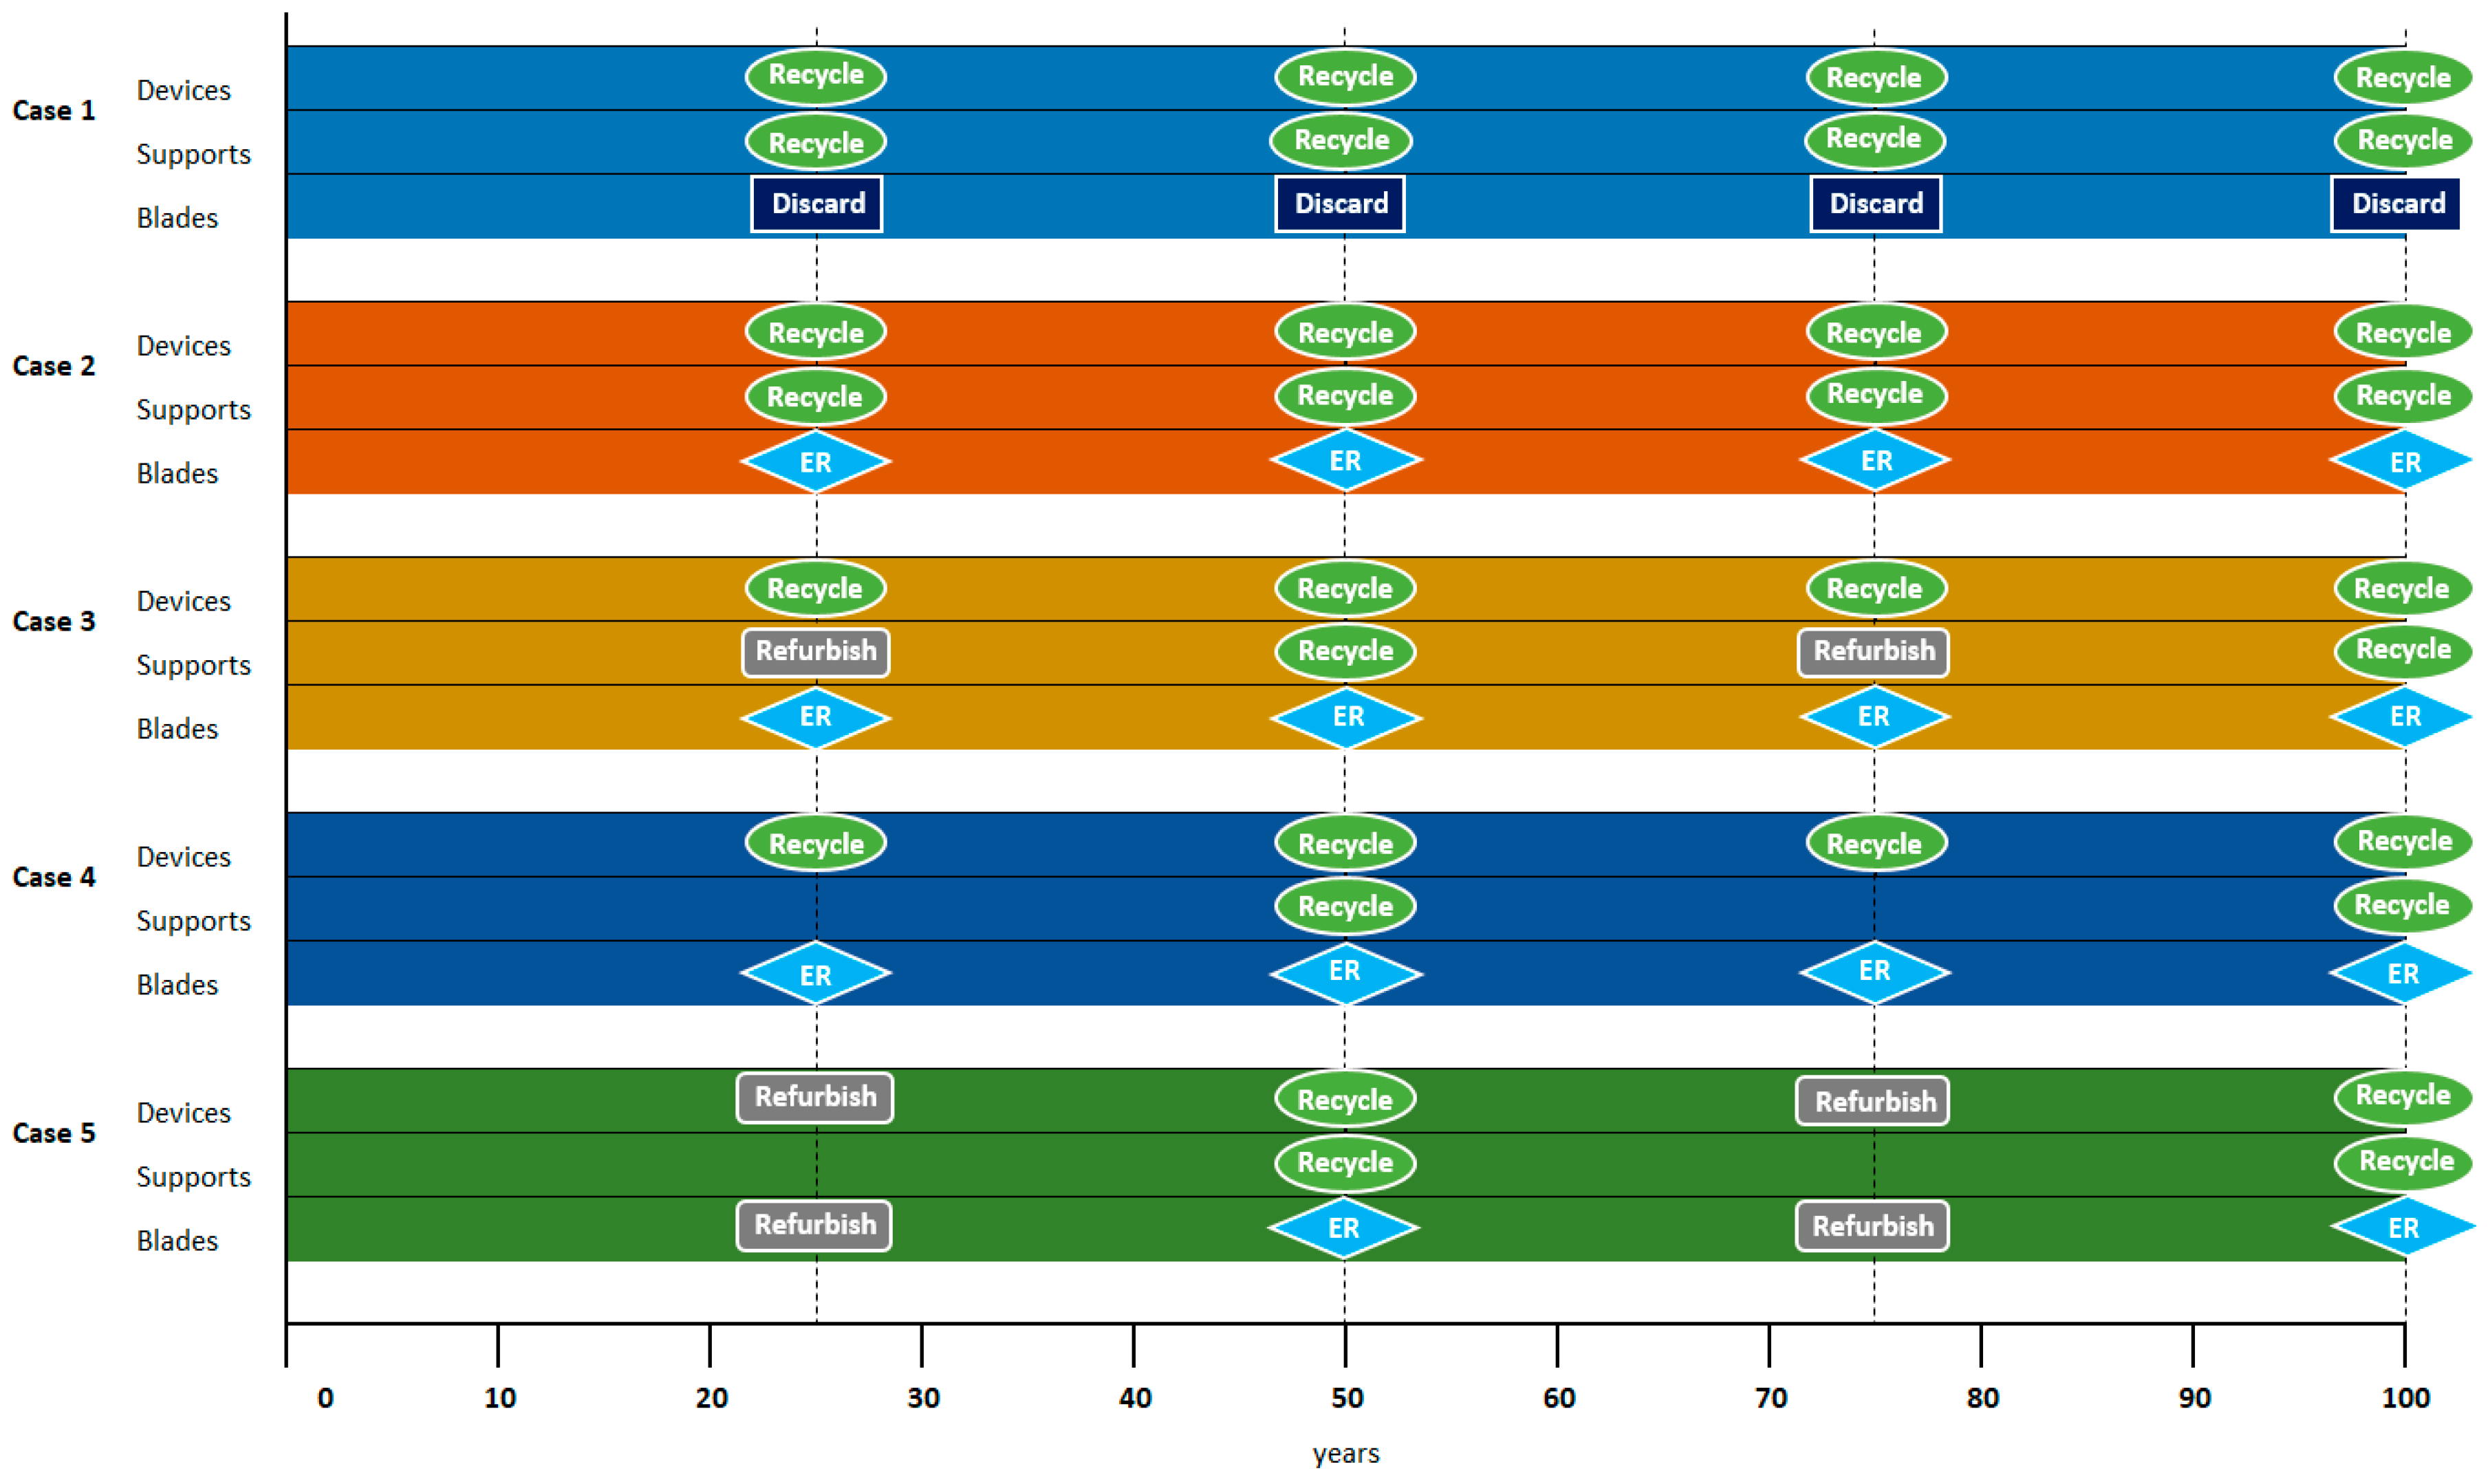
20] were assumed. A summary of the cases developed is given below, and the functional unit as satisfied by each case is illustrated visually in
Figure 3. The colours assigned to each case are used in all subsequent figures.
Case 1: Business as usual recycling at end-of-life after 25 years of operation.
Case 2: As Case 1 with additional energy recovery from blades at end-of-life.
Case 3: Support is refurbished and reused after first 25-year lifetime. Recycling and energy recovery as Case 2.
Case 4: Support lifetime is extended to 50 years. Recycling and energy recovery as Case 2.
Case 5: Support lifetime is extended to 50 years. Device is refurbished and reused after first 25-year lifetime. Recycling and energy recovery as Case 2.
A zero recycling case, in which no recycling took place and each device, blades and support was discarded and replaced at the end of each 25-year lifetime, was also studied using some of the tools. It is appreciated that this case is unlikely to be realistic in reality, but it is included where possible to provide context for the five cases. For each of these five cases, results generated by a series of material efficiency tools were compared to the results of a carbon footprint assessment. Four of the material efficiency tools highlighted in
Table 1 were selected for this comparison, namely Material Circularity Index (MCI) [
21]; Eco-Costs [
22]; Circular Economy Toolkit (CET) [
23]; and Circular Economy Indicator Prototype (CEIP) [
24]. These four methods were selected as they give a broad representation of the range of tools available, both in focus and complexity. The MCI and Eco-Costs tools are numerical calculation methods, with the former focussing on environmental circularity and the latter on economic circularity. The CET and CEIP are simpler, graphically-based tools. The CET is the simplest considered in this study: Its output is simply a recommendation of areas of the development and use of a product which may offer the greatest potential for circularity improvements. The CEIP is a more complex tool, resulting in an assessment of product circularity as a percentage value.
3.1. Case Study Results: Material Efficiency Tools
3.1.1. MCI
The Material Circularity Indicator (MCI) method developed by Granta Design is a spreadsheet-based tool. Six inputs are required: the reused material percentage, recycled material percentage, recycling efficiency at manufacture and end-of-life stages, and the product lifespan and functional unit relative to industry averages.
For each case, reuse and recycling was calculated at a material level, then the product lifespan multiplier was used to represent reuse and extension of life in the relevant cases. This was applied to each material in the product, then aggregated based on mass proportion to give a case total. Input values were set according to industry data [
25,
26], as follows:
Mild Steel: 36% recycled content feedstock, 95% recycled at End-of-life
Stainless Steel: 60% recycled content feedstock, 95% recycled at End-of-life
Iron: 50% recycled content feedstock, 95% recycled at End-of-life
Concrete was not assumed to contain any recycled feedstock, nor to be recycled at End-of-life, due to the difficulty of extracting it and the fact it cannot be recycled to a product of the same standard.
MCI calculations gave the following results (The MCI tool result is a value between 0, being a not at all circular product, to 1, being an entirely circular product):
Case 1: 0.439
Case 2: 0.439
Case 3: 0.579
Case 4: 0.635
Case 5: 0.652
3.1.2. Eco-Costs
The Eco-costs method was originally proposed by Vogtländer [
27], and subsequently updated in 2012. Eco-costs are defined by their authors as
costs required to reduce the environmental pollution and materials depletion of a product to a level in line with the maximum carrying capacity of the earth. Carrying capacity is itself a loosely defined term, but is described by Vogtländer as the maximum number of individuals of a given species that can be supported on a sustainable basis, in this case meaning a sustainable global human population.
The tool used in this study was that developed alongside the IDEMAT 2015 dataset by Vogtländer et al [
28]. In order to represent the five cases, an aggregated approach was used based on the combination of virgin (i.e., non-recycled) and secondary (i.e., recycled) material content for each material, over each 25-year period. In cases 3, 4, and 5, the Eco-costs method is unable to account for the differences between refurbishment and life extension, so any additional resource use due to refurbishment processes was not taken account of.
Three versions of the Eco-costs calculation were undertaken, for three end-of-life scenarios. The first (Landfill) assumes that material waste is sent to landfill at the end-of-life, the second (Open Loop, OL) assumes that material is processed in a modern municipal waste treatment system with metal recycling and heat recovery from plastics. The final (Closed Loop, CL) assumes that used products are returned to the manufacturer and reused in new products. In all cases, the Eco-costs value gives the monetary value required to reduce the environmental pollution and material depletion to a level in line with the carrying capacity of the earth. It should be noted that this method was also unable to account for energy recovery from composite materials, so cases 2, 3, 4 and 5 assume the use of virgin composite materials in blade manufacture, as per case 1. Results of the Eco-costs method are given in
Table 2.
3.1.3. CET
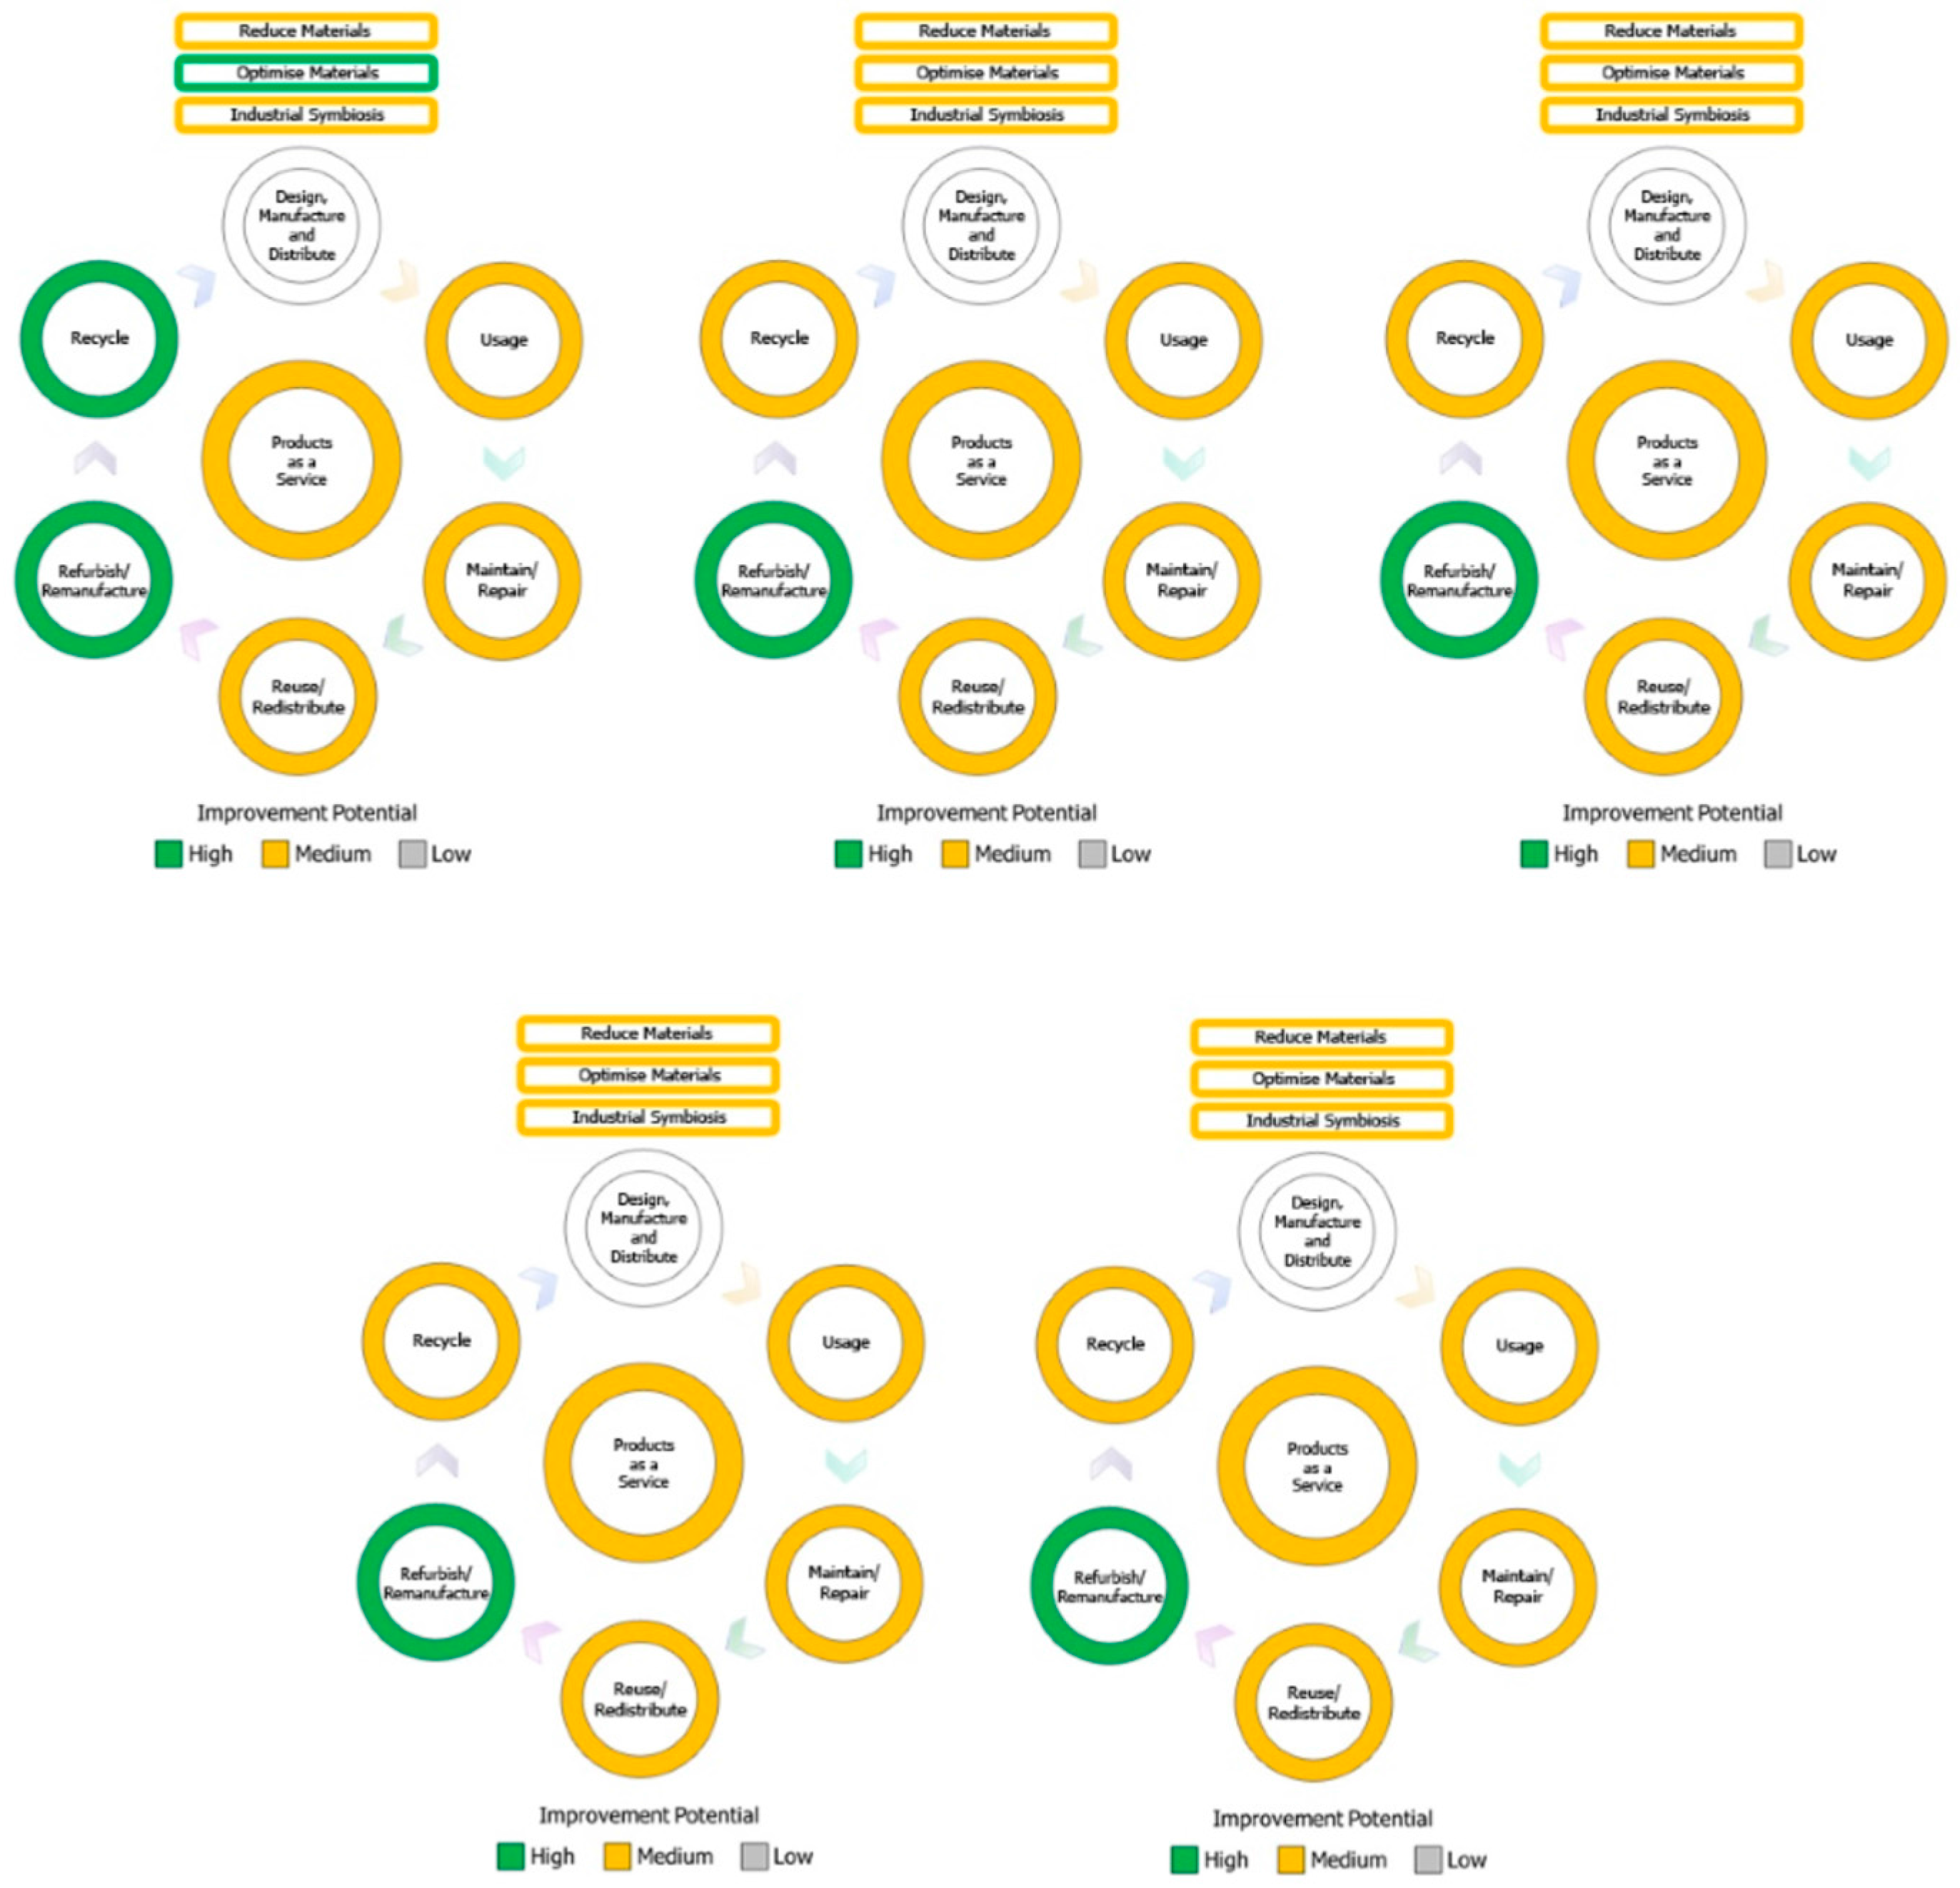
This tool asks the user questions in seven categories, incorporating design and manufacture, materials, use, and end-of-life treatment and uses these to give recommendations for areas of potential improvement. The majority of the 33 answers were identical for each of the five cases, but three questions were answered differently for different cases. These questions related to the percentage of recycled material used (where a variation between case 1 and all subsequent cases was seen); product lifetimes (where a variation between cases 1 and 2, and 3, 4 and 5 was seen); and end-of-life treatment by the manufacturer (where a variation between cases including refurbishment and those without refurbishment was seen).
The output of the CET is a diagram highlighting areas of low, medium, or high potential for improvement in circularity. The results for each of the five cases are given in
Figure 4. As can be seen, the tool highlights potential for additional recycling in case 1, but does not suggest any difference in the improvement potential of the remaining four cases, proposing an improvement in refurbishment and remanufacture in all cases.
3.1.4. CEIP
This tool is spreadsheet-based, and uses the respondent’s answers to 15 questions about product manufacture, use and end-of-life treatment to produce a ‘Circularity Rating’, defined as a percentage value. The tool states that the questionnaire intends to evaluate in what degree the product fosters the Circular Economy principles throughout its different lifecycle stages.
The questions cover five topic areas: Design, Manufacture, Commercialisation, Use, and End-of-life, giving 15 questions in total. Answers to 12 of the 15 questions were identical for all cases, with only the first and last questions being answered differently. These questions respectively ascertain the percentage of the product manufactured from recycled or reused material, and the percentage of the product recycled after use, or reused. In all cases, it was necessary to aggregate multiple scores for products at different stages of the functional unit. The data used to answer these two questions across the five scenarios is as follows:
Case 1: 70% recycling and 0% reuse at manufacture, 70% recycled and 0% reused at end-of-life (The tool allows the user to select these values with a resolution of 10%. Since recyclable materials actually represent 70.66% of the complete product, a slight error is introduced due to this).
Case 2: 80% recycling and 0% reuse at manufacture, 80% recycled and 0% reused at end-of-life (again, a slight error is introduced since plastic makes up 9.55% of total mass).
In cases 3, 4 and 5, the device and support are considered separately.
Case 3: The device is recycled as in cases 1 and 2. To represent the reuse of the support, the first lifetime is modelled as having 80% recycled material at manufacture, and 20% recycled/80% reused at end-of-life. The second lifetime is modelled with 20% recycled/80% reused at manufacture, and 80% recycled material at end-of-life. The third and fourth lifetimes repeat this process.
Case 4: Since the tool is unable to account for the difference between reuse and life extension, cases 3 and 4 are identical.
Case 5: As in case 3, reuse was represented by linking the reuse at end-of-life of lifetimes 1 and 3 with the reused input to lifetimes 2 and 4. In this case, this method was applied to the device and support.
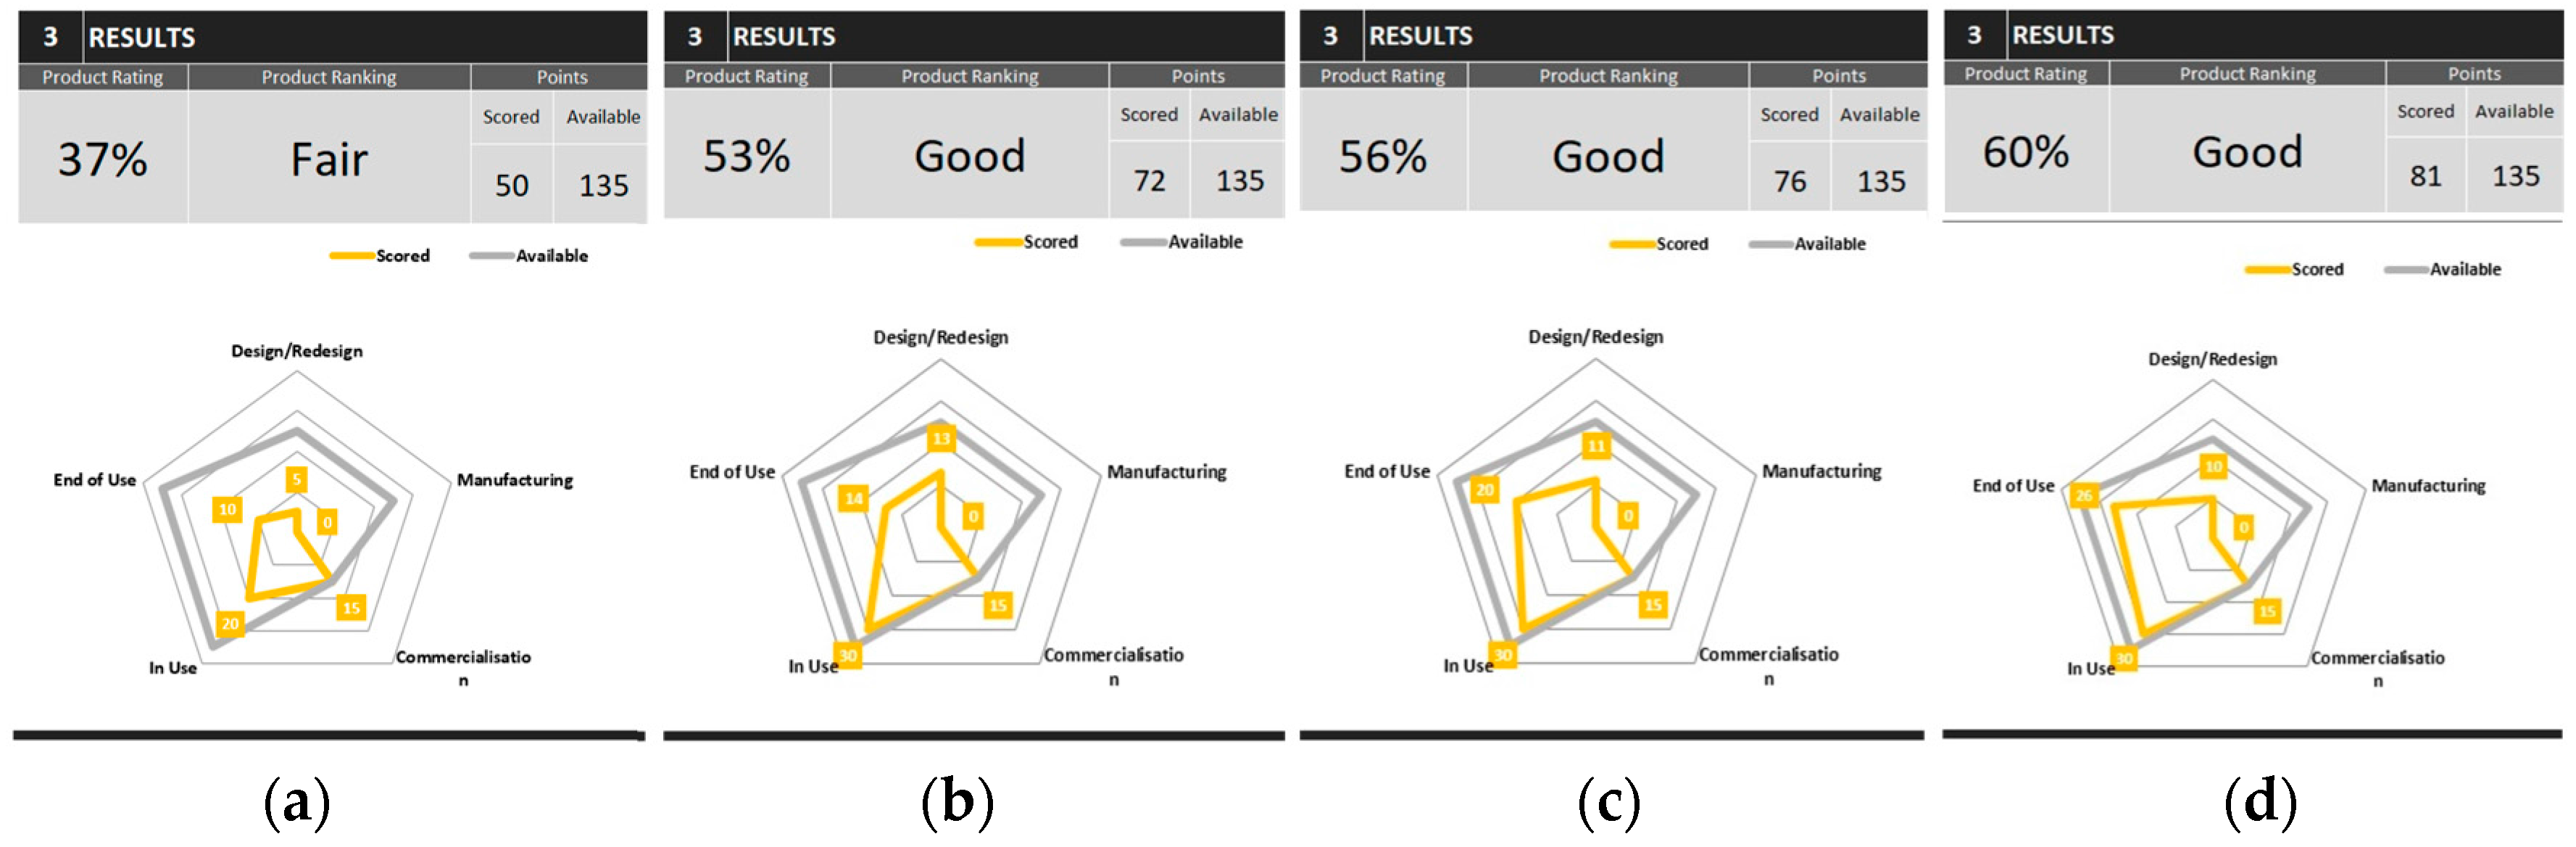
Aggregated results for the functional unit in each case give the following results, with the resulting graphical results breakdown given in
Figure 5.
No recycling: 37%
Case 1: 53%
Case 2: 56%
Case 3: 56%
Case 4: 56%
Case 5: 60%
3.2. Comparison of Material Efficiency Tools
It was noted that a number of the tools tested showed similar results for all cases tested, despite what one would imagine are significant differences between cases. For example, the CEIP tool rated all cases apart from the no recycling case as “Good”, with a percentage variation of only 7% between the best and the worst. It was noted that in the CEIP and CET tools, only a small number of questions (3 of 15 and 3 of 33, respectively) resolved the changes made between cases, with all others being identical. In the CEIP study, this results in all cases apart from the no recycling case being given a “good” rating. This is partly due to the wide range of the rating (from 40% to 60%) and partly due to the scope of the tool, which considers reuse and recycling and the beginning and end of the product life as only part of its metric. Other considerations such as Commercialisation and Design are given significant weight, but are unaffected by our cases.
The Eco-costs tool was also found to have significant limitations: It was unable to account for additional resources used during refurbishment, as well as being unable to account for energy recovery. This perhaps suggests that these tools are not the best indicators of circularity for this type of product, though no guidance on the suitability of the tools for specific product types is given.
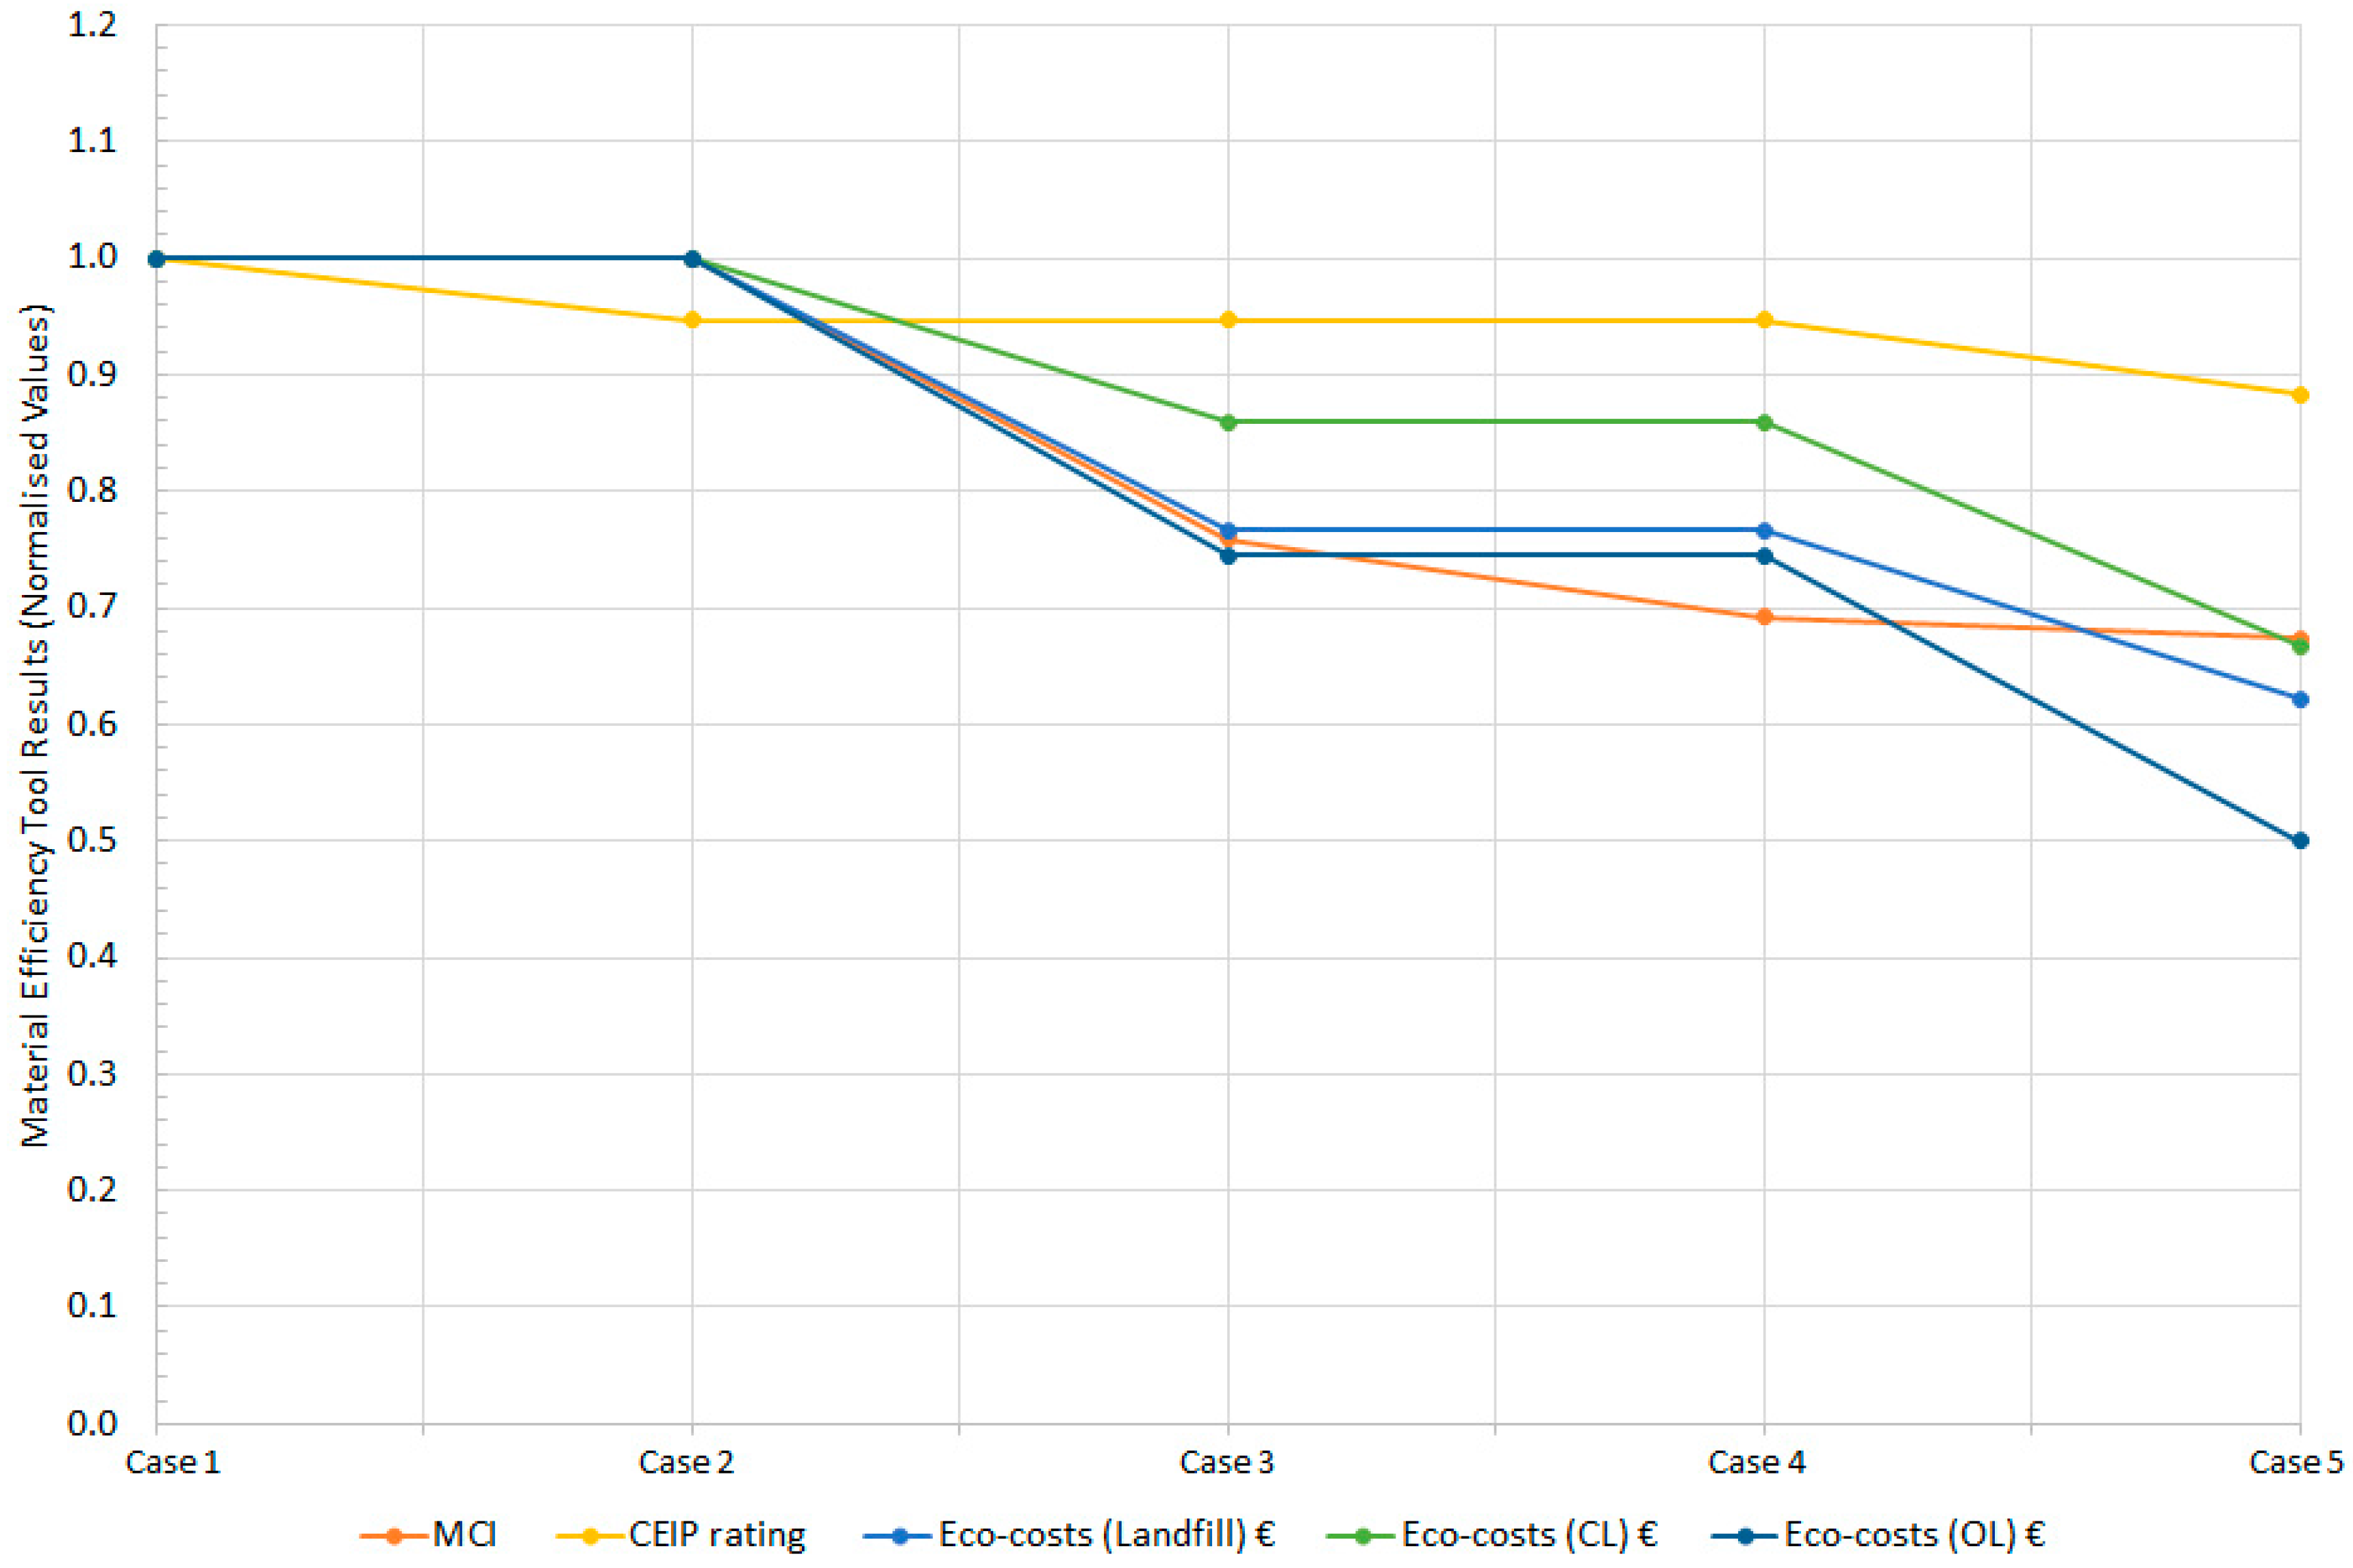
Direct comparison of the four selected material efficiency tools is challenging, since all give results in their own preferred format. However, in the case of those giving numerical results (MCI, Eco-costs and CEIP), it is possible to normalise these results across the five cases to allow a direct comparison. Results of these three tools, normalised by the case 1 value of each across the five cases, are illustrated in
Figure 6.
As can be observed in
Figure 6, the trends of the MCI and Eco-costs tools were found to be similar between cases one and three. Both methods were not able to resolve the difference between cases one and two (i.e., the introduction of energy recovery from composite materials), but the MCI method did show a difference between all other cases, whereas the Eco-costs method did not show any variation between cases three and four (i.e., the change from a support structure refurbished after 25 years to one with a 50-year lifetime). The results of the CEIP method follow a slightly different trend. Although this method was able to account for the introduction of energy recovery in case two, it was unable to distinguish between cases two, three and four, to which it attributed the same score.
In order to further assess the strengths and weaknesses of each method, results were subsequently compared to those of a carbon footprint assessment, as introduced in the next section.
3.3. Case Study Results: Carbon Footprint Assessment
In order to compare the results of the material efficiency tools described in previous sections, a full carbon footprint study was conducted for the Tidal turbine case study. A spreadsheet tool developed specifically for this study was used, and the energy requirement and carbon footprint of each process required to manufacture and install the turbine was calculated. Material production, part manufacture, transport, installation, maintenance and end-of-life decommissioning and recycling were included, with additional calculations of the energy required to refurbish parts in the relevant cases, as well as their associated transport, removal and re-installation requirements. Data was gathered from a range of sources, including tidal turbine manufacturers [
29,
30], previous studies [
31] and work in other fields (for example, transport sector data was used to establish the fuel consumption and energy requirements of transport by road and sea).
4. Results: Comparison of Material Efficiency Tools and Carbon Footprint Assessment
Results generated by the three material efficiency tools with numerical outputs (the CET tool produced only a graphical output, meaning we were unable to include its results in further comparison) were compared to those of the carbon footprint study.
Results from the carbon footprinting tool, in terms of normalised tonnes of CO
2 emissions per functional unit, are compared to the results of the material efficiency measurement tools described previously, in
Figure 7.
It can be seen from these results that the best performing of the three material efficiency tools appears to be the Open Loop Eco-costs measure, but it is evident that all three material efficiency tools struggled to identify the true CO2 emission benefits of cases two and five. In case two, the reduction in carbon footprint resulting from the use of energy recovery from the incineration of turbine blades at end-of-life was not accounted for by the Eco-costs and MCI measures, which overestimated the CO2 result by 8.5% compared to the carbon footprint tool. The CEIP tool did account for this change, but still underestimated the benefit by 3.4%.
The reuse of the turbine body and blades in case five was not correctly accounted for by any of the material efficiency tools, resulting in a CEIP error of 58%, MCI error of 46%, and Eco-costs errors of between 27% and 45%. This change resulted in a significant reduction in carbon footprint, and highlights the fact that although material efficiency tools are a relatively quick way to estimate the circularity of a product or process, these tools can lead to different conclusions to those of full analysis, and without the use of a full carbon footprint study it may not be possible to understand the implications of all changes, such as in this case between life extension and refurbishment.


