Transition towards Renewable Energy Production? Potential in Smallholder Agricultural Systems in West Bengal, India


1
Department of Biobased Products and Energy Crops (340b), Institute of Crop Science, University of Hohenheim, Fruwirthstrasse 23, 70593 Stuttgart, Germany
2
Department of Energy Futures, Former Shell Global Solutions, P.O. Box 38000, 1030 BN Amsterdam, The Netherlands
3
Centre for Agroecology, Water and Resilience, Coventry University, Ryton Gardens, Ryton-on-Dunsmore CV8 3LG, UK
4
Department of Societal Transformation and Agriculture (430b), Institute for Social Sciences in Agriculture, University of Hohenheim, 70593 Stuttgart, Germany
*
Author to whom correspondence should be addressed.
Sustainability 2018, 10(3), 801; https://doi.org/10.3390/su10030801
Submission received: 12 February 2018
/
Revised: 7 March 2018
/
Accepted: 8 March 2018
/
Published: 13 March 2018
(This article belongs to the Special Issue Social Innovations in the Energy Transition)
Abstract
:Renewable energy (RE) production promotes the efficient and sustainable utilization of natural resources at the local level. This study assessed smallholder farmers’ perceptions of RE production in two villages in West Bengal, India. The availability and potential of renewable resources and livelihood characteristics of smallholders were explored. Relevant factors for the selection of appropriate RE technologies were identified, based on the participatory, bottom-up Integrated Renewable Energy Potential Assessment. The research area has abundant solar resources and substantial amounts of organic residues and waste suitable for biodigestion. Important factors for RE technology selection, as stated by farmers, are: ease of daily activities, government support, and limited land requirements. Solar-photovoltaic (PV) systems providing sufficient electricity for household use and irrigation are considered the most appropriate. Key informants focus on initial investment costs, government support, and reduced energy expenditure. They favor solar-PV systems for household electrification. Second choice was an integrated food and energy system that combines solar-PV for irrigation and vermicomposting of organic residues/wastes for fertilizer production. Smallholder famers’ motivation to produce and use RE is high. Their perspective should be integrated in the design of RE-supporting policies and related programs to utilize local natural resources effectively and promote the transition towards renewable energy.
1. Introduction
Affordable renewable energy (RE) and higher energy efficiency are the key drivers for a global transition towards sustainable, low-carbon energy systems, as postulated at the 21st Conference of the Parties of the United Nations Framework Convention on Climate Change (UNFCCC) [1].
The highest renewable energy potentials (REP) exist in rural areas of Latin America, Asia, and Africa [2]. In these areas, smallholder farmers typically manage 80% of the land area and natural resources [3], while access to modern and clean energy is often limited [4]. Smallholder farmers could produce sustainable energy that is economic efficient and environmentally sound by utilizing these REP.
India has been described as the “home of small and marginal farms” [5] (p. 1), with about half the population being directly engaged in agriculture [6]. Indian agriculture is currently facing multiple energy-related challenges in the areas of fertilizer production, mechanization, transport, and irrigation [6]. The energy demand in the world’s third largest economy is increasing rapidly and, by 2032, will be four times higher than today [6,7].
The rural electrification program Rajiv Gandhi Grameen Vidyutikaran Yojana (RGGVY), launched in 2005, has significantly improved grid connection of rural villages [6], to electrification rates of 47% in Bihar, 61% in Jharkhand, and 92% in West Bengal. However, these figures do not reflect actual access to energy of rural households. According to [8], up to 50% of households in these states have either poor or no access to electricity, with voltage fluctuations, load shedding, and regular power cuts negatively affecting quality, reliability, and duration of electricity supply. To address these shortcomings, the RGGVY was modified in 2015 to form the Deen Dayal Upadhyaya Gram Jyoti Yojana (DDUGJY) program. This aims at strengthening rural supply through separation into an agricultural and non-agricultural distribution network and implementation of locally appropriate renewable energy technologies (RET) [6].
India has excellent solar, wind, small hydro, and biomass energy resources [7], which account for 5.5% of the global, realizable REP estimated for 2020 [9]. The Intended Nationally Determined Contribution (INDC) submitted to the UNFCCC in late 2015 set the goal of expanding RE production capacity from currently 36 GW to 175 GW by 2022 [10]. Furthermore, the Indian government highlights renewable energy as the key driver for the social inclusion of the poor [7], often small and marginal farmers [5].
Typically, RETs are selected and planned by external experts, based on techno-economic considerations, often failing to provide sustainable energy in the long term [11,12]. The reasons for this failure are manifold, but are associated with the adaptation of a RET to the local context: for example, specific weather conditions or RE system damage by animals; spare parts and technical service being unavailable or unaffordable; and RET-users being inadequately informed about energy production patterns, energy utilization, and system operation [13]. To encourage the use of RETs, multiple interrelated social, institutional, environmental, technical, and economic factors have to be considered [12,14,15,16,17]. This requires an exploration of local socio-cultural habits, attitudes, and relationships [18], as household energy consumption is not primarily based on rational decisions with regard to financial or other material interests [19].
This study explores locally relevant social, institutional, environmental, technical, and economic factors for the selection and design of appropriate RETs for smallholder farming households in two rural villages in West Bengal, applying the participatory, bottom-up Integrated Renewable Energy Potential Assessment (IREPA) [20]. Further, the prospect of smallholder RE production was assessed based on this in-depth analysis of the local context, considering renewable resource (RR) availability and perceptions of smallholder farmers and local key informants engaged in agricultural extension and rural development.
2. Materials and Methods
2.1. Case Study Area: Geographic, Agro-Ecological, and Socio-Demographic Characteristics
The state of West Bengal was selected as case study area because it is one of India’s major food baskets, with 70% of the population directly engaged in agriculture [21]. Of these, 90% are smallholder farmers [22]. A quarter of the population has no access to electricity, while 40% partly has access, with supplies however being limited and unreliable [8]. Agro-ecological conditions are favorable: the area is endowed with strong irradiance, fertile alluvial soils, and plentiful water resources [23]. Average precipitation is 1435 mm a−1 [24]. In the dry season, channels from the Hooghly River and groundwater are used for irrigation. Abundant labor resources and access to agricultural inputs (fertilizers, pesticides, high-yielding varieties) result in high crop productivity. Land availability is the major constraint for agriculture [23]. Today, virtually all of the land is utilized and there are very few natural forests [25,26]. West Bengal is a traditional rice-growing area, but since 1997 there has been a shift towards the cultivation of fruit, vegetables, and flowers, as these provide higher revenues [23]. Based on these local characteristics, the area provides a suitable setting to assess the potential of smallholder RE production. Research was conducted from January to March 2015 in the two rural villages, Ghoragachha and Baikunthapur, in collaboration with the Department of Agricultural Extension of the State Agricultural University Bidhan Chandra Krishi Vishwavidyalaya (BCKV, Mohanpur, WB, India) under the Indian Council of Agricultural Research.
2.1.1. Ghoragachha
Location: Chakdaha Block of the Nadia District (88.31° E; 22.58° N).
Population: 1830 inhabitants in 134 households. The population (100% Muslim) is defined as “minority” in the official classification of the Indian population. The vast majority are smallholder farmers. Only 44 inhabitants are engaged in other jobs (e.g., embroidery, government sector). All households are connected to the grid [25].
Area size: 2825 acres (11.43 km2), about 2000 acres agricultural land, 20 acres water bodies used for fish farming, the remaining area is residential [25].
Access to the village was facilitated through the Department of Agricultural Extension (BCKV, Mohanpur, WB, India), frequently organizing workshops about the introduction of new farming practices and technologies (fertilizers, pesticides, machinery). Thus, farmers were familiar with household interviews and technology evaluation. They willingly shared information about their livelihoods and perceptions regarding RET often engaging in open and critical discussions.
2.1.2. Baikunthapur
Location: Amdanga Block of the North Twenty Four Parganas District (88.32° E; 22.55° N), about 25 km south of Ghoragachha.
Population: 2940 inhabitants in 263 households, mainly belonging to the Hindu caste of Vaishyas. Most farmers have additional sources of income besides agriculture. Along the main road, there are 31 handicraft workshops, mainly carpentry and metal-work, and also a few agro-processing and Sheetal Pati (cool mat) weaving enterprises [26]. The village is connected to the grid [26], except for the poorest farming households on the outskirts of the village, where research was conducted.
Area size: approx. 700 acres (2.83 km2), 550 acres farmland, 6 acres lakes, and residential area on the remaining land [26].
The additional interviews at Baikunthapur showed that the activities of the Department of Agricultural Extension from BCKV have not influenced the perceptions of the smallholders in Ghoragachha towards RE production. The Baikunthapur farmers willingly shared information about their livelihoods. The farmer livelihoods in both villages are very similar.
2.2. Integrated Renewable Energy Potential Assessment (IREPA)
IREPA is a participatory, bottom-up approach to REP assessment and appropriate RET selection in smallholder farming systems of developing and emerging economies. It integrates the biophysical perspective of natural science (RR assessment), the socio-cultural perspective of social science (smallholders’ livelihoods), and the techno-economic perspective of energy engineering (RET planning) in an inter- and transdisciplinary approach. IREPA was previously tested in a rural area of South Africa [20] and adapted to this specific context, applying the following steps:
- Step 1: Contact with Research Area and Preliminary Data Assessment
Access to the two villages was facilitated by the Department of Agricultural Extension of the BCKV. Further, it was possible to draw on geographic, agro-ecological, and socio-demographic profiles and statistics from the Directorate of Micro, Small, and Medium Enterprises of the Government of West Bengal [25,26].
- Step 2: Theoretical Renewable Energy Potential (ThREP) Assessment
The bio-physical RR availability of solar, wind, hydro, geothermal, and bioenergy was assessed according to the REP categories defined by [9,27]. The RR data were obtained from international and national databases and scientific literature (Table 1).
- Step 3: Household and Community Assessment
Multiple participatory research methods [33] were applied to explore the household characteristics and the structure of the two villages (Table 2). Details of local livelihoods were obtained from semi-structured, open-ended household interviews (n = 29) with the following question categories, drawing on the structure of the Sustainable Livelihoods Framework (SLF) [34]:
- Human Capital: education level, jobs and sources of income, other skills, work distribution, openness to innovation;
- Social Capital: household members, age, decision making, water/sanitation, health, food sources and preparation, gender roles;
- Institutional: social assistance, agriculture, and energy subsidies;
- Natural Capital: environmental concerns, access to natural resources, details of the agricultural system including crops, animals, and inputs;
- Physical Capital: land ownership, waste disposal, energy supply and use patterns, knowledge of RE.
Interviews, transect walks, and participant observations were always accompanied by one of the three students from BCKV, who translated from Bengali into English and vice versa. The information obtained was transcribed and coded to allow categorization, generalization, and interpretation [35] (p. 184ff). Subsequently, the information was cross-checked and triangulated with data from secondary sources listed in Table 2 and the key informants from BCKV. Quantitative data were processed using MSO Excel 2007, performing descriptive statistics to calculate percentages, averages, quantiles and ranges (min–max) [35].
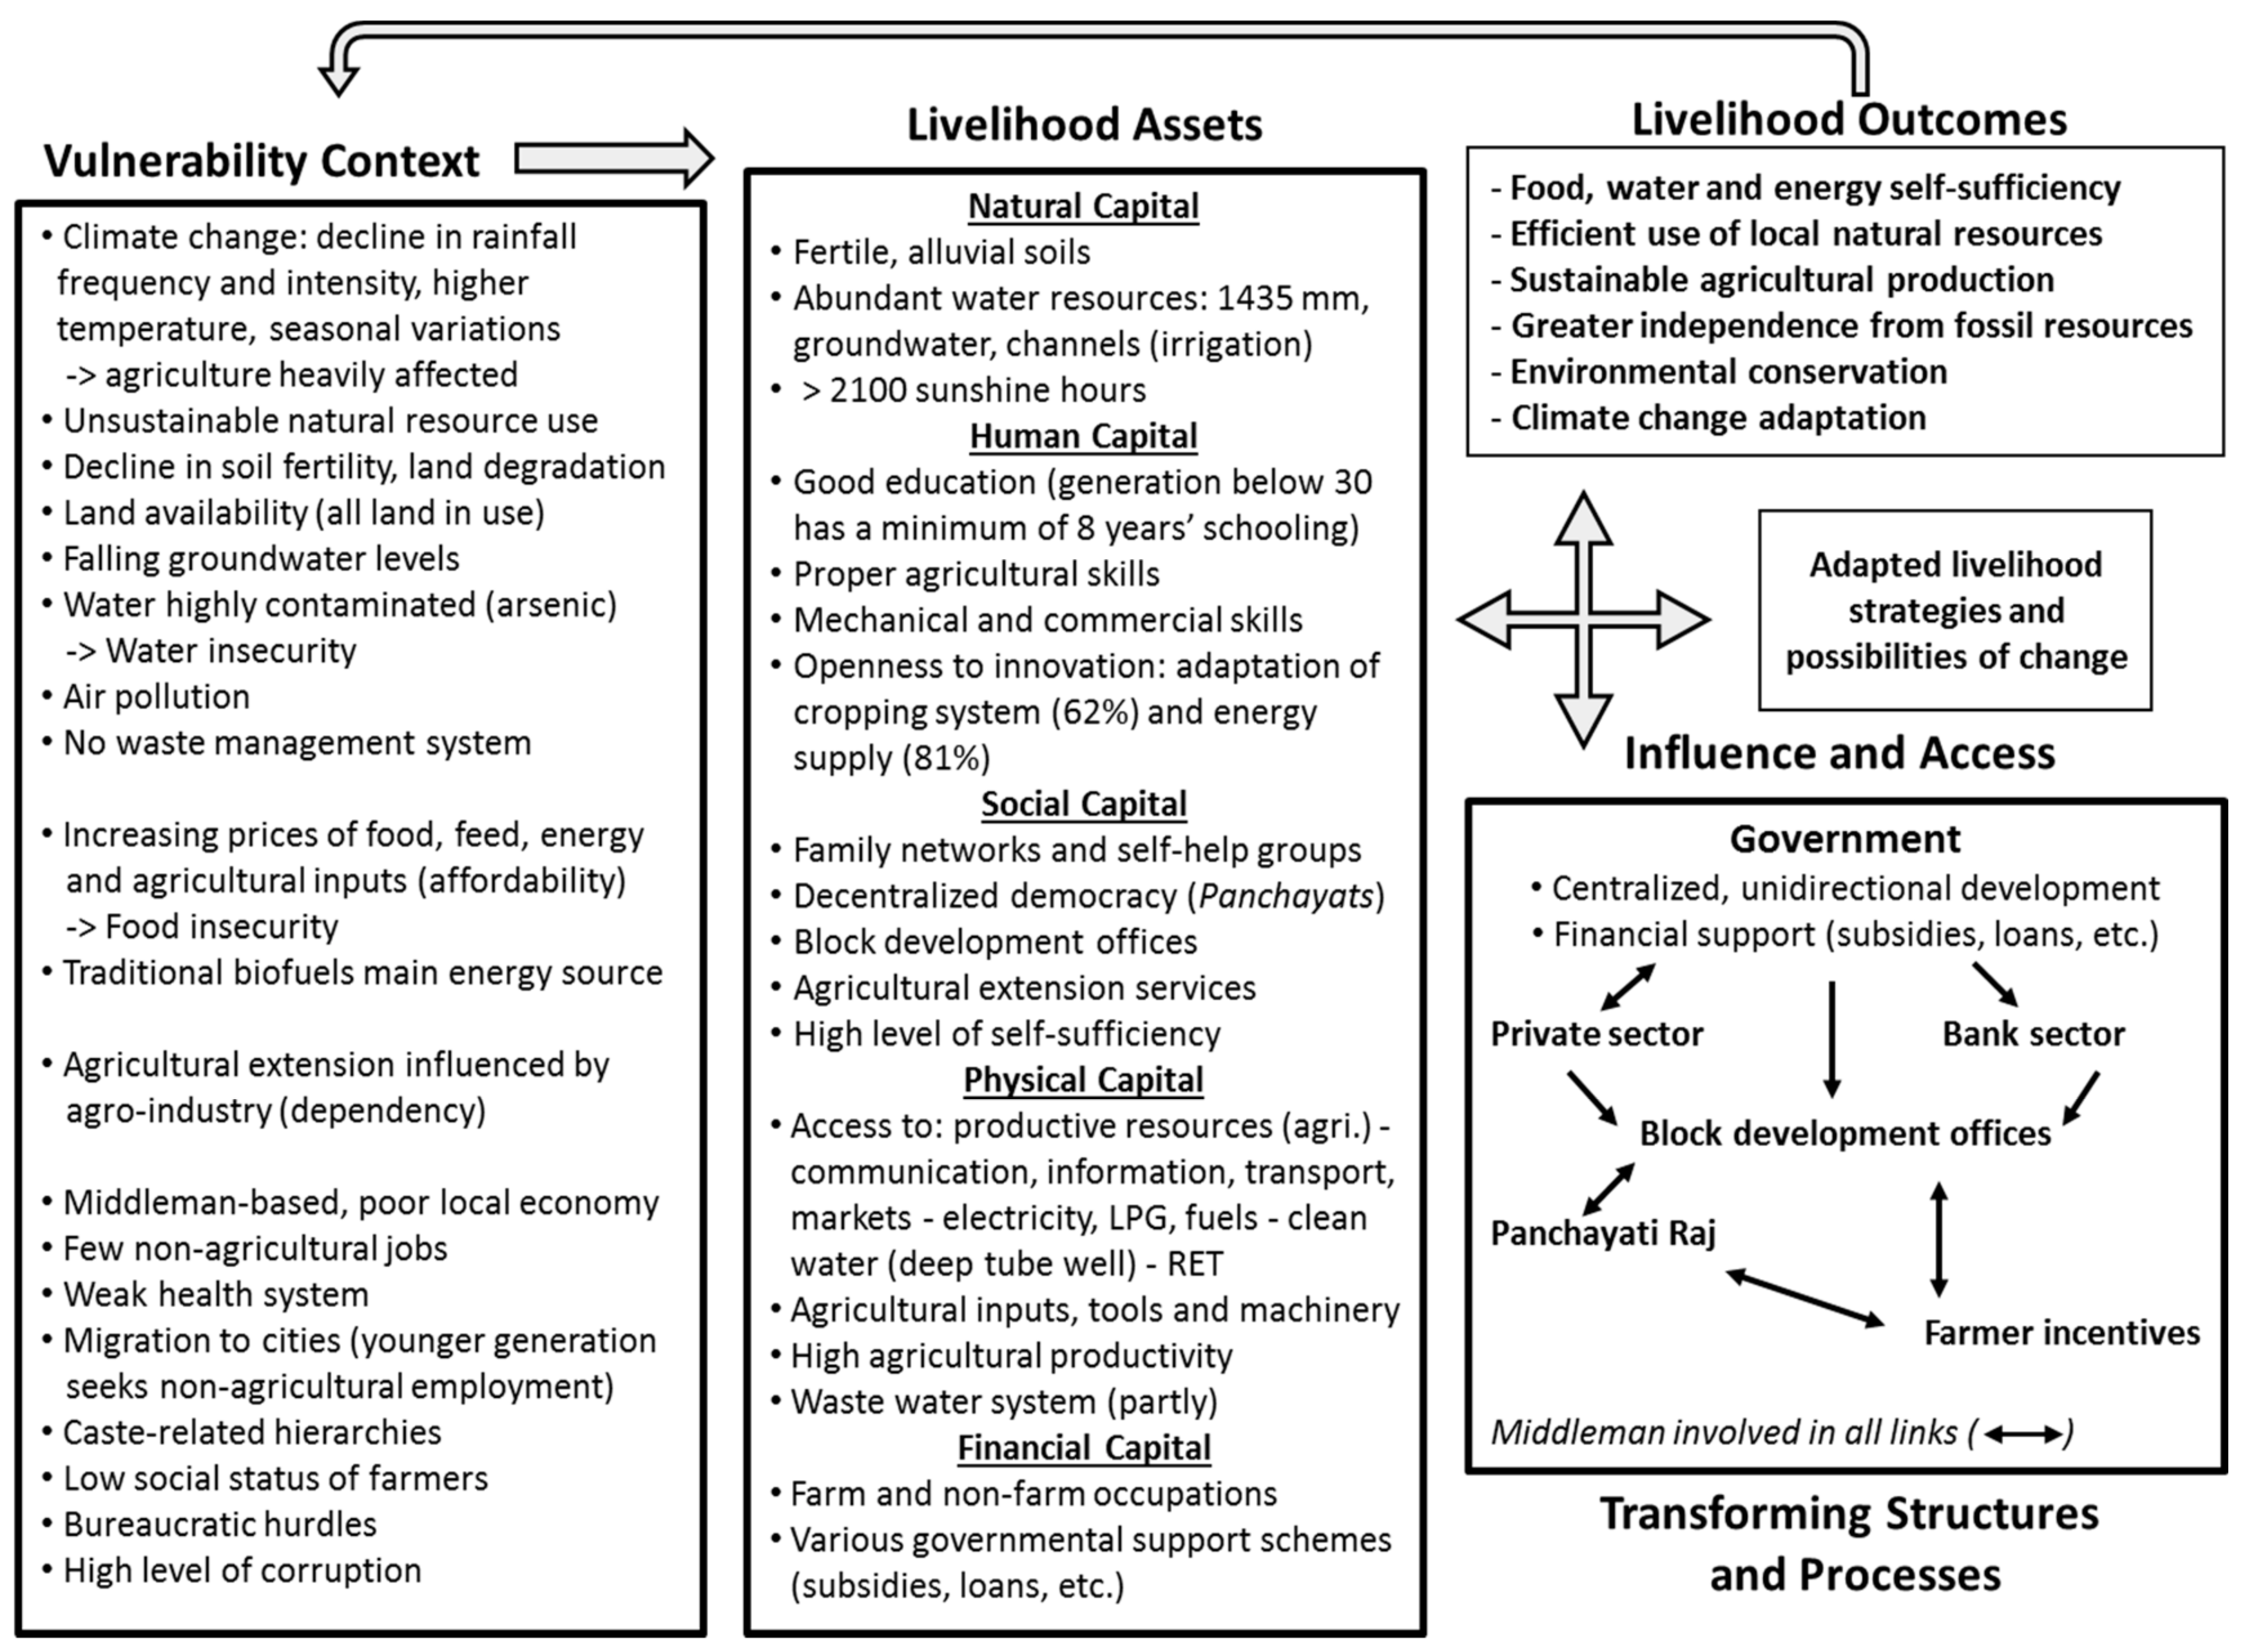
The results were structured using the SLF, characterizing people’s livelihoods based on five categories of Livelihood Assets (human, social, physical, natural, and financial). These are influenced by the external environment, which in turn affects the wider availability of assets, and circumstances people have to cope with, such as natural disasters, financial crises, seasonality, and others (Vulnerability Context); institutions, organizations, policies, and legislation (Transforming Structures and Processes); and the strategies adopted to achieve certain Livelihood Outcomes (Livelihood Strategies) [34].
These results were then categorized according to relevant social, institutional, environmental, technical, and economic factors, regarded as local RET sustainability criteria. Eight criteria were derived that determine the requirements for an RET to be appropriate in this specific local context. Not more than nine criteria should be employed in the Analytical Hierarchy Process (AHP) (Step 6) to keep execution manageable and increase consistency of results [32].
Biomass resources available for energy production (and cultivation areas) were explored at individual farm level. Local yield levels were obtained through household interviews supplemented by FAOSTAT data [36].
- Step 4a: Geographical Renewable Energy Potential (GREP)
The GREP determines the suitability of land areas for RE generation based on bio-physical RR data including temporal patterns [9,27]. Local RR power densities were evaluated based on threshold values for technical utilization. Average solar irradiance at ground level should be at least 120 W m−2 [27]. For wind energy, the average wind speed needs to exceed 4 m s−1 at 10 m hub height [7]. Power densities below these threshold values were excluded from the assessment. For hydro energy, the proximity of a river and its accessibility for smallholders was evaluated. For geothermal energy, the availability of easily accessible geothermal sources (e.g., hot springs) was assessed. The type, amount, and availability of the biomass resources obtained in IREPA Step 3 were analyzed. Only biomass residues or wastes without alternative uses, such as animal feed, were considered for energy production. The potential bioenergy output was estimated based on average values of residue-to-product ratios, energy content and biogas yields obtained from the literature (see Section 3.2.5).
- Step 4b: Technical Renewable Energy Potential (TREP)
The availability of suitable areas (and biomass residues and wastes) for RET installation was evaluated based on the local RET sustainability criteria (IREPA Step 3). Then, the conversion efficiencies of locally available RET were factored in [9,27].
- Step 5: RET Pre-selection and Energy System Design
Locally appropriate RET were pre-selected based on the TREP and the local RET sustainability criteria (IREPA Step 3), applying a cradle-to-grave value chain perspective for RE generation.
Four RETs were proposed and planned by the researcher, taking available materials and technology devices into account, including their costs and operation and maintenance (O&M) requirements.
- Step 6: Energy system impact assessment
Local appropriateness of the proposed RETs was assessed by applying two multi-criteria decision analysis (MCDA) methods with local participants: an adapted Analytical Hierarchy Process (aAHP) [37] and the Simple Multi-Attribute Rating Technique (SMART) [38]. The local RET sustainability criteria served as selection criteria in both MCDA methods.
The AHP is the most frequently used MCDA method in sustainable energy decision-making [12]. This descriptive method allows stakeholders (e.g., smallholder farmers) to compare and rank a set of selection criteria and RET options, arranged in pairs, to identify the most appropriate technology. However, the application of the AHP was found to be time-consuming and in some cases too abstract for the smallholders interviewed in the South African IREPA case study [20]. Therefore, the standard AHP [12] was adapted by clustering the RET sustainability criteria based on qualitative similarities [39] into: (i) Overall benefits associated with RET implementation; (ii) Benefits associated with RET; (iii) Energy-use benefits; and (iv) Requirements for RET implementation. Criteria clustering reduces the number of pairwise comparisons and helps participants clarify their thoughts, while increasing feasibility of application and accuracy of results [39]. Seven of the farmers previously interviewed participated in the aAHP questionnaire. First, the local RET sustainability criteria were arranged in pairs. The farmers rated the importance of the two criteria against each other on a scale of 1 to 9 (1 = equal importance; 9 = absolute importance over the other). Second, each participant compared the proposed RETs, arranged in pairs, with each other, and with respect to each sustainability criterion. The pairwise comparisons allow the computation of a decision matrix. Based on these ratings, the eigenvector of (i) each sustainability criterion and (ii) each RET are calculated using common matrix algebra. This expresses the priority of each participant [37]. However, the farmers found the abstract nature of pairwise comparisons difficult and complained about the time-consuming procedure.
For this reason, SMART was applied with five previously interviewed key informants instead of aAHP. SMART is based on a straightforward ranking of criteria and RET. First, the RET sustainability criteria were rated on a scale of 1–100, assigning the most important criterion the highest score, the second-most important criterion the second-highest score, and so on. Then, the four RETs were evaluated based on their performance/compliance with each RET sustainability criterion, assigning the highest score (1–100) to the best-performing/complying RET, the second highest score to the second best-performing/complying RET, and so on. Thus SMART is easier and less time-consuming to apply, as scores are directly assigned to each criterion and to each RET option [38]. Finally, the rankings obtained from aAHP and SMART revealed the most appropriate RET, at village level (taking the average results of all rankings) or at household level (taking the ranking of an individual farmer).
Differentiation between farmers’ and key informants’ rankings allowed a comparison of viewpoints based on personal situation between insiders (farmers) and outsiders (key informants).
- Step 7: Participatory decision-making process
Once IREPA has been applied, all stakeholders concerned (local smallholders, government bodies, companies and non-governmental organizations) should have comprehensive information at hand. If an RE project is to be realized, these stakeholders should be able to select locally appropriate RET with a high chance of successful implementation.
3. Results
3.1. Locally Relevant Factors for RET Selection
Interviews revealed that smallholder livelihood assets comprise: favorable agro-ecological conditions (natural capital); agricultural skills, knowledge, and openness to innovation (human capital); availability of agricultural extension services and governmental support through the block development offices (social capital); and access to productive resources and agricultural inputs (physical capital) (Figure 1). These assets result in high crop productivity (livelihood outcome). For example, the average paddy rice yield of 4.66 tons per hectare was found to be above the Indian average of 4.03 tons per hectare [36].
Farmers reported various unfavorable conditions (vulnerability context). Changes in weather patterns (temperature increase and rainfall decrease) experienced in recent years during the period January to April negatively affect winter crop (Rabi) productivity, increase irrigation demand (including energy expenditure) and cause temporal water insecurity. Older farmers reported declining soil fertility attributed to high cropping intensity (up to three crops annually). Use of fertilizers and pesticides has increased (and are necessary) to maintain crop yields, posing a major threat to farms’ financial viability, exacerbated by rising prices for these inputs, and to the environment. Alternatives to synthetic fertilizers and pesticides are not offered by agricultural extension services, which are largely dependent and influenced by agrochemical companies. They advertise their products as part of agricultural trainings. The low social status of farmers in the caste system, high levels of corruption, and bureaucratic hurdles (e.g., time-consuming application for agricultural credits) hamper farm development, e.g., the shift from paddy rice towards less irrigation-intensive orchards. Market prices are dictated by middlemen (e.g., retailers), who also intervene in agricultural credit and subsidy applications.
Smallholder farming is gridlocked in a situation of socio-economic dependence and negatively affected by agro-ecological and agro-economic circumstances. Two Baikunthapur farmers interviewed were considering quitting farming and migrating to Kolkata due to their inability to sustain their households from farming and the lack of alternative employment in the weak local economy.
Farm development and support is instigated by centralized government incentives and implemented by local Block Development Offices, private companies, and state banks. Individual incentives and bottom-up development are limited to the communication of suggestions for improvement to the Block Development Offices or the local government (Panchayati Ray).
Farmers’ assets, their vulnerability conditions, and the transforming structures and processes determine the livelihood strategies they adopt. The implementation of RET can have beneficial livelihood outcomes for the concerned farmers.
Eight locally relevant factors for RET selection, derived from interviews, are summarized below.
3.1.1. Environmental Conservation
Concerns about the environment were expressed by about half the farmers interviewed. These include changes in local climate, declining soil fertility, waste disposal, and air pollution (Figure 2). “When I was a child, nature was pollution free. Now it is polluted. Winter became less and lesser and has higher temperatures" (male farmer, 38 years.). Ninety percent of the farmers expressed concerns about changes in local climate. A statistically significant increase in minimum and maximum temperatures has been reported throughout India, as well as a non-significant trend of decreasing precipitation in winter and the pre-monsoon season [40]. Decreasing water availability has been detrimental to smallholders’ winter crop yield in recent years. Some farmers (28%) attribute negative impacts on the environment to the use of energy sources, for example soot and dust from firewood and CO2 emissions from fossil fuels. These findings resulted in the local RET sustainability criterion: Conservation of the natural environment (biodiversity), natural resources (soil, water, air), and ecosystem services.
3.1.2. Land Requirement for RET Installation
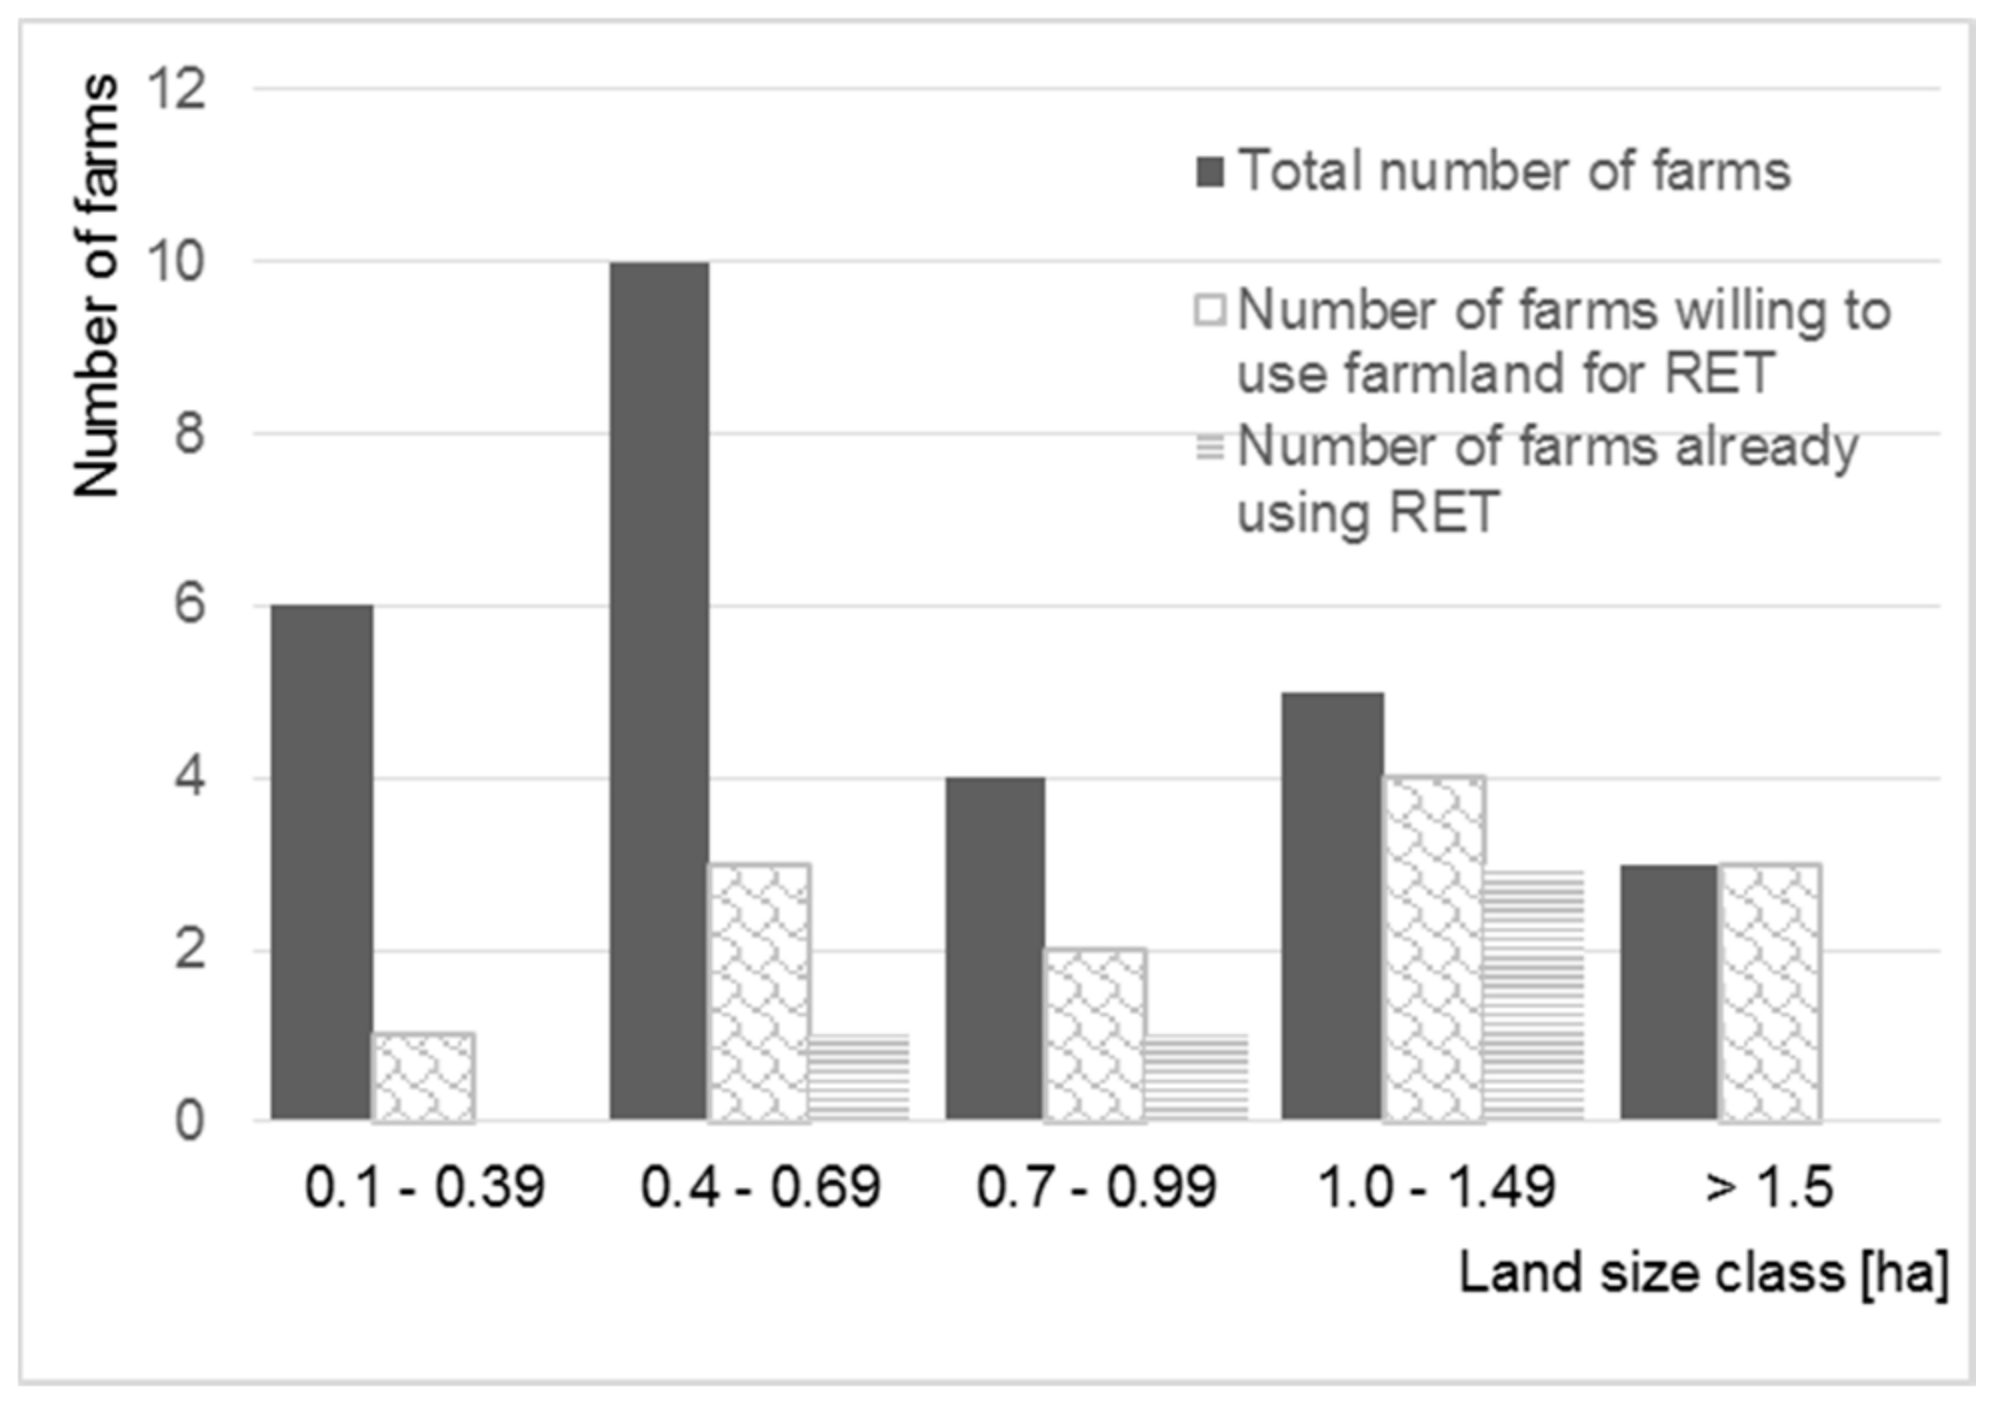
Virtually all land in both villages is utilized. Land possession is not equally distributed among the farms. On average, a farmer in Ghoragachha owns 0.76 ha (range: 0.13 to 1.3 ha), in Baikunthapur 0.85 ha (range: 0.4 to 2.43 ha). Figure 3 classifies farms according to land size, willingness to use farmland for RET installation, and farms already using RET (solar-photovoltaic (PV), biodigester, or both). The installation of RET is more likely on larger farms—only a few already use RETs. Early adopters of new technologies typically have a higher socio-economic status and own more resources (land, financial capital), enabling them to take the risks associated with new technologies [41].
The majority of farmers (82%) prefer growing food and feed crops on their land. The remaining farmers are only interested in combined food, feed, and fuel production if it increases revenues.
Most farmers (93%) are willing to use roof areas for solar-PV and yard areas for small biogas systems. The resulting sustainability criterion is: Land requirements for RET installation including feedstock (production) for bioenergy.
3.1.3. Energy Security and Reliability
All farming households in both villages are grid-connected, except for the poorest households on the outskirts of Baikunthapur. Frequent power cuts in the pre-monsoon and monsoon period lead to an insecure electricity supply. This had already motivated six farmers to install solar-PV systems. For cooking, however, the majority of households (89%) rely on traditional biofuels (agricultural residues, cattle manure) (Table 3), mainly because these are freely available on-farm. During the monsoon season, when biofuels become wet, LPG (and kerosene) is preferred for cooking. The households currently use diverse energy sources, adapted to seasonal availability, affordability, and reliability of supply. This resulted in the RET sustainability criterion: Secure and reliable energy supply that matches energy demand at times when energy is needed.
3.1.4. Reduced Expenditure on Energy Sources
All households in Ghoragachha consider themselves energy-secure. In Baikunthapur, 43% of households report an electricity deficiency, 29% lack energy for irrigation, transport, and processing. On average, a household consumes 101 kWh electricity, 10.6 kg LPG, and 366 kg traditional biofuels per month (Table 4), accounting for 22% of monthly household expenditure. The farmers adapt their electricity and LPG consumption to affordability. For example most households (62%) use LPG for preparation of small morning and evening meals, while preparing the main meal on cheap traditional biofuels. However, no relationship was found between household income level and energy sources used. This choice is largely influenced by non-financial factors: on-farm availability of agricultural residues/cattle manure, seasonality and reliability of electricity supply, taste of food, and cooking time requirements.
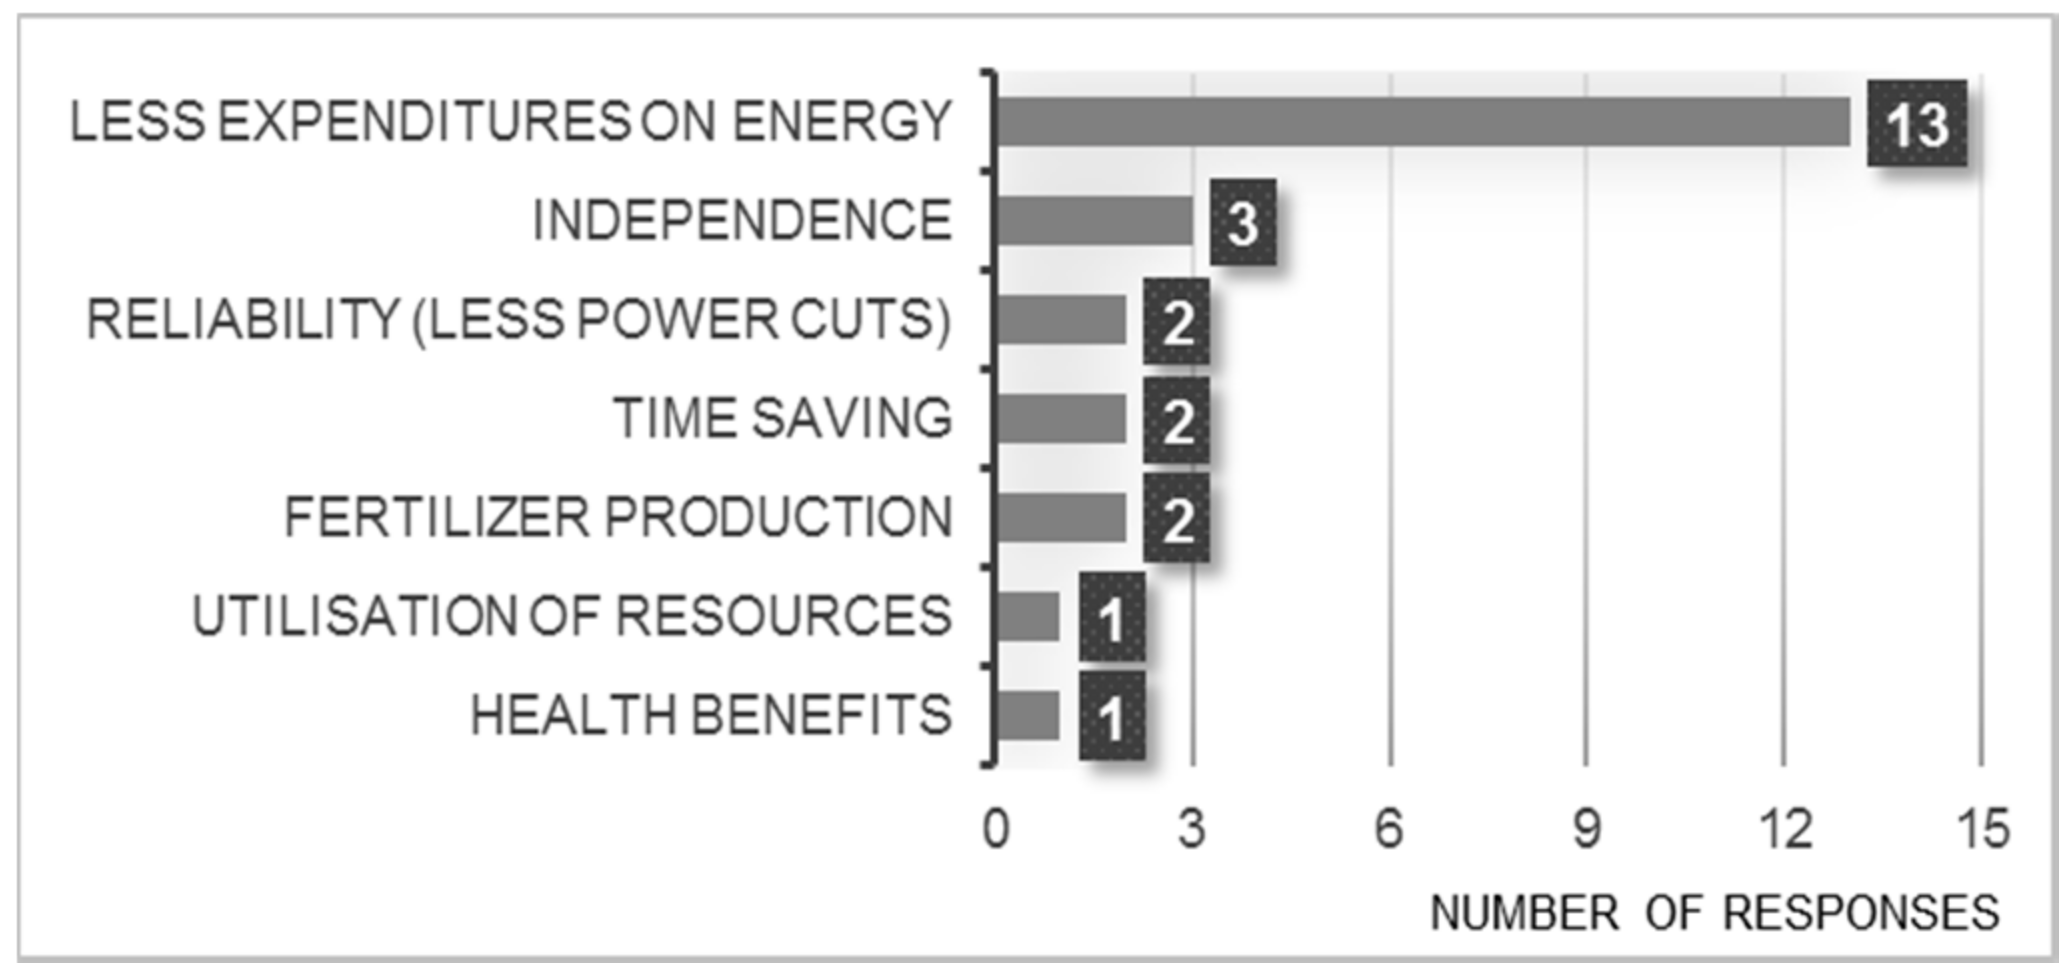
Most farmers associate the implementation of RETs with a reduction in energy expenditure (Figure 4). This can be attributed to price increases for electricity (+22.2%), diesel (+9.7%), and LPG (+6%) from 2012/13 to 2013/14 [42]. The resulting RET sustainability criterion is: Reduction in energy expenditures considering the projected increase in fossil-resource prices.
3.1.5. Government Support of RET
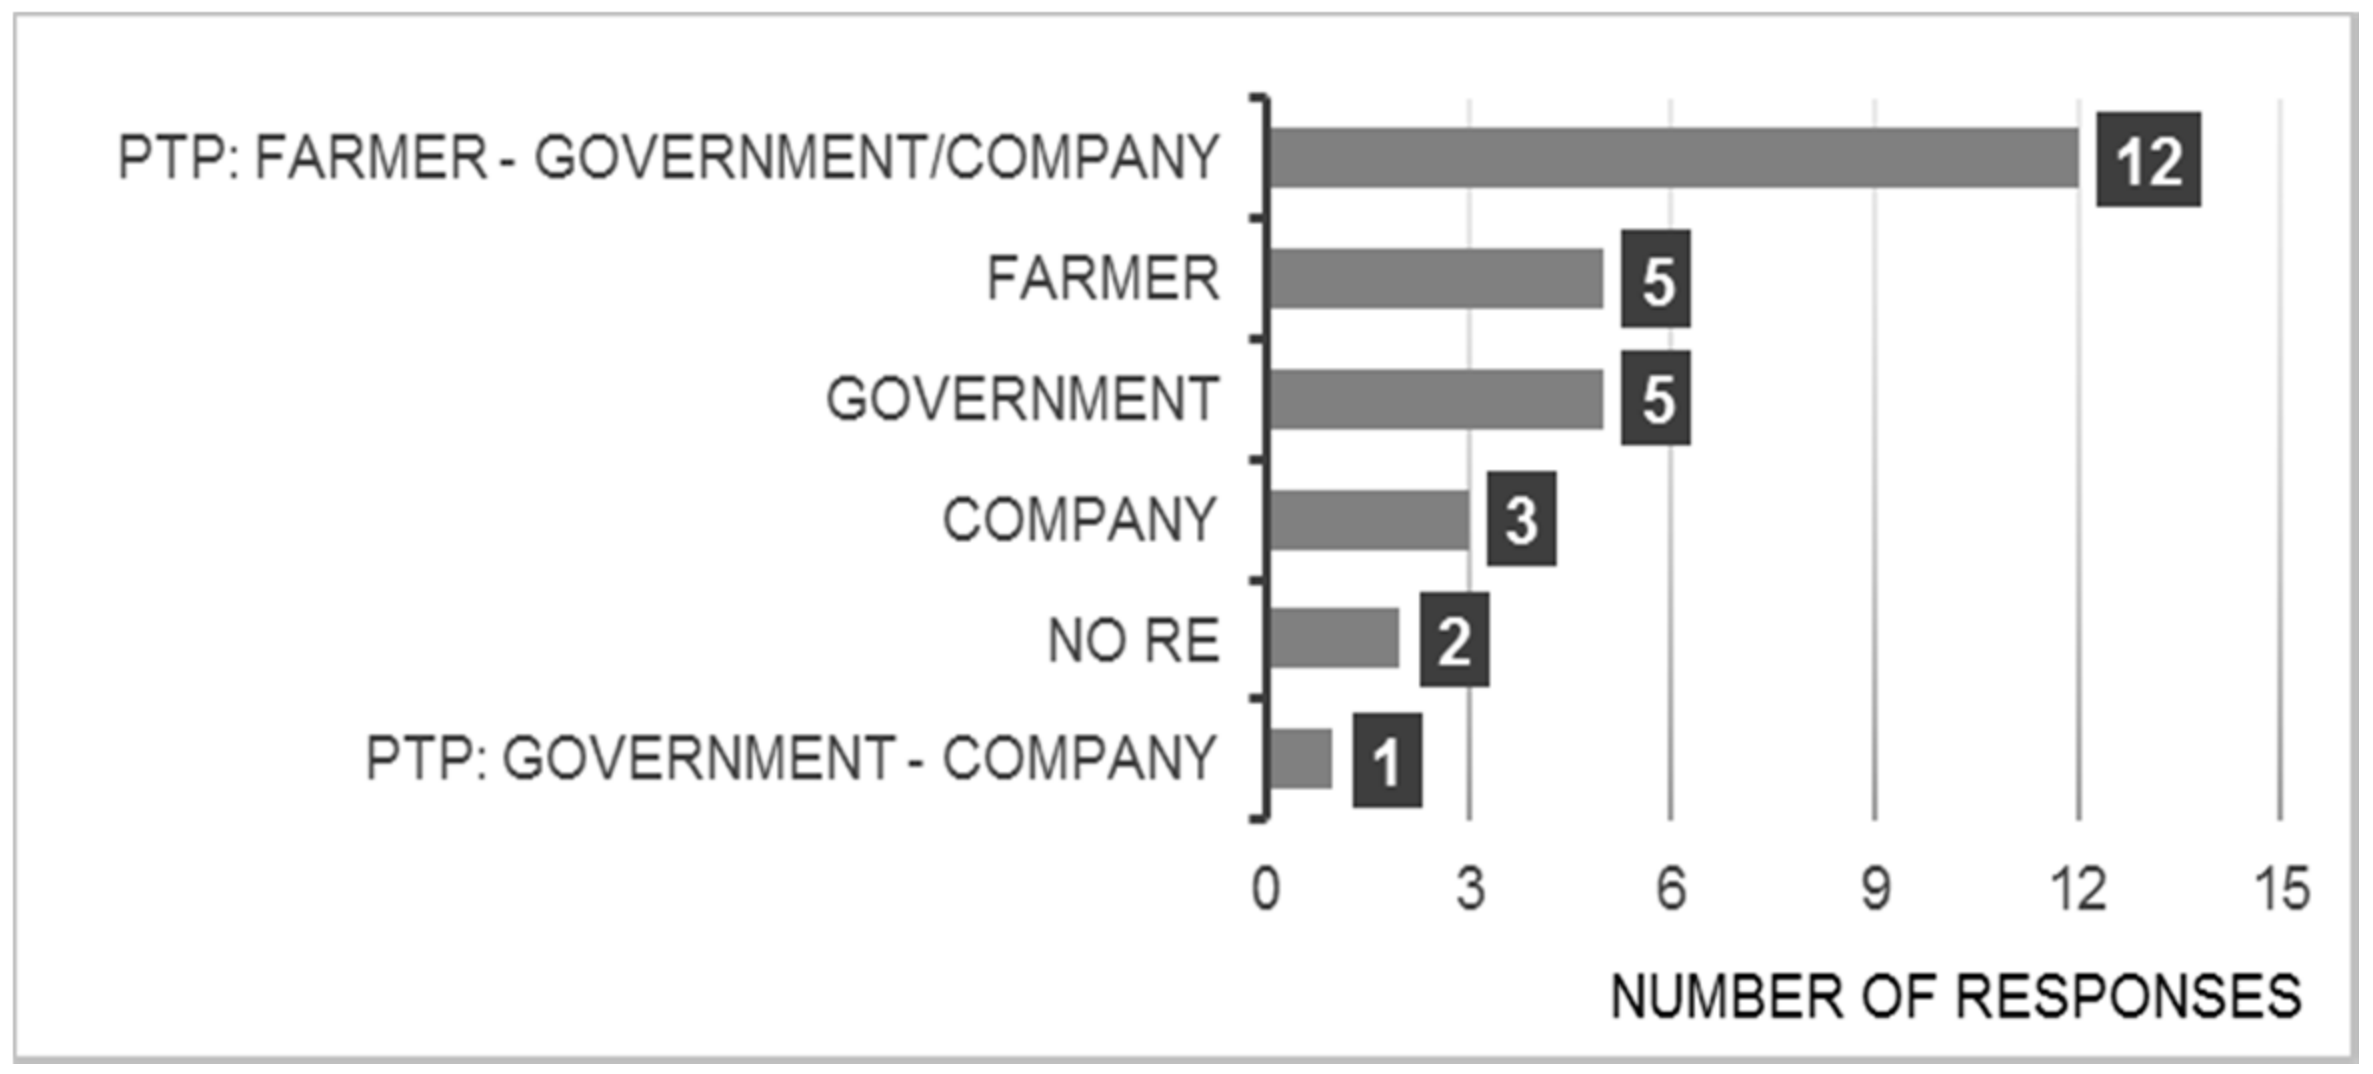
Several RE support programmes exist in India, e.g., the National Biogas and Manure Management Programme (NBMMP; launched in 1981) [43] and the Jawaharlal Nehru National Solar Mission Programme (JNNSMP; launched in 2012) [44]. The West Bengal Renewable Energy Development Agency (WBREDA, Kolkata, WB, India) coordinates these programmes at state level, while local Block Development Offices are responsible for RE implementation. The government provides financial support for initial investment through credits from state banks. Contracted private RE companies provide technical support in construction and O&M of RETs. Only 36% of interviewed farmers are aware of these RE support programmes, although the farmers regard partnerships (PTP) between government bodies, the private sector, and farmers the most viable strategy for RE introduction (Figure 5). Several RETs have been installed through such programmes: in Baikunthapur, two biodigesters; in Ghoragachha, five biodigesters and six solar-PV systems. However, RE has since been withdrawn from the local development agenda. The Block Development Officer and the Agricultural Development Officer of Chakdaha stated: “(Currently) Trainings for farmers don't have RE aspects”, (we) “now subsidize diesel for pumping (water), LPG for cooking and access to grid electricity” (personal communication, 27 February 2015). Hence, current RE implementation is self-driven, based on individual applications for RE support programmes. Nevertheless, five farmers are planning to install a biodigester or solar-PV system. These findings lead to the RET sustainability criterion: Availability of and access to government support for installation as well as for operation and maintenance of RET.
3.1.6. Investment Costs of RET
Six farmers have installed mini solar-PV systems consisting of one 75 Wp panel, an 80 Ah battery, a small table fan, and four compact fluorescent lamps (CFL), financed by a loan from JNNSMP, with a five-year pay-off period at an interest rate of about four percent. The partner company, KIRTI Solar, provides free maintenance support throughout the pay-off period. Farmers appreciate the reduction in energy expenses and the reliable light provision. “Before solar, my electricity bill was 3000 INR (€ 42) for 3 months. Now it is 1800–2000 INR (€ 25–28) for 3 months. It makes life easier” (male farmer, 33 years). However, the investment costs of 26,000 INR (€ 370) are considered too high for such a small solar system. Other disadvantages reported include: lights become dim after three days without sun; other electrical appliances such as TV or mobile phone charger cannot be connected; and minor benefits that materialize in the distant future.
In the two villages, seven fixed-dome biodigesters (Deenabandhu-Type, fermenter volume 3 m3) have been installed since the year 2000. The NBMMP granted a subsidy of 5000 INR towards the total investment costs of about 9000 INR (€ 130) [45]. The biogas yield of about 400 to 700 litres per day [46] is sufficient for the preparation of one meal for up to five people [47].
The willingness to install RET is directly related to the initial investment and future (economic) benefits. These findings result in the RET sustainability criterion: Initial investment costs (affordability) and willingness to make a long-term investment with benefits materializing in future years.
3.1.7. Education and Development of New Skills
Technology-specific skills are required for O&M of RET. About half of the farmers are keen to learn new skills, agricultural and non-agricultural, in order to increase and diversify their income, while 41% are skilled in mechanics, carpentry, or construction. Extension services exist, in particular in Ghoragachha, providing information and training on new technologies and farming practices. The younger generation (<30 years) has a minimum of 8 years’ schooling and increasing numbers of farmers’ children attend university. The educational and skills background of the farmers is deemed suitable for RET O&M, while a technical-support infrastructure already exists for solar-PV and biodigesters. Further implementation of RETs will foster skills development among farmers and may in turn provide new employment and income opportunities in RET installation and O&M for those already skilled. This was taken up as an RET selection criterion: Education on RET installation, operation and maintenance to create new job and income opportunities.
3.1.8. Ease of Daily Activities
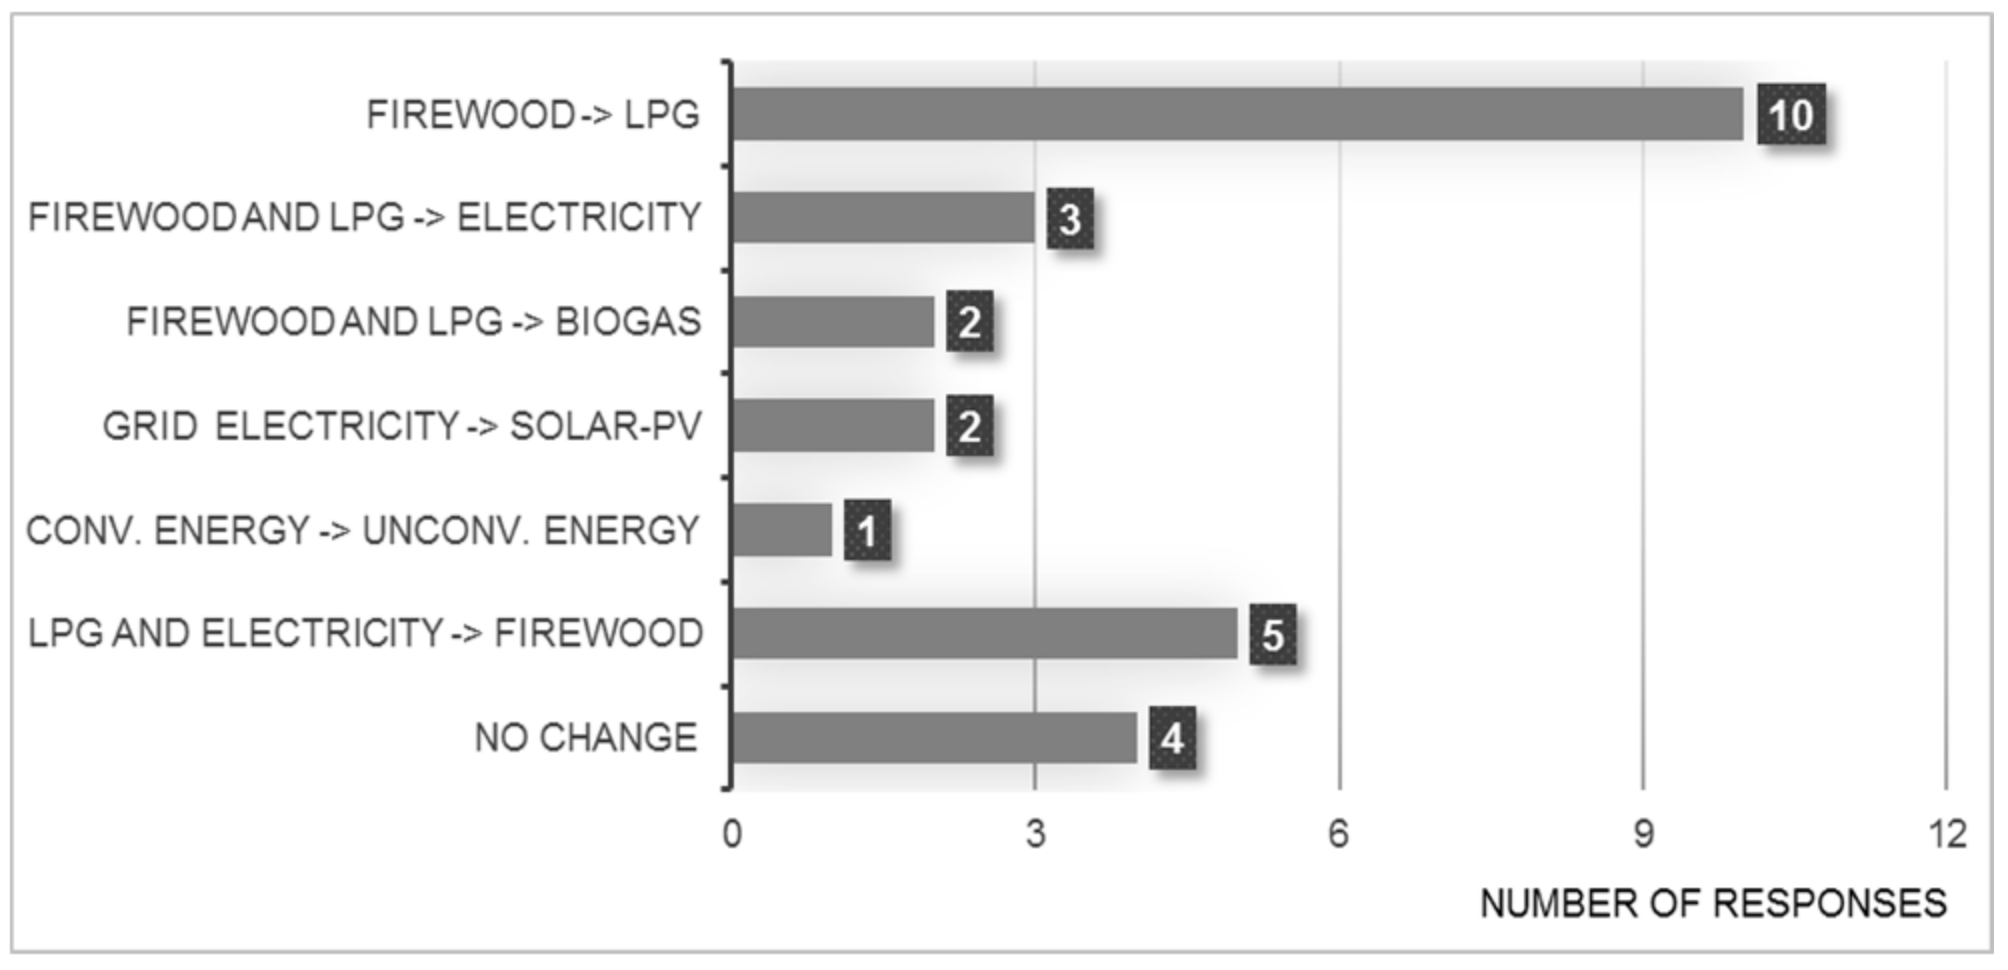
Currently, the farming households are striving after a modern lifestyle, altering energy use patterns. Televisions, smartphones, laptops, and internet access are part of daily life, requiring electricity. Thus, the majority of households (79%) are shifting towards electricity (including solar-PV) and LPG (including biogas) for cooking (Figure 6). The use of LPG is motivated by: negative health impacts of traditional biofuels induced by indoor air pollution; blackening of interior walls and furniture; high workload of biofuel collection and processing; and time-consuming cooking procedures. Typical statements recorded are: “Women don't like using wood because of lifestyle” (male farmer, 32 years); and “I prefer LPG, it’s quicker to cook” (woman, 22 years).
By contrast, five households are not satisfied with modern energy sources: LPG smells and causes irritation of the eyes; kerosene reduces the lifespan of machinery (e.g., irrigation pumps); and electricity has frequent power cuts. Instead, firewood is preferred because it is freely available on-farm and “the taste of food cooked on chulhas is much better” (male farmer, 36 years.).
Five households are considering switching to RE as a more reliable source of electricity (solar-PV), or as a cheaper energy source for cooking (biogas). The ongoing transition and the arguments brought up by the farmers are summarized in the RET selection criterion: Ease of daily activities related to energy, in particular a reduction in time and labour burden for collection, processing, and utilization of traditional biomass sources, and reduction in adverse effects of energy carriers on user’s health.
3.2. Renewable Energy Potential: Solar, Wind, Hydro, Geothermal, Biomass
3.2.1. Solar Energy
The average annual irradiance of about 200 W m−2 [28] in the two villages is excellent for solar energy production. The total land area and 2108 annual sunshine hours [48] give a theoretical solar energy potential of 17.32 PJ a−1 and 4.29 PJ a−1 for Ghoragachha and Baikunthapur, respectively (Table 5).
Excluding areas unsuitable for solar energy (lakes, forest-covered land, roads, and pathways) reduces the geographical solar potential slightly to 17.16 PJ a−1 and 4.28 PJ a−1, respectively (Table 5). The selection of areas available for TREP assessment was based on farmers’ opinions: 45% of farmers in Ghoragachha and 43% in Baikunthapur would be willing to use agricultural land for solar energy production. The majority of farmers would be willing to use the land area around their houses and the roof (Ghoragachha: 93%; Baikunthapur 83%). Taking an average efficiency of 12.2% for locally available polycrystalline solar panels [49], the technically useable solar potential in Ghoragachha is 0.015 PJ a−1 and 0.003 PJ a−1 in Baikunthapur.
3.2.2. Wind Energy
Mean annual wind speed in the research area (1.93 m s−1) is below the threshold value of 4 m s−1 at 10m hub height and thus not technically useable for energy production [7].
3.2.3. Hydroenergy
The research area is in close proximity to Hooghly River, a tributary of the Ganga. The Hooghly has an average discharge of about 40,000 m3 s−1 [30] and embodies a theoretical hydroenergy potential of 12.3 PJ a−1, but is inaccessible for smallholder farmers.
3.2.4. Geothermal Energy
West Bengal has considerable potential for geothermal energy with thermal springs at Bakreswar, located over the Sonata lineament. However, there are no thermal springs within the research area, situated about 200 km southeast of Bakreswar [32].
3.2.5. Energy from Biomass
The net primary productivity (NPP) in the research area serves as an initial indicator of natural biomass growth and seasonal patterns. The NPP is highest (average 1.5 g C m−2 day−1) from September to February, after the monsoon. From March to August the average NPP is considerably lower (0.6 g C m−2 day−1), revealing a distinct seasonality in biomass growth [31]. The annual NPP results in a theoretical bioenergy potential at Ghoragachha of 0.16 PJ a−1 and at Baikunthapur of 0.04 PJ a−1 (Table 5).
The majority of farmers (86% in both villages) prefer food crop production for subsistence and marketing. Dedicated energy crops, and therefore biofuels, are not considered a viable option. The local cropping system has three seasons: Kharif is the paddy rice season (monsoon crop); Rabi is the winter crop season for brinjal, chili, potato, onion, and cauliflower; and Zaid is the season for cucumber, bottle gourd, and ridge gourd. The majority of farms also have orchards with a variety of fruit trees such as ber (local apple), orange, and mango. The residues of these crops, as well as organic wastes and animal manure are suitable resources for biogas production. The amounts available were recorded in household interviews and used for assessing the geographical and technical bioenergy potential (Table 6).
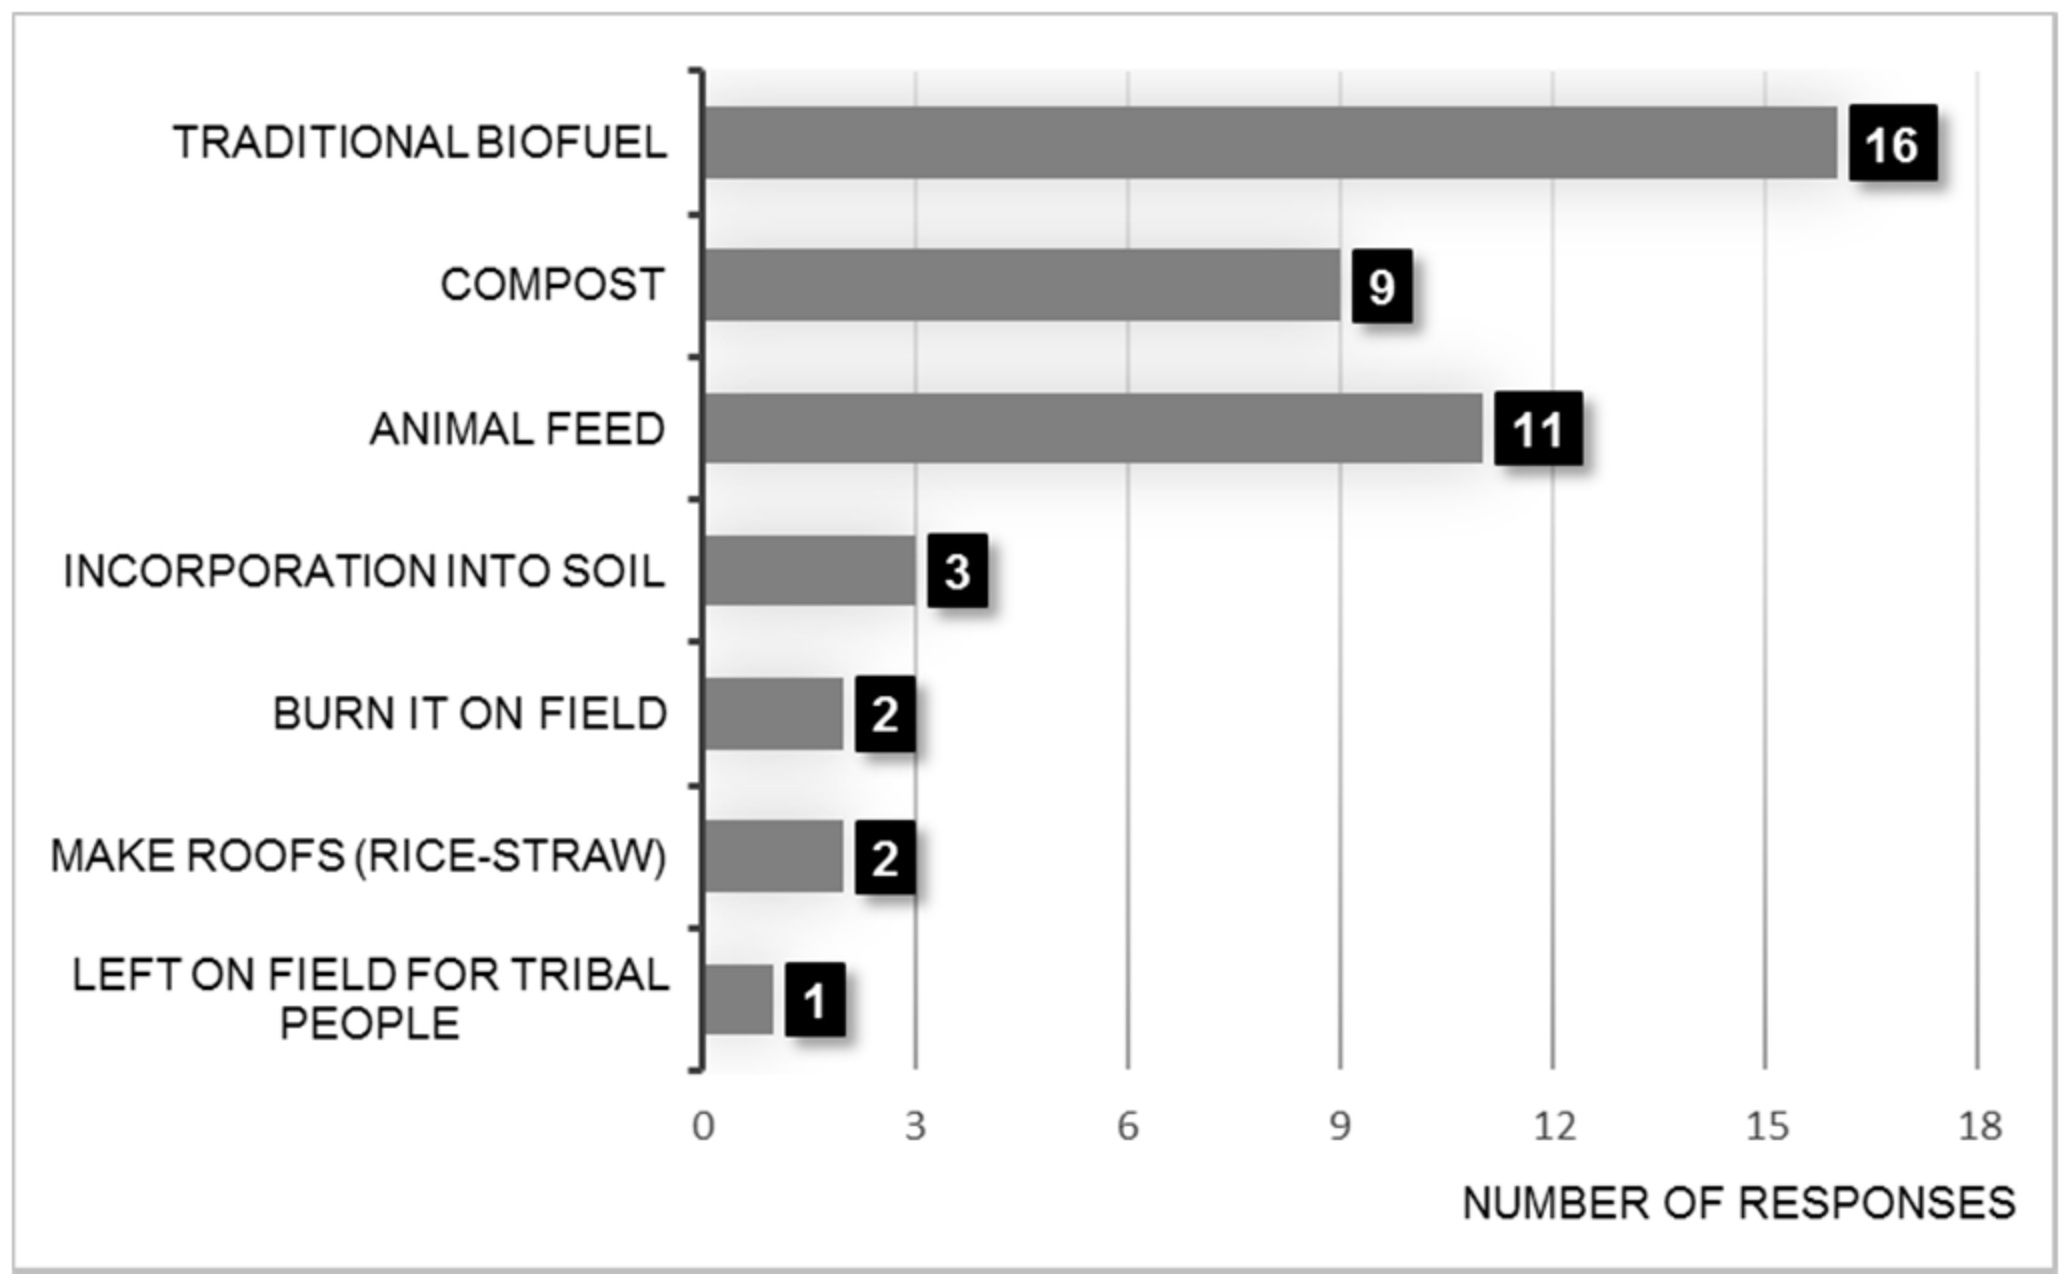
Availability of these biomass resources depends on their current utilisation (Figure 7). The majority of households (89%) use dried crop residues, in particular fruit tree branches and lignified stems of brinjal, pepper, and chili plants, for cooking. Residues with lower lignin content are composted or fed to animals, for example rice husks (mixed with water) and rice straw.
As 71% of farms in Ghoragachha and 12% of farms in Baikunthapur do not keep cattle, the rice straw from these farms would be available for biogas production. Cattle manure is collected, one part is dried and burnt for cooking, and the rest is composted and used as organic fertilizer.
Organic household wastes are fed to goats and chicken, however, in Ghoragachha 62% and in Baikunthapur 25% of farmers do not use organic waste as feed, making the remaining potentially available for biodigestion. As goats and chicken roam around the houses freely, manure collection would be too time-consuming. Therefore, only cattle manure is considered in the estimation of potential biogas yield (Table 6).
Farmers with a biodigester were advised to use cattle manure only as feedstock. However, in the past decade the number of cattle in the villages has decreased considerably because: (i) agriculture is being increasing mechanised; (ii) grazing patches have been converted to crops; (iii) the price of cattle feed has increased; and (iv) cattle smuggling to Bangladesh has increased domestic cattle prices [58]. As a result, three out of six biodigesters have been abandoned due to the lack of feedstock. Agricultural residues and organic wastes are suitable for biogas production and all farmers would be willing to use them as additional feedstock. For example, after our interview, one farmer re-started his recently abandoned biodigester with vegetable residues.
Biogas can replace traditional biofuels for cooking, and the digestate can substitute compost as organic fertilizer. Thus, organic residues and wastes used for cooking and composting are potentially available for biodigestion. In addition, the farmers signalled their willingness to use human excreta as biogas feedstock. One toilet-connected biodigester was already under construction.
This results in a potential biogas yield of 1431 m3 per farm and year at Ghoragachha and 1510 m3 at Baikunthapur, and an annual geographical biogas potential of 0.004 PJ for Ghoragachha (134 households) and 0.008 PJ (263 households) at Baikunthapur. Considering the average thermal efficiency of biogas stoves (63.5%; [47]), the annual technical potentials are 0.003 PJ (1118 MWh) at Ghoragachha and 0.005 PJ (2316 MWh) at Baikunthapur.
3.3. Renewable Energy Technology Pre-Selection and Planning
Considerable solar and biomass resources were identified in both villages. The technical solar potential (Ghoragachha: 4150 MWh a−1; Baikunthapur: 880 MWh a−1) and bioenergy potential (Ghoragachha: 1118 MWh per year; Baikunthapur: 2316 MWh per year) could cover the total energy demand to 215% at Ghoragachha (2454 MWh a−1) and to 66% at Baikunthapur (4817 MWh per year).
For this reason, solar and bioenergy technologies were planned in accordance with the eight local RET sustainability criteria, the households’ energy demand and locally available technology parts.
3.3.1. Solar-PV Systems
Three solar-PV systems were planned (Table 7): one 500 Wp system sufficient for low household electricity demand; one 1000 Wp system covering average household demand; and one 1500 Wp system additionally enabling solar irrigation. The households remain grid-connected, but the PV systems provide a battery back-up of about 3 h per 500 Wp, increasing the reliability of electricity supply, e.g., during the monsoon period when power cuts are frequent, at reasonable costs. The farmers can transport the batteries in addition to the pump-set (at Baikunthapur already electric) to their field by freight bike. The PV panels cover a maximum roof area of 12 m2, available at all households visited.
Total investment costs of the 1000 Wp system are as high as an average annual household income (INR 115,071 = € 1630). A substantial reduction is achievable through the JNNSMP. This subsidy covers 30% of total investment costs and allows accelerated tax depreciation [44].
Compared to the investment costs (INR 26,000) of the 75 Wp solar systems already installed in a few households, the proposed systems would cover the entire household electricity demand, considerably reducing electricity expenditure and allowing amortisation within 9 to 12 years.
3.3.2. Household Biodigesters
“Deenabandhu” biodigesters, developed in India [59], were suggested here as the most appropriate bioenergy technology. Construction materials and technology parts, as well as O&M skills, are locally available. Biodigester costs (about 9000 INR for 3 m3 fermenter volume [45]) can be substantially reduced to about 4000 INR through the NBMMP subsidy [43].
Considerable amounts of agricultural residues, organic wastes, cattle manure, and human excreta are available, resulting in a potential biogas yield of 4 m3 per day and household. This volume could replace LPG and firewood for cooking up to four times [47]. Replacing LPG would save on average 314 INR per month, eliminate the burden of traditional biofuel collection and processing, and substantially reduce indoor air pollution. The digestate could provide valuable organic fertilizer, reducing requirements and expenditure for synthetic fertilizers by up to 30% [59]. As farmers currently transport compost from their households to the fields, using digestate instead would not require any change in application.
3.3.3. Integrated Food and Energy Systems
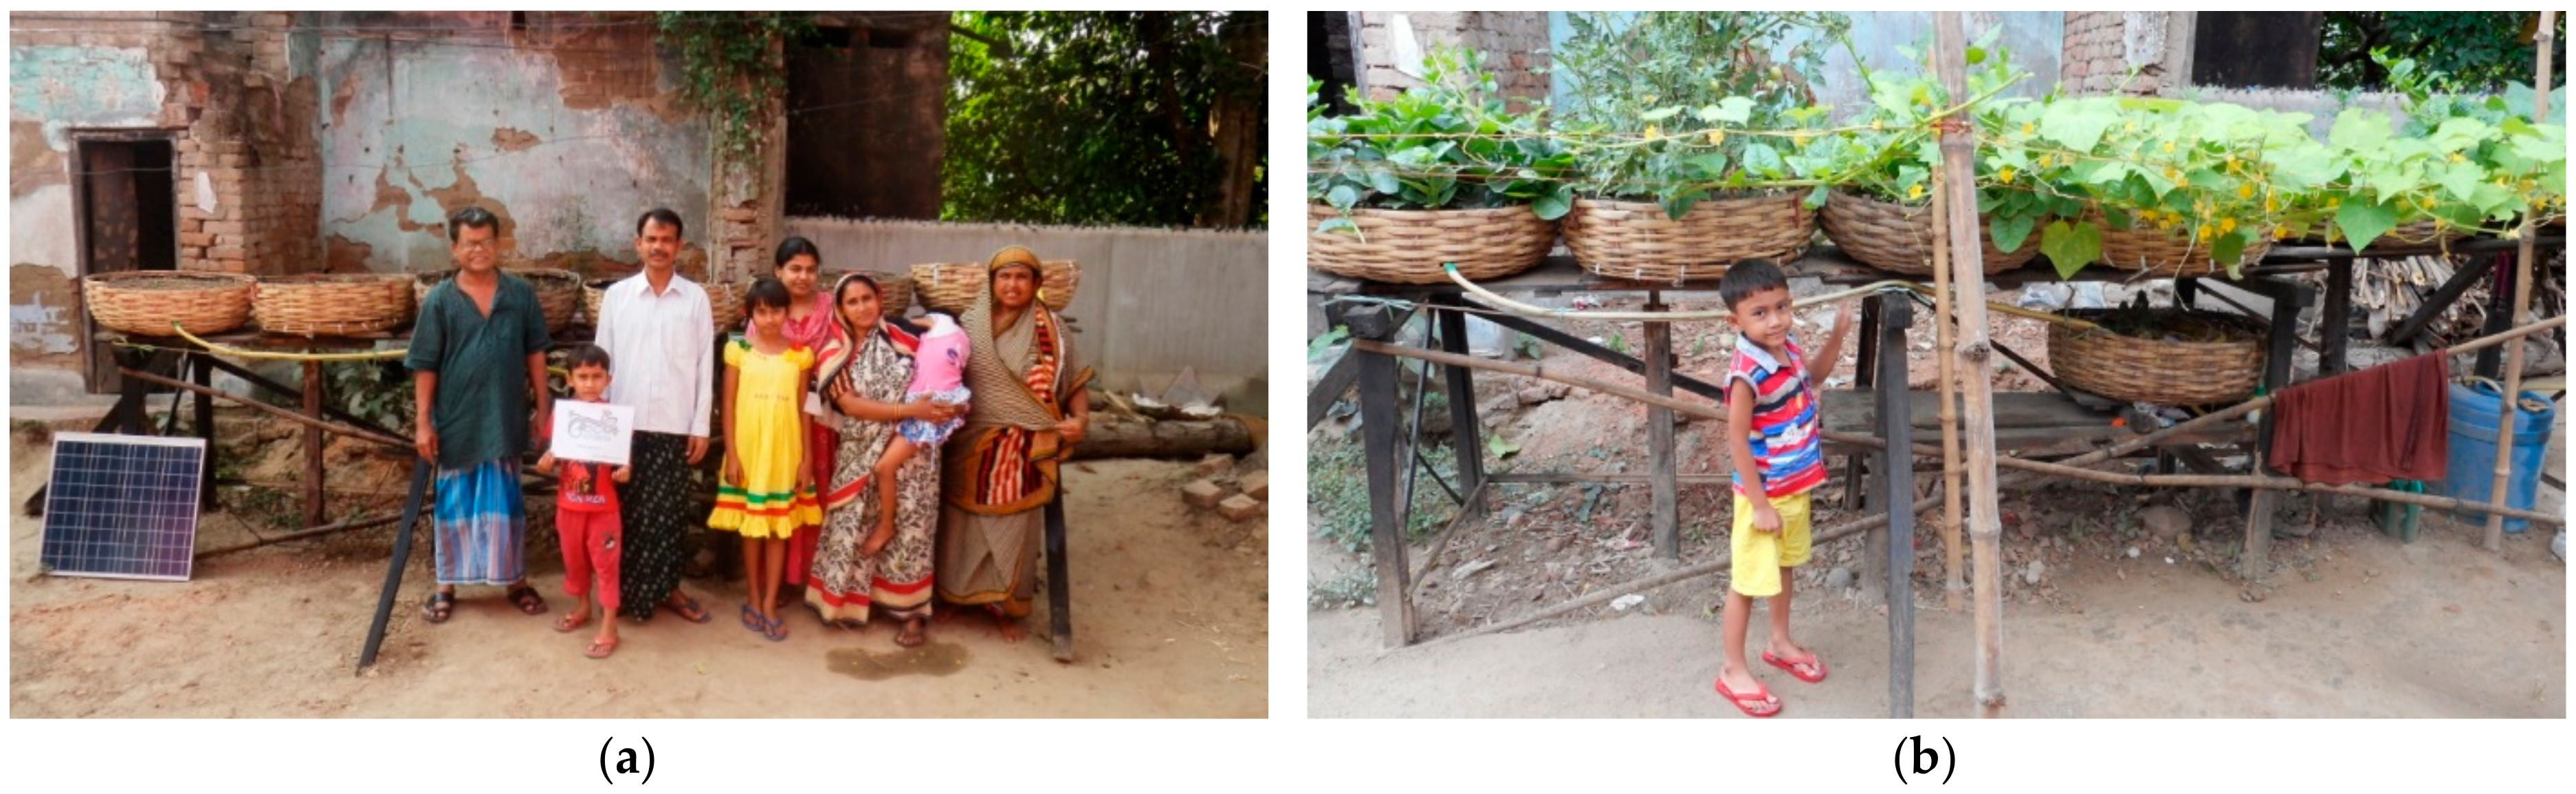
The innovative terrabioponic system was constructed in collaboration with two farmers as a showcase for the focus group (see Section 3.4) to demonstrate water-efficient solar irrigation, direct nutrient recovery, and space-efficient organic crop production (Figure 8). In this system, plant nutrients are recovered from organic wastes in a vermicompost (bio). Leachate from the vermicompost is collected and mixed with irrigation water. Planting pods made of bamboo, sealed with plastic foil and filled with soil (terra), are connected in series with hosepipes and arranged in descending order on a staircase-like structure made of re-used wood. The organic nutrient solution is pumped to the highest point from where it flows under gravity through all planting pods (ponic), the vermicompost, and back into the water tank. Additionally, solid vermicompost is regularly applied to the pods.
Investment costs for the solar parts, piping, and plastic foil were about 11,000 INR (€ 160). Other construction materials were sourced in the village free of charge. The terrabioponic food and energy system is scalable in size, independent of agricultural land and can be installed on flat roofs.
3.4. Impact Assessment and Technology Selection
The proposed RETs and the RET sustainability criteria were presented to eight farmers in a focus group at Ghoragachha and subsequently ranked by the farmers, employing the aAHP. The aAHP questionnaire was perceived as too abstract and time-consuming, despite clustered criteria. Only seven farmers completed the criteria rating, and six completed the RET ranking.
Subsequently, the aAHP questionnaire was replaced with the SMART method to increase response rate. Three (out of six) key informants from BCKV, the Block Development Officer (BDO) and the Agricultural Development Officer (ADO) of the Chakdaha Block participated in appropriate RET selection.
The farmers ranked the social RET sustainability criterion Ease of daily activities highest, followed by Governmental support and Land requirements (Table 8). The impact of RET on Environmental conservation was more important to the farmers than the techno-economic factors such as Investment costs. Solar-PV for household electrification and irrigation was considered the most appropriate RET (Table 9). However, the standard deviation is very high in both the criteria and RET ranking, revealing a strong heterogeneity with different criteria and impacts important for individual farmers. There is no single RET option that fits each farming livelihood. Thus, the aAHP ranking of each farmer should be considered on an individual basis to determine the most appropriate RET at household level.
By contrast, key informants rated techno-economic and institutional selection criteria as more important than social and environmental criteria (Table 10). Their criteria ranking is more homogenous than the farmers’ ranking. The solar-PV system and the integrated food and energy system were ranked highest (Table 11). However, the high standard deviation of the RE systems ranking again reveals individual preferences of the key informants for a particular RE.
4. Discussion
4.1. Selection Factors—Whose Perspective Counts
There were distinct differences between smallholder farmers and key informants in the factors considered important for locally appropriate RET. Farmers evaluated new technologies and practices based on (holistic) daily-life experience, and beneficial impacts on local climatic conditions, soil fertility, fluctuations in market prices for agricultural in- and outputs, and fossil fuel prices. Their interest in RET was aroused when strategies on ‘how to best cope with current agricultural issues’ became apparent. For example, once they became aware of the benefits associated with a biodigester (replacement of LPG and traditional biofuels, use of organic fertilizer to increase soil fertility) and the possibility of using agricultural residues and organic waste as feedstock in addition to manure, farmers asked for technical details and related costs.
In contrast, key informants primarily emphasised technical, financial, and institutional factors for RET selection. Similar results were recently published by [60], who evaluated 28 barriers to RET adoption in India. Eight experts from academia and industry ranked institutional support and local resource availability highest, followed by technical complexity and financial factors. Socio-cultural and personal behavioural factors were found in the lower half of the ranking.
With decentralized RE in particular, where energy consumers become energy producers, the social and behavioural dimension is crucial for energy choices. As [19] (p. 1391) points out, “Consumers are far from the purely rational decision-makers assumed by traditional economic models, and there is often a wide gap between peoples' values and material interests, and their actual behaviour”. This study provides in depth insights into the livelihoods of smallholders in two rural villages. The selected RET are appropriate in this socio-cultural and institutional context as well as considering locally available natural resources. Although the two rural villages investigated here may not be representative, and implementation and operation of the RET in the long term was beyond the scope of this study, the results presented here emphasise the importance of a participatory, bottom-up approach in RET selection and planning that involves intended users from the beginning. Broadening the perspective of rural development experts, politicians, and private-sector partners is deemed essential. This enables them to understand the daily challenges of intended RE producers and users, evaluate the impacts of RETs and thus ensure local appropriateness. The example of the biodigesters abandoned due to the lack of cattle manure illustrates the importance of a participatory bottom-up assessment of the local context. This should be based on mutual learning between intended users and experts, prior to the implementation of RETs.
4.2. How can the Transition towards Modern and Clean Energy in Smallholder Farming Systems in West Bengal be Promoted?
To date, about 90% of households in West Bengal use traditional biofuels for cooking ([8], this study). Biofuel consumption of households researched in this study (366 kg per month) is 36% higher than the Indian average (234 kg per month) [61]. About one-third of the households interviewed refuse to change current energy sources, with some even shifting back from LPG and electricity to traditional biofuels. Reasons stated include: unreliability of electricity supply; better taste of food cooked on chulhas; and the expense of electricity and LPG compared to traditional biofuels freely available on-farm. Throughout India, availability, affordability, and reliability of modern energy sources determine the substitution of traditional biofuels [8].
The majority of households in the researched villages however are gradually shifting towards LPG and electricity, few are leapfrogging to solar-PV and biogas. The major driver for this energy transition is the pursuit of a modern lifestyle associated with ease of daily-life activities. Modern electronic devices have found their way into rural households. Smartphones and laptops have become crucial for higher education—more and more farmers' children attend universities—and predominate leisure activities of the younger generation. This highlights the importance of access to electricity in rural areas.
Traditional gender roles in the Muslim (Ghoragachha) and the Hindu (Baikunthapur) culture affect the shift in cooking energy. The oldest male household member is typically responsible for decision making. Cooking is the obligation of women. Those women interviewed (would) appreciate LPG, because it means no biofuel collection, processing, and storage, shorter cooking time, no indoor-air pollution, and no blackening of the household interior. However, it was not possible to obtain reliable information, as only three women were allowed by their husbands to participate in the interviews with the male researcher (although assisted by a female research assistant)—and only in presence of their husbands.
Rising fossil fuel prices [42] and increasing awareness of the need for environmental conservation are initiating the transition towards RE in the researched villages.
Of the RET proposed, farmers and key informants rated solar-PV systems as most appropriate. According to [62], solar-PV is regarded the most promising RET in India, as grid electrification of rural villages is often not techno-economically viable. It is predicted that the gap between electricity supply and demand will increase in the near future, accelerating the implementation of decentralized PV systems. Land scarcity restricts solar-PV to small units [62], thus favouring smallholder farming households. The authors of [8] reported considerably high acceptance rates for decentralized solar-PV in their representative study: 34% of the 8566 rural households surveyed prefer micro-grids to grid electricity, and 79% expressed great interest in solar lanterns for lighting. In our study, reliability and sufficiency of electricity supply were also found to be crucial drivers for solar-PV. Sufficient electricity supply requires larger systems than the 75 Wp systems already implemented in the researched villages. In this case, a grid-connected 1 kWp solar-PV system with a battery back-up is recommended for an average smallholder farmer to provide sufficient and reliable electricity. Larger PV systems, like the proposed 1.5 kWp, can provide additional power for irrigation pumps, enabling farmers to cope with changing climatic conditions.
Farmers using biodigesters considered the production of organic fertilizer an immense benefit. More efficient utilisation of organic residues and waste would provide a solution to the constraint of insufficient cattle manure for an adequate biogas supply, thereby increasing overall farm efficiency. Biodigestion is vital for biomass recycling (water, carbon, and nutrients) within an agricultural system and a crucial element in the integrated livestock–biogas–vegetable/fruit systems in neighbouring China [63].
This study introduced an innovative integrated food and energy system, in addition to “conventional” RET, combining solar energy with efficient, sub-surface irrigation and effective utilisation of organic residues and waste, in line with the current shift towards organic farming. Almost all farms in the researched villages have home gardens with organic vegetables and fruit for self-consumption. The BDO of Chakdaha, who has an organic garden himself, reported that farmers are aware of the negative effects of pesticides and chemical fertilizers on product quality and soil fertility (personal communication, 27 February 2015). Three farmers interviewed are planning to shift to organic farming with the aim of improving soil fertility, reducing chemical fertilizer and pesticide application (and associated expenditure), achieving higher market prices, and conserving agro-biodiversity. Given the growing demand for organic produce in India and internationally, organic farming provides a lucrative option for smallholder farmers [64]. Recent infrastructure development has increased the marketing radius of agricultural products for the farmers of the two villages. In addition to rural markets, paved roads now enable these farmers to sell their produce on the peri-urban and urban market of Kolkata [23]. The combination of solar-electricity generation and cultivation of organic produce based on local renewable resources represents a promising step towards environmentally sound smallholder food and RE production, independent of fossil fuels.
On the one hand, the Indian government encourages the transition towards sustainable and clean energy through various RE support schemes. On the other hand, it subsidises LPG and diesel and promotes investments in rural grid expansion [6]. Government support is available for RE implementation and financing. The JNNSMP covers about half the investment costs for solar-PV systems, and the NBMMP funds specific materials (pipes, valves, and biogas stoves) and the construction of biodigesters [43,44]. Both programmes are public–private partnerships. Installation is carried out by private, government-accredited RE companies. However, substantial investment from smallholders is still required, often restricting access to these programmes to financially better-off farmers [65]. The solar-PV systems (farmers’ first choice) are much more expensive (€ 507–1180) than a biodigester (€ 127). Solar systems can reduce annual energy expenditure by 84 € (compared to grid electricity), and biodigesters reduce annual expenditure by 53 € (compared to LPG). This results in rapid amortisation of a biodigester (about 2.4 years), but a considerably longer pay-off period for solar-PV systems (9.3 to 11.9 years). Hence, biodigesters would be affordable for a larger numbers of farmers in the short term and could accelerate the transition from LPG to biogas. Those smallholders considering abolishing traditional biofuels may leapfrog directly to biogas. The transition from grid electricity to solar PV is likely to take time, despite the majority of farmers’ interest in this RET and their eagerness to implement solar panels to increase household electricity reliability. The reduction in cost of solar panels predicted by [66] of up to 59% by 2025 would considerably increase their affordability for smallholder farming households and may greatly stimulate solar-PV implementation in the near future.
5. Conclusions
Villages in the research area are experiencing considerable changes with regard to weather conditions, declining soil fertility, and price increases for agricultural inputs and energy, forcing farmers to adapt their agricultural production systems. Additionally, farming households seek a modern lifestyle. The younger generation has access to higher education and utilises modern communication and information tools, while women long for clean cooking fuels. These trends have direct implications for RE, including climate change mitigation, digestate as organic fertilizer, adaptation of organic farming, reduced energy expenditure, and access to modern and clean energy, and thus motivate the farming households in a variety of ways to use and produce RE. Few interviewed farmers already implemented mini solar-PV systems, biodigesters, or both, supported by government initiatives. However, the technologies advocated are not satisfying the farmers’ energy demand: 75 Wp solar-PV systems are small and comparably expensive and the biodigesters do not utilize their full potential, as the farmers were advised by the implementing agency to use cattle manure only.
Notwithstanding, government support is crucial for the implementation of RET in India, as highlighted by the interviewed smallholders and the key-informants in the ranking of RET selection factors. However, development initiatives and policies are centrally planned and trickle through from country to state to district to block level in top-down manner while not sufficiently taking local conditions (e.g., renewable resource availability) and farmers’ perspective into account.
The bottom-up exploration of smallholder livelihoods and available renewable resources on local level could render the design of RE support policies by providing the missing link between: (i) the policy landscape conducive for RE development, recently underpinned by the Intended Nationally Determined Contribution (INDC) submitted to the UNFCCC; (ii) the motivation of smallholder farmers to use and produce RE; and (iii) the already existing decentralized, state-led development agencies (Block Development Offices) to substantially expand RE generation in India, while supporting millions of smallholder farmers in utilising local resources more effectively, protecting the environment and pursuing for a modern lifestyle.
Acknowledgments
We thank Shell Global Solutions International B.V. for the financial support that allowed the field trip (Research Agreement No. PT51346). Special thanks to Sneha Bera, Gulzar Ahamed Khan, Suchisman Sakar, and Bhola Nandi for their valuable support during field research, and to Nicole Gaudet for English proofreading.
Author Contributions
Bastian Winkler, Iris Lewandowski, and Stefanie Lemke conceived and designed the experiments; Bastian Winkler performed the experiments; Bastian Winkler analyzed the data; Bastian Winkler wrote the paper, Iris Lewandowski and Stefanie Lemke provided extensive feedback and revised certain sections of the manuscript. Angelika Voss provided valuable feedback on the design of the study and supported writing with expertise and valuable comments.
Conflicts of Interest
The authors declare no conflict of interest. The founding sponsors had no role in the design of the study; in the collection, analyses, or interpretation of data. Angelika Voss (during the time of the study at Shell Global Solutions International B.V.) commented and supported writing of the manuscript.
Abbreviations
| aAHP | adapted Analytical Hierarchy Process; |
| BCKV | Bidhan Chandra Krishi Vishwavidyalaya; |
| CFL | compact fluorescent lamps; |
| GREP | Geographical renewable energy potential |
| GW | Giga Watt; INR - Indian Rupee |
| IREPA | Integrated Renewable Energy Potential Assessment |
| JNNSMP | Jawaharlal Nehru National Solar Mission Programme |
| LPG | Liquefied Petroleum Gas |
| MCDA | Multi-criteria decision analysis |
| MWh | Mega Watt hours |
| NBMMP | National Biogas and Manure Management Programme |
| NPP | Net primary productivity |
| O&M | Operation & maintenance |
| PJ | Peta Joule |
| PV | Photovoltaic |
| PTP | Partnership |
| RE | Renewable energy |
| REP | Renewable energy potential |
| RET | Renewable energy technology |
| RR | Renewable resource |
| SMART | Simple Multi-Attribute Rating Technique |
| ThREP | Theoretical renewable energy potential |
| TREP | Technical renewable energy potential |
| RPR | Residue: Product Ratio |
| WBREDA | West Bengal Renewable Energy Development Agency |
| Wp | Watt peak |
References
- International Energy Agency (IEA). Energy Matters: How COP21 Can Shift the Energy Sector onto a Low-Carbon Path That Supports Economic Growth and Energy Access. Available online: https://www.iea.org/media/presentations/Energy_Matters_brochure.PDF (accessed on 18 January 2016).
- De Vries, B.J.M.; van Vuuren, D.P.; Hoogwijk, M.M. Renewable energy sources: Their global potential for the first-half of the 21st century at a global level: An integrated approach. Energy Policy 2007, 35, 2590–2610. [Google Scholar] [CrossRef]
- International Assessment of Agricultural Knowledge, Science, and Technology for Development (Project). Synthesis Report: A Synthesis of the Global and Sub-Global IAASTD Reports; Agriculture at a Crossroads; McIntyre, B.D., Ed.; Island Press: Washington, DC, USA, 2009; ISBN 978-1-59726-550-8. [Google Scholar]
- Kaygusuz, K. Energy for sustainable development: A case of developing countries. Renew. Sustain. Energy Rev. 2012, 16, 1116–1126. [Google Scholar] [CrossRef]
- Dev, S.M. Small Farmers in India: Challenges and Opportunities; Indira Gandhi Institute of Development Research (IGIDR): Mumbai, India, 2012. [Google Scholar]
- International Energy Agency (IEA). India Energy Outlook: World Energy Outlook Special Report; Organisation for Economic Co-Operation (OECD): Paris, France, 2015. [Google Scholar]
- Kumar, A.; Kumar, K.; Kaushik, N.; Sharma, S.; Mishra, S. Renewable energy in India: Current status and future potentials. Renew. Sustain. Energy Rev. 2010, 14, 2434–2442. [Google Scholar] [CrossRef]
- Jain, A.; Ray, S.; Ganesan, K.; Aklin, M.; Cheng, C.-Y.; Urpelainen, J. Access to Clean Cooking Energy and Electricity: Survey of States; Council on Energy, Environment and Water: New Dehli, India, 2015; p. 98. [Google Scholar]
- Resch, G.; Held, A.; Faber, T.; Panzer, C.; Toro, F.; Haas, R. Potentials and prospects for renewable energies at global scale. Energy Policy 2008, 36, 4048–4056. [Google Scholar] [CrossRef]
- United Nations Framework Convention on Climate Change (UNFCCC). India’s Intended Nationally Determined Contribution: Working towards Climate Justice; UNFCCC: New York, NY, USA, 2015. [Google Scholar]
- Hailu, Y.G. Measuring and monitoring energy access: Decision-support tools for policymakers in Africa. Energy Policy 2012, 47, 56–63. [Google Scholar] [CrossRef]
- Wang, J.-J.; Jing, Y.-Y.; Zhang, C.-F.; Zhao, J.-H. Review on multi-criteria decision analysis aid in sustainable energy decision-making. Renew. Sustain. Energy Rev. 2009, 13, 2263–2278. [Google Scholar] [CrossRef]
- Schäfer, M.; Kebir, N.; Neumann, K. Research needs for meeting the challenge of decentralized energy supply in developing countries. Energy Sustain. Dev. 2011, 15, 324–329. [Google Scholar] [CrossRef]
- Amigun, B.; Musango, J.K.; Brent, A.C. Community perspectives on the introduction of biodiesel production in the Eastern Cape Province of South Africa. Energy 2011, 36, 2502–2508. [Google Scholar] [CrossRef]
- Barry, M.-L.; Steyn, H.; Brent, A. Selection of renewable energy technologies for Africa: Eight case studies in Rwanda, Tanzania and Malawi. Renew. Energy 2011, 36, 2845–2852. [Google Scholar] [CrossRef]
- Alam Hossain Mondal, M.; Kamp, L.M.; Pachova, N.I. Drivers, barriers, and strategies for implementation of renewable energy technologies in rural areas in Bangladesh—An innovation system analysis. Energy Policy 2010, 38, 4626–4634. [Google Scholar] [CrossRef]
- Palit, D.; Chaurey, A. Off-grid rural electrification experiences from South Asia: Status and best practices. Energy Sustain. Dev. 2011, 15, 266–276. [Google Scholar] [CrossRef]
- García, V.G.; Bartolomé, M.M. Rural electrification systems based on renewable energy: The social dimensions of an innovative technology. Technol. Soc. 2010, 32, 303–311. [Google Scholar] [CrossRef]
- Frederiks, E.R.; Stenner, K.; Hobman, E.V. Household energy use: Applying behavioural economics to understand consumer decision-making and behaviour. Renew. Sustain. Energy Rev. 2015, 41, 1385–1394. [Google Scholar] [CrossRef]
- Winkler, B.; Lemke, S.; Ritter, J.; Lewandowski, I. Integrated assessment of renewable energy potential: Approach and application in rural South Africa. Environ. Innov. Soc. Transit. 2017, 24, 17–31. [Google Scholar] [CrossRef]
- Rajarhat PRASARI. Livelihood Zones in West Bengal—A Scenario for AWM Interventions; Prepared by Rajarhat PRASARI; In Consultation with the Food and Agriculture Organization of the United Nations; Rajarhat PRASARI: Kolkata, India, 2011. [Google Scholar]
- Nabcons. State Agriculture Plan for West Bengal; NABARD Consultancy Services PVT Ltd. on Behalf of Agriculture Department, Government of West Bengal: Kolkata, India, 2009.
- Bhattacharyya, R. Crop diversification: A search for an alternative income of the farmers in the State of West Bengal in India. In Proceedings of the International Conference on Applied Economics, Kastoria, Greece, 15–17 May 2008; pp. 83–94. [Google Scholar]
- West Bengal AgriMarketing Board. Rainfall by District and Month in West Bengal (10yrs. average). Available online: http://www.wbagrimarketingboard.gov.in/Area/Rain.html (accessed on 25 January 2015).
- Directorate of Micro, Small and Medium Enterprises. Chakdaha Block; Government of West Bengal: West Bengal, India, 2015.
- Directorate of Micro, Small and Medium Enterprises. Amdanga Block; Government of West Bengal: West Bengal, India, 2015.
- Hoogwijk, M. On the Global and Regional Potential of Renewable Energy Sources; Faculteit Scheikunde, Universiteit Utrecht: Utrecht, The Netherlands, 2004. [Google Scholar]
- NASA. Surface Meteorology and Solar Energy. Available online: https://eosweb.larc.nasa.gov/sse/RETScreen/ (accessed on 22 January 2015).
- National Institute of Wind Energy. Numerical Wind Atlas File (.lib) for Sale—West Bengal. Available online: http://niwe.res.in/department_wra_nwa.php (accessed on 6 February 2015).
- Parua, P.K. The Ganga: Water Use in the Indian Subcontinent; Water Science and Technology Library; Springer: Dordrecht, The Netherlands; New York, NY, USA, 2010; ISBN 978-90-481-3102-0. [Google Scholar]
- NASA. Earth Observations NASA Earth Observations (NEO). Available online: http://neo.sci.gsfc.nasa.gov/view.php?datasetId=MOD17A2_M_PSN (accessed on 22 January 2015).
- Chandrasekharam, D.; Chandrasekha, V. Geothermal energy resources of India: Country update. In Proceedings of the World Geothermal Congress, Melbourne, Australia, 19–25 April 2015; International Geothermal Association: Bochum, Germany, 2015. [Google Scholar]
- Chambers, R. The Origins and Practice of Participatory Rural Appraisal. World Dev. 1994, 22, 953–969. [Google Scholar] [CrossRef]
- Scoones, I. Sustainable Rural Livelihoods: A Framework for Analysis; IDS Working Paper; Institute of Development Studies: Brighton, UK, 1998; ISBN 978-1-85864-224-6. [Google Scholar]
- Creswell, J.W. Research Design: Qualitative, Quantitative, and Mixed Methods Approache, 3rd ed.; Sage Publications: Thousand Oaks, CA, USA, 2009; ISBN 978-1-4129-6556-9. [Google Scholar]
- Food and Agriculture Organization of the United Nations (FAO). FAOSTAT. Available online: http://www.fao.org/faostat/en/#data (accessed on 22 January 2015).
- Saaty, T.L. How to make a decision: The analytic hierarchy process. Eur. J. Oper. Res. 1990, 48, 9–26. [Google Scholar] [CrossRef]
- Chen, Y.; Okudan, G.E.; Riley, D.R. Decision support for construction method selection in concrete buildings: Prefabrication adoption and optimization. Autom. Constr. 2010, 19, 665–675. [Google Scholar] [CrossRef]
- Brugha, C.M. Structuring and Weighting Criteria in Multi Criteria Decision Making (MCDM). In Trends in Multicriteria Decision Making; Stewart, T.J., van den Honert, R.C., Eds.; Springer: Berlin/Heidelberg, Germany, 1998; Volume 465, pp. 229–242. ISBN 978-3-540-64741-6. [Google Scholar]
- Subash, N.; Sikka, A.K. Trend analysis of rainfall and temperature and its relationship over India. Theor. Appl. Climatol. 2014, 117, 449–462. [Google Scholar] [CrossRef]
- Rogers, E.M. Diffusion of Innovations, 3rd ed.; Free Press, Collier Macmillan: New York, NY, USA; London, UK, 1983; ISBN 978-0-02-926650-2. [Google Scholar]
- Ministry of Statistics and Project Implementation. Energy Statistics 2015. Available online: http://mospi.nic.in/Mospi_New/upload/Energy_stats_2015_26mar15.pdf (accessed on 7 March 2016).
- Ministry of New and Renewable Energy; Biogas Technology Development Division. National Biogas and Manure Management Programme (NBMMP). Available online: http://www.mnre.gov.in/schemes/decentralized-systems/schems-2/ (accessed on 23 January 2015).
- Ministry of New and Renewable Energy. Jawaharlal Nehru National Solar Mission. Available online: http://www.mnre.gov.in/solar-mission/jnnsm/introduction-2/ (accessed on 23 January 2015).
- The Energy and Resources Institute (TERI). Fixed-Dome Biogas Plant for Rural Households. Available online: http://www.teriin.org/technology/fxed-dome (accessed on 26 January 2016).
- Sankalpa Trust. Sankalpa White Paper: Renewable Energy Technology Center; Sankalpa Trust: Kolkata, India, 2009. [Google Scholar]
- Rajendran, K.; Aslanzadeh, S.; Taherzadeh, M.J. Household Biogas Digesters—A Review. Energies 2012, 5, 2911–2942. [Google Scholar] [CrossRef]
- Current Results. Weather in India—Sunshine Hours. Available online: http://www.currentresults.com/Weather/India/annual-sunshine.php (accessed on 17 February 2016).
- Surana Solar Ltd. PV-Panel-Datasheet/Polycrystalline. Available online: http://www.enfsolar.com/pv/panel-datasheet/Polycrystalline/17127?utm_source=ENF&utm_medium=panel_profile&utm_campaign=enquiry_company_directory&utm_content=5666 (accessed on 26 January 2016).
- Jölli, D.; Giljum, S. Unused Biomass Extraction in Agriculture, Forestry and Fishery; Sustainable Europe Research Institute (SERI): Vienna, Austria, 2005. [Google Scholar]
- Hiloidhari, M.; Das, D.; Baruah, D.C. Bioenergy potential from crop residue biomass in India. Renew. Sustain. Energy Rev. 2014, 32, 504–512. [Google Scholar] [CrossRef]
- Babaee, A.; Shayegan, J. Effect of organic loading rates (OLR) on production of methane from anaerobic digestion of vegetables waste. In Proceedings of the World Renewable Energy Congress, Linköping, Sweden, 8–13 May 2011; pp. 411–417. [Google Scholar]
- Chen, W.-C.; Chen, W.-C.; Geng, D.-S. The Strategy and Bioenergy Potential for Kitchen Waste Recycling in Taiwan. J. Environ. Eng. Manag. 2008, 18, 281–287. [Google Scholar]
- Dhanalakshmi, S.; Srinivasan, S.V.; Kayalvizhi, R.; Bhuvaneswari, R. Studies on Conversion of Carbohydrate content in the Mixture of Vegetable Wastes into Biogas in a Single Stage Anaerobic Reactor. Res. J. Chem. Sci. 2012, 2, 66–71. [Google Scholar]
- Patil, V.S.; Deshmukh, H.V. Biomethanation Potential Study of Individual and Combined Vegetable Market Wastes. Int. Res. J. Environ. Sci. 2015, 4, 75–80. [Google Scholar]
- Capacity Development for the Clean Development Mechanism (CD4CDM). Mini-Biogas Plants for Households; Working Paper Series: Working Paper No. 8—PoA CDM Manual; Capacity Development for the Clean Development Mechanism (CD4CDM): Roskilde, Denmark, 2009. [Google Scholar]
- Pourmovahed, A.; Opperman, T.; Lemke, B. Performance and efficiency of a biogas CHP system utilizing a stirling engine. Renew. Energy Power Qual. J. 2011, 202–207. [Google Scholar] [CrossRef]
- Gogoi, J.K.; Goswami, H.; Borah, K.C. Problems of International Border Areas in Manipur: Implications for the Thirteenth Finance Commission. SSRN Electron. J. 2009. [Google Scholar] [CrossRef]
- AFPRO. Deenbandhu Model 2000 Biogas Plant. Available online: http://www.sswm.info/sites/default/files/reference_attachments/AFPRO%202005%20Deenbandhu%20Model%202000%20Biogas%20Plant.pdf (accessed on 10 March 2016).
- Luthra, S.; Kumar, S.; Garg, D.; Haleem, A. Barriers to renewable/sustainable energy technologies adoption: Indian perspective. Renew. Sustain. Energy Rev. 2015, 41, 762–776. [Google Scholar] [CrossRef]
- Khandker, S.R.; Barnes, D.F.; Samad, H.A. Are the energy poor also income poor? Evidence from India. Energy Policy 2012, 47, 1–12. [Google Scholar] [CrossRef]
- Arora, P.R. World’s Highest Off-grid Solar PV Potential in India—Search and Penetrate. Int. J. Sci. Res. Publ. 2013, 3, 1–7. [Google Scholar]
- Jiang, X.; Sommer, S.G.; Christensen, K.V. A review of the biogas industry in China. Energy Policy 2011, 39, 6073–6081. [Google Scholar] [CrossRef]
- Roychowdhury, R.; Abdel Gawwad, M.R.; Banerjee, U.; Bishnu, S.; Tah, J. Status, Trends and Prospects of Organic Farming in India: A Review. J. Plant Biol. Res. 2013, 2, 38–48. [Google Scholar]
- Raha, D.; Mahanta, P.; Clarke, M.L. The implementation of decentralised biogas plants in Assam, NE India: The impact and effectiveness of the National Biogas and Manure Management Programme. Energy Policy 2014, 68, 80–91. [Google Scholar] [CrossRef]
- International Renewable Energy Agency (IRENA). The Power to Change: Solar and Wind Cost Reduction Potential to 2025; IRENAs Innovation and Technology Centre (IITC): Bonn, Germany, 2016; p. 112. [Google Scholar]
Figure 1.
Results from the Household and Community Assessment structured according to the Sustainable Livelihoods Framework (adapted from [34]).
Figure 1.
Results from the Household and Community Assessment structured according to the Sustainable Livelihoods Framework (adapted from [34]).

Figure 2.
Farmers’ observations about changes in weather and local climate by farmers (n = 29).

Figure 3.
Classification of farms according to land size including number of farms willing to use farmland for RET and number of farms using RET already (n = 28).
Figure 3.
Classification of farms according to land size including number of farms willing to use farmland for RET and number of farms using RET already (n = 28).

Figure 4.
Farmers’ responses on potential livelihood benefits from RET (n = 27).

Figure 5.
Farmers’ opinion on how and by whom RE should be produced.

Figure 6.
Ongoing substitution of energy sources in farming households (n = 27).

Figure 7.
Current utilization of agricultural residues and wastes (n = 29).

Figure 8.
(a) Terrabioponic food and solar-energy demonstration system at a farmer’s household in Ghoragachha immediately after construction and (b) seven weeks after planting cucumber, tomato, brinjal, and beetlewine (right) (further information www.geco-gardens.de).
Figure 8.
(a) Terrabioponic food and solar-energy demonstration system at a farmer’s household in Ghoragachha immediately after construction and (b) seven weeks after planting cucumber, tomato, brinjal, and beetlewine (right) (further information www.geco-gardens.de).


Table 1.
Data sources for renewable resource assessment at Ghoragachha and Baikunthapur.
| Renewable Resource | Data Sources |
|---|---|
| Solar | [28] |
| Wind | [28,29] |
| Hydro | [30] |
| Biomass | [31], Own analysis, see Section 3.2.5 |
| Geothermal | [32] |
Table 2.
Overview of participatory research methods applied in Integrated Renewable Energy Potential Assessment (IREPA) step 3.
Table 2.
Overview of participatory research methods applied in Integrated Renewable Energy Potential Assessment (IREPA) step 3.
| PLA Method | Number of Respondents | Description |
|---|---|---|
| Transect walk at Ghoragachha and Baikunthapur | Exploration of village structure; drawing of village map; informal interviews | |
| Participant observation | Sowing, harvest, irrigation, fertilizer and pesticide application, rice processing, cooking (with traditional biofuels, LPG, biogas), dung-cake making | |
| Open-ended, semi-structured household interviews | n = 29 | Ghoragachha n = 21 (18 male, 3 female); Baikunthapur n = 8 (all male) |
| Visits of households using solar-PV and/or biodigesters | n = 10 | Ghoragachha and Baikunthapur |
| Key-informant interviews | n = 8 | Head of the Dept. Agricultural Extension, BCKV Professor at the Dept. Agricultural Extension, BCKV Director of Lake Hall Campus, BCKV Block Development Officer (BDO), Chakdaha Block Agricultural Development Officer (ADO), Chakadaha Block Two Ph.D. students, Dept. Agricultural Extension, BCKV M.Sc. Student, Dept. Agricultural Extension, BCKV |
| Participatory construction of an Integrated Food and Energy System for demonstration | At a smallholder farming household, Ghoragachha (See Section 3.3.3) | |
| Focus-group | n = 8 | Introduction of RET selection factors and pre-selected RETApplication of AHP and SMART with seven previously interviewed farmers from Ghoragachhafive key informants (BDO, ADO, two Ph.D. students, M.Sc. student) |
| Review of secondary sources | [8,17,18,19,20,21,22,32,33,34] |
RET, Renewable Energy Technologies, AHP, Analytical Hierarchy Process; SMART, Simple Multi-Attribute Rating Technique.
Table 3.
Energy sources used for cooking in the farming households (n = 29).
| Energy Source Used for Cooking | Percentrage of Farming Households |
|---|---|
| Traditional biomass and LPG | 52 |
| Traditional biomass and kerosene | 10 |
| Traditional biomass only | 24 |
| LPG only | 3 |
| Biogas and traditional biomass | 3 |
| Biogas and LPG | 7 |
Table 4.
Monthly household energy demand and expenditure for electricity, LPG, and traditional biofuels.
Table 4.
Monthly household energy demand and expenditure for electricity, LPG, and traditional biofuels.
| Household Demand | Household Expenditures | |||
|---|---|---|---|---|
| Ø | Ø | min | max | |
| Electricity | [kWh month−1] | [INR month−1] | ||
| 101 | 495 | 83 | 2500 | |
| LPG | [kg month−1] | [INR month−1] | ||
| 10.6 | 314 * | 83 * | 420 * | |
| Traditional biofuels | 366 | 1281 ** | 140 ** | 3202 ** |
Ø-household size: 5.0 members (both villages); Ø-household income: 9589 INR month−1 (min: 4000–max: 36,000); * 1 LPG cylinder (14.2 kg): 420 INR incl. delivery; ** If purchased: 2–5 INR kg−1 (1 € = 70.66 INR; February 2015).
Table 5.
Renewable resource availability (as average power density) and theoretical (ThREP), geographical (GREP), and technical (TREP) renewable energy potential for Ghoragachha and Baikunthapur.
Table 5.
Renewable resource availability (as average power density) and theoretical (ThREP), geographical (GREP), and technical (TREP) renewable energy potential for Ghoragachha and Baikunthapur.
| Solar | Wind | Hydro | Geothermal | Biomass | ||||||
|---|---|---|---|---|---|---|---|---|---|---|
| ᴓ power density | (W m−2) | (W m−2) | (MW) | (W m−2) | (W m−2 a−1) | |||||
| 199.70 | 4.98 | 391.70 | 0.20 | 0.43 | ||||||
| Min/Max | 170–257 | 1.3–11.7 | n.a. | n.a. | 0.41–0.45 | |||||
| (PJ a−1) | (PJ a−1) | (PJ a−1) | (PJ a−1) | (PJ a−1) | ||||||
| Gh. | Ba. | Gh. | Ba. | Gh. | Ba. | Gh. | Ba. | Gh. | Ba. | |
| ThREP | 17.315 | 4.299 | 0.011 * | 12.353 | 0.778 ** | 0.156 # | 0.039 # | |||
| GREP | 17.162 | 4.280 | <threshold | not accessible | not accessible | 0.004 ## | 0.008 ## | |||
| TREP | 0.015 | 0.003 | <threshold | not accessible | not accessible | 0.003 ## | 0.005 ## | |||
| Source | [28] | [28,29] | [30] | [32] | # [31]; ## This study | |||||
Table 6.
Overview of suitable biomass resources available for biogas production, total biogas volume, and corresponding geographical and technical bioenergy potential at Ghoragachha and Baikunthapur.
Table 6.
Overview of suitable biomass resources available for biogas production, total biogas volume, and corresponding geographical and technical bioenergy potential at Ghoragachha and Baikunthapur.
| Feedstock | Average Crop Yield | RPR * | Biogas Yield ** | |
|---|---|---|---|---|
| Ghoragachha | Baikunthapur | |||
| (t ha−1) | (x: 1) | (m3 farm−1 a−1) | (m3 farm−1 a−1) | |
| Rice straw (Kharif) | 4.7 | 1.5 | 595 | 428 |
| Vegetable residues (Rabi) | 26.5 | 0.5 | 591 | 662 |
| Vegetable residues (Zaid) | 7.2 | 0.5 | 138 | 154 |
| Amount available | ||||
| Ghoragachha | Baikunthapur | |||
| kg farm−1 a−1 | kg farm−1 a−1 | (m3 farm−1 a−1) | (m3 farm−1 a−1) | |
| Organic waste ^ | 449 | 70 | 29 | 5 |
| Human excreta # | 456 | 531 | 30 | 35 |
| Animal manure ## | 2034 | 9636 | 48 | 226 |
| Total biogas volume (m³ farm−1 a−1) | 1431 | 1510 | ||
| Geographic bioenergy potentialLHV (PJ village−1 a−1) | 0.004 | 0.008 | ||
| Technical bioenergy potentialTh. Eff. (PJ village−1 a−1) | 0.003 | 0.005 | ||
* RPR = Residue–Product Ratio (x: 1) based on [50] (for vegetables) and [51] (for rice); ** based on averaged biogas yields for vegetable mixtures from [52,53,54,55]; ^ Excluding organic wastes used as animal feed; # Amount of human excreta and biogas yield estimated based on [56]; ## Refers to farms with animals (Ghoragachha: 71%; Baikunthapur 88%), biogas yield based on [56]; LHV = Lower heating value of biogas: 21 MJ m−3 [57]; Th. Eff. = Thermal efficiency of biogas stoves 63.5% [47].
Table 7.
Proposed solar-PV systems with technology parts and investment costs adapted to household and agricultural electricity demand: low: 1.8 kWh day−1; average: 3.5 kWh day−1; high: 5.1 kWh day−1.
Table 7.
Proposed solar-PV systems with technology parts and investment costs adapted to household and agricultural electricity demand: low: 1.8 kWh day−1; average: 3.5 kWh day−1; high: 5.1 kWh day−1.
| Electricity Demand | low | Ø | high |
|---|---|---|---|
| PV system capacity | 500 Wp | 1000 Wp | 1500 Wp |
| Panel area [m2] | 4 | 8 | 12 |
| Solar PV system parts | Costs [INR] | Costs [INR] | Costs [INR] |
| Panels | 28,494 | 57,000 | 85,500 |
| Battery | 20,700 | 37,862 | 52,818 |
| Inverter | 4395 | 5637 | 6667 |
| Charge Controller | 2500 | 2500 | 2500 |
| Roof installation structure, cables, etc. | 7000 | 9000 | 10,000 |
| Installation | 8000 | 8000 | 8000 |
| Total investment costs [INR] | 71,089 | 119,999 | 165,485 |
| JNNSMP subsidy: 30% of total costs [INR] | 21,327 | 36,000 | 49,646 |
| Tax savings—accelerated depreciation [INR] | 13,933 | 23,520 | 32,435 |
| Net investment costs [INR] | 35,829 | 60,479 | 83,404 |
| 507 € | 856 € | 1180 € | |
| Monthly savings [INR] | 250 | 500 | 750 |
| Financial amortisation [years] | 11.9 | 10.1 | 9.3 |
Sources of technology parts and costs: Solar panels: https://www.bijlibachao.com/solar/solar-panel-cell-cost-price-list-in-india.html; Battery: http://www.snapdeal.com/product/exide-inverter-plus-100ah-battery/954943293; Inverter: http://www.snapdeal.com/product/microtek-upseb-1500-va-inverter/669312; Charge controller: http://www.snapdeal.com/product/inductionpowers-ipscc12v40a-solar; panels/799104181; Roof installation structure: http://www.solarmango.com/in/faq/2; Cables: Electronic shop at Kalyani (nearest bigger city); (Exchange rate €—INR, February 2015: 1 € = 70.66 INR).
Table 8.
RET selection criteria ranked by farmers (n = 7) based on the Analytical Hierarchy Process with criteria clusters (adapted from [37]) (STD = standard deviation).
Table 8.
RET selection criteria ranked by farmers (n = 7) based on the Analytical Hierarchy Process with criteria clusters (adapted from [37]) (STD = standard deviation).
| Rank | Selection Criteria | Averaged Rating | STD |
|---|---|---|---|
| 1 | Ease of daily activities | 0.1669 | 0.1817 |
| 2 | Government support | 0.1531 | 0.0944 |
| 3 | Land/area requirements | 0.1504 | 0.1282 |
| 4 | Environmental conservation | 0.1358 | 0.1052 |
| 5 | Investment costs | 0.1250 | 0.2217 |
| 6 | Reduced expenditures on energy | 0.1107 | 0.0856 |
| 7 | Energy security and realibility | 0.0959 | 0.1200 |
| 8 | Education and development of new skills | 0.0563 | 0.0532 |
Table 9.
RE systems ranked by farmers (n = 6) based on the Analytical Hierarchy Process with criteria clusters (adapted from [37]) (STD = standard deviation).
Table 9.
RE systems ranked by farmers (n = 6) based on the Analytical Hierarchy Process with criteria clusters (adapted from [37]) (STD = standard deviation).
| Rank | RE Systems | Averaged Rating | STD |
|---|---|---|---|
| 1 | Solar-PV home system | 0.2934 | 0.0726 |
| 2 | Solar-PV irrigation system | 0.2926 | 0.1266 |
| 3 | Integrated food and energy system | 0.2404 | 0.0887 |
| 4 | Biodigester | 0.1953 | 0.1422 |
Table 10.
RET selection criteria ranked by key informants (n = 5) based on the Simple Multi-Attribute Rating Technique (adapted from [38]) (STD = standard deviation).
Table 10.
RET selection criteria ranked by key informants (n = 5) based on the Simple Multi-Attribute Rating Technique (adapted from [38]) (STD = standard deviation).
| Rank | Selection Criteria | Averaged Rating | STD |
|---|---|---|---|
| 1 | Investment costs | 0.1649 | 0.0343 |
| 2 | Government support | 0.1586 | 0.0262 |
| 3 | Reduced expenditures on energy | 0.1242 | 0.0234 |
| 4 | Land/area requirements | 0.1225 | 0.0343 |
| 5 | Energy security and realibility | 0.1132 | 0.0186 |
| 6 | Ease of daily activities | 0.1124 | 0.0130 |
| 7 | Education and development of new skills | 0.1048 | 0.0207 |
| 8 | Environmental conservation | 0.0994 | 0.0156 |
Table 11.
RE systems ranked by key informants (n = 5) based on the Simple Multi-Attribute Rating Technique (adapted from [38]) (STD = standard deviation).
Table 11.
RE systems ranked by key informants (n = 5) based on the Simple Multi-Attribute Rating Technique (adapted from [38]) (STD = standard deviation).
| Rank | RE Systems | Averaged Rating | STD |
|---|---|---|---|
| 1 | Solar-PV home system | 0.7890 | 0.1014 |
| 2 | Integrated food and energy system | 0.7807 | 0.0611 |
| 3 | Biodigester | 0.7712 | 0.0780 |
| 4 | Solar-PV irrigation system | 0.7133 | 0.1518 |
© 2018 by the authors. Licensee MDPI, Basel, Switzerland. This article is an open access article distributed under the terms and conditions of the Creative Commons Attribution (CC BY) license (http://creativecommons.org/licenses/by/4.0/).
Share and Cite
MDPI and ACS Style
Winkler, B.; Lewandowski, I.; Voss, A.; Lemke, S. Transition towards Renewable Energy Production? Potential in Smallholder Agricultural Systems in West Bengal, India. Sustainability 2018, 10, 801. https://doi.org/10.3390/su10030801
AMA Style
Winkler B, Lewandowski I, Voss A, Lemke S. Transition towards Renewable Energy Production? Potential in Smallholder Agricultural Systems in West Bengal, India. Sustainability. 2018; 10(3):801. https://doi.org/10.3390/su10030801
Chicago/Turabian StyleWinkler, Bastian, Iris Lewandowski, Angelika Voss, and Stefanie Lemke. 2018. "Transition towards Renewable Energy Production? Potential in Smallholder Agricultural Systems in West Bengal, India" Sustainability 10, no. 3: 801. https://doi.org/10.3390/su10030801
Note that from the first issue of 2016, this journal uses article numbers instead of page numbers. See further details here.