Article

Predicting Wetland Distribution Changes under Climate Change and Human Activities in a Mid- and High-Latitude Region

1
School of Geographical Sciences, Northeast Normal University, Changchun 130024, China
2
Northeast Institute of Geography and Agroecology, Chinese Academy of Sciences, Changchun 130102, China
3
School of Natural Resources, University of Missouri, Columbia, MO 65211, USA
*
Author to whom correspondence should be addressed.
Sustainability 2018, 10(3), 863; https://doi.org/10.3390/su10030863
Submission received: 30 December 2017 / Revised: 26 February 2018 / Accepted: 10 March 2018 / Published: 19 March 2018
(This article belongs to the Section Environmental Sustainability and Applications)

Abstract

:
Wetlands in the mid- and high-latitudes are particularly vulnerable to environmental changes and have declined dramatically in recent decades. Climate change and human activities are arguably the most important factors driving wetland distribution changes which will have important implications for wetland ecological functions and services. We analyzed the importance of driving variables for wetland distribution and investigated the relative importance of climatic factors and human activity factors in driving historical wetland distribution changes. We predicted wetland distribution changes under climate change and human activities over the 21st century using the Random Forest model in a mid- and high-latitude region of Northeast China. Climate change scenarios included three Representative Concentration Pathways (RCPs) based on five general circulation models (GCMs) downloaded from the Coupled Model Intercomparison Project, Phase 5 (CMIP5). The three scenarios (RCP 2.6, RCP 4.5, and RCP 8.5) predicted radiative forcing to peak at 2.6, 4.5, and 8.5 W/m2 by the 2100s, respectively. Our results showed that the variables with high importance scores were agricultural population proportion, warmness index, distance to water body, coldness index, and annual mean precipitation; climatic variables were given higher importance scores than human activity variables on average. Average predicted wetland area among three emission scenarios were 340,000 ha, 123,000 ha, and 113,000 ha for the 2040s, 2070s, and 2100s, respectively. Average change percent in predicted wetland area among three periods was greatest under the RCP 8.5 emission scenario followed by RCP 4.5 and RCP 2.6 emission scenarios, which were 78%, 64%, and 55%, respectively. Losses in predicted wetland distribution were generally around agricultural lands and expanded continually from the north to the whole region over time, while the gains were mostly associated with grasslands and water in the most southern region. In conclusion, climatic factors had larger effects than human activity factors on historical wetland distribution changes and wetland distributions were predicted to decline remarkably over time under climate change scenarios. Our findings have important implications for wetland resource management and restoration because predictions of future wetland changes are needed for wetlands management planning.

1. Introduction

Wetlands in the mid- and high-latitudes account for approximately 64% of the world’s natural wetlands [1], which provide ecological functions and services (e.g., biodiversity, carbon sink and storage, water conservation, hydrological adjustment, climatic regulation, and wildlife habitats) [2,3]. These wetlands are particularly vulnerable to environmental changes [4]. Recent studies showed that extensive wetlands disappeared in the mid- and high-latitudes during the last century and this trend is predicted to continue throughout the 21st century [5]. Climate change and human activities are arguably the most important factors driving wetland changes [6]. Climate change affects wetland distribution through directly altering the hydrological process [7] and indirectly changing soil temperature, biogeochemical cycles, and vegetation dynamics [8,9]. Human activities such as urbanization [10,11], agricultural reclamation [12], establishing the reservoirs [13], aquaculture [14], and overgrazing [15] can lead to immediate wetland area changes. Climate change and human activities will have potential negative consequences for wetland distribution.
Previous studies have analyzed changes in wetland distribution under climate change scenarios derived from the Special Report of Emissions Scenarios (SRES) [16,17]. Antoine, et al. [18] pointed out that climate change reduced wetland areas by 5.3–13.6% over two periods 1961–2000 and 2081–2100 in Northwest France by using climate change scenarios derived from 14 GCMs for the A1B greenhouse gas (GHG). Nicholls [19] concluded that the coastal wetlands would be lost with 5–20% losses by the 2080s in the A1F1 world downscaled from the HadCM3 model. However, previous climate warming scenarios (e.g., SRES [18,19,20]), did not include socioeconomic drivers [21], whereas the RCPs were able to account for the effects of various combinations of economies, technology developments, and demographics [17,22,23]. Additionally, the IPCC 5th Assessment Report pointed out that the simulations of climate change from RCP scenarios would lead to precipitation changes and ice as well as snow melting and the geographic distribution of land and water would be altered to adapt to climate change [24,25,26]. Thus, the RCP scenarios were needed to predict future effects of climate change on wetland distribution.
Many models were developed to investigate the future wetland distribution changes in the mid- and high-latitudes under climate change and human activities, such as the zero-inflation model [27], maximum entropy model [28,29], logistic regression model [30], wetland landscape model [31], and cellar automata-Markov model [32,33]. Predictions using the maximum entropy model suggested that wetlands would decrease greatly over the 21st century in a mid- and high-latitude region of Northeast China [28]. Predictions using the logistic regression model suggested that mean patch area, shape, and aggregation of the marsh landscape decreased with climate warming in a mid- and high-latitude region of Northeast China over the 21st century [34]. Predictions using the cellar automata-Markov model suggested that the wetland under the effect of human activities had a significant amount of loss in a mid- and high-latitude region of Turkey in 2023 [33]. However, most studies of wetland distribution changes emphasized either climate change or human activities alone [35] and rarely considered both. Therefore, the future wetland changes in the mid- and high-latitudes and the combined effects of climate change and human activities on these changes remained uncertain.
In our study, we used the Random Forest model [36] to analyze the relative importance of driving variables and predict the temporal and spatial changes in wetland distribution under climate change and human activities over the 21st century in a mid- and high-latitude region of Northeast China. We used the historical wetland distribution and driving factors including climate, hydrology, topography, and human activities to build the model and predict the wetland distribution changes at a spatial resolution of 200 m. Our research questions included the following: (1) what is the relative importance of climate change and human activities in driving historical wetland distribution changes? (2) how will wetland distribution change, driven by the combined effects of climate change and human activities over the 21st century?

2. Materials and Methods
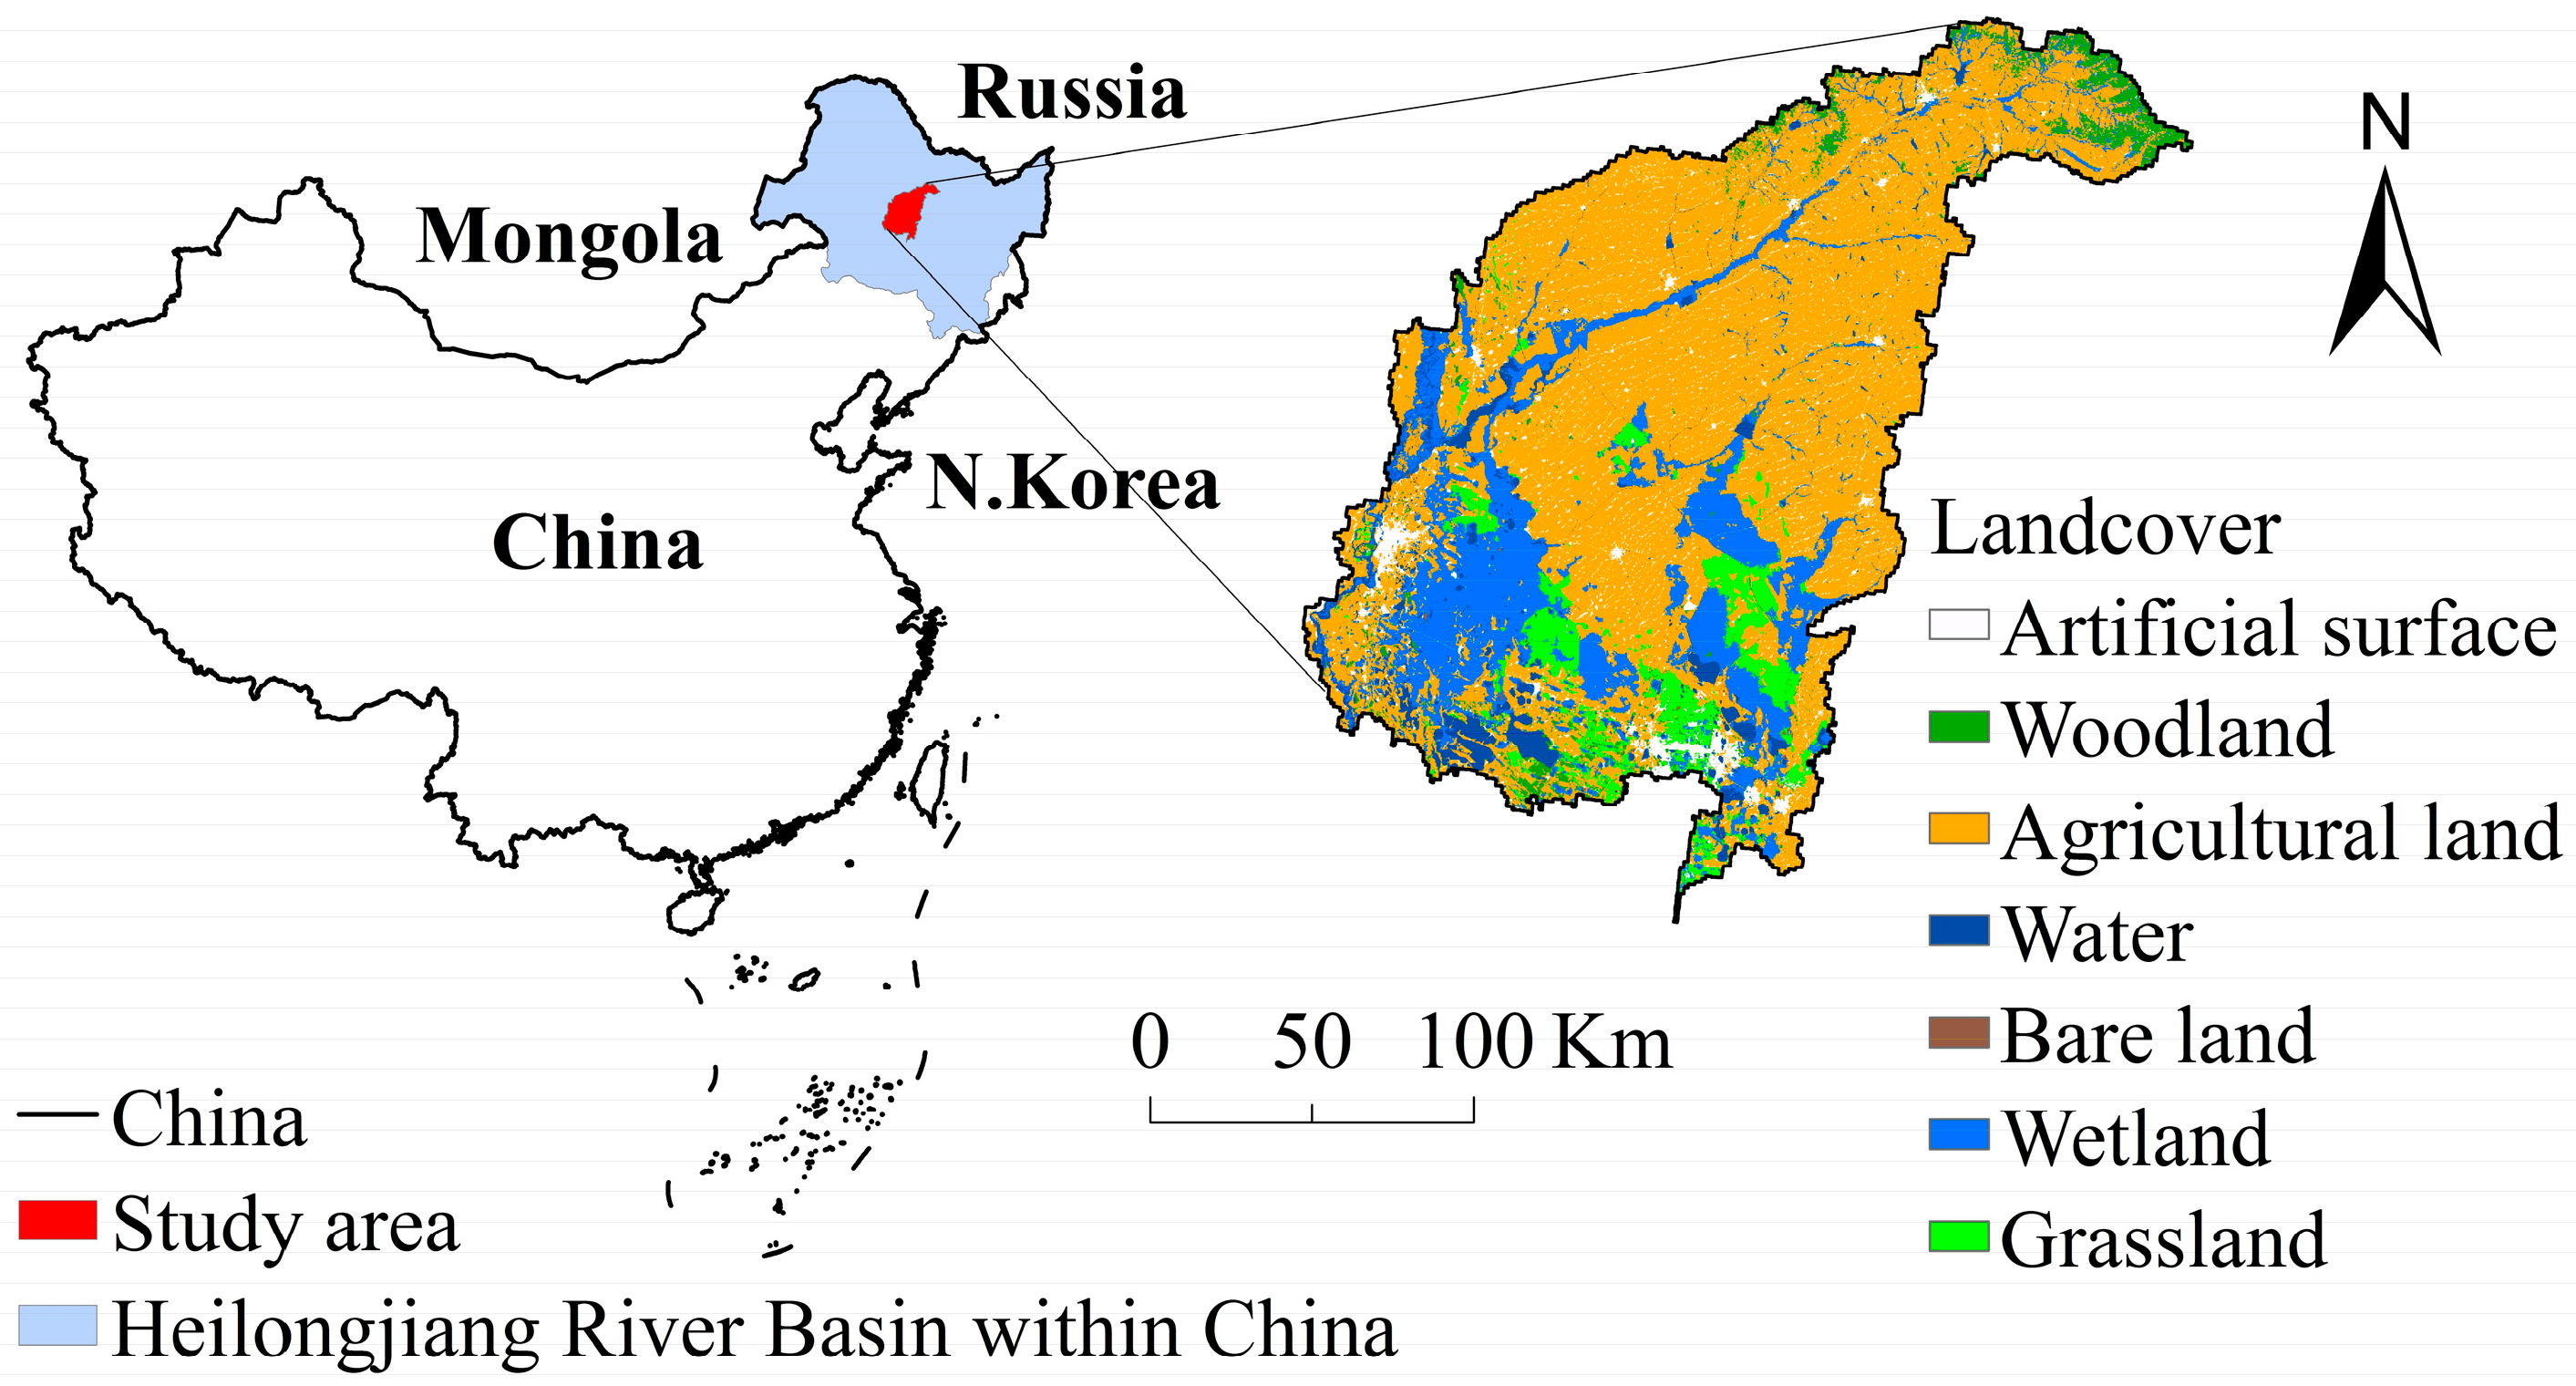
2.1. Study Area

Our study area was located in the Heilongjiang River Basin of Northeast China, a mid- and high-latitude region extending from 123°33′ to 127°31′ E and 46°10′ to 48°25′ N with a total area of 3,408,965 ha (Figure 1). The region has a temperate, continental, semi-humid, semi-arid monsoon climate, with long, cold winters and warm summers. Annual mean temperature is 2.74 °C and annual mean precipitation is 469.46 mm. Heilongjiang River Basin contained the most abundant wetlands in Northeast China, but the wetlands suffered serious human disturbances with population increasing quickly and extensive agricultural reclamation due to its suitable farming conditions.

2.2. Historical Wetland Data

We used cloud-free Landsat Thematic Mapper (TM) and Enhanced Thematic Mapper (ETM+) with a spatial resolution of 30 m for the 1990s, 2000s, and 2010s to identify the wetland distribution in our study area. Landsat TM/ETM+ satellite images were downloaded from the USGS Center for Earth Resources Observation and Science (http://glovis.usgs.gov). We used radiometric calibration and FlAASH atmospheric correction models to correct all images removing radiometric and atmospheric effects with ENVI 5.2. We applied object-oriented classification methods to classify the wetland distribution [37,38] and improved the accuracy of wetland classification by environmental factors related to wetland distribution, such as DEM [39]. We validated the wetland classification results for the 1990s and 2000s by comparing with other studies [40] that assured the classification accuracy for the 1990s and 2000s was above 90%. We validated the wetland classification results of the 2010s using field data with an accuracy of 85%. We resampled the classification results of the 1990s, 2000s, and 2010s into a resolution of 90 m.

2.3. Climate Data and Climate Change Scenarios

We included a current climate scenario and three climate change scenarios. We chose five GCMs (IPSL-CM5A-MR, MIROC5, MIROC-ESM-CHEM, MRI-CGCM3, and NorESM1-M) from CMIP5 by comparing the root-mean-square errors (RMSEs) between the historical and observed climate data [23,41]. The smaller RMSEs indicated that the corresponding model performed better [22]. Thus, we considered that the five GCMs performed relatively well [21]. We used the historic climate data rather than the projected current climate data from the ensemble of the five GCMs in our modelling scenarios [20]. We selected RCP scenarios from the GCMs including RCP 2.6, RCP 4.5, and RCP 8.5 emission scenarios representing the lowest, intermediate, and highest increases in temperature in this region, respectively [42,43,44]. The historical monthly climate data (1960s–2009) were derived from China Meteorological Administration and the Meteorological Data Center (http://data.cma.cn/site/index.html). The climate scenarios data (2010s–2099) were obtained from CMIP5 (http://cmip-pcmdi.llnl.gov/cmip5/). We resampled all climate data to a 0.5° resolution grid because of the different resolutions among GCMs [45]. We assembled the annual mean temperature and annual mean precipitation from five GCMs under RCP 2.6, RCP 4.5, and RCP 8.5 emission scenarios at the 2040s (2010s–2039), 2070s (2040s–2069), and 2100s (2070s–2099). Annual mean temperature and annual mean precipitation changed slightly under the RCP 2.6 emission scenario, increased under the RCP 4.5 emission scenario, and increased dramatically under the RCP 8.5 emission scenario (Table 1).

2.4. Topographical Variables, Hydrological Variables, Climatic Variables, and Human Activity Variables

We selected topography, hydrology, climate, and human activities as driving factors, which included 15 driving variables. Because of the inconsistent resolutions of driving variables, we resampled the maps of the wetland and driving variables to 200-m cells.
We included the warmness index, coldness index, annual mean precipitation, humidity index, annual mean temperature, potential evapotranspiration ratio, and annual biological temperature as climatic variables [20]. We calculated these variables for four periods, which included the current period (1960s–2009) and future periods (2010s–2039, 2040s–2069, and 2070s–2099). We calculated the warmness index and coldness index based on Kira’s method [46,47], the humidity index based on Kira’s WI [48], and the annual biological temperature and potential evapotranspiration ratio based on the revised Holdridge’s method [49,50,51].
We included aspect, slope, and elevation as topography variables [29]. We obtained slope, aspect, and elevation from the Digital Elevation Model (DEM) that was derived from the latest earth electronic topographic data of 2009 jointly launched by the National Aeronautics and Space Administration and the Ministry of Economy, Trade, and Industry of Japan. We used distance to water body as a hydrological variable because of the inaccessibility of other hydrologic data such as underground water [52].
We included agricultural population proportion [53], paddy field area proportion, dry farmland area proportion, and distance to roads [52] as human activity variables [54]. The census data, including population and agricultural cultivation (1990–2009), were derived from China Data Sharing Infrastructure of Earth System Science (http://www.geodata.cn/). Distance to roads was calculated by using roads map (2009). The roads maps were only evaluated in 2009 because historic roads maps were not available.

2.5. Model Performance, Validation, and Prediction

We analyzed the relative importance of 15 driving variables in historic wetland distribution changes using the Random Forest model by calculating the values of Mean Decrease Accuracy (MDA). The Random Forest model was suitable for explaining the nonlinear and collinear relationships among driving variables and was capable of handling a flexible number of input variables [55]. Random Forest was an ensemble learning technology that implemented a Breiman random forest algorithm based on a combination of many decision trees [56,57]. For each tree in the Random Forest model, a random set of variables and a random sample from the dataset for training were selected [58]. MDA in Random Forest could be used to rank variable importance. MDA quantified variable importance through measuring the change in Random Forest prediction accuracy, when the variable values were randomly permuted compared to original observations [59,60]. The larger MDA value denoted that the variable was more important [61,62,63]. Additionally, the Random Forest model we used was from a package in R (http://www.R-project.org).
We used the Random Forest model to predict future wetland distributions based on the relationship between historical wetland distribution and the driving variables. We first built the model using the historical wetland datasets including the 1990s and 2000s. Specifically, we divided the study area into approximately 850,000 cells. We used all 15 driving variables in the Random Forest model to explain wetland distribution in each grid cell and ranked the driving variables by importance. For the sake of building a statistically testable Random Forest model, we sampled 50% from the total number of cells where wetland occurred and 20% from the total number of cells of non-wetland from the 1990s to 2000s as the training datasets to establish the Random Forest models. Secondly, we predicted wetland distributions during the 2010s and then validated these predictions using the observed wetland data from the 2010s by comparing the predicted and observed wetland area during the 2010s. We also compared the predicted and observed wetland spatial distributions using receiver operating characteristics (ROC), which plotted sensitivity on the y axis and 1-specificity on the x axis for all possible thresholds (Phillips et al., 2006) and characterized the model performance using the area under the curve (AUC) (Phillips et al., 2006). AUC values ranged from zero (very poor model accuracy) to one (perfect fit between observations and predictions) (Swets, 1988), which were described as follows: poor (0.5–0.70), good (0.70–0.90), and excellent (0.90–1) (He et al., 2013). We calculated the ROC curve and AUC directly from the Random Forest model predictions for the 2010s.
We finally predicted the future wetland distributions for the 2040s, 2070s, and 2100s under RCP 2.6, RCP 4.5, and RCP 8.5 emission scenarios, respectively. We summarized the differences in predicted wetland area among emission scenarios for the 2040s, 2070s, and 2100s. To capture the spatial changes in wetland distribution for the 2040s, 2070s, and 2100s, we calculated and mapped loss, gain, and persistence rates in which future wetland distribution changed from present to absent, absent to present, and persistent, respectively, compared with the wetland distribution under the current climate scenario.

3. Results

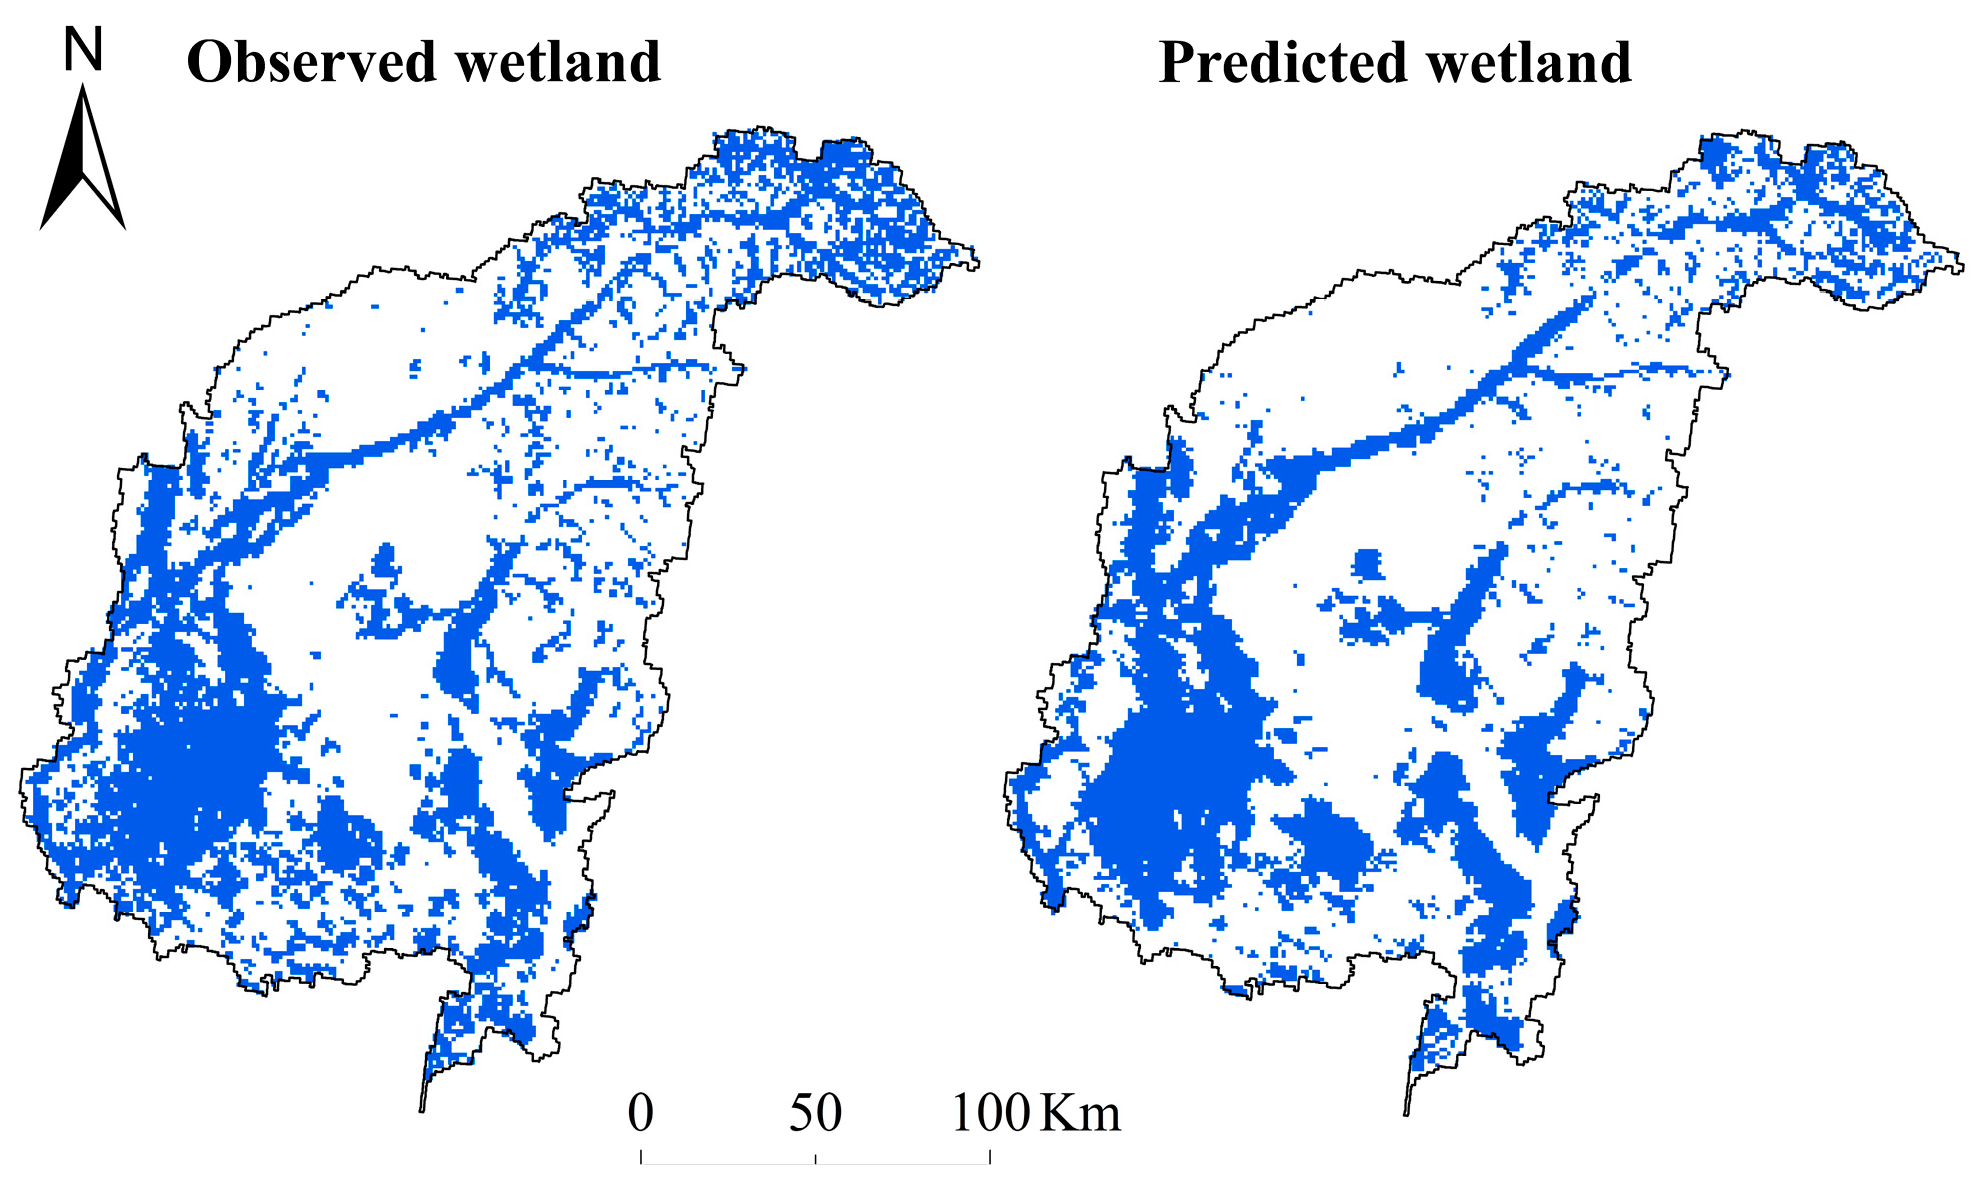
3.1. Prediction Accuracy Assessment

Our results showed that the predicted wetland area was similar to the observed wetland area (550,400 ha) for the 2010s. The average AUC value was 0.82 in the good standard range, indicating that the wetland spatial distributions between the predicted and the observed data were generally similar (Figure 2). Thus, we believe that the Random Forest model performed well for predicting future wetland distribution changes.

3.2. Importance of Driving Variables

The importance scores of 15 individual variables ranged from 1 to 15 (Table 2). The high-ranking variables included agricultural population proportion, warmness index, distance to water body, coldness index, and annual mean precipitation, which had importance scores of 13.06%, 11.47%, 11.15%, 10.83%, and 10.57%, respectively (Table 2). On average, the important score of climatic factors (9.67%) was slightly higher than human activity factors (9.13%) and a lot higher than topographical factors (1.75%).

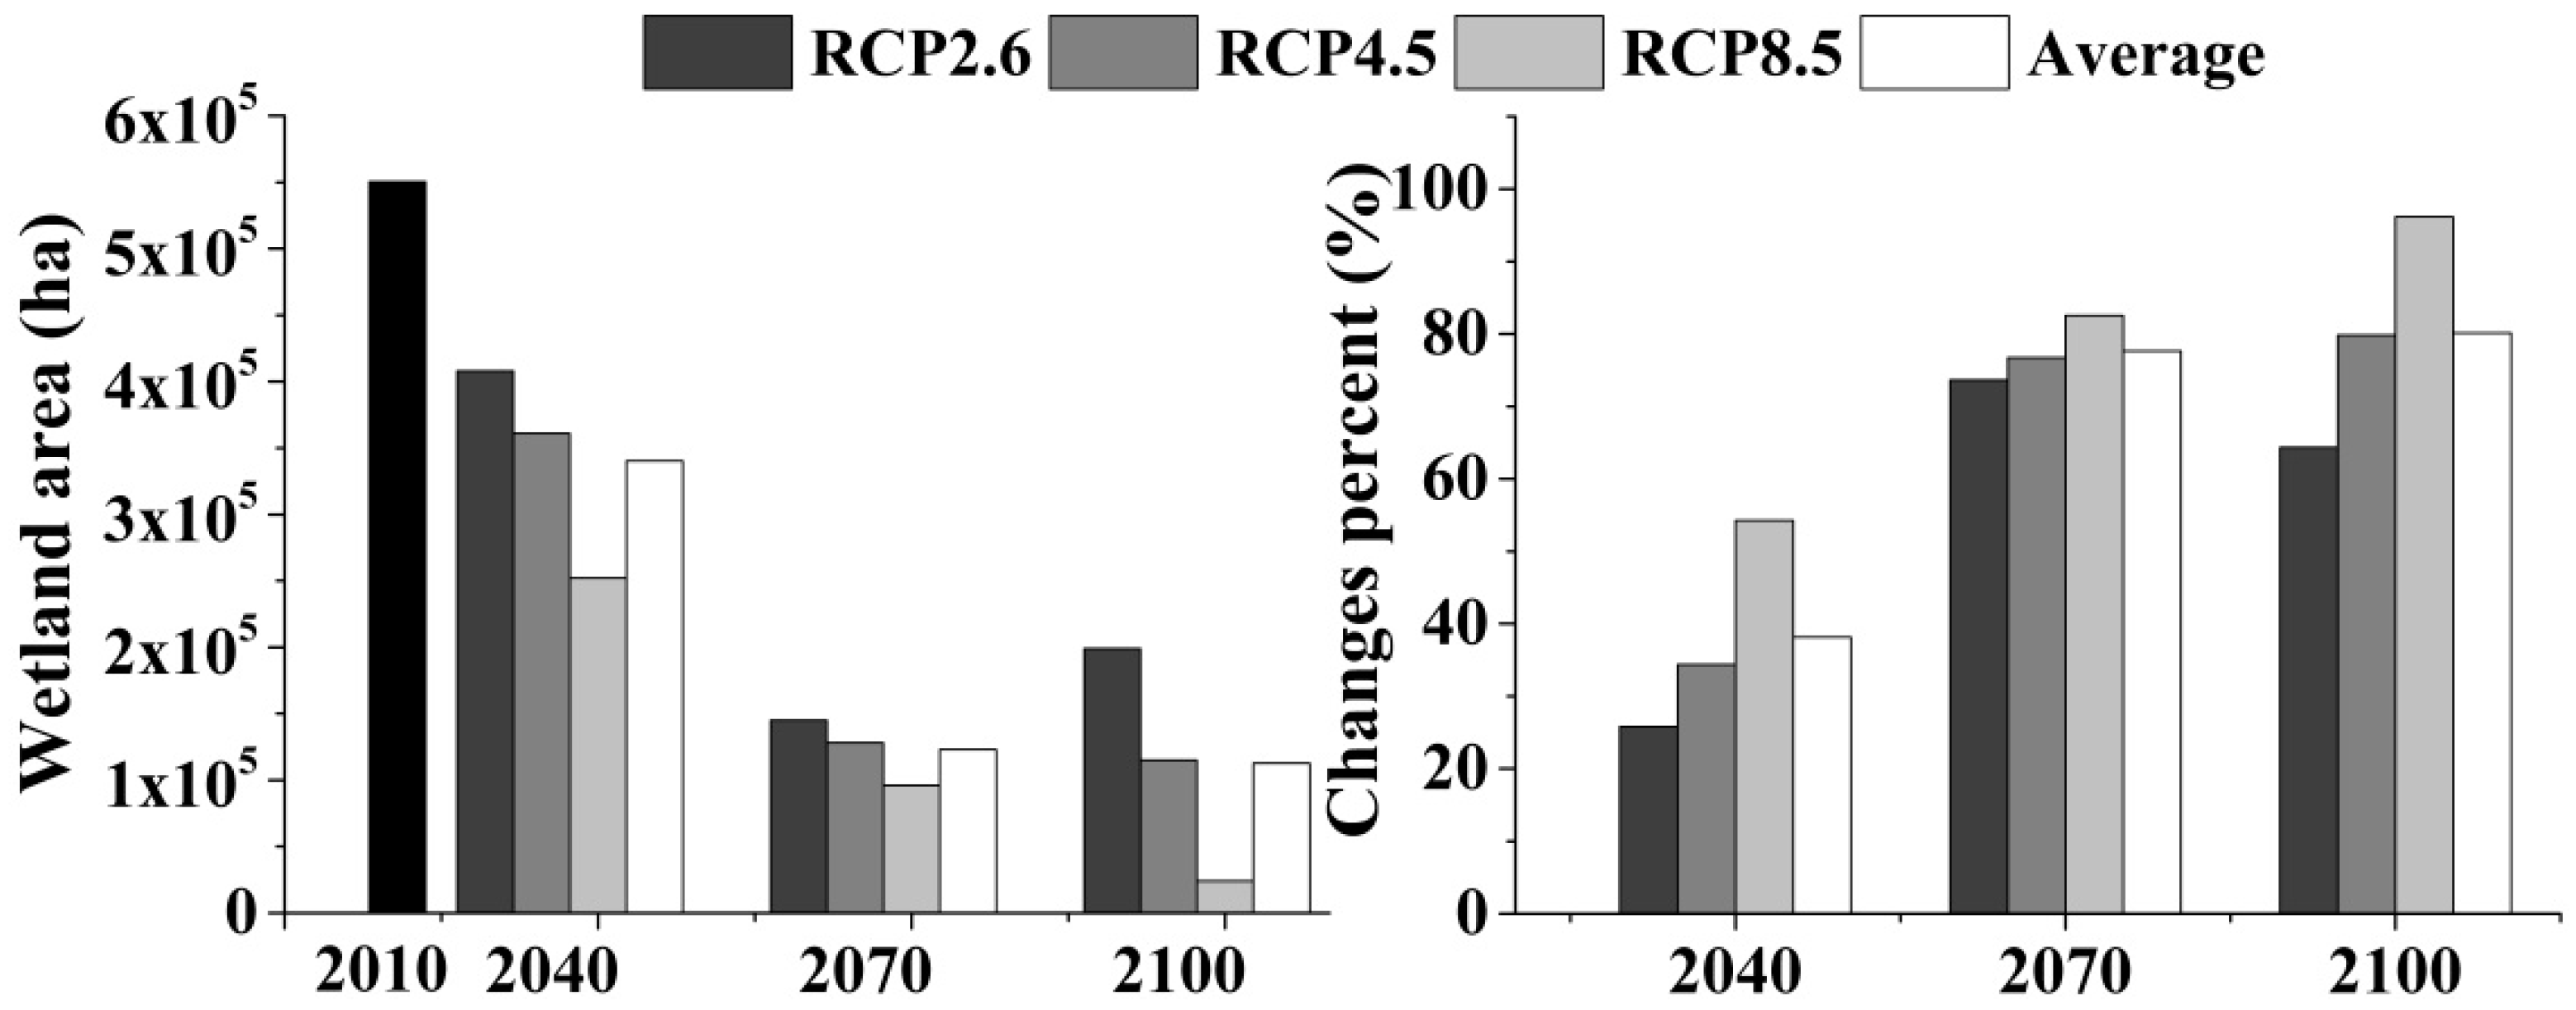
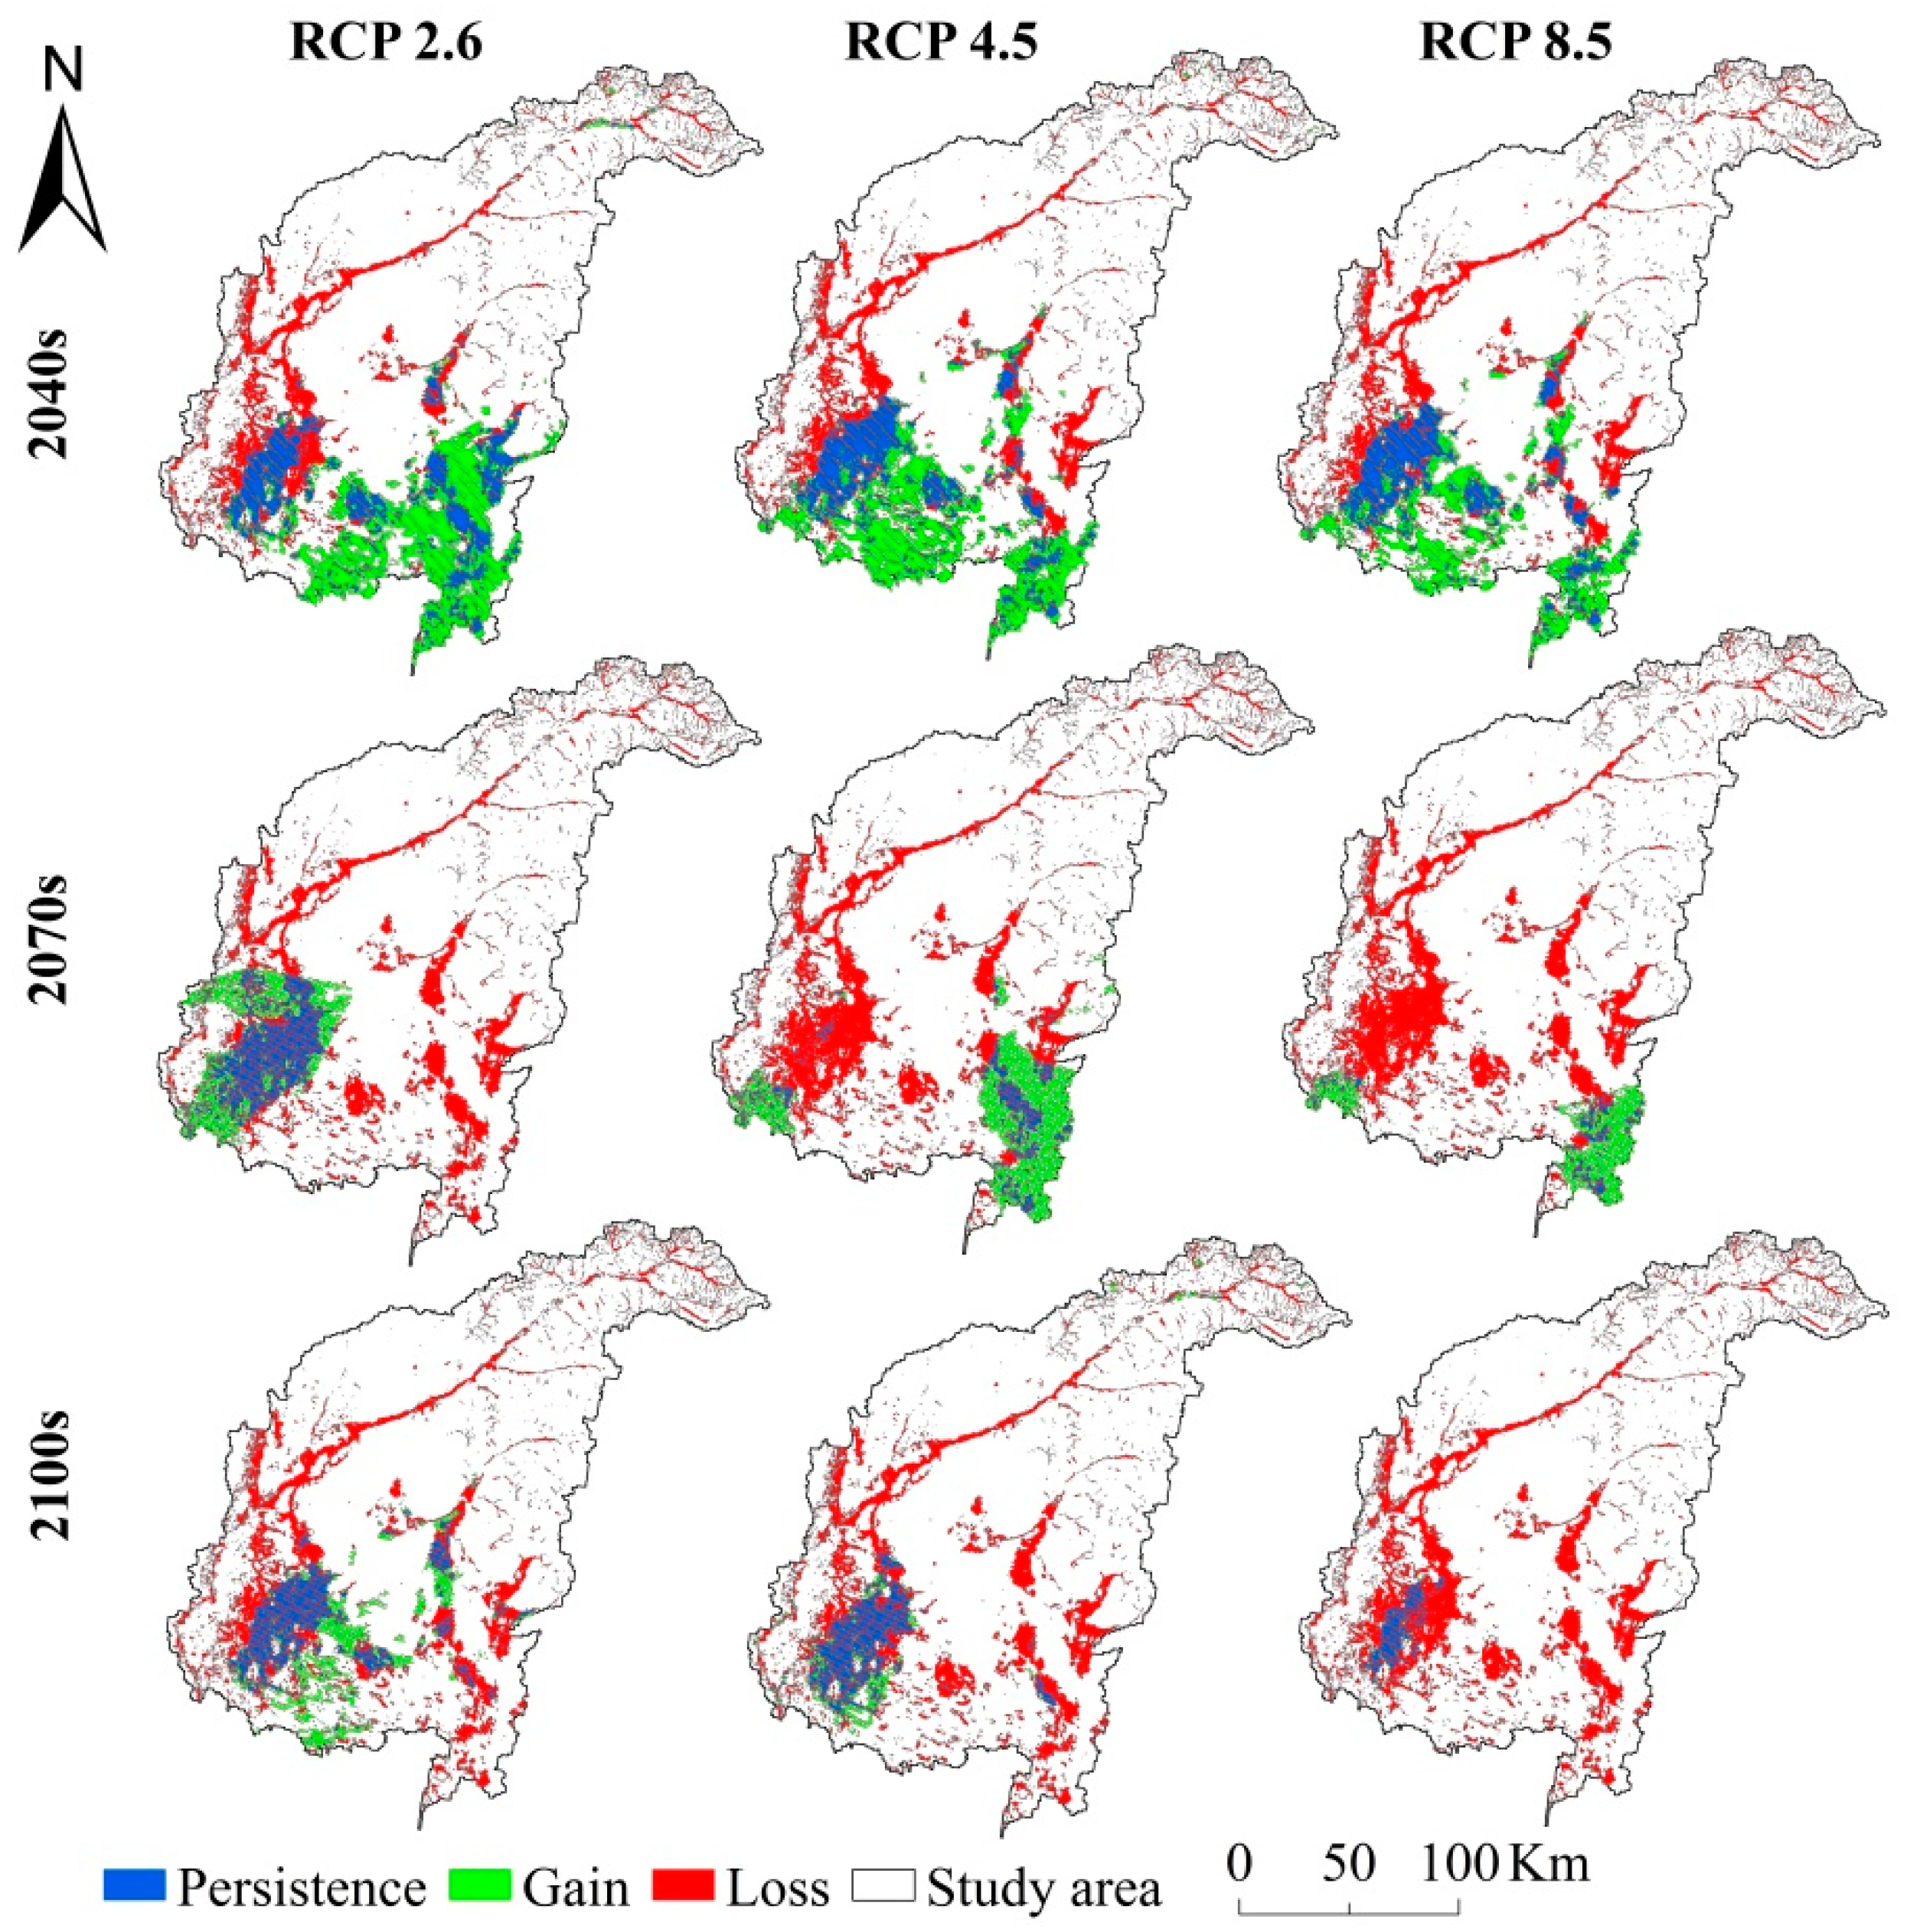
3.3. Future Wetland Distribution Changes

On average, the predicted wetland area decreased slightly for the 2040s, decreased for the 2070s, and then decreased remarkably for the 2100s compared with the current scenario (2010s) (Figure 3). Average predicted wetland areas among three emission scenarios were 340,000 ha, 123,000 ha, and 113,000 ha for the 2040s, 2070s, and 2100s, respectively. Predicted wetland changes generally had similar patterns under the three emission scenarios. Average predicted wetland areas among three time periods were approximately 250,000 ha, 200,000 ha, and 125,000 ha under the RCP 2.6, RCP 4.5, and RCP 8.5 emission scenarios, respectively (Figure 3).
Average change percent in predicted wetland area among three emission scenarios were approximately 38%, 77%, and 80% for the 2040s, 2070s, and 2100s (Figure 3) and these changes were mainly in the south, southeast, and southwest of the study area. (Figure 4). Average change percent in predicted wetland area among three periods was greatest under the RCP 8.5 emission scenario followed by RCP 4.5 and RCP 2.6 emission scenarios, which were 78%, 64%, and 55% (Figure 3).
Average loss among three emission scenarios was 65% for the 2040s, most of which was located in the most northern subsections (Figure 4 and Figure 5). The wetland losses expanded rapidly from north to south (Figure 4) and average loss increased to 88% for the 2070s (Figure 5). The wetland losses were widely distributed across the whole region (e.g., western, northern, and southern) (Figure 4) with an average loss of 84% for the 2100s (Figure 5).
Average gain among three emission scenarios was 27% for the 2040s with most gains distributed in the most southern subsections (Figure 5). However, the gained wetlands in the south of the region partly disappeared and the remaining gains were in the southeast and southwest of the region with an average of 10% for the 2070s (Figure 4 and Figure 5). The gained wetlands were scattered in the most southwest subsections and average gain decreased to 5% for the 2100s (Figure 4 and Figure 5).
The persistent wetlands among three emission scenarios were in the most southern subsections with different spatial distributions (e.g., scattered and aggregated) (Figure 4). Average persistence among three emission scenarios was 35% for the 2040s, then decreased to 12% for the 2070s, and rebounded to 16% for the 2100s (Figure 5).
Average losses among the three time periods under RCP 2.6, RCP 4.5, and RCP 8.5 emission scenarios were approximately 73%, 79%, and 85%, respectively (Figure 5). Average gains and persistence among the three time periods under RCP 2.6, RCP 4.5, and RCP 8.5 emission scenarios were 18%, 16%, and 8% and 27%, 21%, and 15%, respectively (Figure 5).

4. Discussion

4.1. The Relative Importance

Our results showed that the variables with high importance scores included agricultural population proportion, warmness index, distance to water body, coldness index, and annual mean precipitation. The important score of agricultural population proportion ranked first because the agricultural population was directly related to the reclamation of wetland into farmland due to food demands and economic needs. This was also found by the research of Wo and Sun [64] who pointed out that agricultural population was the major factor in wetland changes in Northeast China; Xu and Dong [65] considered population, as well as farmers’ per capita net income, as major driving factors of wetland changes in this region. Warmness index was ranked second because high temperature accelerated the evaporation of wetland surface water altering wetland water cycles [31], consequently affecting wetland distribution. Distance to a water body as a hydrological variable ranked third because adequate water recharge maintained the wetland water tables which affected the growth of wetland plants, ultimately changing wetland distribution [4,66]. Coldness index was important because it affected the growth of wetland plants and the evaporation of surface water [67]. Annual mean precipitation also affected the water tables of the wetland and provided water recharge, which played a significant role in wetland extent [68,69].
Climatic factors had slightly larger effects than human factors on wetland distribution changes and much larger effects than topographical factors with relatively flat terrains. Climate in the study area presented a warming trend that affected the wetland. The agricultural population generally reclaimed the wetland into farmland due to food demands and economic needs [69]. However, the agricultural reclamation active during the 1950s has remained relatively stable after the 1990s [70]. Climate change had negative effects on wetland distribution changes in the mid- and high-latitudes generally. The warming climate would increase soil temperature, decrease the groundwater level, accelerate water circulation, and affect the growth of wetland plants that led to poor water interception and minimal surface flow in wetlands [31]. The stable reclamation still had a negative effect on wetland changes in this region because human activities converted the wetlands to agricultural uses to accommodate population growth [70,71,72]. The important effects of climate change and human activities on wetland distribution were generally consistent with previous studies.
Nevertheless, our study, in selecting the driving factors of wetland changes, was different from some previous studies. Geological, topographic, and climatic conditions led to various changes in the predicted wetland distributions in some mid- and high- latitude regions of Europe [73]. Hydrological variability and geomorphic controls provided some explanatory power in wetland distribution changes in a mid- and high region of USA [74]. LUCC changes (e.g., grasslands and forest) resulted in some wetlands loss in a mid- and high- latitude region of Argentina [75]. These differences may be due to different approaches used or differences between our regional results and site-specific results. Thus, investigating wetland distribution changes may need to consider more driving factors such as geology and LUCC changes.

4.2. Predicted Wetland Distribution Changes

We predicted that wetland distribution would decrease continuously over the 21st century in the mid- and high-latitude regions. Such trends were expected because excessive warming caused increasing declines in predicted wetland distribution over time [31]. The trends of temporal changes predicted in our model were generally consistent with those predicted by other models (e.g., maximum entropy model [28], logistic regression model [34]). However, our prediction considered the human activities, so we revealed that the wetland changed more rapidly than other predictions under climate warming alone [20]. Human activities (e.g., agricultural reclamation and irrigation) led to declines in predicted wetland area and accelerated the wetland changes under climate change [76]. The declines in our study were a result of combined effects of climate change and human activities on the future wetland distributions.
Average changes in predicted wetland area were mainly in the south, southwest, and southeast because most of the wetland was distributed in the south of the study area. Spatial distribution changes (e.g., loss, gain, and persistence) in predicted wetland were varied. Average losses in predicted wetland distribution increased and were mostly located around the agricultural lands because warming climate caused declines in wetland surface water and thus provided favorable preconditions for agricultural reclamation [70,71]. Average gains in predicted wetland distribution decreased and were nearly associated with water and grasslands in the southern region. This was because the increases in temperature and precipitation may favor water flow, wetland plant growth, and sediment transport, therefore forming more wetland niche around the water [66]. However, warmer temperature would increase soil temperature and affect enzymatic activity to inhibit wetland plants growth, which would result in poor water interception and minimal surface flow and thus wetland losses [66]. Average persistence in predicted wetland distribution presented the variation tendency of a “V” shape and was in the southern subsections. The increases in temperature were accompanied by increases in evaporation, but the increases in precipitation provided more water recharge for wetlands [66]. Thus, the offset between evaporation and water recharge may determine the persistence of future wetland distributions.
We took the current wetland distribution scenario and compared it with the predicted wetland distributions under the RCP 2.6, RCP 4.5, and RCP 8.5 climate scenarios from the ensemble of five GCMs. The method was used to identify the effects of climate change on wetland distribution under the three scenarios. The usage of GCMs in our study was not completely consistent with the recent studies. Reese and Skagen [77] recently projected shorebird probabilities of occurrence using the RCP 8.5 climate scenario which was based on five GCMs and the ensemble of the GCMs. They assessed the difference of shorebird probabilities of occurrence among five GCMs because the General Circulation Models (GCMs) had intrinsic differences due to their structure or parameter schemes even under the same emission scenario [17]. Thus, studying the effects of climate change on wetland distribution needs to consider not only different climate scenarios but also the misspecification and bias of the GCMs.

4.3. Results Implications and Uncertainties

Our findings have important implications for wetland resource management and restoration because the variables with high importance scores for historical wetland distribution changes are useful for making wetland management decisions and predicting wetland distribution changes in response to climate change and human activities. It will be possible to manage wetlands for climate change adaptation and human activities mitigation with other management objectives such as ecological functions and economic benefits. Land use and management may need to take the types of temporal and spatial wetland changes into consideration. Wetland management is likely to promote the adaption and resistance of wetlands to climate change and human activities in the mid- and high-latitudes.
Our predictions of wetland distribution were subject to uncertainties in the Random Forest model. We did not consider some factors (e.g., biogeochemical cycles, geology, and LUCC changes) that may be important for predicting the wetland distribution changes [73,75,78]. Additionally, when comparing the effects of climate change on wetland distribution under current climate scenarios with future climate scenarios, we used the historic climate data rather than the projected current climate data from the ensemble of the five GCMs in our modelling scenarios. The method might underestimate the uncertainty of the GCMs [79]. Nevertheless, our predicted results addressed our research questions and were generally consistent with previous research. Our study clearly revealed that climatic factors were more important than human activity factors on average in driving wetland distribution changes over the past decades and that wetland distribution would decrease continually under the effects of climate change and human activities over the 21st century.

5. Conclusions

In our study, we quantified the importance of 15 driving variables that can help to explore the relative importance of climatic factors and human activity factors in driving historical wetland distribution changes. We predicted wetland distributions under RCP 2.6, RCP 4.5, and RCP 8.5 emission scenarios in a mid- and high-latitude region which will help predict wetland distribution change driven by the combined effects of climate change and human activities over the 21st century. Our results showed that the variables with high importance scores driving historical wetland distribution changes included agricultural population proportion, warmness index, distance to water body, coldness index, and annual mean precipitation. We found that climatic factors had larger effects than human activity factors on average in regard to wetland distribution changes over recent decades and that human activity has accelerated wetland changes. Average predicted wetland distribution decreased dramatically among the three periods of time investigated. Predicted wetland distribution changes were mainly in the southern portion of the study area due to the location of most wetlands. The losses in predicted wetland distribution were around agricultural lands and expanded continually north to the whole region over time, whereas gains in predicted wetland distributions were associated with grasslands and water in the southern-most portion of the region. In the mid- and high-latitudes with increasing human activities and climate change developing, our findings provide information for wetland resource management and restoration.

Acknowledgments

This study was jointly supported by the National Key R&D Program of China (No. 2016YFA0602301) and the Hundred- Talent Program (Y7H7031001).

Author Contributions

Dandan Zhao, Hong S. He, and Wen J. Wang conceived and designed the experiments; Dandan Zhao, Hong S. He, and Lei Wang performed the experiments; Kai Liu, and Lei Wang analyzed the data; Haibo Du and Shengwei Zong contributed reagents/materials/analysis tools; Dandan Zhao, Hong S. He, and Wen J. Wang wrote the paper.

Conflicts of Interest

The authors declare no conflict of interest.

References

  1. Song, Y.Y.; Song, C.C. An Introduction to National Key Research and Development Project: “Research on the Response of Wetland Ecosystems in Mid-high Latitudes to Climate Change” (No. 2016 YFA 0602300). Wetl. Sci. 2016, 14, 750–754. [Google Scholar]
  2. Nitta, T.; Yoshimura, K.; Abe-Ouchi, A. Impact of Arctic Wetlands on the Climate System: Model Sensitivity Simulations with the MIROC5 AGCM and a Snow-Fed Wetland Scheme. J. Hydrometeorol. 2017, 18, 2923–2936. [Google Scholar] [CrossRef]
  3. Junk, W.J.; An, S.; Finlayson, C.; Gopal, B.; Květ, J.; Mitchell, S.A.; Mitsch, W.J.; Robarts, R.D. Current state of knowledge regarding the world’s wetlands and their future under global climate change: A synthesis. Aquat. Sci. 2013, 75, 151–167. [Google Scholar] [CrossRef]
  4. Chen, H.; Zhao, Y.W. Evaluating the environmental flows of China’s Wolonghu wetland and land use changes using a hydrological model, a water balance model, and remote sensing. Ecol. Model. 2011, 222, 253–260. [Google Scholar] [CrossRef]
  5. Davidson, E.A.; Janssens, I.A. Temperature sensitivity of soil carbon decomposition and feedbacks to climate change. Nature 2006, 440, 165. [Google Scholar] [CrossRef] [PubMed]
  6. Arias, M.E.; Cochrane, T.A.; Kummu, M.; Lauri, H.; Holtgrieve, G.W.; Koponen, J.; Piman, T. Impacts of hydropower and climate change on drivers of ecological productivity of Southeast Asia’s most important wetland. Ecol. Model. 2014, 272, 252–263. [Google Scholar] [CrossRef]
  7. House, A.; Thompson, J.; Acreman, M. Projecting impacts of climate change on hydrological conditions and biotic responses in a chalk valley riparian wetland. J. Hydrol. 2016, 534, 178–192. [Google Scholar] [CrossRef]
  8. Helbig, M.; Chasmer, L.E.; Desai, A.R.; Kljun, N.; Quinton, W.L.; Sonnentag, O. Direct and indirect climate change effects on carbon dioxide fluxes in a thawing boreal forest–wetland landscape. Glob. Chang. Biol. 2017, 23, 3231–3248. [Google Scholar] [CrossRef] [PubMed]
  9. Bian, J.; Li, A.; Zhang, Z.; Zhao, W.; Lei, G.; Yin, G.; Jin, H.; Tan, J.; Huang, C. Monitoring fractional green vegetation cover dynamics over a seasonally inundated alpine wetland using dense time series HJ-1A/B constellation images and an adaptive endmember selection LSMM model. Remote. Sens. Environ. 2017, 197, 98–114. [Google Scholar] [CrossRef]
  10. Hartig, E.K.; Gornitz, V.; Kolker, A.; Mushacke, F.; Fallon, D. Anthropogenic and climate-change impacts on salt marshes of Jamaica Bay, New York City. Wetlands 2002, 22, 71–89. [Google Scholar] [CrossRef]
  11. Zhang, W.; Zhu, Y.B.; Jiang, J.G. Effect of the Urbanization of Wetlands on Microclimate: A Case Study of Xixi Wetland, Hangzhou, China. Sustainability 2016, 8, 885. [Google Scholar] [CrossRef]
  12. Gedan, K.B.; Silliman, B.R.; Bertness, M.D. Centuries of human-driven change in salt marsh ecosystems. Ann. Rev. Mar. Sci. 2009, 1, 117–141. [Google Scholar] [CrossRef] [PubMed]
  13. Syphard, A.D.; Garcia, M.W. Human-and beaver-induced wetland changes in the Chickahominy River watershed from 1953 to 1994. Wetlands 2001, 21, 342–353. [Google Scholar] [CrossRef]
  14. Abuodha, P.; Kairo, J. Human-induced stresses on mangrove swamps along the Kenyan coast. Hydrobiologia 2001, 458, 255–265. [Google Scholar] [CrossRef]
  15. Bai, J.; Lu, Q.; Wang, J.; Zhao, Q.; Ouyang, H.; Deng, W.; Li, A. Landscape pattern evolution processes of alpine wetlands and their driving factors in the Zoige plateau of China. J. Mt. Sci. 2013, 10, 54–67. [Google Scholar] [CrossRef]
  16. Nakicenovic, N.; Swart, R. Special Report on Emissions Scenarios; Cambridge University Press: Cambridge, UK, 2000; p. 612. [Google Scholar]
  17. Ekström, M.; Grose, M.R.; Whetton, P.H. An appraisal of downscaling methods used in climate change research. Wiley Interdis Clim. Chang. 2015, 6, 301–319. [Google Scholar] [CrossRef]
  18. Antoine, A.L.L.; Luc, A.; Jo De, R.; Laurent, L.; Christian, P.; Pascal, G. Investigating the respective impacts of groundwater exploitation and climate change on wetland extension over 150 years. J. Hydrol. 2014, 509, 367–378. [Google Scholar] [Green Version]
  19. Nicholls, R.J. Coastal flooding and wetland loss in the 21st century: Changes under the SRES climate and socio-economic scenarios. Glob. Environ. Chang. 2004, 14, 69–86. [Google Scholar] [CrossRef]
  20. Liu, H.J.; Bu, R.C.; Liu, J.T.; Leng, W.F.; Hu, Y.M.; Yang, L.B.; Liu, H.T. Predicting the wetland distributions under climate warming in the Great Xing’an Mountains, Northeastern China. Ecol. Res. 2011, 26, 605–613. [Google Scholar] [CrossRef]
  21. Zhang, X. Impacts of climate change on global agricultural land availability. Environ. Res. Lett. 2011, 6, 14014–14021. [Google Scholar] [CrossRef]
  22. Yoo, C.; Cho, E. Comparison of GCM Precipitation Predictions with Their RMSEs and Pattern Correlation Coefficients. Water 2018, 10, 28. [Google Scholar] [CrossRef]
  23. Jiang, X.; Xu, Z.; Liu, Z.; Liu, L. Evaluating the General Circulation Models over the Yangtze River Basin. Resour. Environ. Yangtze Basin 2011, 20, 51–58. [Google Scholar]
  24. Stocker, T.F.; Qin, D.; Plattner, G.K.; Tignor, M.; Allen, S.K.; Boschung, J.; Nauels, A.; Xia, Y.; Bex, V.; Midgley, P.M. IPCC 2013: Climate Change 2013: The Physical Science Basis. Contribution of Working Group I to the Fifth Assessment Report of the Intergovernmental Panel on Climate Change. Comput. Geom. 2013, 18, 95–123. [Google Scholar]
  25. Harris, R.M.B.; Grose, M.R.; Lee, G.; Bindoff, N.L.; Porfirio, L.L.; Fox-Hughes, P. Climate projections for ecologists. Wiley Interdiscip. Rev. Clim. Chang. 2014, 5, 621–637. [Google Scholar] [CrossRef]
  26. Grose, M.R.; Brown, J.N.; Narsey, S.; Brown, J.R.; Murphy, B.F.; Langlais, C.; Gupta, A.S.; Moise, A.F.; Irving, D.B. Assessment of the CMIP5 global climate model simulations of the western tropical Pacific climate system and comparison to CMIP3. Int. J. Clim. 2015, 34, 3382–3399. [Google Scholar] [CrossRef]
  27. Koneff, M.D.; Royle, J.A. Modeling wetland change along the United States Atlantic Coast. Ecol. Model. 2004, 177, 41–59. [Google Scholar] [CrossRef]
  28. He, W.; Bu, R.C.; Liu, H.J.; Xiong, Z.P.; Hu, Y.M. Prediction of the effects of climate change on the potential distribution of mire in northeastern China. Acta. Ecol. Sin. 2013, 33, 6314–6319. [Google Scholar] [CrossRef]
  29. Meng, H. Research on the Impact of Climate Change on the Marsh Distribution and Its Risk Assessment in the Sanjiang Plain Doctor; Northeast Institute of Geography and AGgroecology, Chinese Academy of Sciences: Changchun, China, 2016. [Google Scholar]
  30. Zhou, H.; Bu, R.C.; Hu, Y.M.; Yan, H.W.; Liu, H.J.; Leng, W.F.; Xu, S.L. Correlationsbetween potential distribution of wetlands in Great Hing’an Mountains and environmental variables. Chin. J. Ecol. 2007, 26, 1533–1541. [Google Scholar]
  31. Werner, B.A.; Johnson, W.C.; Guntenspergen, G.R. Evidence for 20th century climate warming and wetland drying in the North American Prairie Pothole Region. Ecol. Evol. 2013, 3, 3471–3482. [Google Scholar] [CrossRef] [PubMed]
  32. Jing, Y.Q.; Zhang, F.; Zhang, Y. Change and prediction of the land use/cover in Ebinur Lake Wetland Nature Reserve based on CA-Markov model. Chin. J. Appl. Ecol. 2016, 27, 3649–3658. [Google Scholar]
  33. Akin, A.; Berberoglu, S.; Erdogan, M.A.; Donmez, C. Modelling Land-use change dynamics in a mediterranean coastal wetland using Ca-markov chain analysis. Fresen. Environ. Bull. 2012, 21, 386–396. [Google Scholar]
  34. Liu, H.J.; Hu, Y.M.; Bu, R.C.; Liu, J.T.; Leng, W.F. Impacts of climate changes on the landscape patterns of potential mire distributions in northern Great Khing’an mountains. Adv. Water. Sci. 2009, 20, 105–110. [Google Scholar]
  35. Avis, C.A.; Weaver, A.J.; Meissner, K.J. Reduction in areal extent of high-latitude wetlands in response to permafrost thaw. Nat. Geosci. 2011, 4, 444–448. [Google Scholar] [CrossRef]
  36. Chan, J.C.-W.; Paelinckx, D. Evaluation of Random Forest and Adaboost tree-based ensemble classification and spectral band selection for ecotope mapping using airborne hyperspectral imagery. Remote Sens. Environ. 2008, 112, 2999–3011. [Google Scholar] [CrossRef]
  37. Man, W.D.; Yu, H.; Li, L.; Liu, M.Y.; Mao, D.H.; Ren, C.Y.; Wang, Z.M.; Jia, M.M.; Miao, Z.H.; Lu, C.Y.; et al. Spatial expansion and soil organic carbon storage changes of croplands in the Sanjiang plain, China. Sustainability 2017, 9, 563. [Google Scholar] [CrossRef]
  38. Man, W.D.; Wang, Z.M.; Liu, M.Y.; Lu, C.Y.; Jia, M.M.; Mao, D.H.; Ren, C.Y. Spatio-temporal dynamics analysis of cropland in Northeast China during 1990–2013 based on remote sensing. Trans. Chin. Soc. Agric. Eng. 2016, 32, 1–10. [Google Scholar]
  39. Ke, Y.H.; Quackenbush, L.J.; Im, J.H. Synergistic use of QuickBird multispectral imagery and LIDAR data for object-based forest species classification. Remote Sens. Environ. 2010, 114, 1141–1154. [Google Scholar] [CrossRef]
  40. Mao, D.H.; Wang, Z.M.; Luo, J.; Ren, C.Y.; Jia, M.M. Monitoring the Evolution of Wetland Ecosystem Pattern in Northeast China from 1990 to 2013 Based on Remote Sensing. J. Nat. Resour. 2016, 31, 1254–1263. [Google Scholar]
  41. Chu, Q.; Xu, Z.; Liu, W.; Liu, L. Assessment on 24 Global Climate Models in the CMIP5 over the Yangze River. Resour. Environ. Yangtze Basin 2015, 24, 81–89. [Google Scholar]
  42. Vuuren, D.P.; Stehfest, E.; Elzen, M.G.; Kram, T.; Vliet, J.; Deetman, S.; Isaac, M.; Goldewijk, K.K.; Hof, A.; Beltran, A.M. RCP2. 6: Exploring the possibility to keep global mean temperature increase below 2 C. Clim. Chang. 2011, 109, 95–116. [Google Scholar] [CrossRef]
  43. Thomson, A.M.; Calvin, K.V.; Smith, S.J.; Kyle, G.P.; Volke, A.; Patel, P.; Delgado-Arias, S.; Bond-Lamberty, B.; Wise, M.A.; Clarke, L.E. RCP4. 5: A pathway for stabilization of radiative forcing by 2100. Clim. Chang. 2011, 109, 77. [Google Scholar] [CrossRef]
  44. Riahi, K.; Rao, S.; Krey, V.; Cho, C.; Chirkov, V.; Fischer, G.; Kindermann, G.; Nakicenovic, N.; Rafaj, P. RCP 8.5—A scenario of comparatively high greenhouse gas emissions. Clim. Chang. 2011, 109, 33. [Google Scholar] [CrossRef]
  45. Flato, G.; Boer, G. Warming asymmetry in climate change simulations. Geophys. Res. Lett. 2001, 28, 195–198. [Google Scholar] [CrossRef]
  46. Kira, T. A New Classification of Climate in Eastern Asia as the Basis for Agricultural Geography; Horticultural Institute Kyoto University: Kyoto, Japan, 1945. [Google Scholar]
  47. Kira, T. On the altitudinal arrangement of climatic zones in Japan. Kanti-Nogaku 1948, 2, 143–173. [Google Scholar]
  48. Xu, W.D. The relation between the zonal distribution of types of vegetation and the climate in Northeast China. Acta Phytoecol. Geobot. Sin. (China) 1986, 10, 254–263. [Google Scholar]
  49. Holdridge, L.R. Determination of World Plant Formations from Simple Climatic Data. Science 1947, 105, 367–368. [Google Scholar] [CrossRef] [PubMed]
  50. Rosenzweig, M.L. Net primary productivity of terrestrial communities: Prediction from climatological data. Am. Nat. 1968, 102, 67–74. [Google Scholar] [CrossRef]
  51. Yue, T.X.; Liu, J.Y.; Jørgensen, S.E.; Gao, Z.Q.; Zhang, S.H.; Deng, X.Z. Changes of Holdridge life zone diversity in all of China over half a century. Ecol. Model. 2001, 144, 153–162. [Google Scholar] [CrossRef]
  52. Cui, L.J.; Gao, C.J.; Zhou, D.M.; Mu, L. Quantitative analysis of the driving forces causing declines in marsh wetland landscapes in the Honghe region, Northeast China, from 1975 to 2006. Environ. Earth. Sci. 2014, 71, 1357–1367. [Google Scholar] [CrossRef]
  53. Du, H.B.; He, H.S.; Wu, Z.F.; Wang, L.; Zong, S.; Liu, J. Human influences on regional temperature change–comparing adjacent plains of China and Russia. Int. J. Climatol. 2016, 37, 2913–2922. [Google Scholar] [CrossRef]
  54. Stocker, T. Climate Change 2013: The Physical Science Basis: Working Group I Contribution to the Fifth Assessment Report of the Intergovernmental Panel on Climate Change; Cambridge University Press: Oxford, UK, 2014. [Google Scholar]
  55. Vincenzi, S.; Zucchetta, M.; Franzoi, P.; Pellizzato, M.; Pranovi, F.; Leo, G.A.D.; Torricelli, P. Application of a Random Forest algorithm to predict spatial distribution of the potential yield of Ruditapes philippinarum in the Venice lagoon, Italy. Ecol. Model. 2011, 222, 1471–1478. [Google Scholar] [CrossRef]
  56. Breiman, L. Out-of-Bag Estimation; Technical Report; Statistics Department, University of California: Berkeley, CA, USA, 1996. [Google Scholar]
  57. Breiman, L. Random forests. Mach. Learn. 2001, 45, 5–32. [Google Scholar] [CrossRef]
  58. Wei, W.; Nie, Y.; Zhang, Z.; Hu, Y.; Yan, L.; Qi, D.; Li, X.; Wei, F. Hunting bamboo: Foraging patch selection and utilization by giant pandas and implications for conservation. Biol. Conserv. 2015, 186, 260–267. [Google Scholar] [CrossRef]
  59. Calle, M.L.; Urrea, V. Letter to the editor: Stability of Random Forest importance measures. Brief. Bioinform. 2011, 12, 86. [Google Scholar] [CrossRef] [PubMed]
  60. Crookston, N.L.; Rehfeldt, G.E.; Dixon, G.E.; Weiskittel, A.R. Addressing climate change in the forest vegetation simulator to assess impacts on landscape forest dynamics. For. Ecol. Manag. 2010, 260, 1198–1211. [Google Scholar] [CrossRef]
  61. Li, X. Using “random forest”for classification and regression. Chin. J. Appl. Entomol. 2013, 50, 4. [Google Scholar]
  62. Cassidy, A.P.; Deviney, F.A. Calculating feature importance in data streams with concept drift using Online Random Forest. In Proceedings of the IEEE International Conference on Big Data, Santa Clara, CA, USA, 29 October–1 November 2015; pp. 23–28. [Google Scholar]
  63. Hart, S.J.; Veblen, T.T.; Kulakowski, D. Do tree and stand-level attributes determine susceptibility of spruce-fir forests to spruce beetle outbreaks in the early 21st century? For. Ecol. Manag. 2014, 318, 44–53. [Google Scholar] [CrossRef]
  64. Wo, X.; Sun, Y. Study on dynamic change of land use and land cover in Zhalong wetland. J. Northeast Agric. Univ. 2010, 41, 56–60. [Google Scholar]
  65. Xu, J.; Dong, J. Landscape pattern change and its driving force of Nansihu Wetlands during 1987–2010. Wet. Sci. 2013, 11, 438–445. [Google Scholar]
  66. Lu, J.J.; He, W.S.; Tong, C.F.; Wang, W. Wetland Ecology; Higher Education Press: Beijing, China, 2006. [Google Scholar]
  67. Fuente, A.D.L.; Meruane, C. Spectral model for long-term computation of thermodynamics and potential evaporation in shallow wetlands. Water Resour. Res. 2017, 53. [Google Scholar] [CrossRef]
  68. Liao, X.; Inglett, P.W.; Inglett, K.S. Seasonal patterns of nitrogen cycling in subtropical short-hydroperiod wetlands: Effects of precipitation and restoration. Sci. Total. Environ. 2016, 556, 136–145. [Google Scholar] [CrossRef] [PubMed]
  69. Gerla, P.J. The relationship of water-table changes to the capillary fringe, evapotranspiration, and precipitation in intermittent wetlands. Wetlands 1992, 12, 91–98. [Google Scholar] [CrossRef]
  70. Song, K.S.; Wang, Z.M.; Zhang, B.; Jin, C.; Li, F.; Liu, H.J. Analysis of Cultivated Land Dynamics in the Past 50 Years in Sanjiang Plain and Its Driving Forces. J. Soil Water. Conserv. 2008, 4, 75–81. [Google Scholar]
  71. Wang, Z.M.; Song, K.S.; Liu, D.W.; Zhang, B.; Zhang, S.Q.; Li, F.; Ren, C.Y.; Jin, C.; Yang, T.; Zhang, C.H. Progress of Land Conversion from Marsh into Cropland in the Sanjiang Plain during 1954–2005. Wetl. Sci. 2009, 3, 208–217. [Google Scholar]
  72. Garris, H.W.; Mitchell, R.J.; Fraser, L.H.; Barrett, L.R. Forecasting climate change impacts on the distribution of wetland habitat in the Midwestern United states. Glob. Chang. Biol. 2015, 21, 766–776. [Google Scholar] [CrossRef] [PubMed]
  73. Merot, P.; Squividant, H.; Aurousseau, P.; Hefting, M.; Burt, T.; Maitre, V.; Kruk, M.; Butturini, A.; Thenail, C.; Viaud, V. Testing a climato-topographic index for predicting wetlands distribution along an European climate gradient. Ecol. Model. 2003, 163, 51–71. [Google Scholar] [CrossRef]
  74. Dong, X.L.; Grimm, N.B.; Ogle, K.; Franklin, J. Temporal variability in hydrology modifies the influence of geomorphology on wetland distribution along a desert stream. J. Ecol. 2016, 104, 18–30. [Google Scholar] [CrossRef]
  75. Sica, Y.V.; Quintana, R.D.; Radeloff, V.C.; Gavier-Pizarro, G.I. Wetland loss due to land use change in the Lower Paraná River Delta, Argentina. Sci. Total. Environ. 2016, 568, 967–978. [Google Scholar] [CrossRef] [PubMed]
  76. Mao, D.H.; Wang, Z.M.; Li, L.; Song, K.S.; Jia, M. Quantitative assessment of human-induced impacts on marshes in Northeast China from 2000 to 2011. Ecol. Eng. 2014, 68, 97–104. [Google Scholar] [CrossRef]
  77. Reese, G.C.; Skagen, S.K. Modeling nonbreeding distributions of shorebirds and waterfowl in response to climate change. Ecol. Evol. 2017, 7, 1497–1513. [Google Scholar] [CrossRef] [PubMed]
  78. Schleupner, C. GIS-based estimation of wetland conservation potentials in Europe. In Proceedings of the International Conference on Computational Science and Its Applications, Fukuoka, Japan, 23–26 March 2010; Springer: Berlin, Germany, 2010; pp. 193–209. [Google Scholar]
  79. Sofaer, H.R.; Skagen, S.K.; Barsugli, J.J.; Rashford, B.S.; Reese, G.C.; Hoeting, J.A.; Wood, A.W.; Noon, B.R. Projected wetland densities under climate change: Habitat loss but little geographic shift in conservation strategy. Ecol. Appl. 2016, 26, 1677–1692. [Google Scholar] [CrossRef] [PubMed]
Figure 1. Location and major land-use and land-cover (LUCC) of the study area.
Sustainability 10 00863 g001
Figure 2. Observed and predicted wetland distribution for the 2010s.
Sustainability 10 00863 g002
Figure 3. Predicted wetland area and percent changes among three emission scenarios over time.
Sustainability 10 00863 g003
Figure 4. Spatiotemporal changes of persistence, gain, and loss in predicted wetland distribution.
Sustainability 10 00863 g004
Figure 5. Percent changes of persistence, gain, and loss in predicted wetland.
Sustainability 10 00863 g005
Table 1. Annual mean temperature and annual mean precipitation under three emission scenarios over time.
YearEmission ScenariosAnnual Mean Temperature (°C)Annual Mean Precipitation (mm)
2010s-2.62485
2040sRCP2.63.12638
RCP4.53.16647
RCP8.53.31650
2070sRCP2.63.44655
RCP4.53.70660
RCP8.54.31661
2100sRCP2.63.52659
RCP4.54.07672
RCP8.55.29685
Table 2. Characterization and variable importance score.
FactorVariableUnitImportance Score (%)
ClimateAnnual biological temperature°C10.34
Potential evapotranspiration ratio°C/mm7.94
Annual mean temperature°C9.09
Humidity indexmm/°C7.42
Annual mean precipitationmm10.57
Coldness index°C10.83
Warmness index°C11.47
Average 9.67
TopographyElevationm3.45
Slope°0.89
Classification of aspect 0.90
Average 1.75
HydrologyDistance to water bodym11.15
Dry farmland area proportion 5.77
Paddy field area proportion 9.10
Human activitiesAgricultural population proportion 13.06
Distance to roadsm8.58
Average 9.13

