1. Introduction
A third of the world’s population lives in areas with hot-dry or hot humid weather covering a fifth of the planet’s surface whilst internal continental areas, even in high latitudes (50°), are characterized by summer temperatures over comfort levels [
1]. The use of air conditioning systems and the related energy costs, especially in Europe, is constantly increasing. This trend risks canceling the benefits produced by the energy conservation incentive policies implemented by European countries and other industrialized countries [
2].
If the problem of summer air conditioning is not tackled, electricity consumption will continue to rise. Two of the factors that have led to an increase in air conditioning are:
The need to cool habitable areas is becoming increasingly important in the current building landscape especially as the increase in efficiency of winter heating has led, in some cases, to less efficiency in buildings’ cooling systems during the summer [
3]. The consequence is therefore an increase in energy costs caused by the need to control indoor temperature and humidity of homes in the summer, and year round for other buildings. A valid alternative to this trend is represented by the use of design criteria and technologies based on the “passive” air conditioning of buildings, or the use of physical-technical mechanisms, natural or induced, aimed at achieving comfort conditions within a building without or with a minimum use of exogenous energies [
4,
5].
The widespread adoption of passive cooling systems that do not use electrical energy would clearly be advantageous from an environmental and economic perspective [
6]. Passive cooling consists of a series of measures adopted to control internal conditions, minimizing energy consumption through the use of local climatic resources and creating low environmental impact systems [
7].
The use of wind, for example, to provide comfortable living conditions is not new and has been used for centuries [
8,
9]. The villas of Costozza are an interesting example; wind was channelled through caves in order to cool the rooms in summer. The caves were manmade having been excavated in ancient times for stone, creating a series of underground caves and galleries called “covoli”. In the seventeenth century, when landowners built their villas on this land, they used the air of the caves to cool the internal environments by connecting their cellars to the caves with tunnels and, within the villas themselves, devising a system that allowed the regulation of the air flow. The system is still in use today and fresh air arrives through the basement, and reaches the upper floors, the air flow being generated by the difference in temperature and pressure [
10].
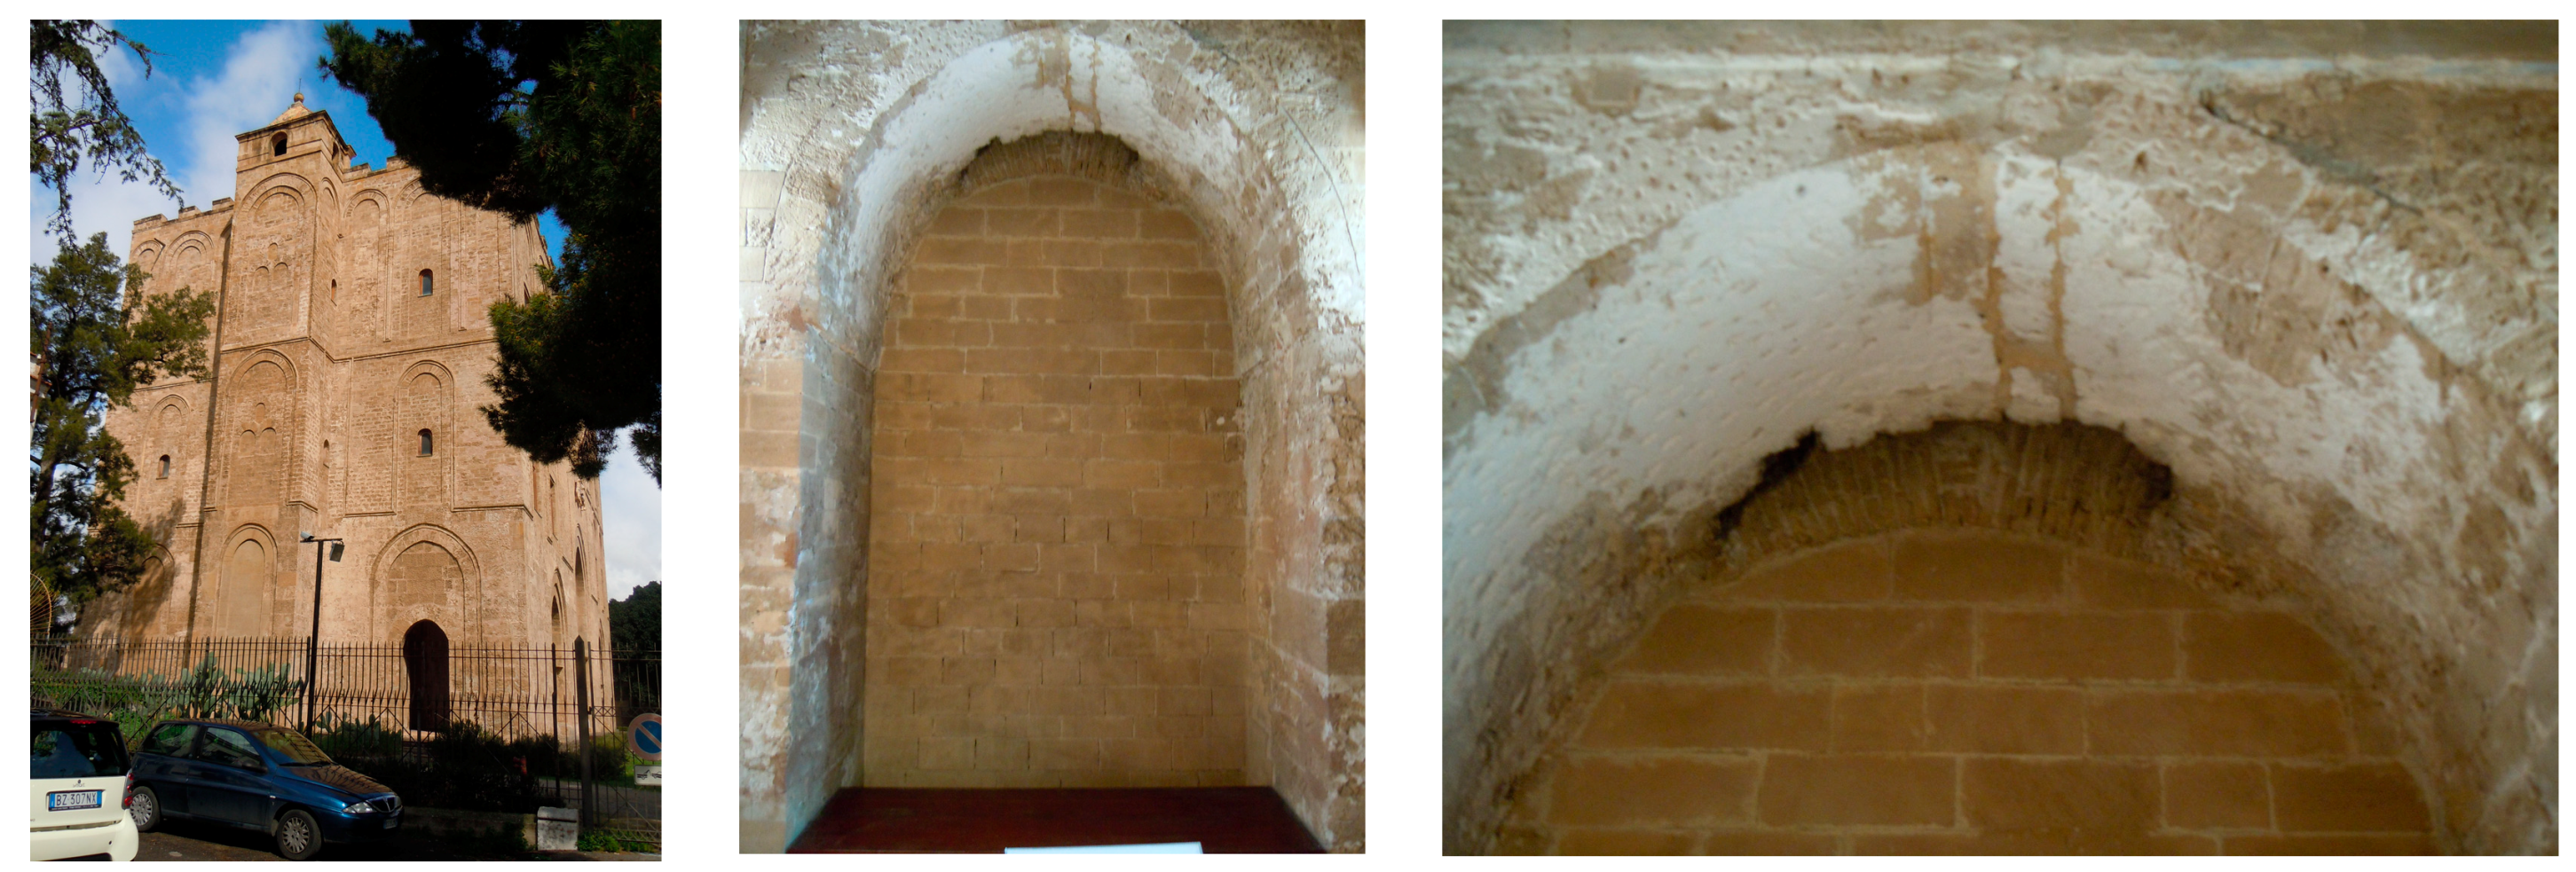
Another innovative project of cooling and natural ventilation can be found in Zisa (
Figure 1), the summer residence of kings in the city of Palermo (Italy). The natural ventilation and cooling of the castle were achieved as a result of five elements: the large fishpond in the front; the fountain on the ground floor; two ventilation chimneys; large damp towels hanging in the various rooms on the upper floors; and two side towers similar to “ventilation chimneys” connected to all three floors of the structure (
Figure 2). The sea breezes were first cooled by the pool and the fountain, the wind then entered the building and began to warm up. Hot air rose through the ventilation chimneys due to the cooler air below (“chimney effect”). Thus, natural circulation of air was created in all of the rooms and facilitated by a series of holes in the doors. Hot air was also cooled by large damp cloths hanging from the beams, the fittings of which are still visible today. Aesthetic comfort and awareness of the environment makes Zisa an outstanding example of bioclimatic architecture [
11,
12].
“Wind towers” (common in Arabic architecture) are another example of passive ventilation and well-known structures that apply the principle of natural convection to cooling. A wind tower is constructed from the foundations of a building and undergoes internal subdivisions into a series of chimneys and vertical ducts before emerging at the top of the building. Convective motions (adjustable with a series of doors and openings) are triggered between ducts, which influence the circulating air temperatures as desired. The motion of the air accelerates in the presence of wind and the cooling effect is often increased by “evaporation” through fountains carefully positioned in the passage of the currents; an important contribution to cooling is also the humidity arising from the subsoil and the foundations [
13,
14].
Many studies have looked at solar chimneys through mathematical simulations and experimental investigations: this choice of passive ventilation depends on design parameters and the thermal performances for different geometrical configurations. Research has shown that air speeds in chimneys are influenced by the width of the channel and the angle of inclination of the chimney. Saifi et al. [
15] developed an experimental and numerical study for a tilted solar chimney (30° and 45°) whilst Chung et al. [
16] studied the performance of a solar chimney in hot and humid climates in order to improve the thermal performance of a terrace house in Malaysia: nine configurations of chimney dimensions were tested and validated using CFD in Design Builder software in order to find the best solution for the case study analyzed. Another CFD studied was developed by Baxevanou and Fidaros for a two-story building with a solar chimney: three modifications of the basic 2D geometry were examined in order to exploit the functionality design of a solar chimney that operated better in the morning and afternoon, the worst time being noon in June [
17]. Yan et al. [
18] compared theoretical research, numerical simulations and experimental results showing how factors like heat collection height and width, solar radiation intensity, the inlet and outlet area ratio of chimney and air inlet velocity, etc. affect solar chimney ventilation.
Despite the large amount of literature on analytical studies of ventilation chimneys operation, widely validated by CFD analysis and optimized in geometry, there is a lack of research into the integration of these systems in historical buildings, which represents a large part of the Italian built heritage.
Unfortunately, the potential of wind as a renewable, alternative energy source to oil for the production of electricity in Italy is rather limited, [
11]. Italy’s geomorphological characteristics determine widespread wind with a prevailing breeze regime; wind with relatively low average speeds (1–2 m/s), variable frequency, and alternating directions during the day. However, these characteristics, although unfavourable for the production of electricity, are particularly suitable for use in natural ventilation systems for the renewal of air in confined spaces and passive cooling of buildings [
9]. This use, if exploited, would result in far higher savings in terms of electrical energy than could be obtained directly from wind power generation.
It was therefore with this in mind that this study looked at the integration of ventilation chimneys in historic buildings in central Italy. The goal was to evaluate the benefits in terms of internal comfort after the installation of a passive ventilation chimney in Palazzo Galeota, Poggio Picenze (L’Aquila, Italy). The aspects relating to its operational optimization were not considered in this study: in fact, the integration imposes in most cases constraints in the size of the duct. These constraints should not discourage intervention, which, as this paper shows, can nevertheless guarantee an improvement in the performance of the building.
2. Method and Tools
This research aims to show how thermo-hygrometric characteristics that already exist within a built volume can be exploited to improve internal thermal comfort and to ensure significant energy savings with respect to the use of air conditioning [
19]. The study looks at ventilation chimneys with various openings and analyzes the benefits produced by the installation of a ventilation duct in a historical building in central Italy.
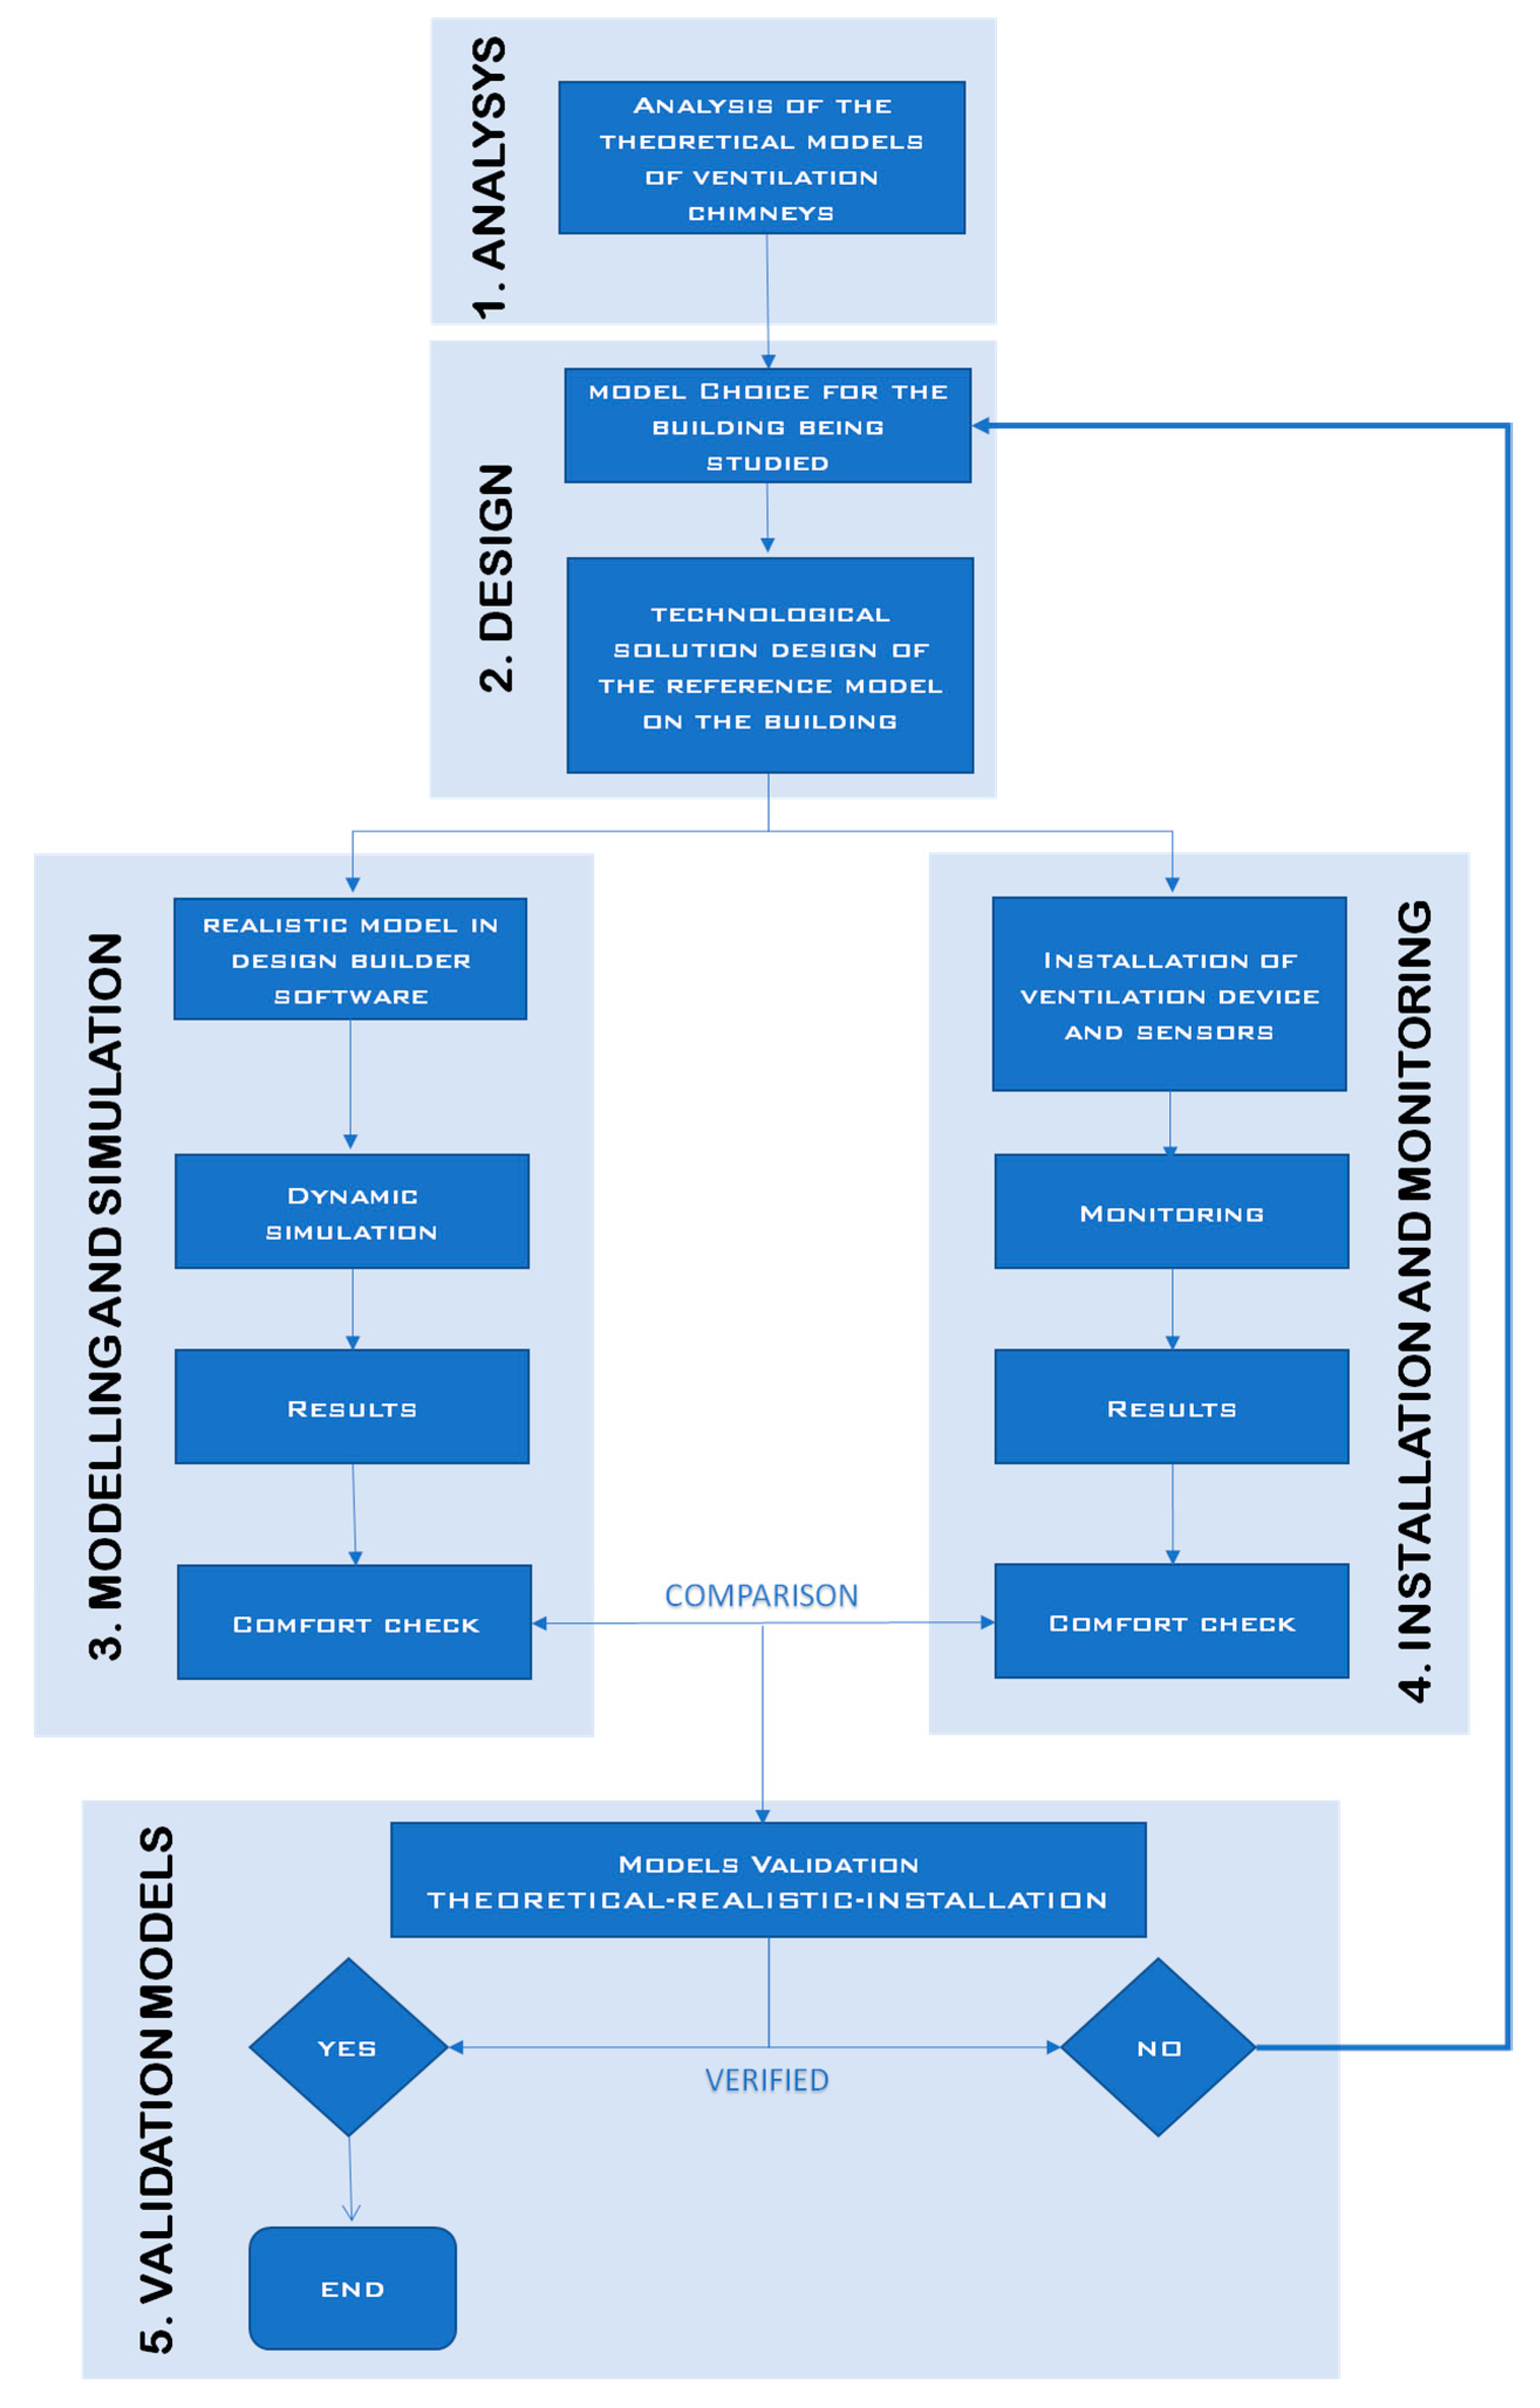
The methodology for this research consisted of five steps—the analysis of ventilation chimneys, design of a ventilation device, simulation with software, installation and monitoring, validation of models and concludes with testing. The methodology of the study is shown in
Figure 3.
The models for simulations were created using Design Builder. Only natural ventilation was taken into account and the results were calculated for the whole day of the 21st June (summer solstice) at 12:00 p.m. and the summer period from June to August using average values.
Simulations were carried out assuming that the ventilation chimney was used in a temperate climate, that of Campobasso in Italy. The results of these simulations showed the effectiveness of passive ventilation models, according to the Fanger indices, achieved. The results are, however, dependent on location; different surroundings may not produce the same results. Indeed, climatic zone plays a crucial role in establishing how thermo-hygrometric wellbeing can be achieved and it would be interesting to look at the functionality of these systems in more extreme climatic zones e.g., tropical climates [
9,
20].
The testing and validation process consisted of comparing the results of the simulation obtained from the schematic and realistic models, with the data collected from the monitoring of a case study, after the installation of the ventilation duct.
2.1. Construction Typologies, Functioning Schemes and Models
The most ancient “thermal machines” built by man are chimneys. Chimneys are responsible for the natural ventilation of a building, and this phenomenon is known, in bioclimatic architecture, as the “stack effect”. Often, in fact, our buildings act like gigantic chimneys, in which air circulates according to the different pressure. The differences in pressure are, in fact, responsible for the natural ventilation of the building, and fundamental for the change of air in internal areas and the thermal hygrometric wellbeing of the occupiers. Different pressure between the various floors of the building, even slight, increases with altitude and with the difference in temperature between outside and inside [
1,
21].
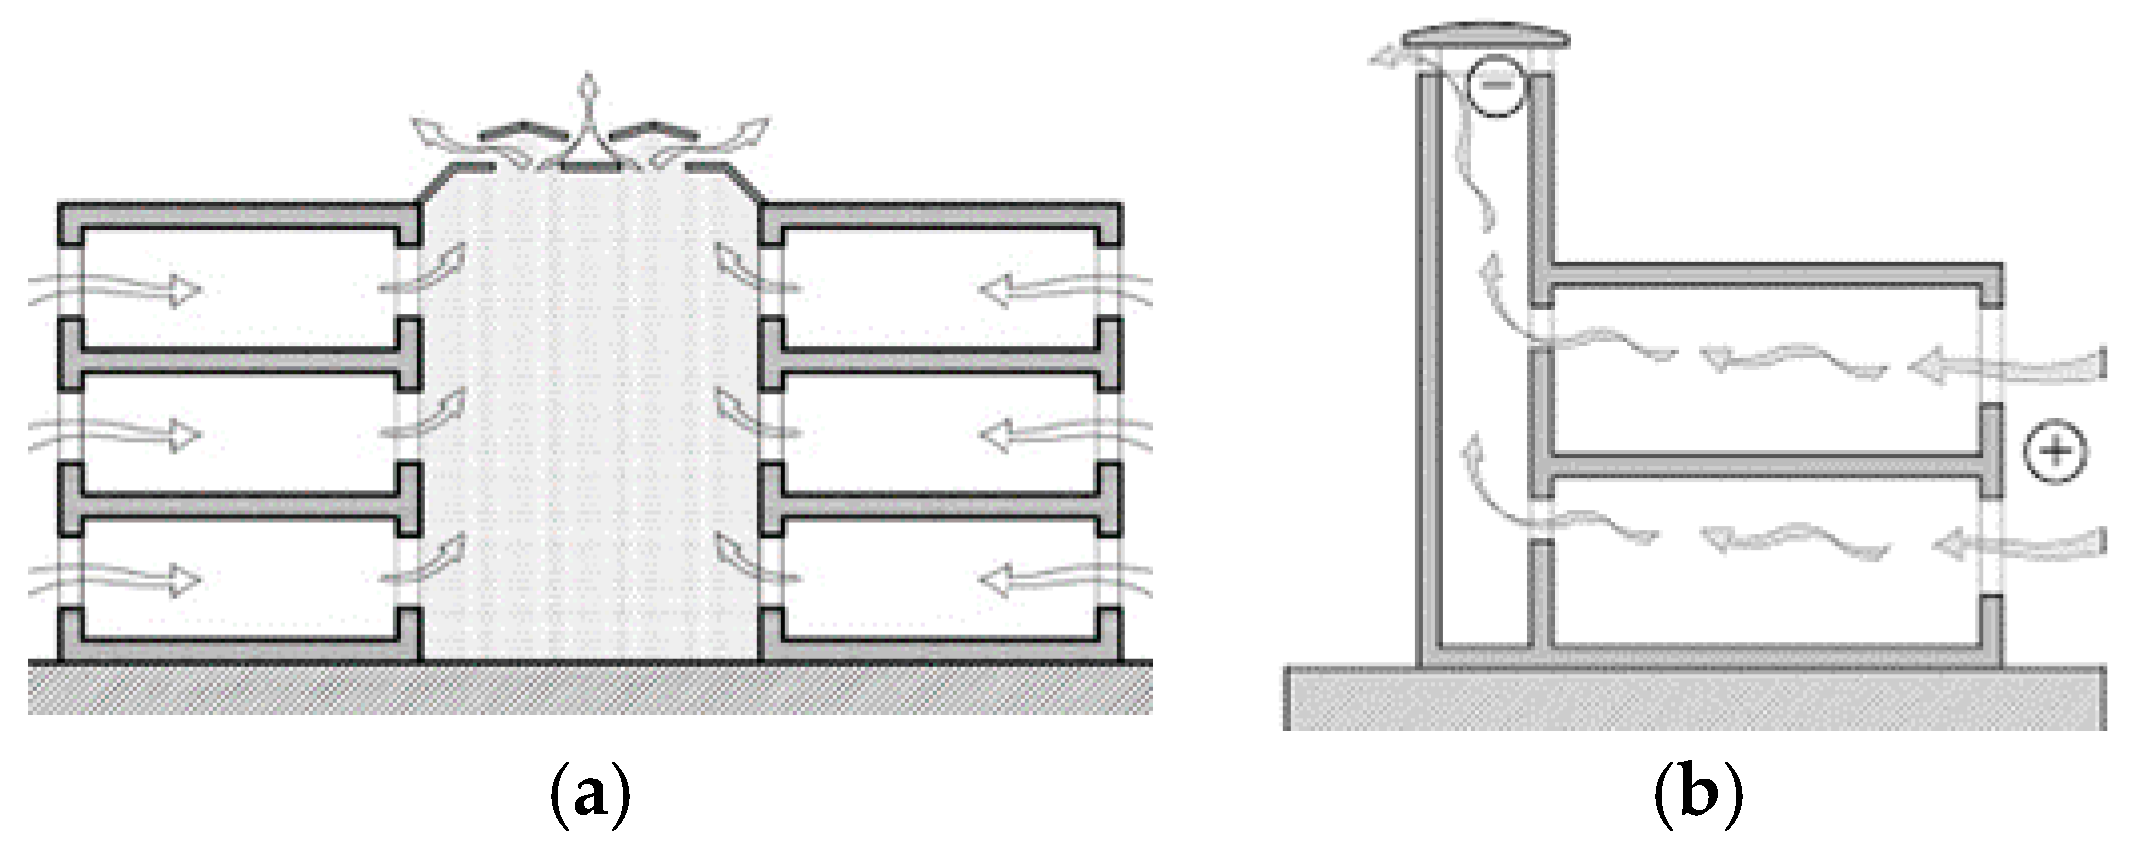
In a house with several floors, the warmer air rises to the top floors creating a pressure that is higher than the atmospheric one, differently from what happens on the lower floors, where the pressure is lower than the atmospheric one. Doors and windows play an important role in the regulation of the natural ventilation, as does the type of ventilation chimney and the number of floors, and it is their roles that this study seeks to determine through a careful analysis of various examples. There are two types of wind tower: the passive cooling court and the passive cooling tower (see
Figure 4).
Different models of ventilation chimneys were studied to obtain solutions compatible with different case studies. After defining several standard models, simulations were carried using specific software. The rooms were assumed to be of medium size (20 m
2) and the buildings located in climatic zone E. The model was created using Design Builder. Only natural ventilation was taken into account and the results were calculated for the whole day of the 21st June (summer solstice) at 12:00 p.m. and the summer period from June to August using average values. Simulations and the results for each model analyzed are described in depth in [
22,
23,
24].
The features of each model analyzed in this work are shown in
Table 1 and in
Figure 5.
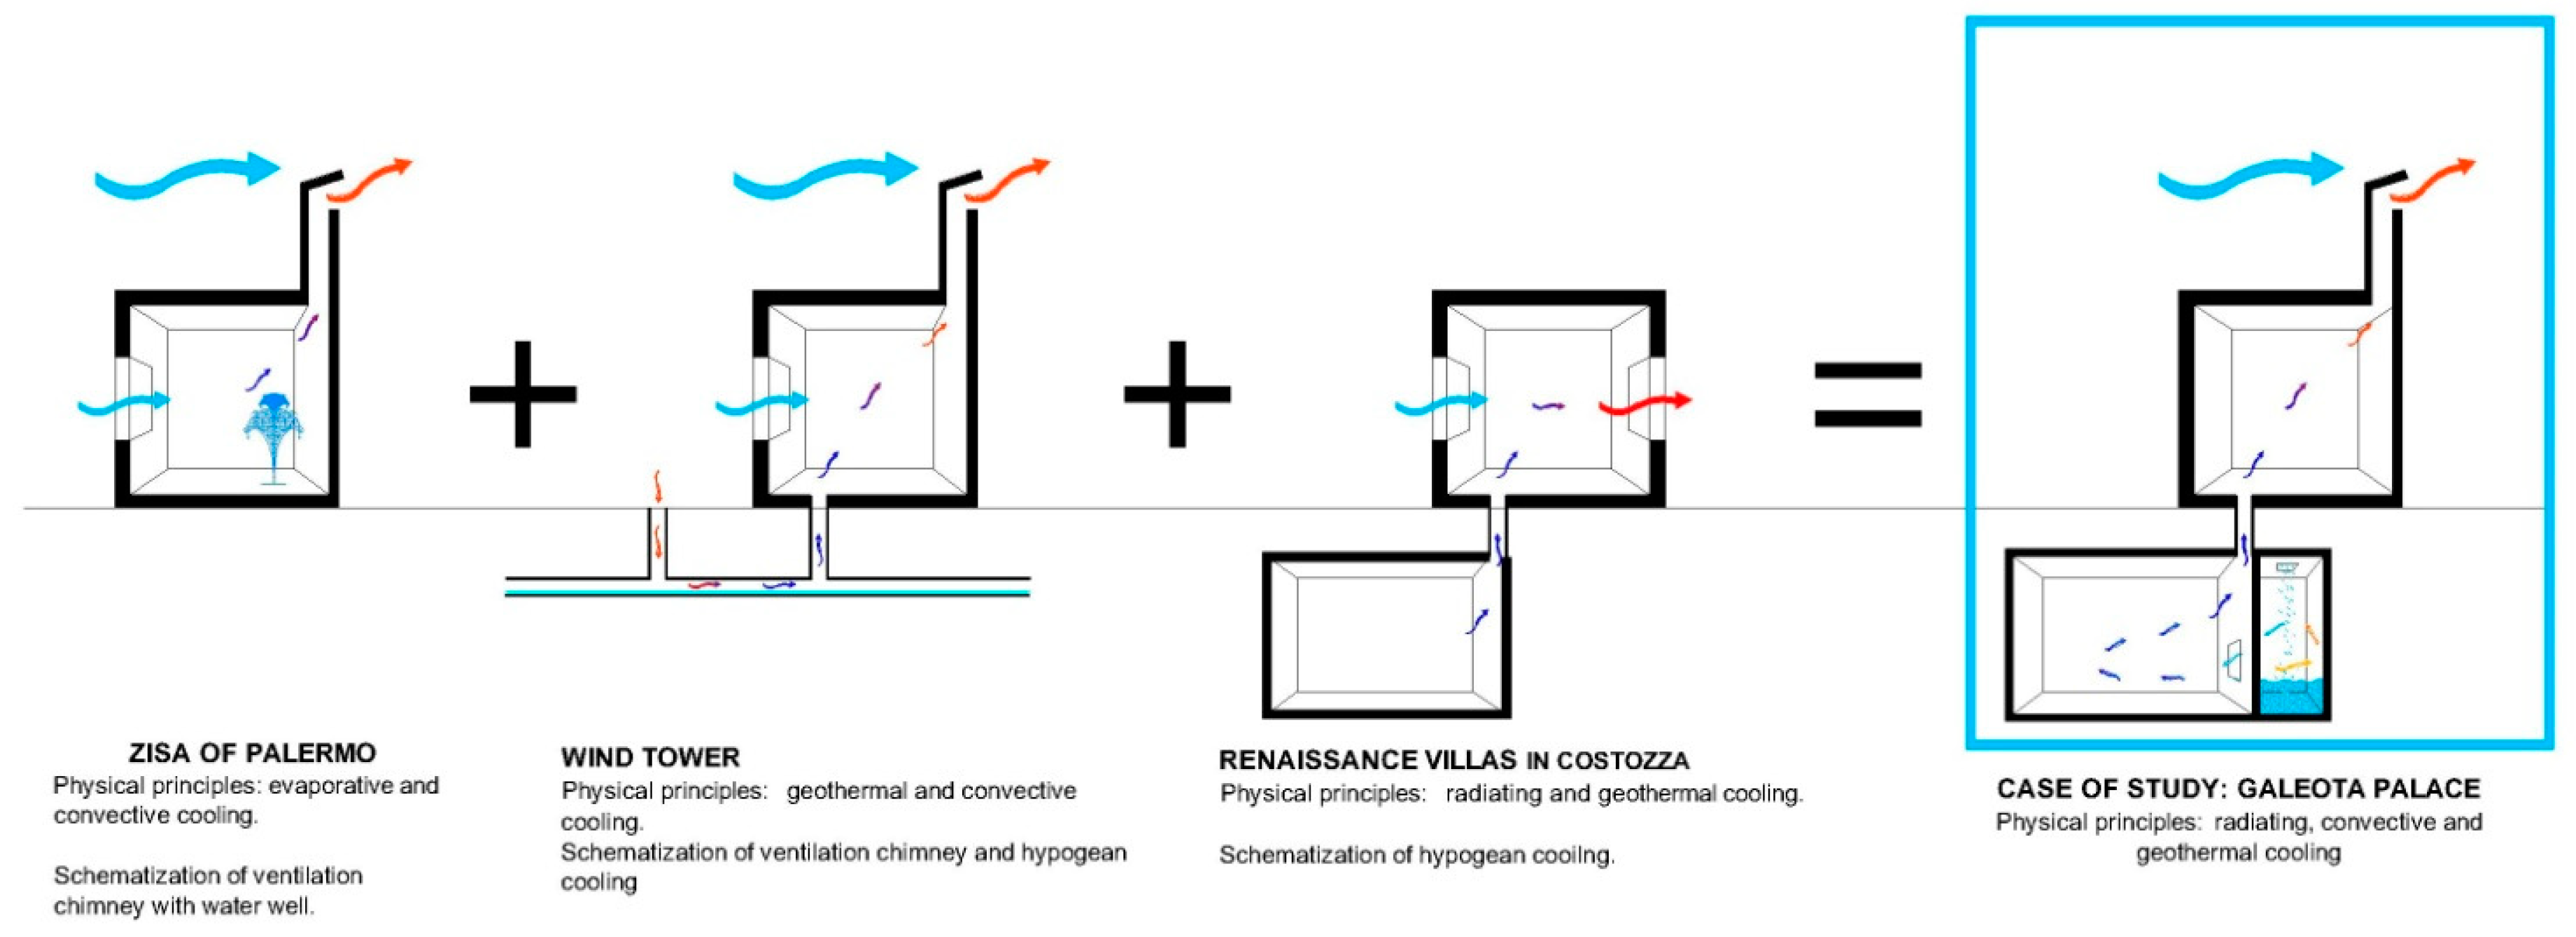
Figure 6 shows the ventilation chimney analyzed in the case study, which consists of a wind tower that connects two internal areas of the building, situated on the different levels, with an opening on the lower floor [
25,
26] as well as ducts designed to achieve passive ventilation based on the systems used in the Renaissance villas of Costozza, Torri del Vento and the Zisa di Palermo.
3. Case Study
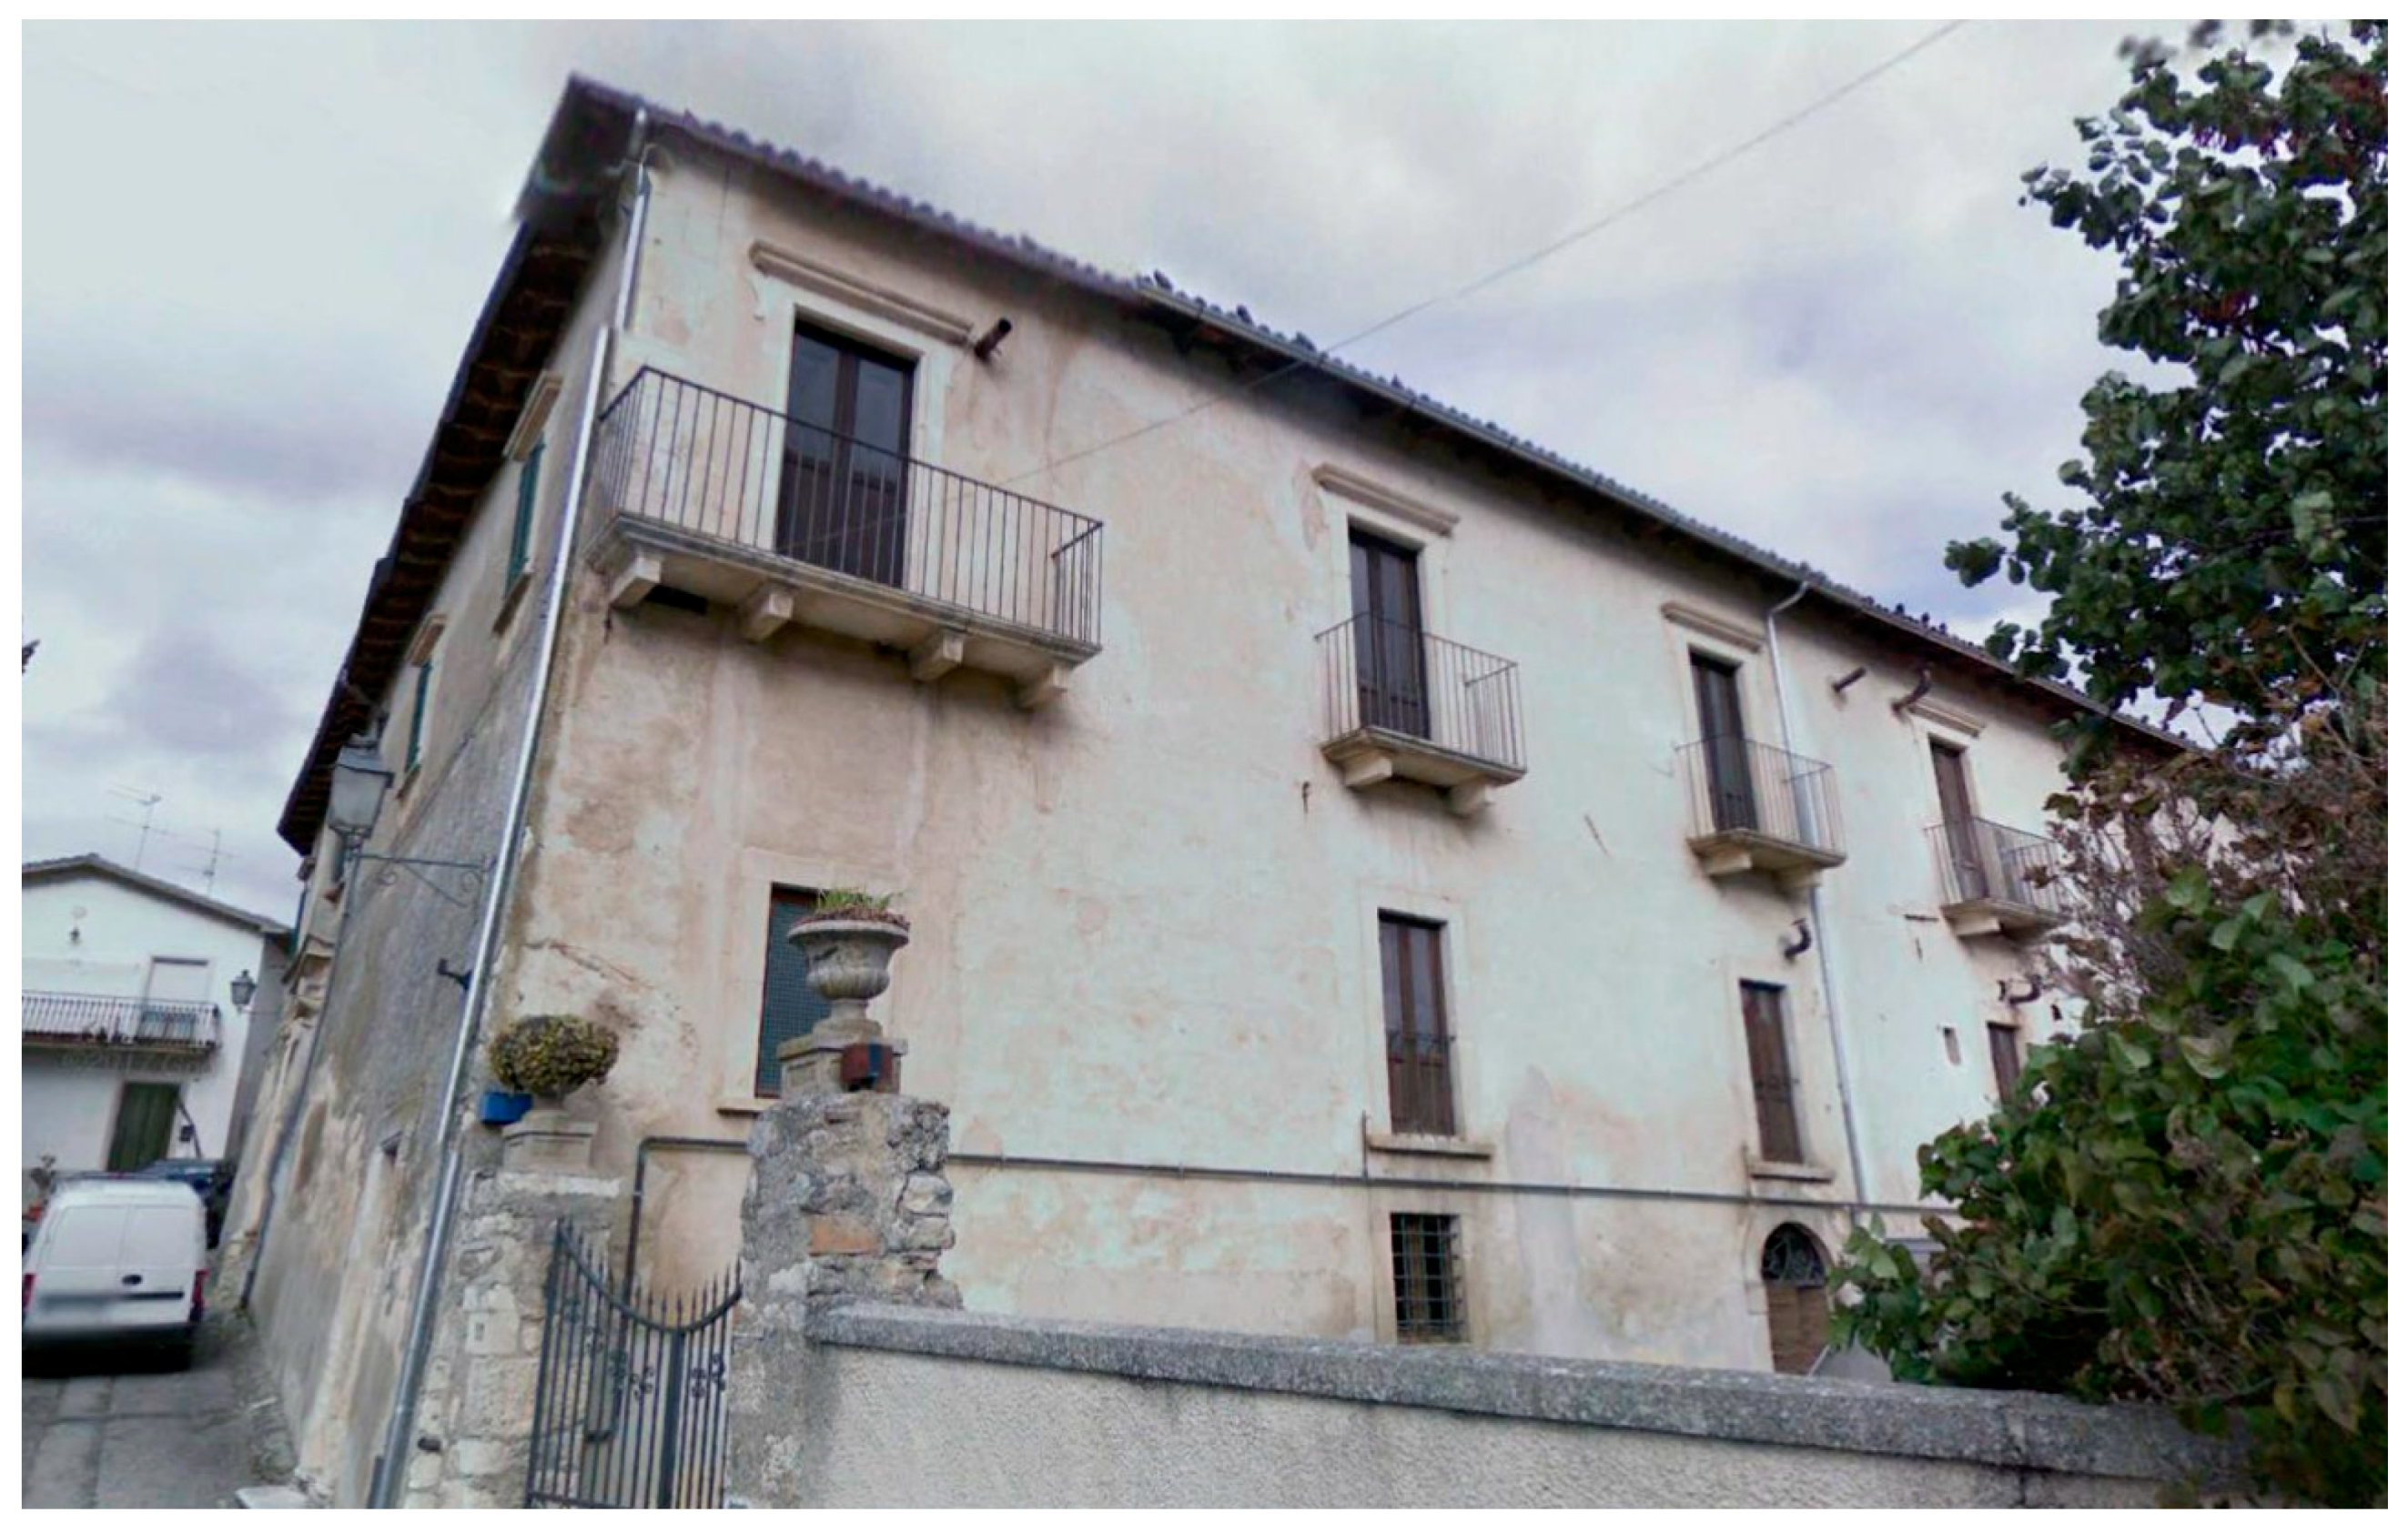
The case study is a building of elevated historical and architectural value situated in Poggio Picenze (municipality of L’Aquila) and known as “Palazzo Galeota” (
Figure 7). Palazzo Galeota was built in the 15th century over a previous underground structure. The building was damaged in the earthquake, which hit L’Aquila and the surrounding territory on 6th April 2009 and has not yet been repaired. The building suffered serious damage including the partial collapse of floors and cracks along the bearing walls; an external structure was also required to secure the external walls that were still standing. The building is constructed from mixed masonry brickwork stones and the roof covering is wood; these materials have been conserved over the years and to this day many original features are still present. There was no thermal insulation in vertical, horizontal or inclined structures and the windows are the original ones in wooden frames and single pane glass.
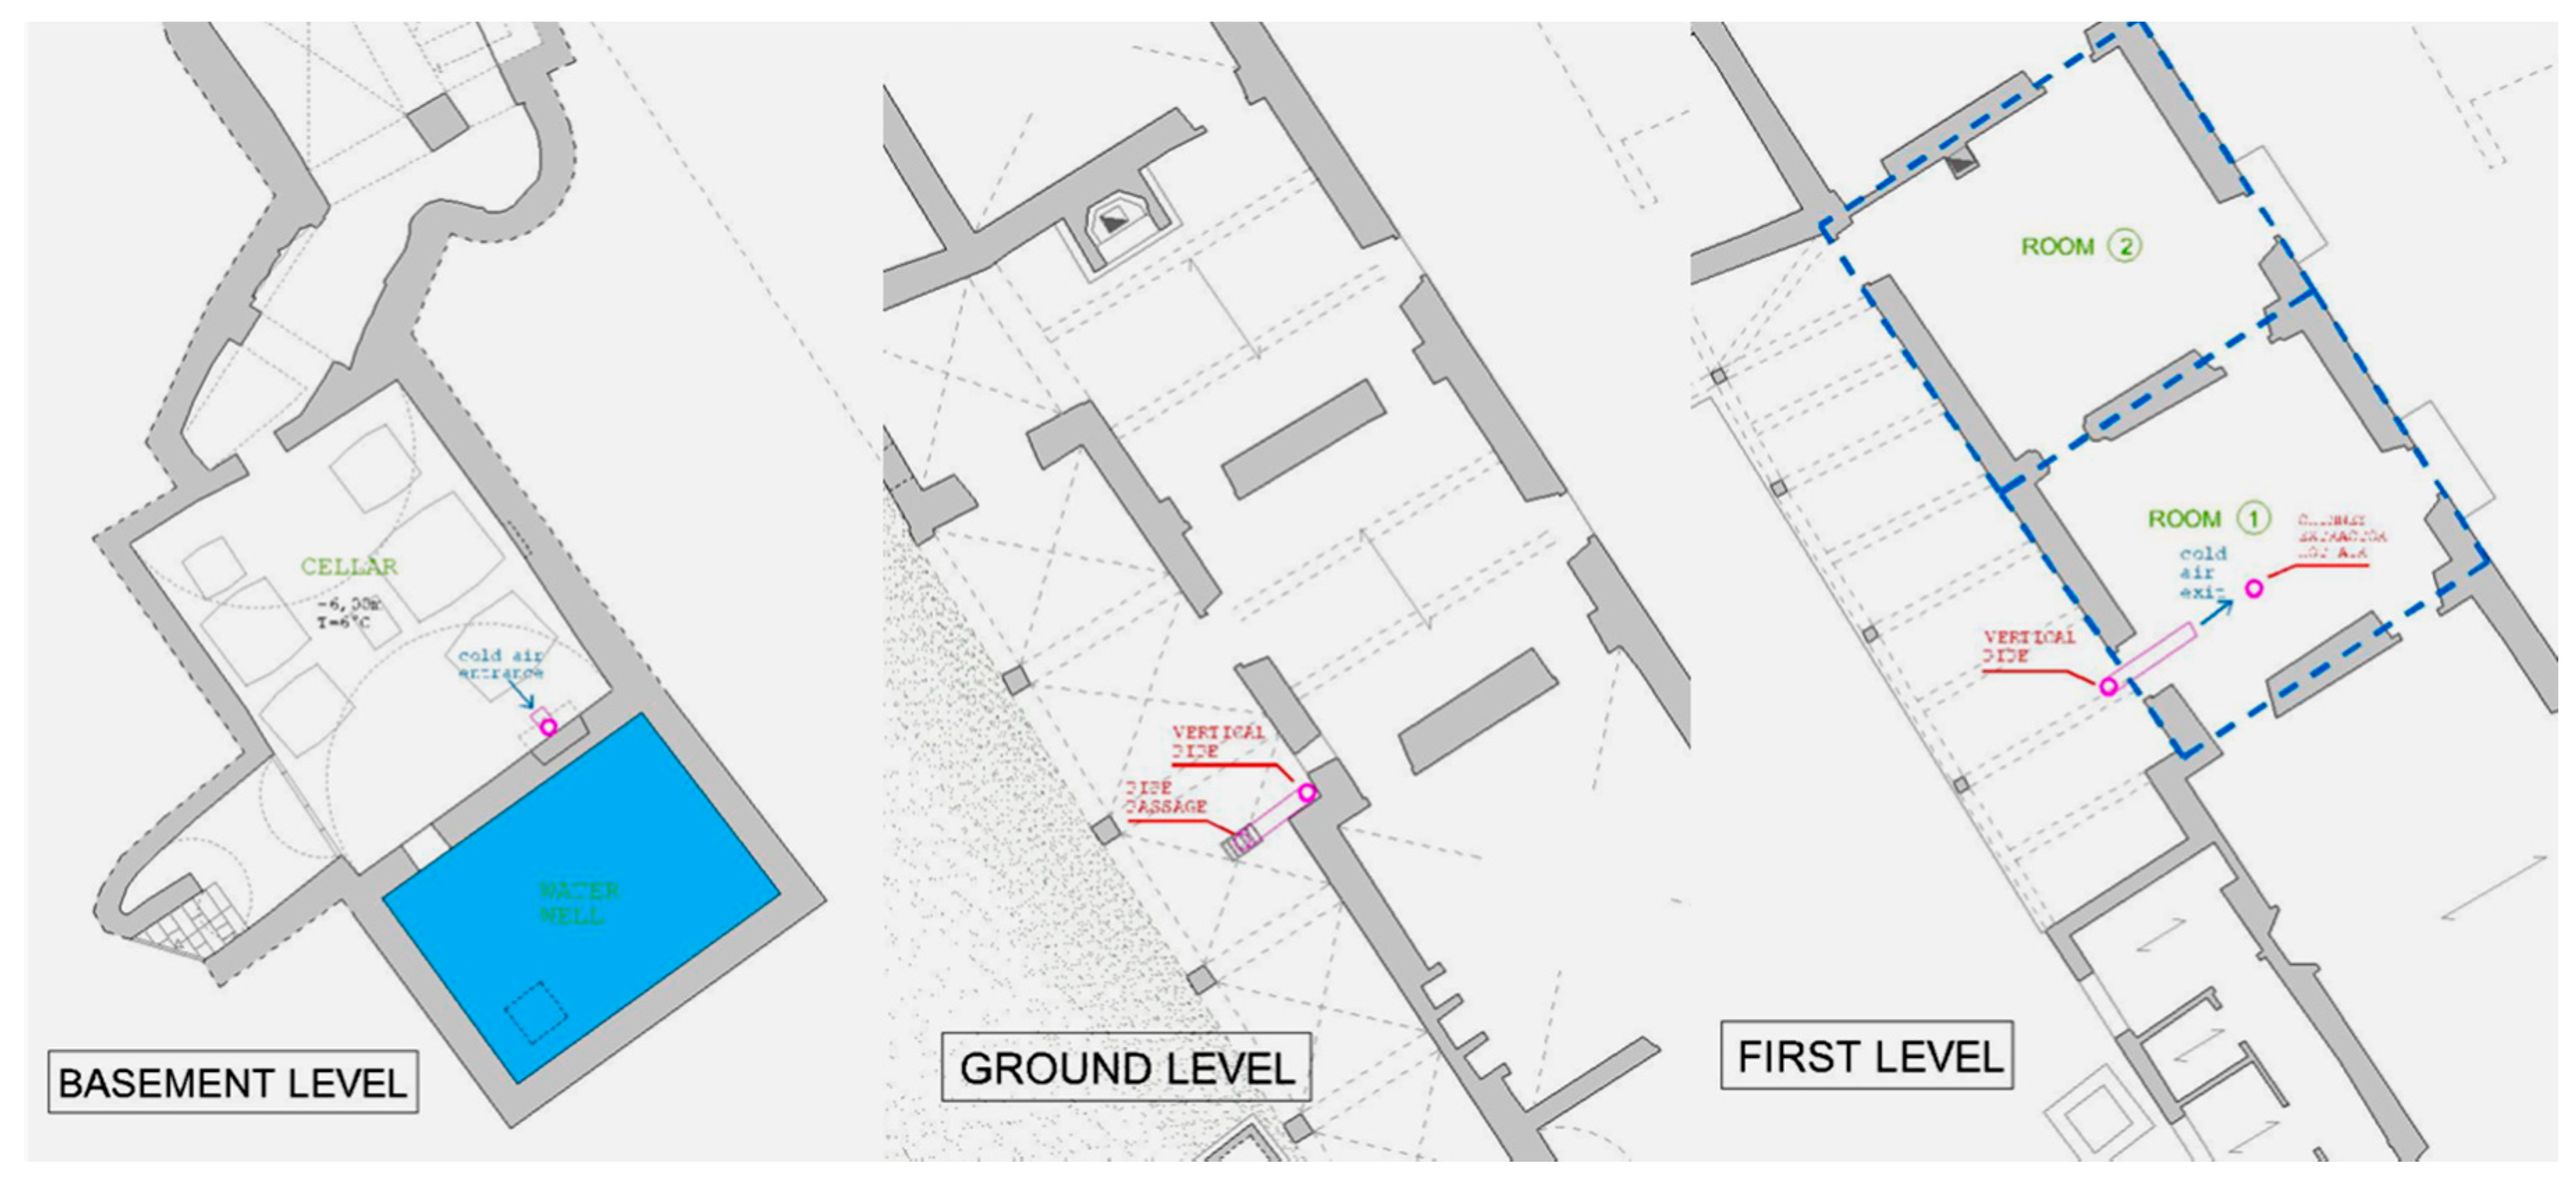
The Palazzo has an interior court structure consisting of two floors above ground and one below. There is an open well on the underground floor as well as rooms and a wine cellar. The floors above ground are characterized by internal loggia, whilst the underground floors can be accessed by a staircase from the internal courtyard. The main entrance to the palazzo is along Via Galeota, which leads into the entrance hall that acts as a horizontal connecting element: from here, the internal court can be accessed as well as the whole length of the loggia and other rooms.
From an energy point of view, the structure is inefficient during the winter but more efficient in summer, mainly due to the massive covering o thick walls that guarantee high thermal inertia of the system, therefore maintaining comfort temperatures—however, not on the first floor where rooms directly in contact with the light wooden roof covering were exposed to solar radiation making internal temperatures uncomfortable during the summer months.
It is possible to assume that there is a different internal temperature between the three floors (underground, ground floor and first floor) due to the intrinsic and material characteristics of the building, besides that of the solar exposure of the whole volume of the roof covering. The underground floor has particular potential with regards to passive cooling as the average temperature registered during the days from 1–15 April was 6 °C. The humidity from the open well helps to obtain the lower internal temperature and there is very little variability between day and night regime, both in summer and winter.
3.1. Installation of the Ventilation Duct
As has been fully described elsewhere [
22], a duct connects the basement to room 1, transporting cold air from the underground room up to the first floor (
Figure 8 and
Figure 9). As the original windows were removed as a result of the 2009 earthquake, the openings were sealed with a PVC sheet to guarantee the room the same solar gains. This certainly favored incident solar radiation and an increase of indoor temperature, producing a hothouse effect similar to glazing.
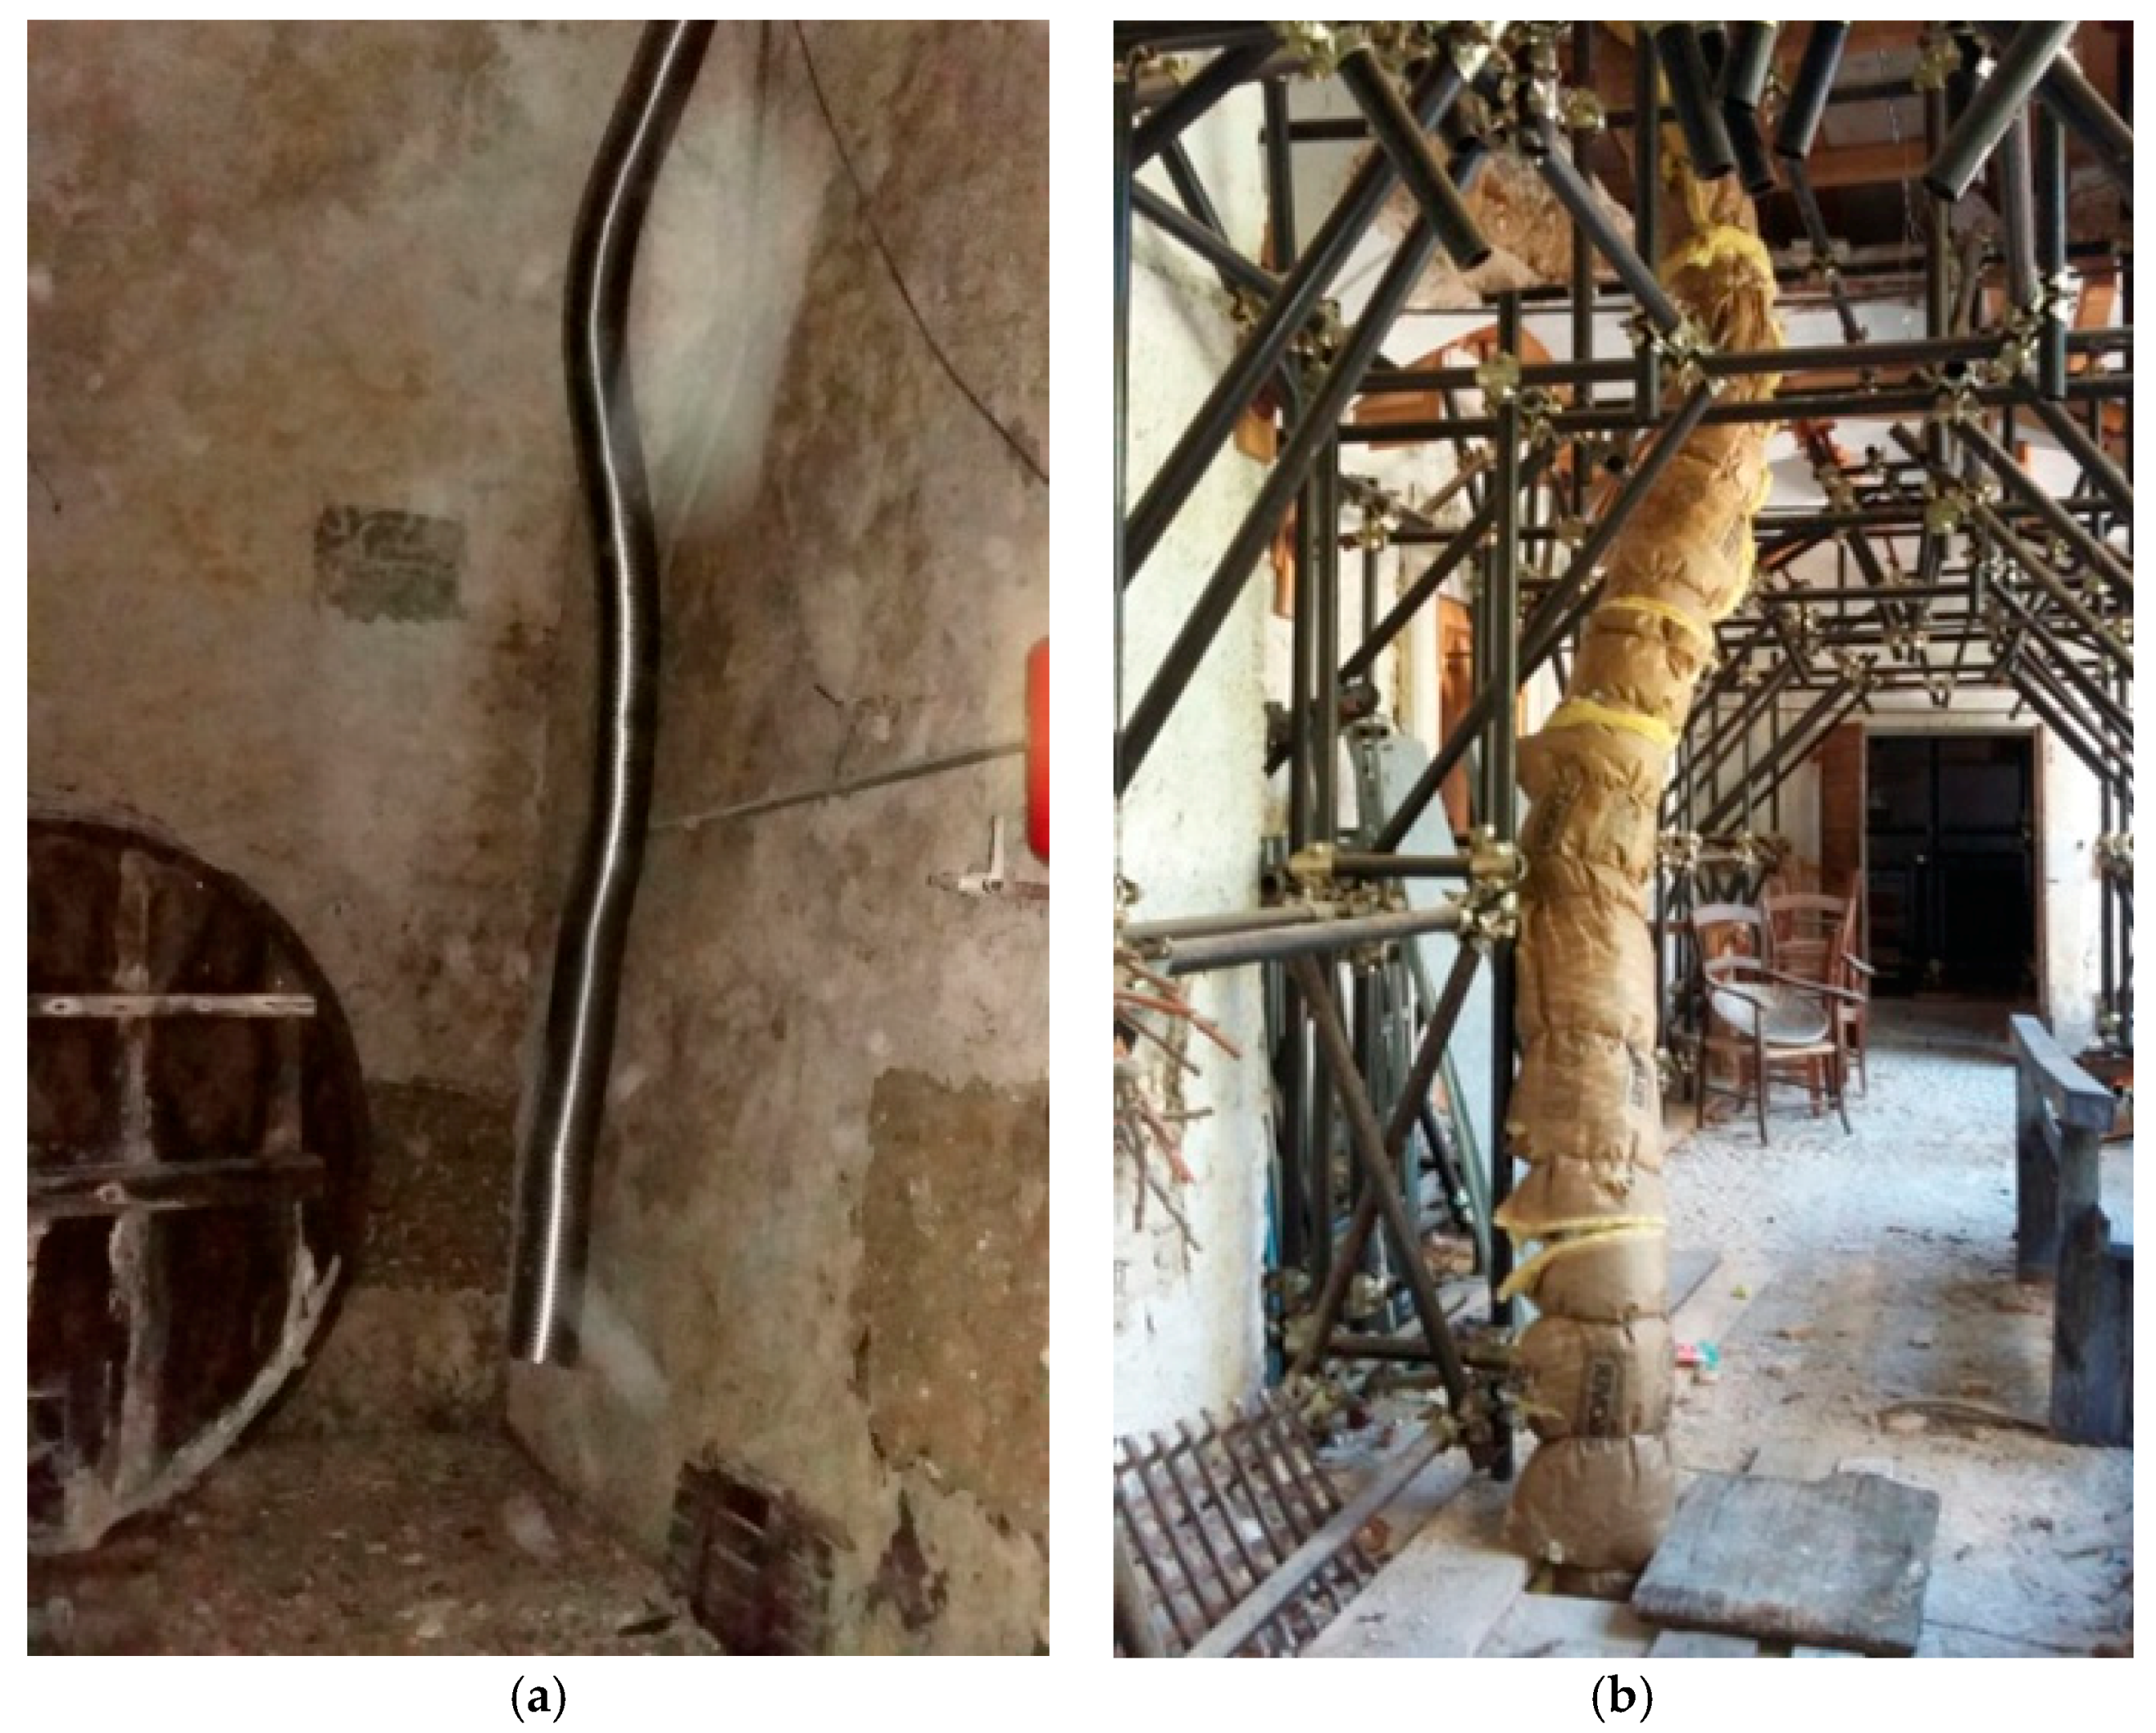
The type of duct used was one compatible for the re-use of existing flues. The tube had a diameter of 250 mm and is made of a conductive material (metallic) to allow external heat exchange by enhancing the movement of the air through differences in temperature and pressure (
Figure 10). In addition, during the monitoring campaign, it has been verified that the insulation of the duct does not lead beneficial effects on ventilation capacity. The investigated rooms are oriented to the south in order to simulate a more disadvantageous condition in terms of internal comfort due to the higher overheating inside caused by exposure.
Measurement and Calibration Instruments
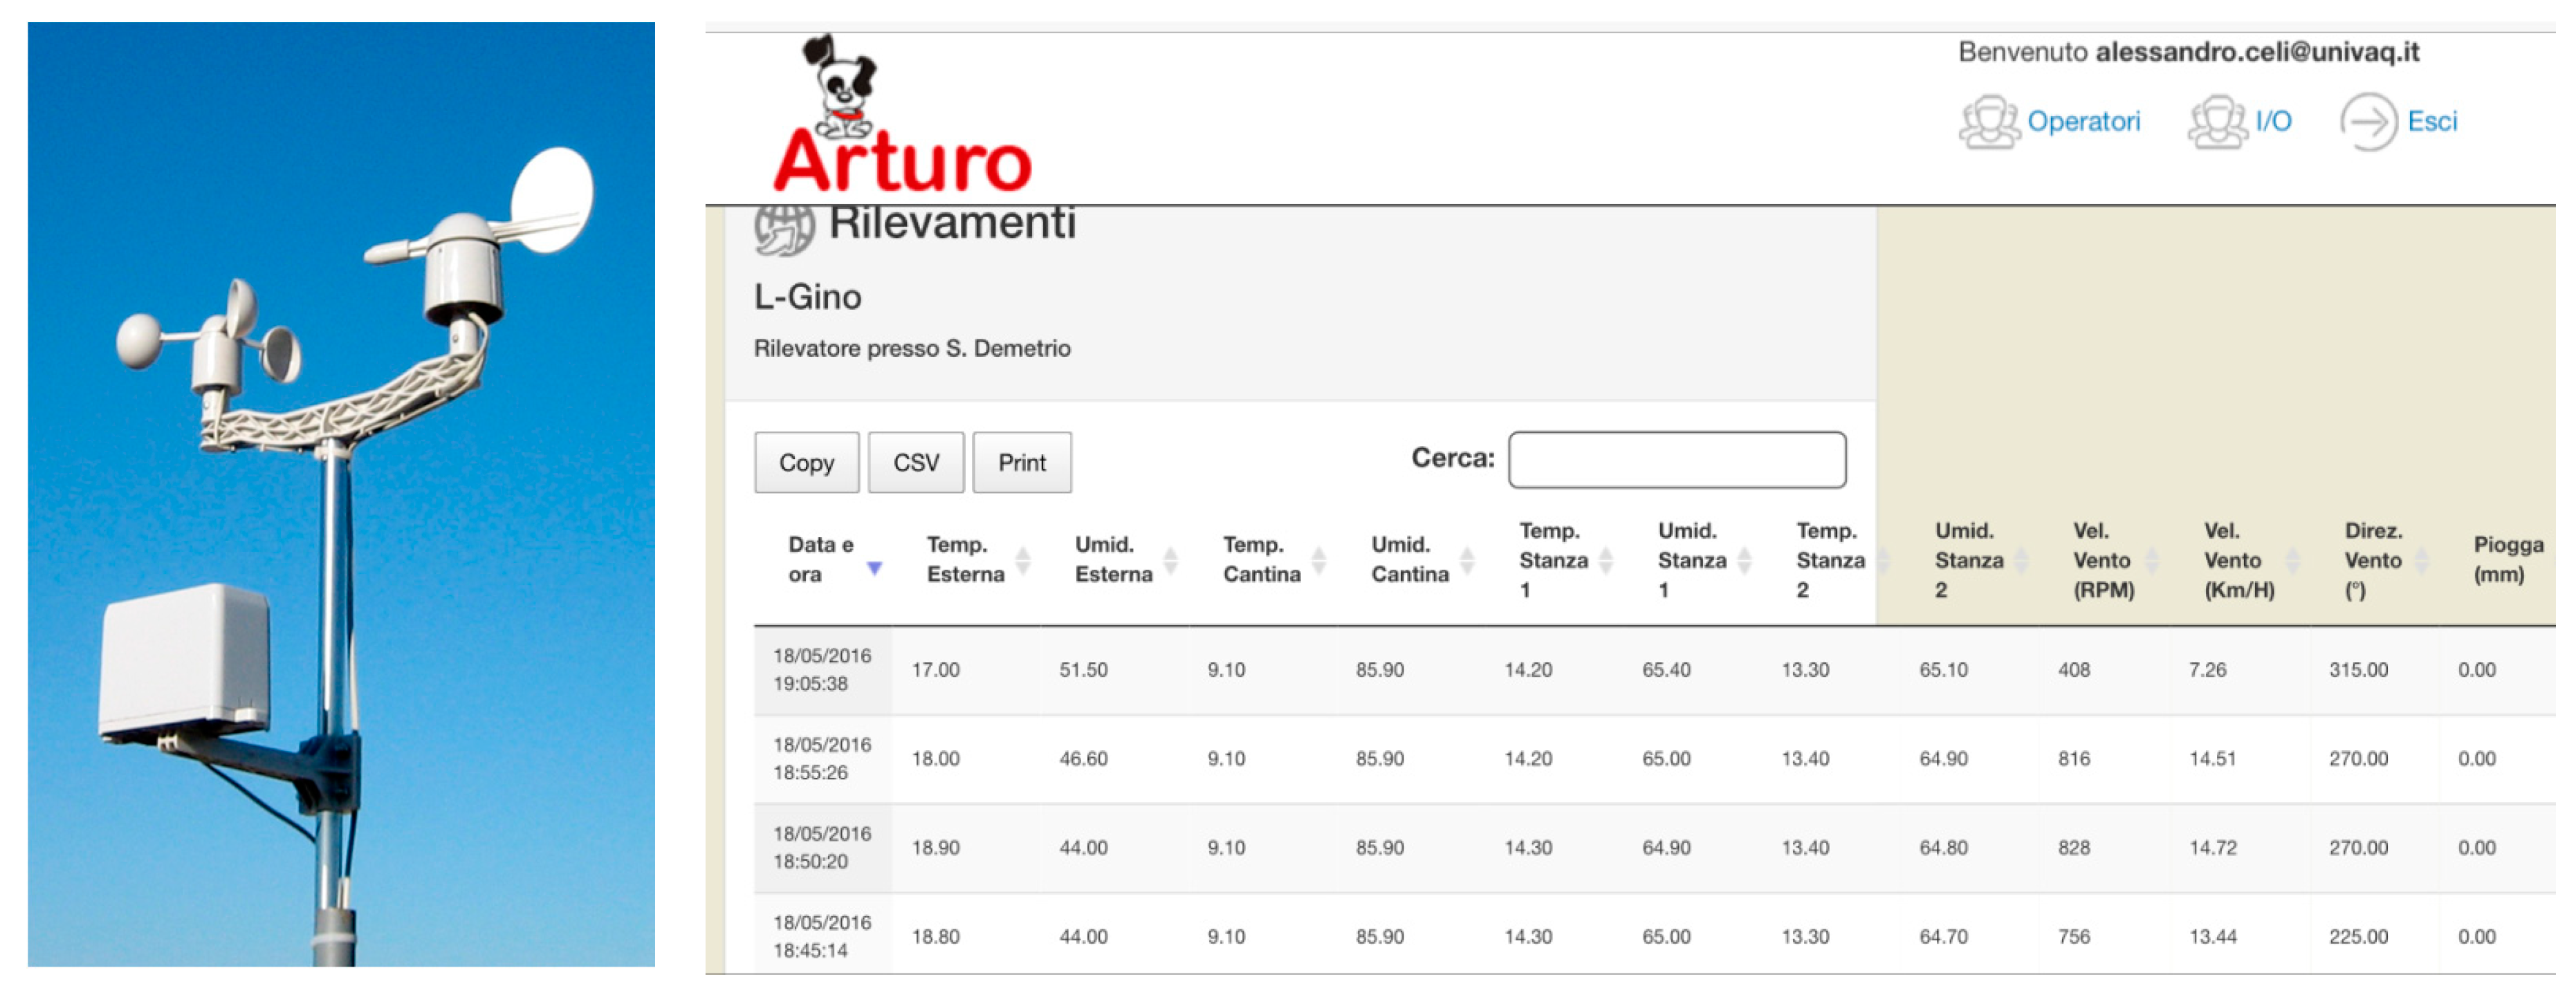
Electronic monitoring enabled us to obtain the data in real time for this study. Sensors for temperature, humidity, rainfall, wind direction and an anemometer were installed (indoor air quality was not monitored in this study but would prove of interest in future studies) (
Figure 11). This sensory network was made up of elements able to measure, elaborate and send data to a central station and incorporated a network protocol for communication with the various sensors, an application necessary for the treatment and memorization of the data, an external interface for the consultation and analysis of data, a database as well as a web server with a specific web application (
Figure 12).
A sensor network structure usually provides several wireless nodes, or when possible wired, distributed in a well-defined area, which periodically send the data surveyed through sensors to a collection point (known as sink or base station or gateway). In the collection point, data is gathered and sent to another remote system for recording and further elaboration. In this setup, the sensors were used to monitor rooms 1 and 2, the cellar and the external climatic conditions through a weather station installed on the roof.
The section in
Figure 13 shows the position of the sensors. There are two sensors for temperature and relative humidity in the hypogeum cellar, room 1, room 2 and outside. There is also a weather station positioned on the roof for the recording of atmospheric pressure, rainfall, anemometer and wind direction data.
It was not possible to insert other sensors inside the duct.
3.2. Simulation Output with Software Design Builder
The building was modeled using Design Builder, so the conditions of the building before and after the duct installation were analyzed with a simulation instrument.
With Design Builder, it is possible to perform accurate studies of thermal masses and natural ventilation flows according to external meteorological conditions, under the control of dynamic programs of operation (Energy Plus). In particular, Design Builder allows us to determine the mass of air exchanged between internal and external environments as well as between differing zones of the model, through the openings, as a result of wind and differences in pressure. After selecting the checkbox under the natural ventilation header, the Outside air definition method allows us to select the method to be used to set the maximum outside air natural ventilation rate. In this case, the options used were “by zone” and the zones in the model connected by holes were merged.
Only one wing of the building was modeled (
Figure 14).
Figure 15 shows the outline for the modeling of the hypogean level and rooms 1 and 2 of the first floor. The duct was simplified to represent a true and proper ventilation chimney. Residential use was assumed for the two rooms in the simulations, so metabolic activity was set to 1.2 (relaxed) and typical indoor clothing to 0.5.
4. Results
Four temperatures were measured: air temperature, radiant temperature, effective temperature and dry bulb temperature.
In order to confirm the validity of the dynamic simulation carried out with the Design Builder software, the results obtained with the software were compared with those of the monitoring.
4.1. Simulation Results
What is obtained simulating a ventilation with the use of a chimney, having modeled a duct, is a significant fall in the temperature of room 1 with respect to room 2 of about 2.5 °C. Similar benefits were not obtained for humidity. The humidity values in rooms 1 and 2 are due to the presence of the open water well on the hypogeum floor from where cool air comes. However, since the operating temperatures registered in room 1 differed from that of room 2, the comfort checks for the two rooms led to different results [
27]. See
Table 2 and
Table 3 and
Figure 16.
4.2. Monitoring Campaign and Experimental Data
After the installation of the sensors, data was recorded and monitored from May through to the first week of September. During this period, the building was monitored under seven different configurations (
Table 4), to verify and optimize the system according to the different weather conditions and surroundings. These configurations related to different periods Time 0, Time 1, Time 2, etc..., as shown in
Table 4 and
Figure 17.
The seven configurations analyzed have been designed as follows:
The data was recorded every five minutes throughout the day. Although the data were recorded every 5 min during the day, the time chosen for the analysis of the duct operation corresponds to 12:00 p.m. because the difference in external and internal temperature was at its greatest. During the first monitoring period, the data relating to two rooms, at T0, were recorded keeping both rooms insulated and the duct closed to establish basic measurements for comparison.
The analysis of period T0 revealed a temperature difference of about a half degree (ΔT = 0.50 °C) and a relative humidity difference of ΔU = 0.32% between the two rooms. These differences were taken into consideration in the subsequent analyses.
The following table shows the data for the various periods monitored with the corrective factors for Room 1 (
Table 5):
Comparing these recorded data with standard comfort conditions, a relative humidity of between 40–60% and a comfort temperature between 20–26%, the results closest to achieving optimal indoor comfort were obtained in the summer period, from July until the first week of September (T4, T5 and T6). The relative humidity varied significantly between the two rooms, due to the presence of the duct in room 1 that lowers the level of relative humidity in the room. Graph summarizes the differences in air temperature in the seven periods analyzed (
Figure 18).
The graph registers the temperature on the
y-axis and the days monitored on the
x-axis. The whole period has been divided into seven periods: from T1 to T6. The external temperature is in orange, the temperature in the cellar—blue, Room 1—red and Room 2—green. In the first monitoring period, the temperature in room 2 is lower than in room 1, while, in the last period, the curve overlaps and is often reversed. This is because, during the first monitoring period, the system is still not yet fully operational and by the last period there is optimal operation. The following graph illustrates the relative humidity of the two rooms, the cellar and the outside and wind velocity (
Figure 19).
The red line represents room 1 with the duct whilst the green line represents room 2. The green line follows the external relative humidity (purple), whilst the relative humidity in room 1 (red) decreases during the hotter months when the system becomes operative. The intensity of the wind also influences the humidity of room 1: as the intensity of the wind increases, the relative humidity decreases thanks to the presence of a chimney on the roof that increases the pulling force of the duct. In period 5, the relative humidity sensor in room 1 malfunctioned due to a technical problem.
5. Discussion
The monitoring shows how the ventilation chimney improved comfort conditions during the summer months. It is therefore possible to achieve comfortable indoor conditions in a temperate Mediterranean climate without mechanical means [
17,
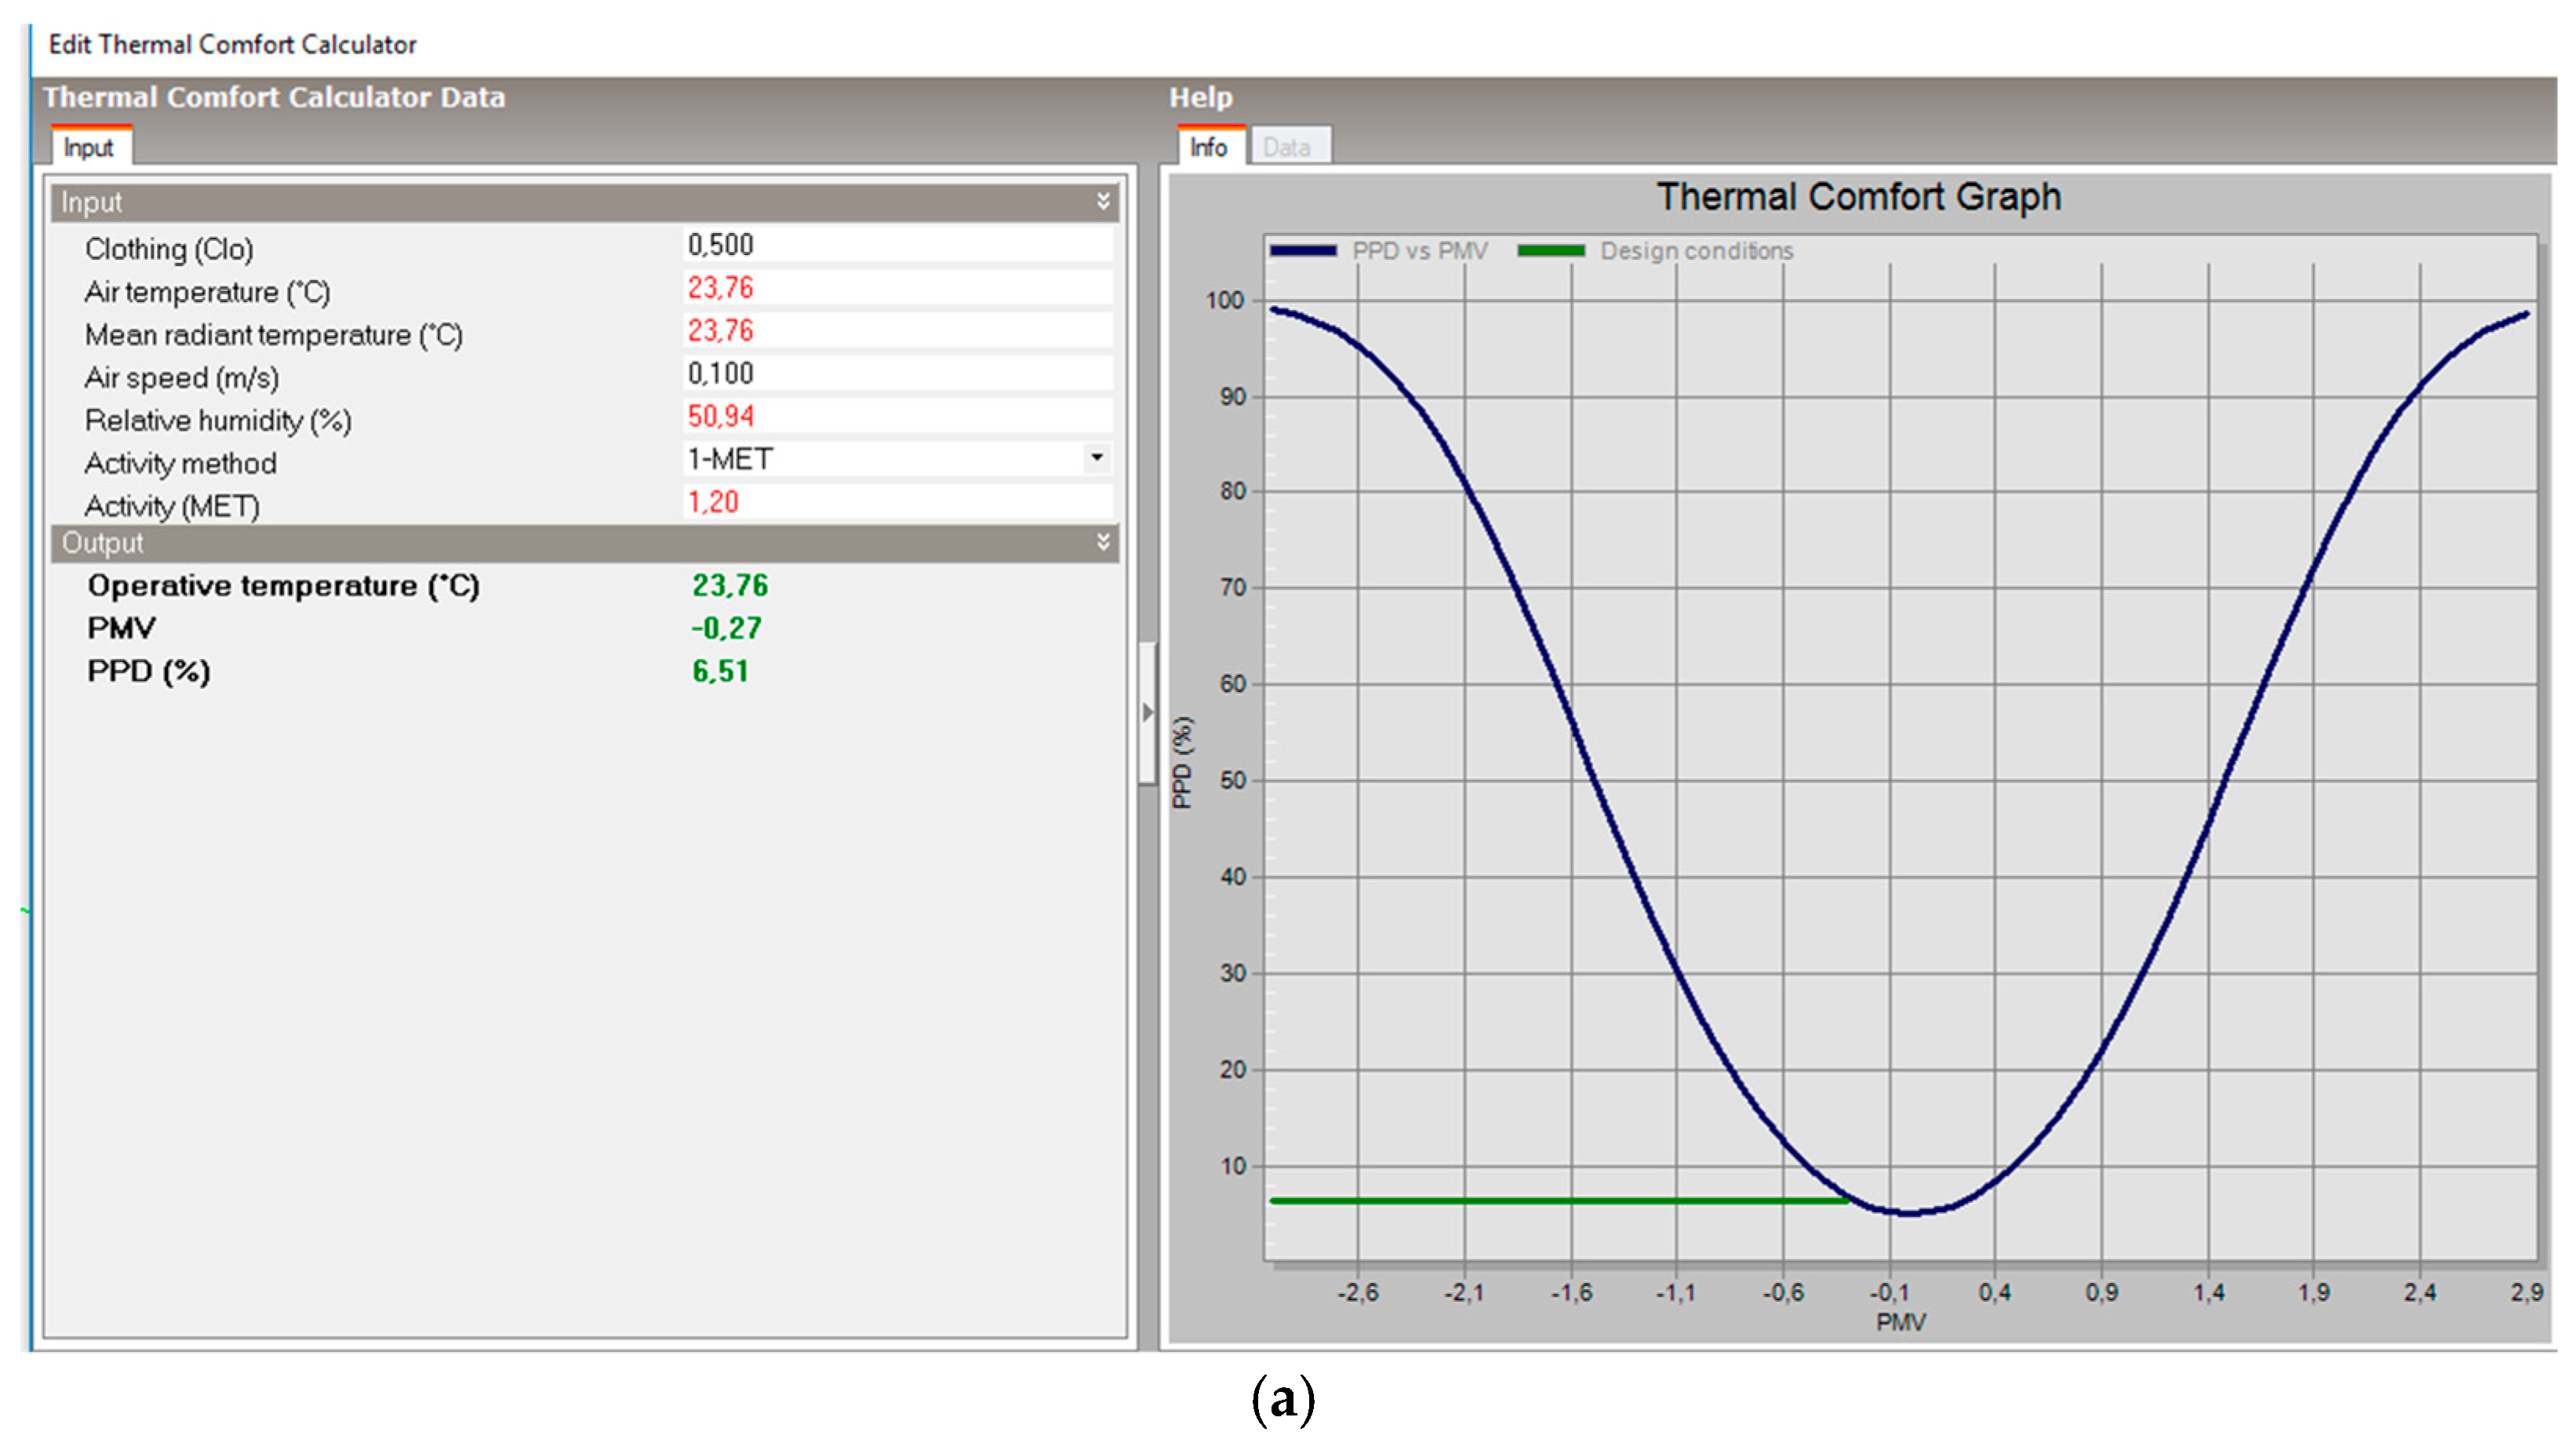
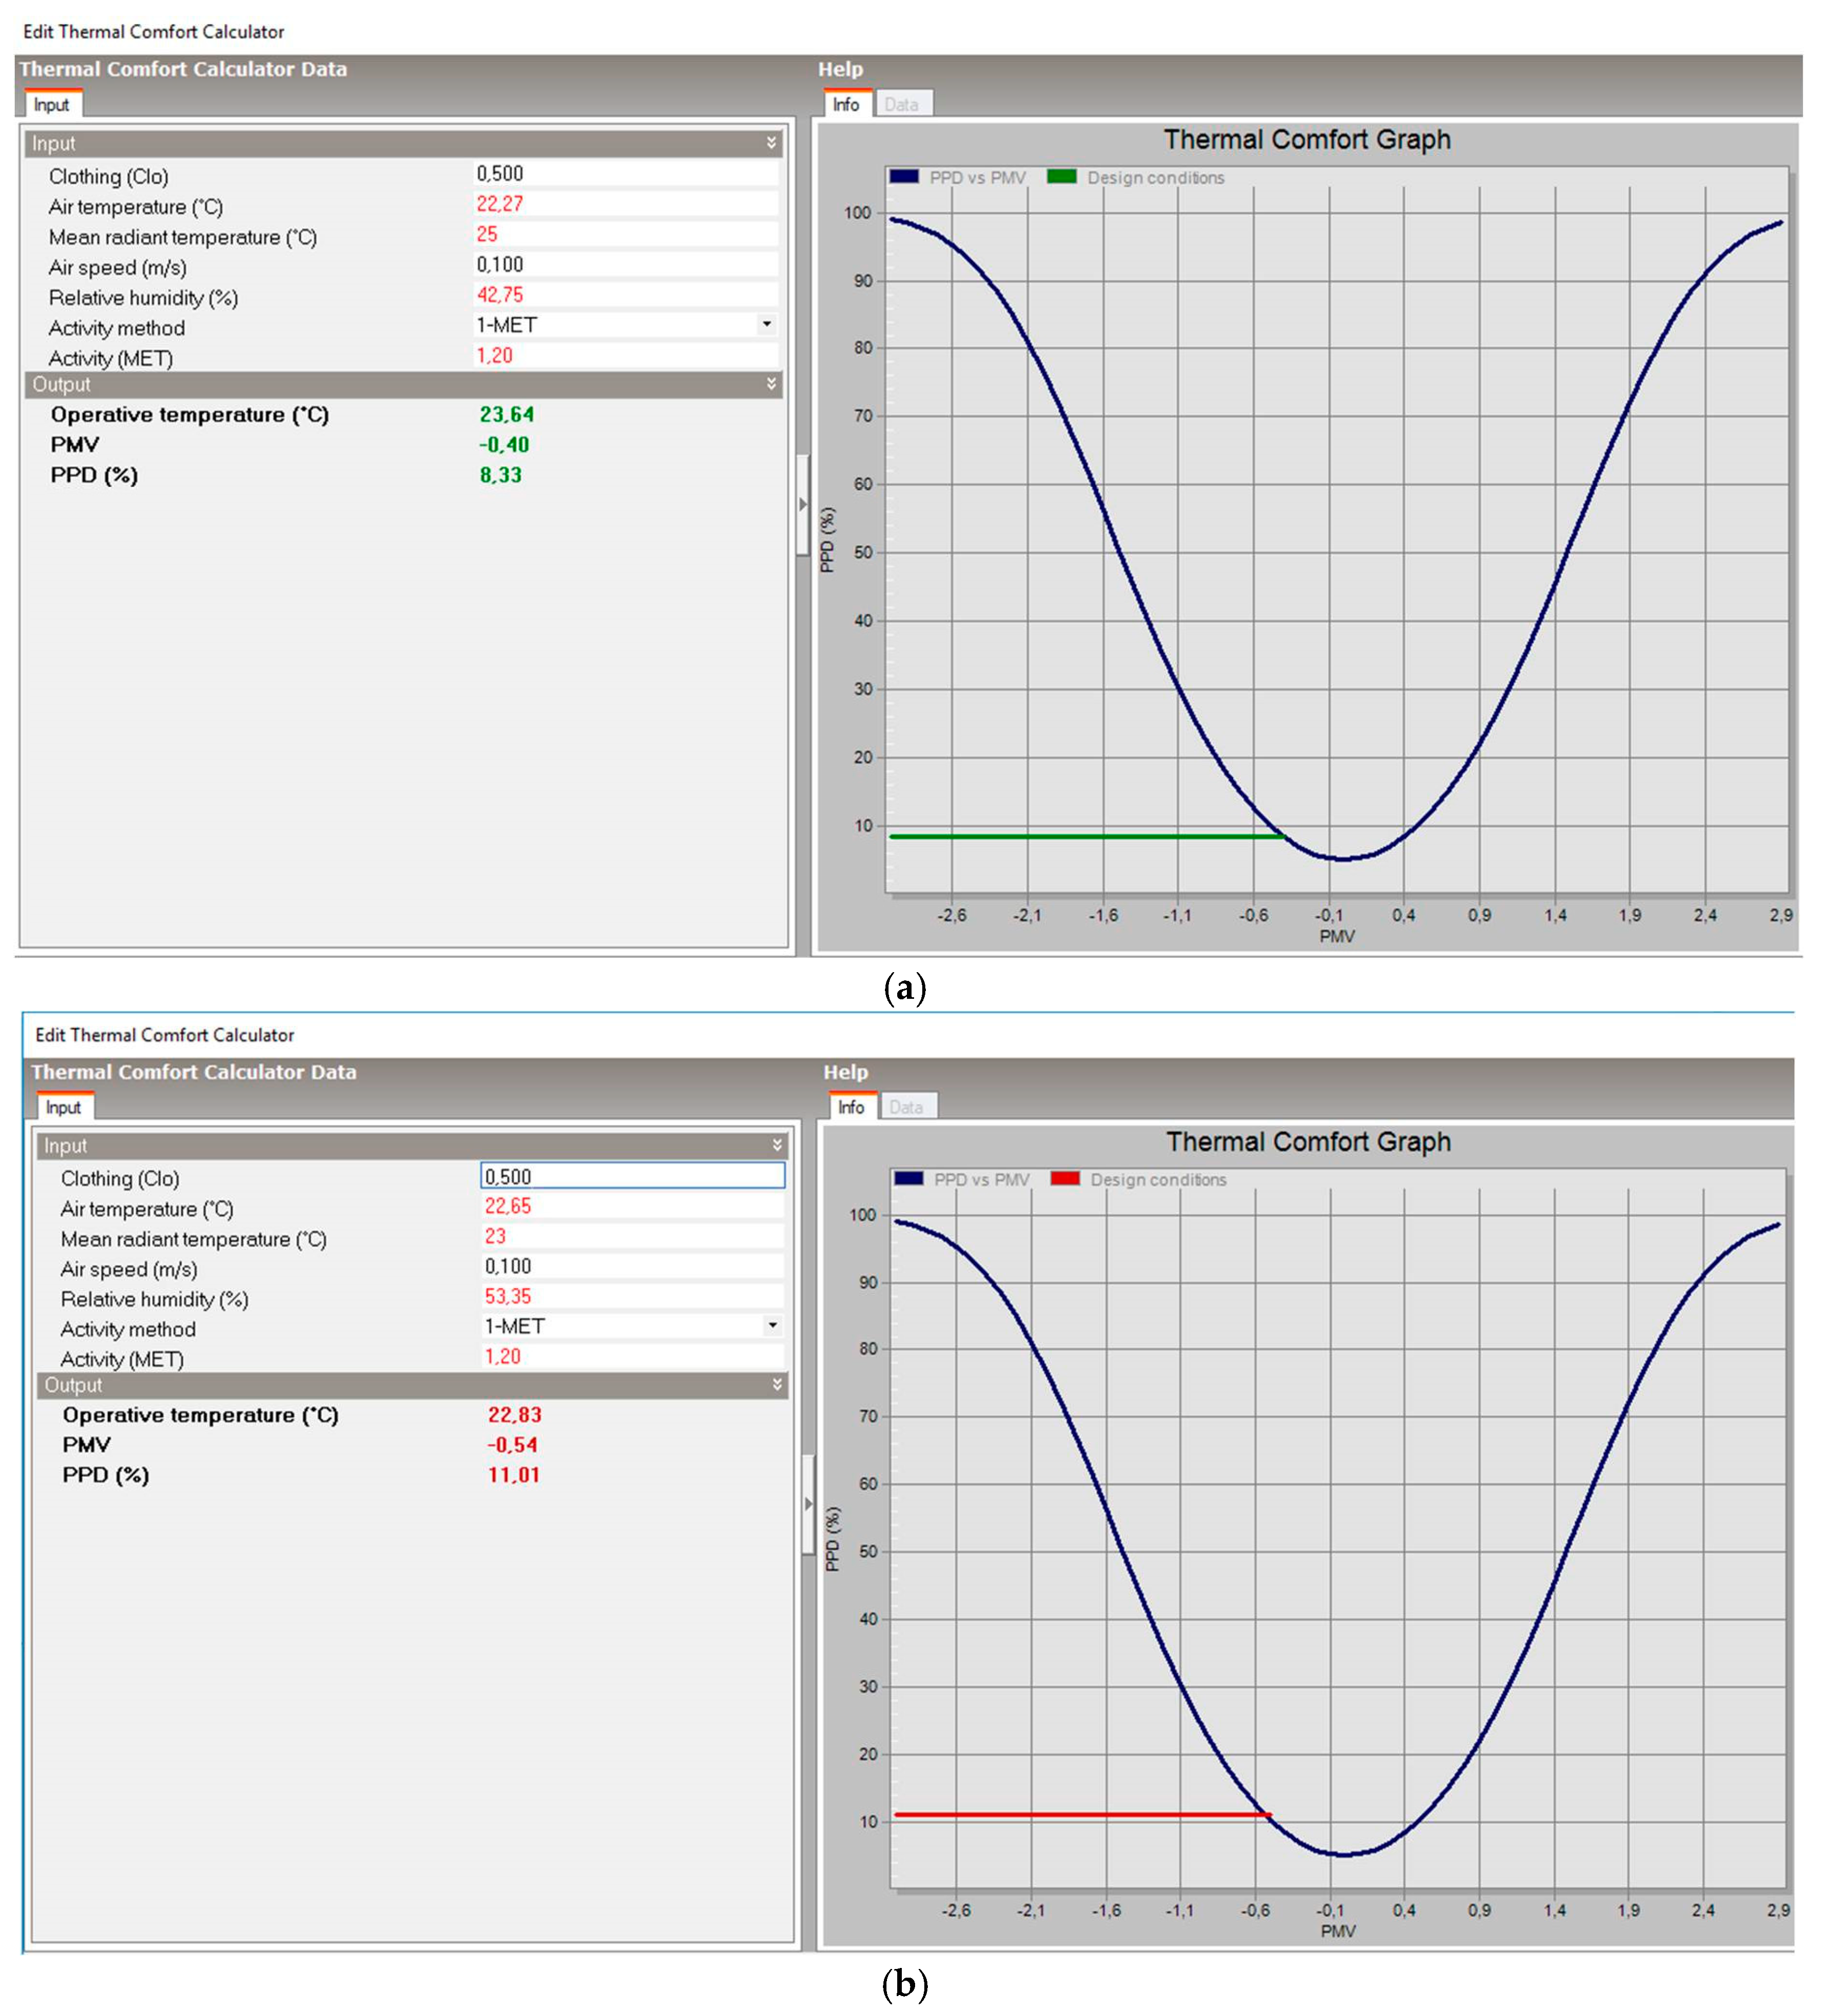
21]. By analyzing the data from the varying configurations, it emerges that the best results were obtained in T3, T4 and T5) and that even a slight variation in the relative humidity modifying the internal comfort manages to gets parameters verified inside the room (see
Figure 20).
The results of the schematic modeling, the realistic modeling and the data actually detected were very similar with regards to temperature (
Table 6). However, the data regarding the humidity was not reliable. This was because the real outdoor humidity was much lower than that estimated in the climatic data of the software (46–58%).
Table 5 illustrates the variation in data in percentages between the models.
As is clear from
Table 6, the values of the models and the monitored data are reliable within a 6% error margin. In the real installation, however, a significantly different percentage was observed with regards to the schematic model; this was probably due to the climate file of the model simulation containing historic rather than current data.
It is possible to affirm that monitoring allowed us to verify the validity of the simulations involving the ventilation duct during the warmer months: and, indeed, the research shows that a ventilation duct assists the achievement of adequate level of comfort for residential settings. Furthermore, although the consequent energy savings were not calculated in this study, it would be logical to conclude that energy consumption would fall as a result of the reduced use of air conditioning systems.
In conclusion, although the use of a ventilation chimney cannot always be optimized in historic buildings, the advantages that its installation brings to the thermo-hygrometric conditions of the living environment are nevertheless significant. The installation of the ventilation duct in the historic building “Palazzo Galeota” is an example to be followed employing passive ventilation and the optimization of existing cavities or the integration of new devices with a low impact on pre-existing structures.
6. Research Developments
A further area for research will undoubtedly be indoor air quality and the evaluation of the benefits of natural ventilation and cooling systems [
7]. The system installed in this study has shown how to draw on natural resources, such as cool air from hypogeal areas that have constant thermal characteristics throughout the year, being below ground. However, these hypogeal rooms are often used as cellars and warehouses and the lack of airflow often results in the growth of microorganisms and moulds harmful to human health. In this case study, the extracted air derives from a winery, which poses the question of air quality and the need to install additional sensor to check air quality. In fact, air temperature and humidity sensors, air quality sensors have also been installed: CO
2, VOC, air quality, in the room where the duct is present (
Figure 21).
These sensors will have the task of checking the indoor air quality in the months of July and August, when the system is at maximum operating speed, and, consequently, the air flow is higher. Sample air particles will also be collected with bio-aerosol cassettes and analyzed in the laboratory. If the air quality is not good, filtering systems will be installed in the duct to improve the parameters.
7. Conclusions
The installation of natural ventilation systems are commonly included in new buildings, while these systems are rarely used in historical buildings because of the difficulty of integrating them into the original design, and in light of the potential visual impact. Further difficulties with architectural integration also arise in the distribution and management of habitable interior spaces. In fact, natural ventilation strategies necessarily require that airflow “passes” through the confined spaces.
This aspect therefore conditions the internal organization of the building, to the extent that it limits the partitions perpendicular to the prevailing airflow. Unfortunately, national and regional regulatory legislation has not taken any steps to encourage the use of technological devices for passive cooling nor favored their architectural integration even in more sensitive urban contexts, such as historical centers. Nevertheless, a careful study of the building object of intervention allows the application of such systems through the reuse of the chimneys of disused fireplaces or by creating ad hoc passages placed in correspondence with non-value elements (floors, walls, etc.). Fortunately, hypogeal environments, caves, and cavities are widespread in Mediterranean regions as are rooms below ground characterized by lower temperatures than the floors above. Therefore, a greater awareness of systems able to exploit the natural flow of ventilation could determine a more “widespread” application in the most varied of contexts with consequent savings in terms of energy and fossil resources.
The study of cooling systems in relation to the climatic context is essential: this research, developed in a temperate climate, confirms that the use of passive cooling systems allows adequate levels of comfort to be reached without the use of mechanical systems and consequently without cost. Further studies of varying building configurations in differing climatic contexts will lead to more efficient energy use.


