Hydrogen Supply Chains for Mobility—Environmental and Economic Assessment


1
Institute of Energy and Climate Research—Systems Analysis and Technology Evaluation Forschungszentrum Jülich, 52425 Jülich, Germany
2
Institute of Environmental Technology and Energy Economics (IUE), Hamburg University of Technology (TUHH), 21073 Hamburg, Germany
*
Author to whom correspondence should be addressed.
Sustainability 2018, 10(6), 1699; https://doi.org/10.3390/su10061699
Submission received: 27 April 2018
/
Revised: 18 May 2018
/
Accepted: 19 May 2018
/
Published: 23 May 2018
(This article belongs to the Special Issue Hydrogen Production and Utilization)
Abstract
:Hydrogen mobility is one option for reducing local emissions, avoiding greenhouse gas (GHG) emissions, and moving away from a mainly oil-based transport system towards a diversification of energy sources. As hydrogen production can be based on a broad variety of technologies already existing or under development, a comprehensive assessment of the different supply chains is necessary regarding not only costs but also diverse environmental impacts. Therefore, in this paper, a broad variety of hydrogen production technologies using different energy sources, renewable and fossil, are exemplarily assessed with the help of a Life Cycle Assessment and a cost assessment for Germany. As environmental impacts, along with the impact category Climate change, five more advanced impact categories are assessed. The results show that from an environmental point of view, PEM and alkaline electrolysis are characterized by the lowest results in five out of six impact categories. Supply chains using fossil fuels, in contrast, have the lowest supply costs; this is true, e.g., for steam methane reforming. Solar powered hydrogen production shows low impacts during hydrogen production but high impacts for transport and distribution to Germany. There is no single supply chain that is the most promising for every aspect assessed here. Either costs have to be lowered further or supply chains with selected environmental impacts have to be modified.
1. Introduction
For several years now, hydrogen has been discussed widely for mobility applications in order to minimize local emissions, reduce overall greenhouse gas (GHG) emissions and decrease dependency on foreign fossil fuel resources. Additionally, fuel cell electric vehicles (FCEV) from different manufacturers are already available on the market [1]. For the production and transport of hydrogen, however, a broad variety of technologies either already exist or are currently under development and/or investigation.
In this context, several recent articles discuss technical aspects of hydrogen production [2,3,4,5,6]. These papers, however, give only an estimation of the cost and lack an environmental assessment. Gnanapragasam, et al. [7] consider such aspects and even include social issues within their assessment. They do not use a life cycle approach, but analyze certain hand-picked qualitative and quantitative indicators; such an approach is more open to subjectivity compared to more standardized approaches, like Life Cycle Assessment (LCA). Additionally, life cycle cost assessments mainly concentrate on one field of technology, e.g., electrochemical [8], solar [9] or fermentative hydrogen production [10]. Regarding LCA, a variety of studies about hydrogen supply are available. For example, Bhandari, et al. [11] performed a review on existing studies on electrochemical hydrogen production. They found that mainly Climate change was assessed as an impact category, and only very few studies broadened their scope to Acidification and Eutrophication. Valente, et al. [12] concentrate in their review on Climate change impacts for renewable hydrogen (electrochemical, thermochemical and biological) production technologies compared to steam methane reforming (SMR). Most of the analyzed studies investigated electrochemical hydrogen production. The authors also harmonized all results to compare different studies with each other. However, even these harmonized results varied significantly between the different studies. In particular, results for biological hydrogen production can exceed values for SMR many times over. A recent comprehensive LCA non-review paper was published by Mehmeti, et al. [13]. However, the authors claim only to perform a streamlined LCA, as “the goal of the analysis is a quick review of the major sources and quantitative … environmental impacts”. Here, thermochemical (coal and biomass gasification, steam methane and renewable ethanol reforming), electrochemical (proton exchange membrane (PEM) and high-temperature electrolysis) and biological (dark fermentation plus microbial electrolysis) production technologies were analyzed against 18 impact categories. It was revealed that hydrogen from PEM electrolysis using electricity from renewable sources and biomass gasification show the most environmentally benign behavior. Regarding biomass gasification, however, the authors restrict their findings due to the high impact of the used feedstock, the involved gasification technology and the broad variety of operating parameters. Older studies had already included hydrogen transport and distribution [14]. In those that are more recent, it has even been the focus of the assessment. Ozawa, et al. [15] assessed the hydrogen supply in Japan for mobility by importing hydrogen from Australia or Norway or importing natural gas and converting it to hydrogen. Liquid organic hydrogen carriers (LOHCs) for transport are compared with liquid hydrogen transport. The presented results show that when using renewable sources for hydrogen production—in particular long-distance transport, as well as the energy carriers used for compression—liquefaction or dehydrogenation become more important. However, in this paper, only the impact category Climate change is assessed, and only a well-to-tank analysis is performed (i.e., the construction of hydrogen production unit and other facilities is not included). Other authors focus on distributing hydrogen, in particular the hydrogen refueling station (HRS) (e.g., Burkhardt, et al. [16]). They investigated different environmental impact categories but only for hydrogen production from wind energy directly at the hydrogen refueling station (HRS). The variation of the full load hours of the electrolyzer revealed that with only 3000 h/a, the environmental impacts from the construction of the electrolyzer and the hydrogen refueling station (HRS) account for 60% of the overall impacts.
In the present paper, many of the above-mentioned aspects will be combined. The spectrum of hydrogen production technologies as well as resources and feedstock are assessed with an LCA as well as from a cost perspective. The choice of environmental impact categories is thereby not limited to Climate change. Furthermore, not only the production of hydrogen is included, but also transport and distribution in Germany (i.e., the whole supply chain for mobility purposes is covered). In this way, a comprehensive picture can be drawn and the positive and negative aspects of current and future technologies for hydrogen supply can be discussed.
2. Methods and Assumptions
The economic and environmental assessment is performed based on widely accepted methodological approaches.
Environmental assessment with an LCA is a well-established methodology for products and services. According to the standards ISO 14040 and 14044 [17,18], it is divided into four steps: Goal and scope definition, to shape the aim of the assessment and define the system boundary; Life cycle inventory analysis, to assume and calculate all necessary input and output parameters; Life cycle impact assessment, to calculate the environmental impacts of the assessed process chain and Life cycle interpretation, to discuss the results. The implementation of the first two steps for this LCA on hydrogen supply are described within this section, while the results of the last two steps are presented in the subsequent sections on results and discussion.
The economic assessment is performed by the approach of levelized cost c, in this case, for hydrogen supply. All costs occurring during the life cycle of hydrogen supply are annualized over the lifetime t of the components. If nothing else is mentioned, the overall lifetime T is assumed to be 20 a. The main cost components are capital expenditure I, operating cost O, including maintenance, consumable expenditures C, mainly for fuel, and revenues R, for side products, which are set into relation with the annual amount of supplied hydrogen H (Equation (1)) [19]. r is the interest rate.
Here, a perspective of the overall national economy is chosen, as the LCA also considers effects for the whole community. Therefore, a low interest rate r of 3.5% is assumed based on the average interest rate of German governmental bonds over the last 20 years, which are inflation-adjusted [20,21]. All costs are based on the year 2012. The investment costs are adjusted with the Kölbel-Schulze index [22] and extrapolated to the future using learning curves [23].
2.1. Goal and Scope
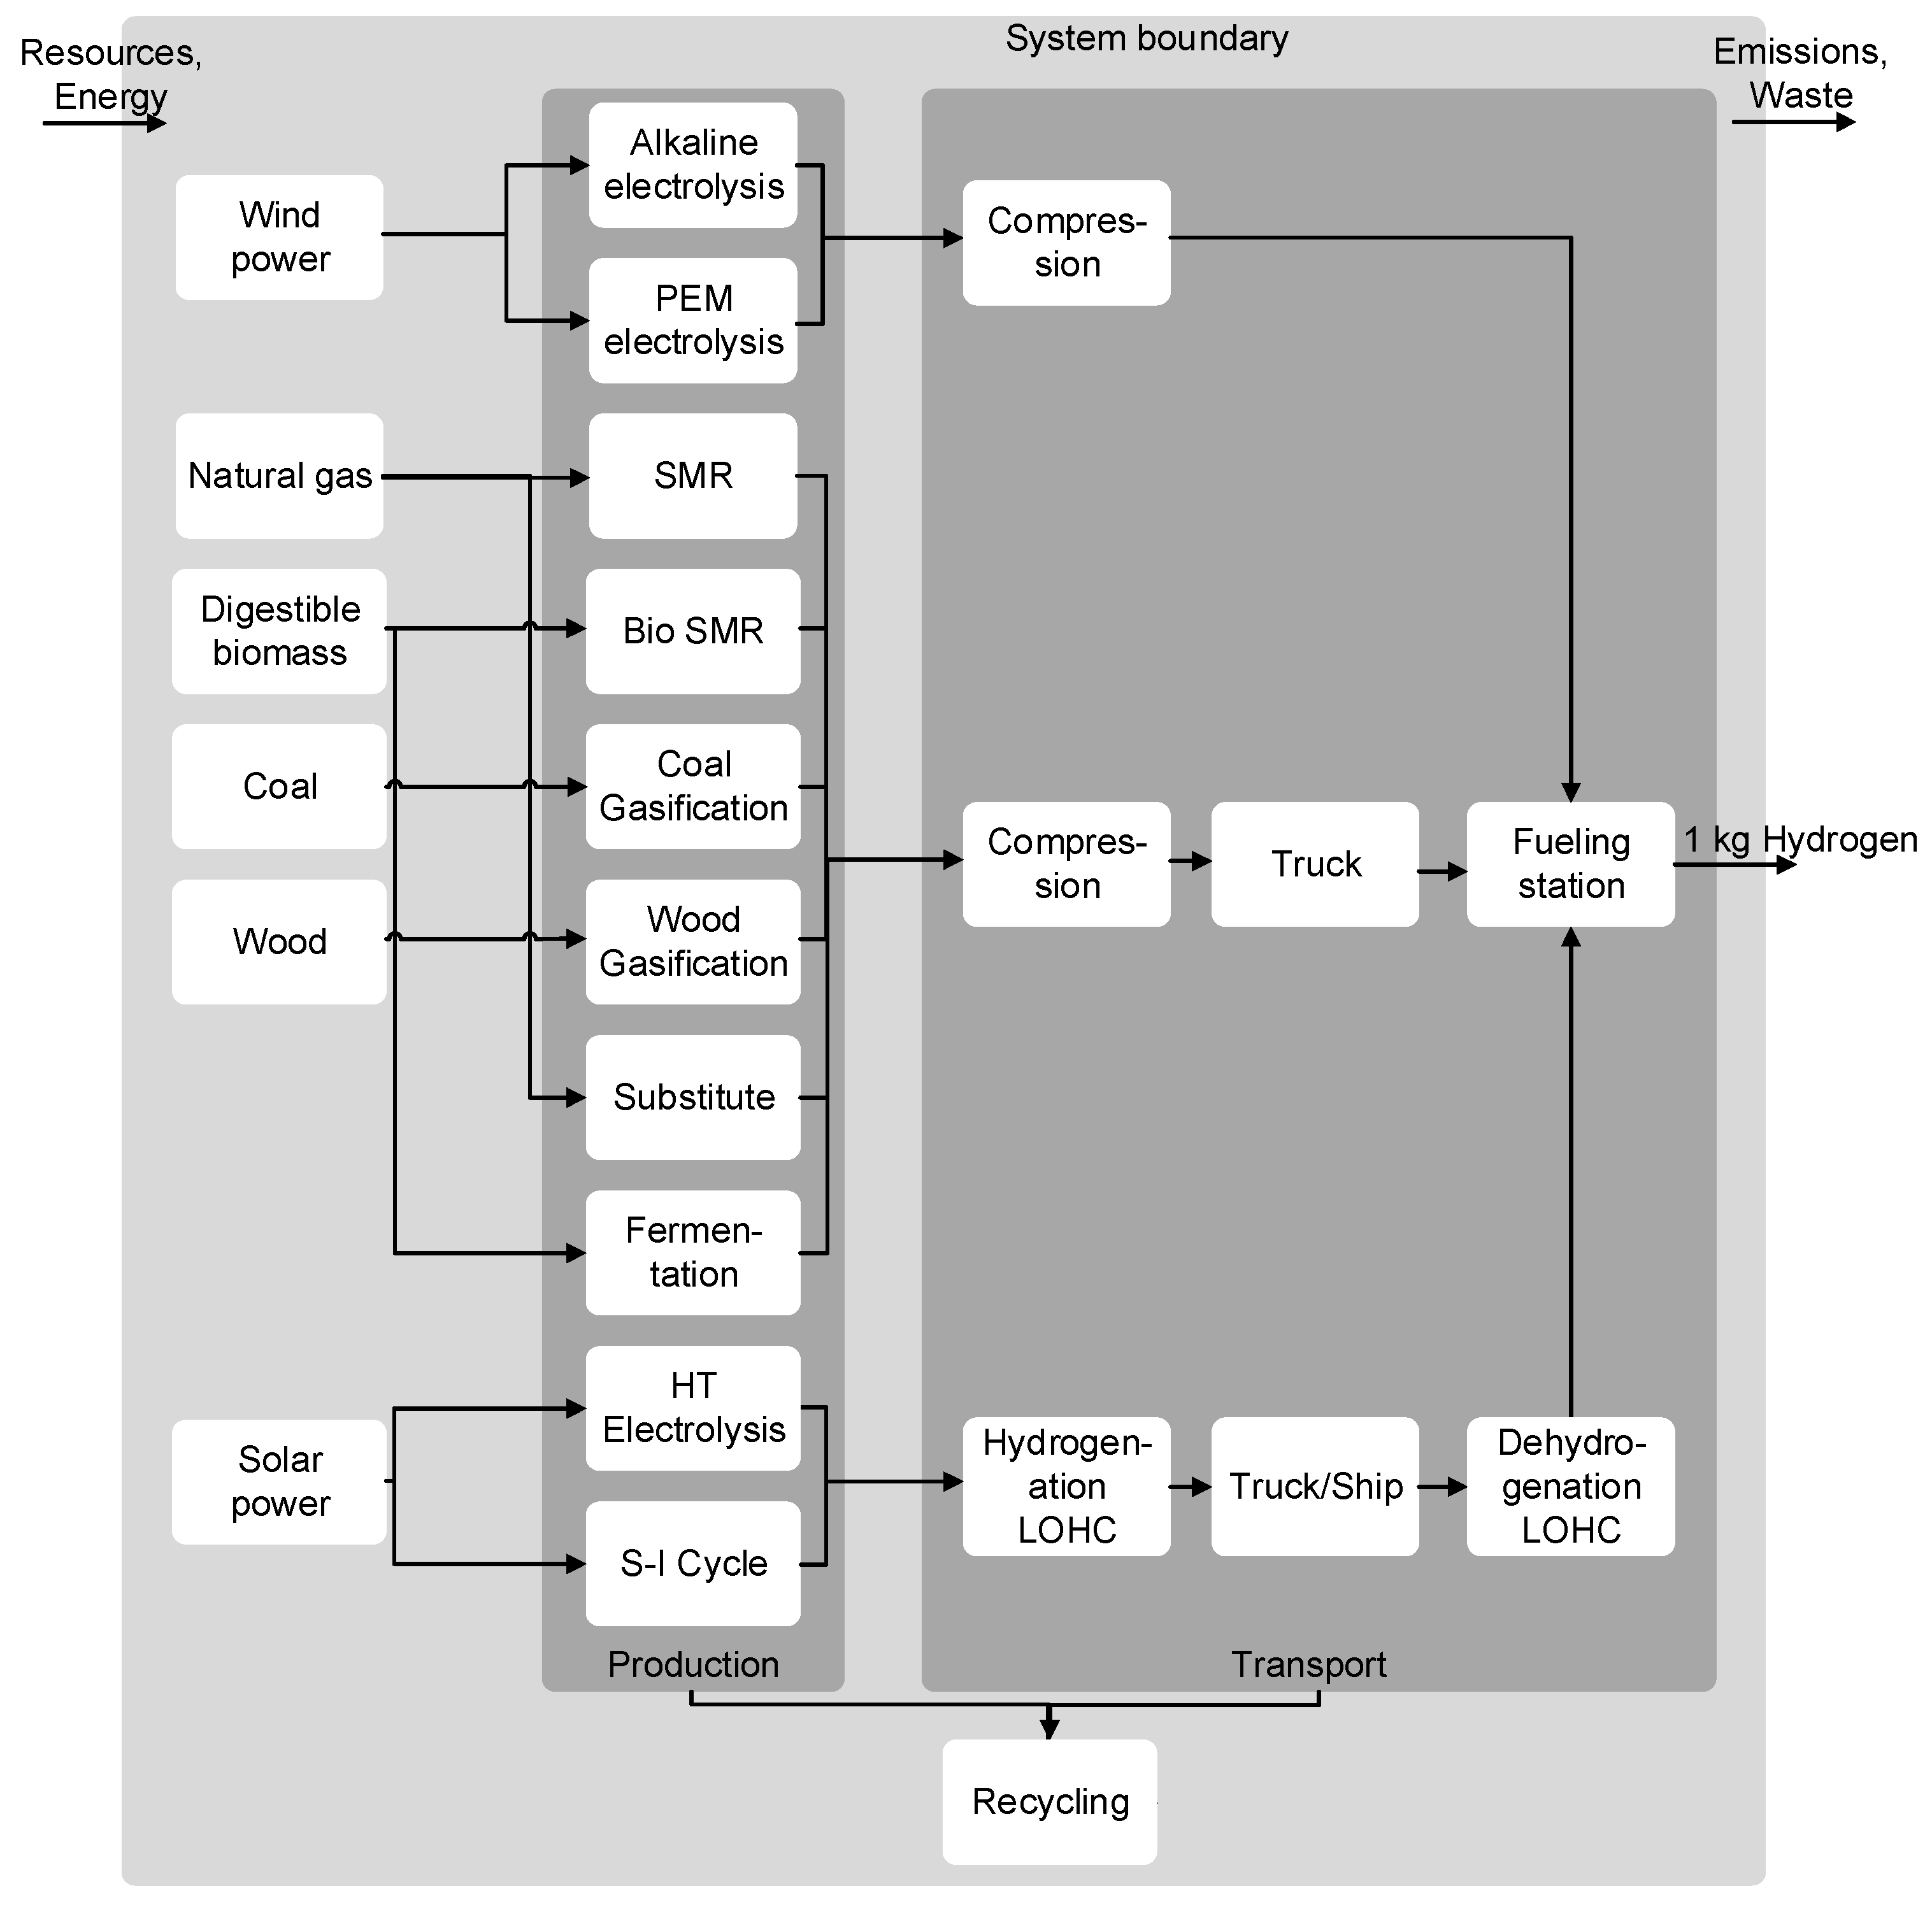
The goal of this assessment is to analyze the environmental impacts and the costs of future hydrogen supply in Germany (functional unit 1 kg of hydrogen). The targeted year is 2032. The selection of the assessed hydrogen production processes is based on several criteria. As this is an investigation of future hydrogen supply, not only technologies that are currently on the market are assessed, but also technologies that might be available at that time. Therefore, technologies that have already reached a Technology Readiness Level of 5 [24] are also included. That means that the technologies have already been tested in projects under real-life conditions. Another criterion for a comprehensive assessment is that the variety of technologies is covered by choosing electrochemical (PEM, alkaline and high-temperature electrolysis), thermochemical (steam reforming, gasification), biological (combination of dark and photochemical fermentation) and thermochemical cycle (sulfur-iodine (S-I) cycle) hydrogen production technologies. Furthermore, possible energy sources should also be broadly covered (i.e., wind and solar power, digestible and woody biomass, natural gas and coal). Additionally, by-product hydrogen from industry is included because it is a sometimes-available source of hydrogen. However, hydrogen from industrial processes needs to be made available, because it is often used as a heating fuel. Therefore, the hydrogen is substituted by natural gas in this process chain. All process chains are summarized in Figure 1.
As solar radiation is not very promising in Germany for the chosen hydrogen production technologies, these process chains have their production in Northern Africa. Thus, transport and distribution need to cover a significantly longer distance than for production within Germany. For transport only in Germany (i.e., relatively short distances) trucks and high-pressure tanks are the option assumed here. For longer distances, however, other technologies are more efficient due to their higher transport capacities. Here, liquid organic hydrogen carriers are chosen [25]. Such hydrocarbons can be transported in trucks and on ships, like mineral oil-based fuels; i.e., no new vessels need to be considered. Hydrogen production with PEM and alkaline electrolysis are located directly at the hydrogen refueling station (HRS) to avoid transport, and only distribution needs to be considered. Due to these process chains, the scope is not cradle-to-grave but cradle-to-gate, with gate meaning the HRS.
Due to the always-changing predictions of future surrounding conditions (e.g., the electricity mix cf. [26,27]), these background parameters are kept constant with regard to the year 2012.
The selection of environmental impact categories is based on three criteria.
- First, they must be recommended by the International Reference Life Cycle Data System (ILCD) [28].
- Second, the quality of the impact assessment methods should be at least “recommended but in need of some improvements” [29].
- Third, impact categories must have a high importance for the assessment of the mobility sector.
Based on these criteria, six impact categories are chosen: (a) Climate change (IPCC 2013 (as modelled in ecoinvent 3.1)), (b) Acidification (CML [30]), (c) Eutrophication (CML [30]), (d) Photochemical ozone creation (CML [30]), (e) Particulate matter (according to Humbert, et al. [31]) and (f) Human toxicity (USEtox [32]). For Human toxicity, metals are excluded, because these characterization factors are not considered to be robust yet.
2.2. Inventory
The assessed process chains are divided in the two phases “hydrogen production”, as well as “transport and distribution”. For all processes, basic recycling of the main materials is also included. All corresponding tables can be found in Appendix A. The modelling of the process chains is done in Umberto, and for background data, the ecoinvent database version 3.1 [33] is used.
2.2.1. Hydrogen Production
The capacity of the hydrogen production facilities is based on optimal values found in literature and technical prognoses.
For electrochemical hydrogen production directly at the hydrogen refueling station (HRS), two different electrolyzers are available—alkaline and PEM electrolysis. Alkaline electrolysis is more efficient when producing hydrogen steadily, while PEM electrolyzers can more quickly perform load changes and can be operated in low loads [34]. Therefore, PEM is often discussed in combination with fluctuating renewable sources of energy like wind and solar. Here, alkaline electrolyzers are assessed and powered with electricity from wind power guaranteed by green certificates to allow for high full load hours and a PEM electrolyzer with lower full load hours, but with direct wind power input. Because of this, the PEM electrolyzer needs to be larger in production capacity and needs additionally a hydrogen storage unit to deliver the same amount of hydrogen (Table A1). These types of electrolysis are directly located at the hydrogen refueling station (HRS) because they can be built efficiently with smaller installed capacities, and in this way, hydrogen transport can be avoided.
Steam methane reforming and gasification of coal for hydrogen production are standard industrial processes for hydrogen production. The here-chosen process parameters are based on a comprehensive literature review and are listed in Table A2. For the steam methane reforming facility, a medium-sized capacity is assumed to utilize scaling effects in efficiency and costs on the one side and to allow for moderate transport distances on the other side. Additionally, steam is produced, for which a credit is given. Coal gasification, in contrast, is only reasonable on a very large scale [35]. In both processes, an additional water-gas shift reactor is used to produce higher amounts of hydrogen after the actual gasification and reforming, respectively. The hydrogen from both provision processes is not pure enough for fuel cell electric vehicles (FCEV). Therefore, in both processes pressure swing adsorption is included to guarantee that the given requirements are met. For steam methane reforming external electricity from the grid is used. For the coal gasification, on the other hand, a combined plant design is chosen due to economic advantages producing even surplus electricity [36]. This electricity is used to cover the internal demand and exported to a small amount to the outside market. For this, an extra credit is given, as well as for the sulfur, which is separated during the flue gas treatment.
Steam reforming of biomethane uses the same production facility as steam methane reforming. For the supply of biomethane, a standard German mix of digestible biomass consisting of manure, grass, wheat, corn and organic waste is used. After biogas production based on a “classical” anaerobic digestion process, the biogas needs to be purified. As one biogas plant would not be able to supply enough biogas, biogas provided by multitude biogas plants is fed into the natural gas grid and extracted at a location where the further processing to hydrogen takes place on a large scale. Therefore, an enrichment of the biogas with propane is mandatory to adjust the Wobbe Index [37,38].
The parameters for the gasification of wood and the substituted hydrogen from chemical industry are also listed in Table A2. The wood consists of forest residues from German spruces with an initial water content of 50%. Before thermochemical gasification, wood is pre-dried to a water content of 30% and shredded to woodchips. The transport distance to the gasification facilities is assumed to be 50 km, reflecting German conditions. The gasification takes place in a Fast Internal Circulating Fluidized Bed (FICFB) reactor with a subsequent water-gas shift reactor to produce more hydrogen out of the synthesis gas. The hydrogen produced in this process needs further purification within a pressure swing adsorption.
The substituted hydrogen is assumed to come from a chloralkali processes. This hydrogen is already very pure and needs only to be dried. To compensate for the extracted hydrogen currently used for heat production a natural gas boiler is assumed.
The biological hydrogen production is based on dark fermentation of digestible biomass, which consists of the same mix as the biomass for biogas production. In these processes, not only hydrogen is produced, but also organic acids. The organic acids are further processed in a photobioreactor in a photofermentation step together with several nutrients to produce more hydrogen. Table A3 gives an overview of the main process parameters.
Hydrogen production by thermochemical cycles offer a variety of different processes. Here the sulfur-iodine cycle is chosen because the temperature level of the needed heat corresponds with the temperature level easily achievable by concentrating solar power (CSP) plants and the demanded level of technological development. In addition, high-temperature electrolysis requires a similar temperature for the heat. Furthermore, both processes need electricity (Table A4) which is also provided by the CSP plant. The solar power plant also includes heat storage to enable a constant hydrogen production, independent of the time of the day, and thus the actual incoming sunshine. The location of these hydrogen production facilities is assumed to be in Northern Africa. In Algeria, sites not too far from the coast but with good values of solar radiation are available and are investigated here.
2.2.2. Hydrogen Transport and Distribution
Depending on the hydrogen production technology, the transport and distribution is chosen differently. Hydrogen production directly at the hydrogen refueling station (HRS) based on an alkaline and PEM electrolysis system requires only the distribution by the refueling station, which is the same for all hydrogen supply options (Table A5). The hydrogen is compressed at the hydrogen refueling station (HRS) to over 800 bar to allow for a fast dispensing of the hydrogen to the vehicle. As on-site produced hydrogen and hydrogen from dehydrogenation has a lower pressure level (4 and 1 bar, respectively) than delivered hydrogen (500 bar transport in high-pressure tanks) the electricity demand for compression and precooling varies. As hydrogen is expanded from over 800 to 700 bar during dispensation, heat is released. To avoid possible resulting damage to the vehicle, the hydrogen is precooled to −40 °C. For electricity use at the hydrogen refueling station (HRS), electricity from wind power is considered, because this form of electricity is already being used for on-site electrolysis.
Road transport is conducted according to EURO 6 standards. The transport distances for the hydrogen produced in Germany are calculated based on the needed production facilities to meet the hydrogen demand. Therefore, some assumptions have to be fixed to calculate the size of the hydrogen supply chains. Here it is assumed that for the target year, 1000 hydrogen refueling stations (HRS) are in operation and supplying hydrogen to 1.8 Million fuel cell electric vehicles (FCEV) (targets of the H2Mobility for 2030) [39]. Based on this and the average hydrogen consumption of a fuel cell electric vehicles (FCEV), an annual hydrogen demand of 193,000 t (2030) needs to be met. With the capacities of the hydrogen production facilities, the number of plants and subsequently the average transport distance for Germany can be calculated. The results are summarized in Table 1.
The hydrogen import from Northern Africa includes within “transport and distribution” the ship transport—with adjusted sulfur content according to the regulation for ship diesel [40]—and the hydrogenation and dehydrogenation with liquid organic hydrogen carrier (LOHC). Therefore dibenzyltoluene is chosen [41], which can be handled during transport like a conventional mineral oil-based fuel. For dehydrogenation, a temperature of 310 °C is needed. This heat is supplied through a natural gas boiler. In contrast, during hydrogenation realized at the hydrogen production facility in Northern Africa, heat with 150 °C is released. As there is no demand for low-temperature heat at the assumed locations, no credits are given (Table A6).
2.2.3. Background Data
3. Results
In this section, first the results of the LCA are presented. In a second subsection, the costs of hydrogen supply are discussed. Within each section a sensitivity analysis is carried out to discuss important assumptions.
3.1. Enviromental Assessment
3.1.1. Impact Category Climate Change
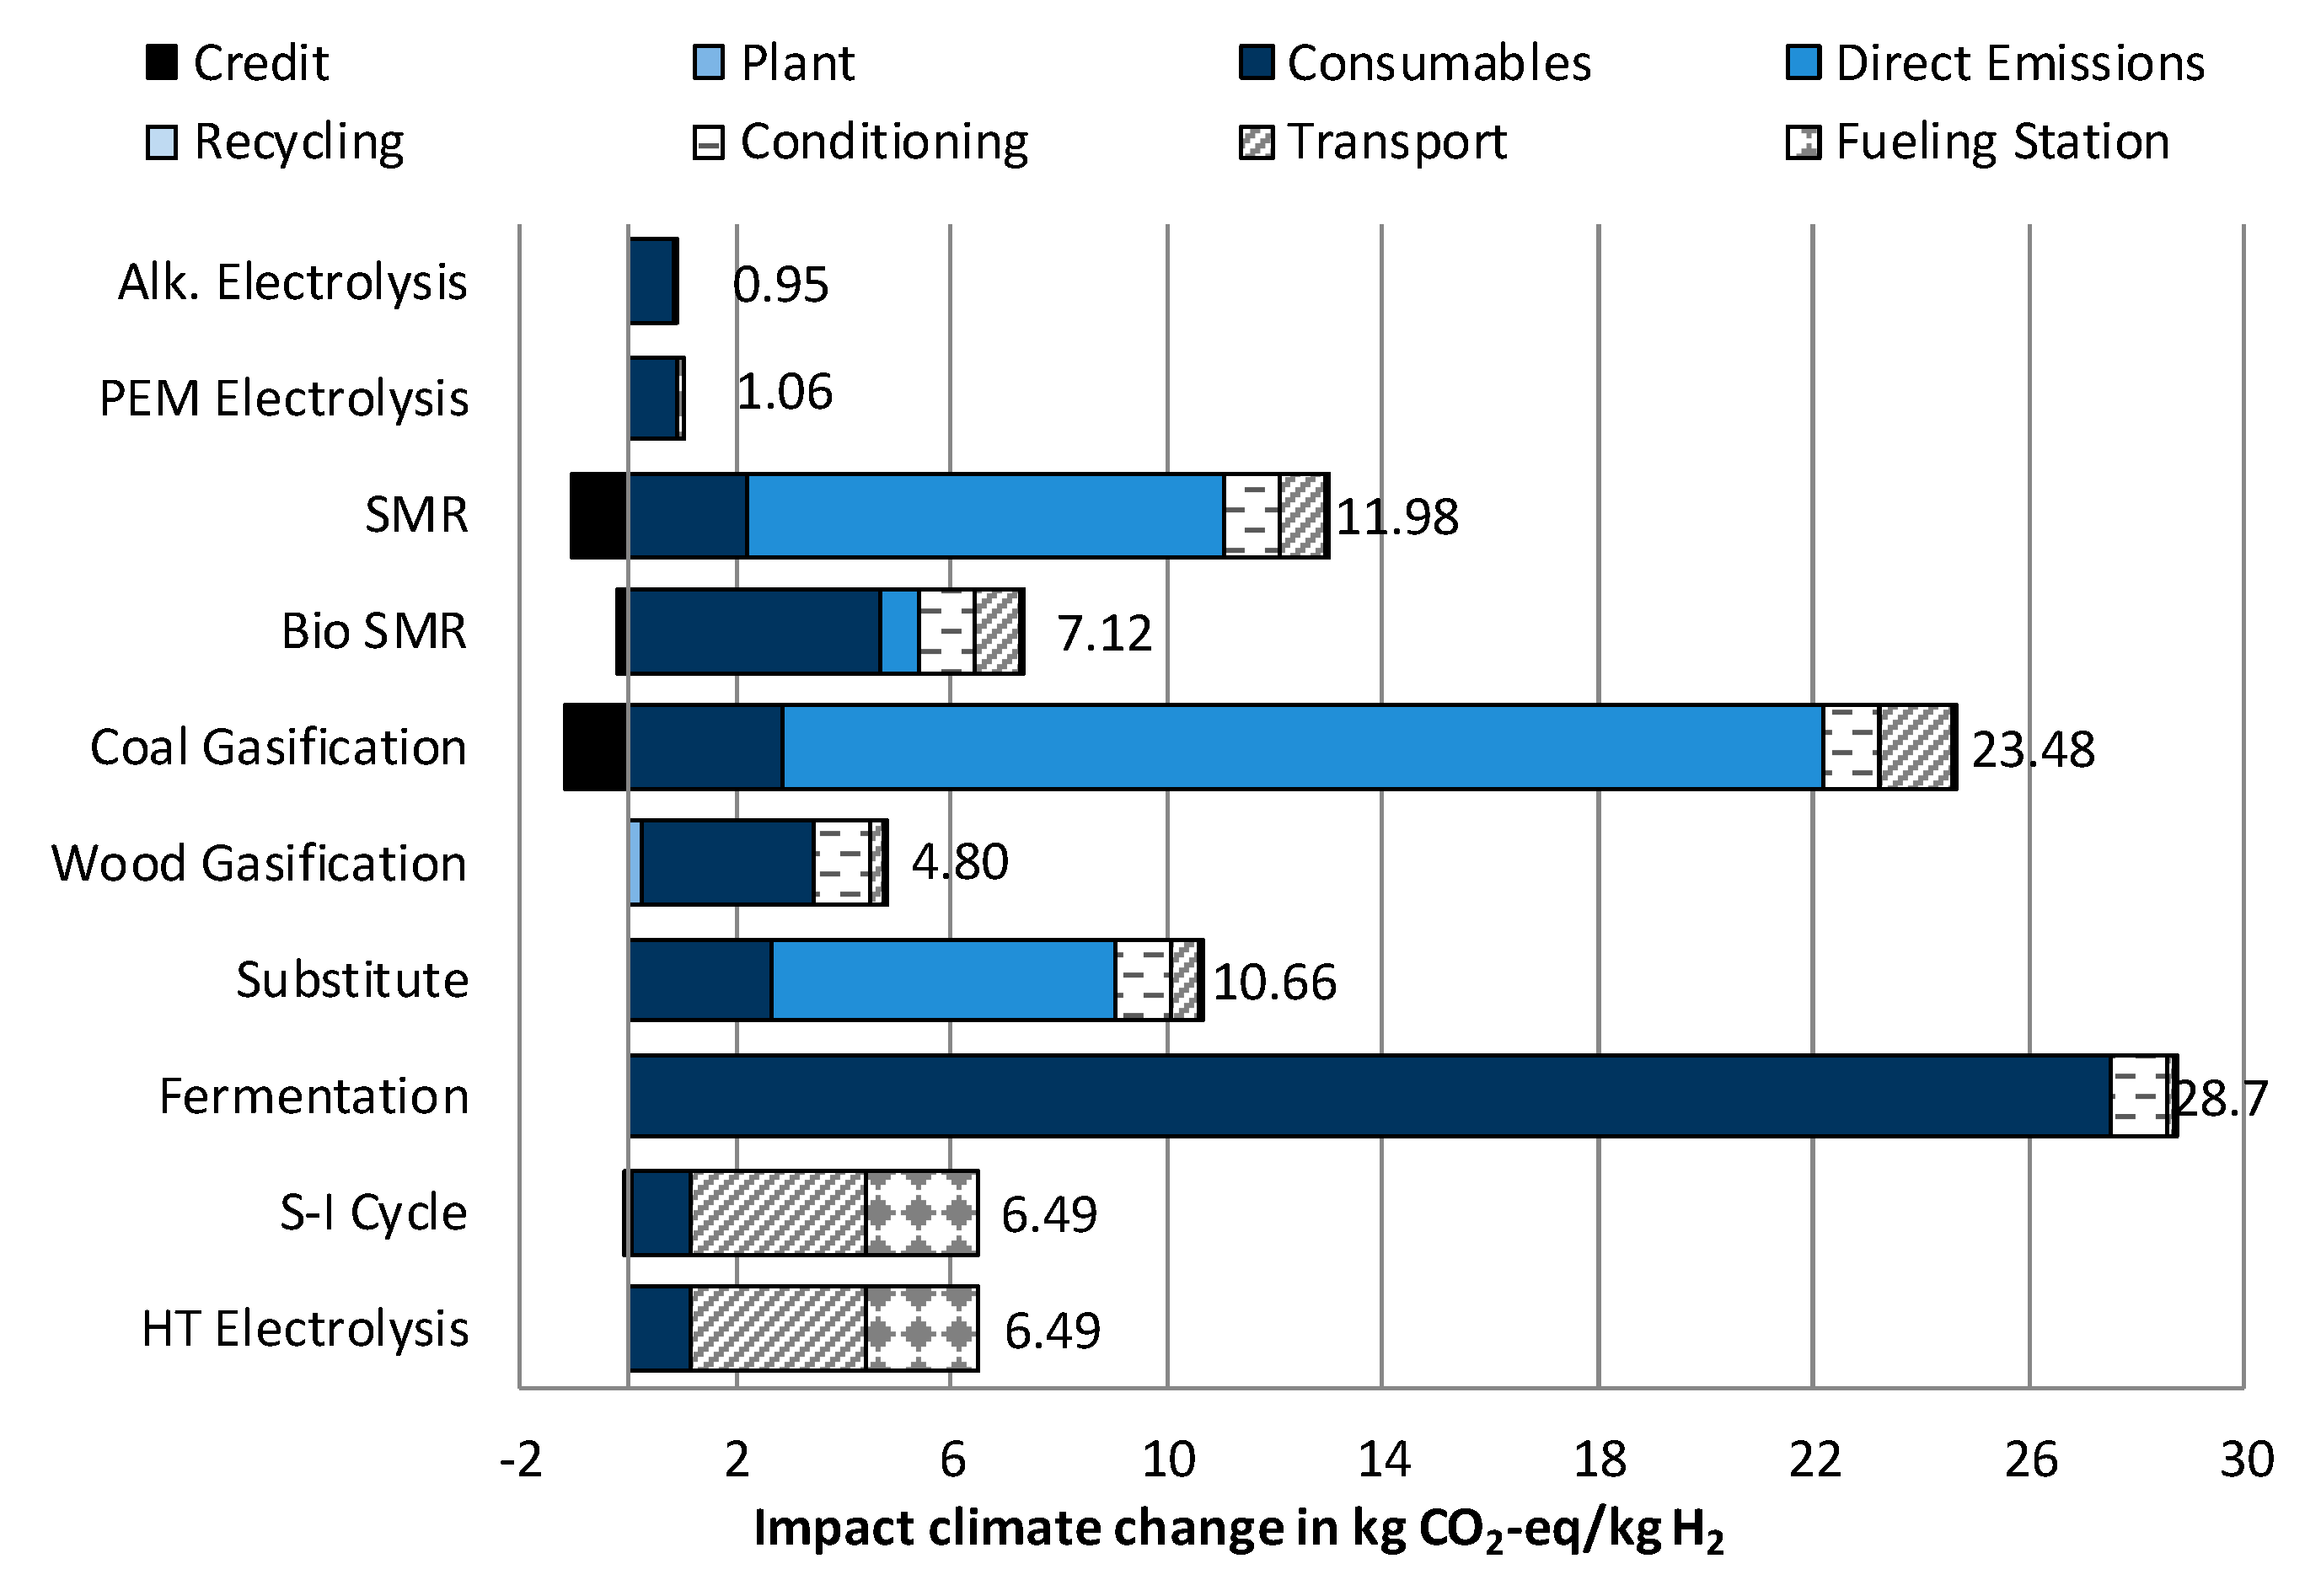
Regarding this impact category, hydrogen production wind and solar power have the lowest impacts, with slightly lower results for hydrogen from wind power (alkaline electrolysis 0.85 kg CO2-eq/kg H2, PEM electrolysis 0.95 kg CO2-eq/kg H2 compared to 1.19 and 1.18 kg CO2-eq/kg H2 for high-temperature electrolysis and sulfur-iodine cycle). These results can be assessed for the construction of the plant, the needed consumables, direct emissions, credits for byproducts if applicable, and recycling; this is shown in Figure 2. The hydrogen transport and distribution consists of the actual transport, the conditioning of the hydrogen before transport and the fueling station with its preparation for fueling. For these hydrogen production processes, the demand on consumables (i.e., electricity from wind power (0.82 and 0.94 kg CO2-eq/kg H2, respectively) and solar power, as well as heat from solar power (1.09 and 1.16 kg CO2-eq/kg H2, respectively) cause the majority of the emissions. For hydrogen from wind power, 90% of the emissions are caused by carbon dioxide from electricity generation. By methane from the electricity generation, another 3% of the impacts are produced. Other greenhouse gases like sulfur hexafluoride, which is emitted at electric power transformation substations, have no significant impact (0.7%). For solar powered hydrogen production also, carbon dioxide causes the majority of Climate change impacts (0.85 kg CO2-eq/kg H2) from construction of the solar tower. Additionally, dinitrogen monoxide also from solar tower construction has significant impact (0.38 kg CO2-eq/kg H2). As the produced solar hydrogen needs to be imported from Northern Africa, the long-distance transport—in particular the truck rides (2.67 kg CO2-eq/kg H2 almost exclusively from carbon dioxide emissions) and the heat demand for dehydrogenation with its burning of natural gas (1.96 kg CO2-eq/kg H2, 87% from carbon dioxide, 13% from methane)—sextuple the overall impact on Climate change. This leads to even higher results than the gasification of woody biomass (3.43 kg CO2-eq/kg H2) and results almost as high as the steam reforming of biomethane (5.20 kg CO2-eq/kg H2). Also, for these two biobased hydrogen production technologies the supply of consumables are most important for the results (3.18 kg CO2-eq/kg H2 for wood gasification, 4.69 kg CO2-eq/kg H2 for biogas reforming). For the gasification of forest residues, the biomass is not causing most of these emissions, but rather the electricity needed for operating the gasification unit with its according carbon dioxide emissions (65% of all emissions for hydrogen production, 2.23 kg CO2-eq/kg H2). In contrast, for the reforming of biomethane the supply of biomethane causes 88% of the GHG emissions for hydrogen production (4.55 kg CO2-eq/kg H2). Here also, dinitrogen monoxide plays an important role with 1.40 kg CO2-eq/kg H2, which are caused by direct emissions from fertilizing the crops (3.23 kg CO2-eq/kg H2 from carbon dioxide, 0.46 kg CO2-eq/kg H2 from methane). Within the results of the hydrogen production processes using fossil fuels, i.e., substituted hydrogen (9.30 kg CO2-eq/kg H2), steam methane reforming (SMR, 10.07 kg CO2-eq/kg H2), coal gasification (21.02 kg CO2-eq/kg H2), also the consumables have a significant impact, but the direct emissions determine the results, of which over 99% are provoked by carbon dioxide. The highest results, however, are caused by the fermentative hydrogen production (27.52 kg CO2-eq/kg H2) due to the high demand for digestible biomass, or in other words, the low efficiency of the hydrogen production process. Transport and distribution of hydrogen production processes in Germany have no determining effect on the overall results (1.21–2.46 kg CO2-eq/kg H2). The same is true for the credits of byproducts (−0.21–−1.13 kg CO2-eq/kg H2). The recycling and the construction of the facilities have almost no visible impact on the results (0.00–0.24 kg CO2-eq/kg H2).
3.1.2. Impact Category Acidification
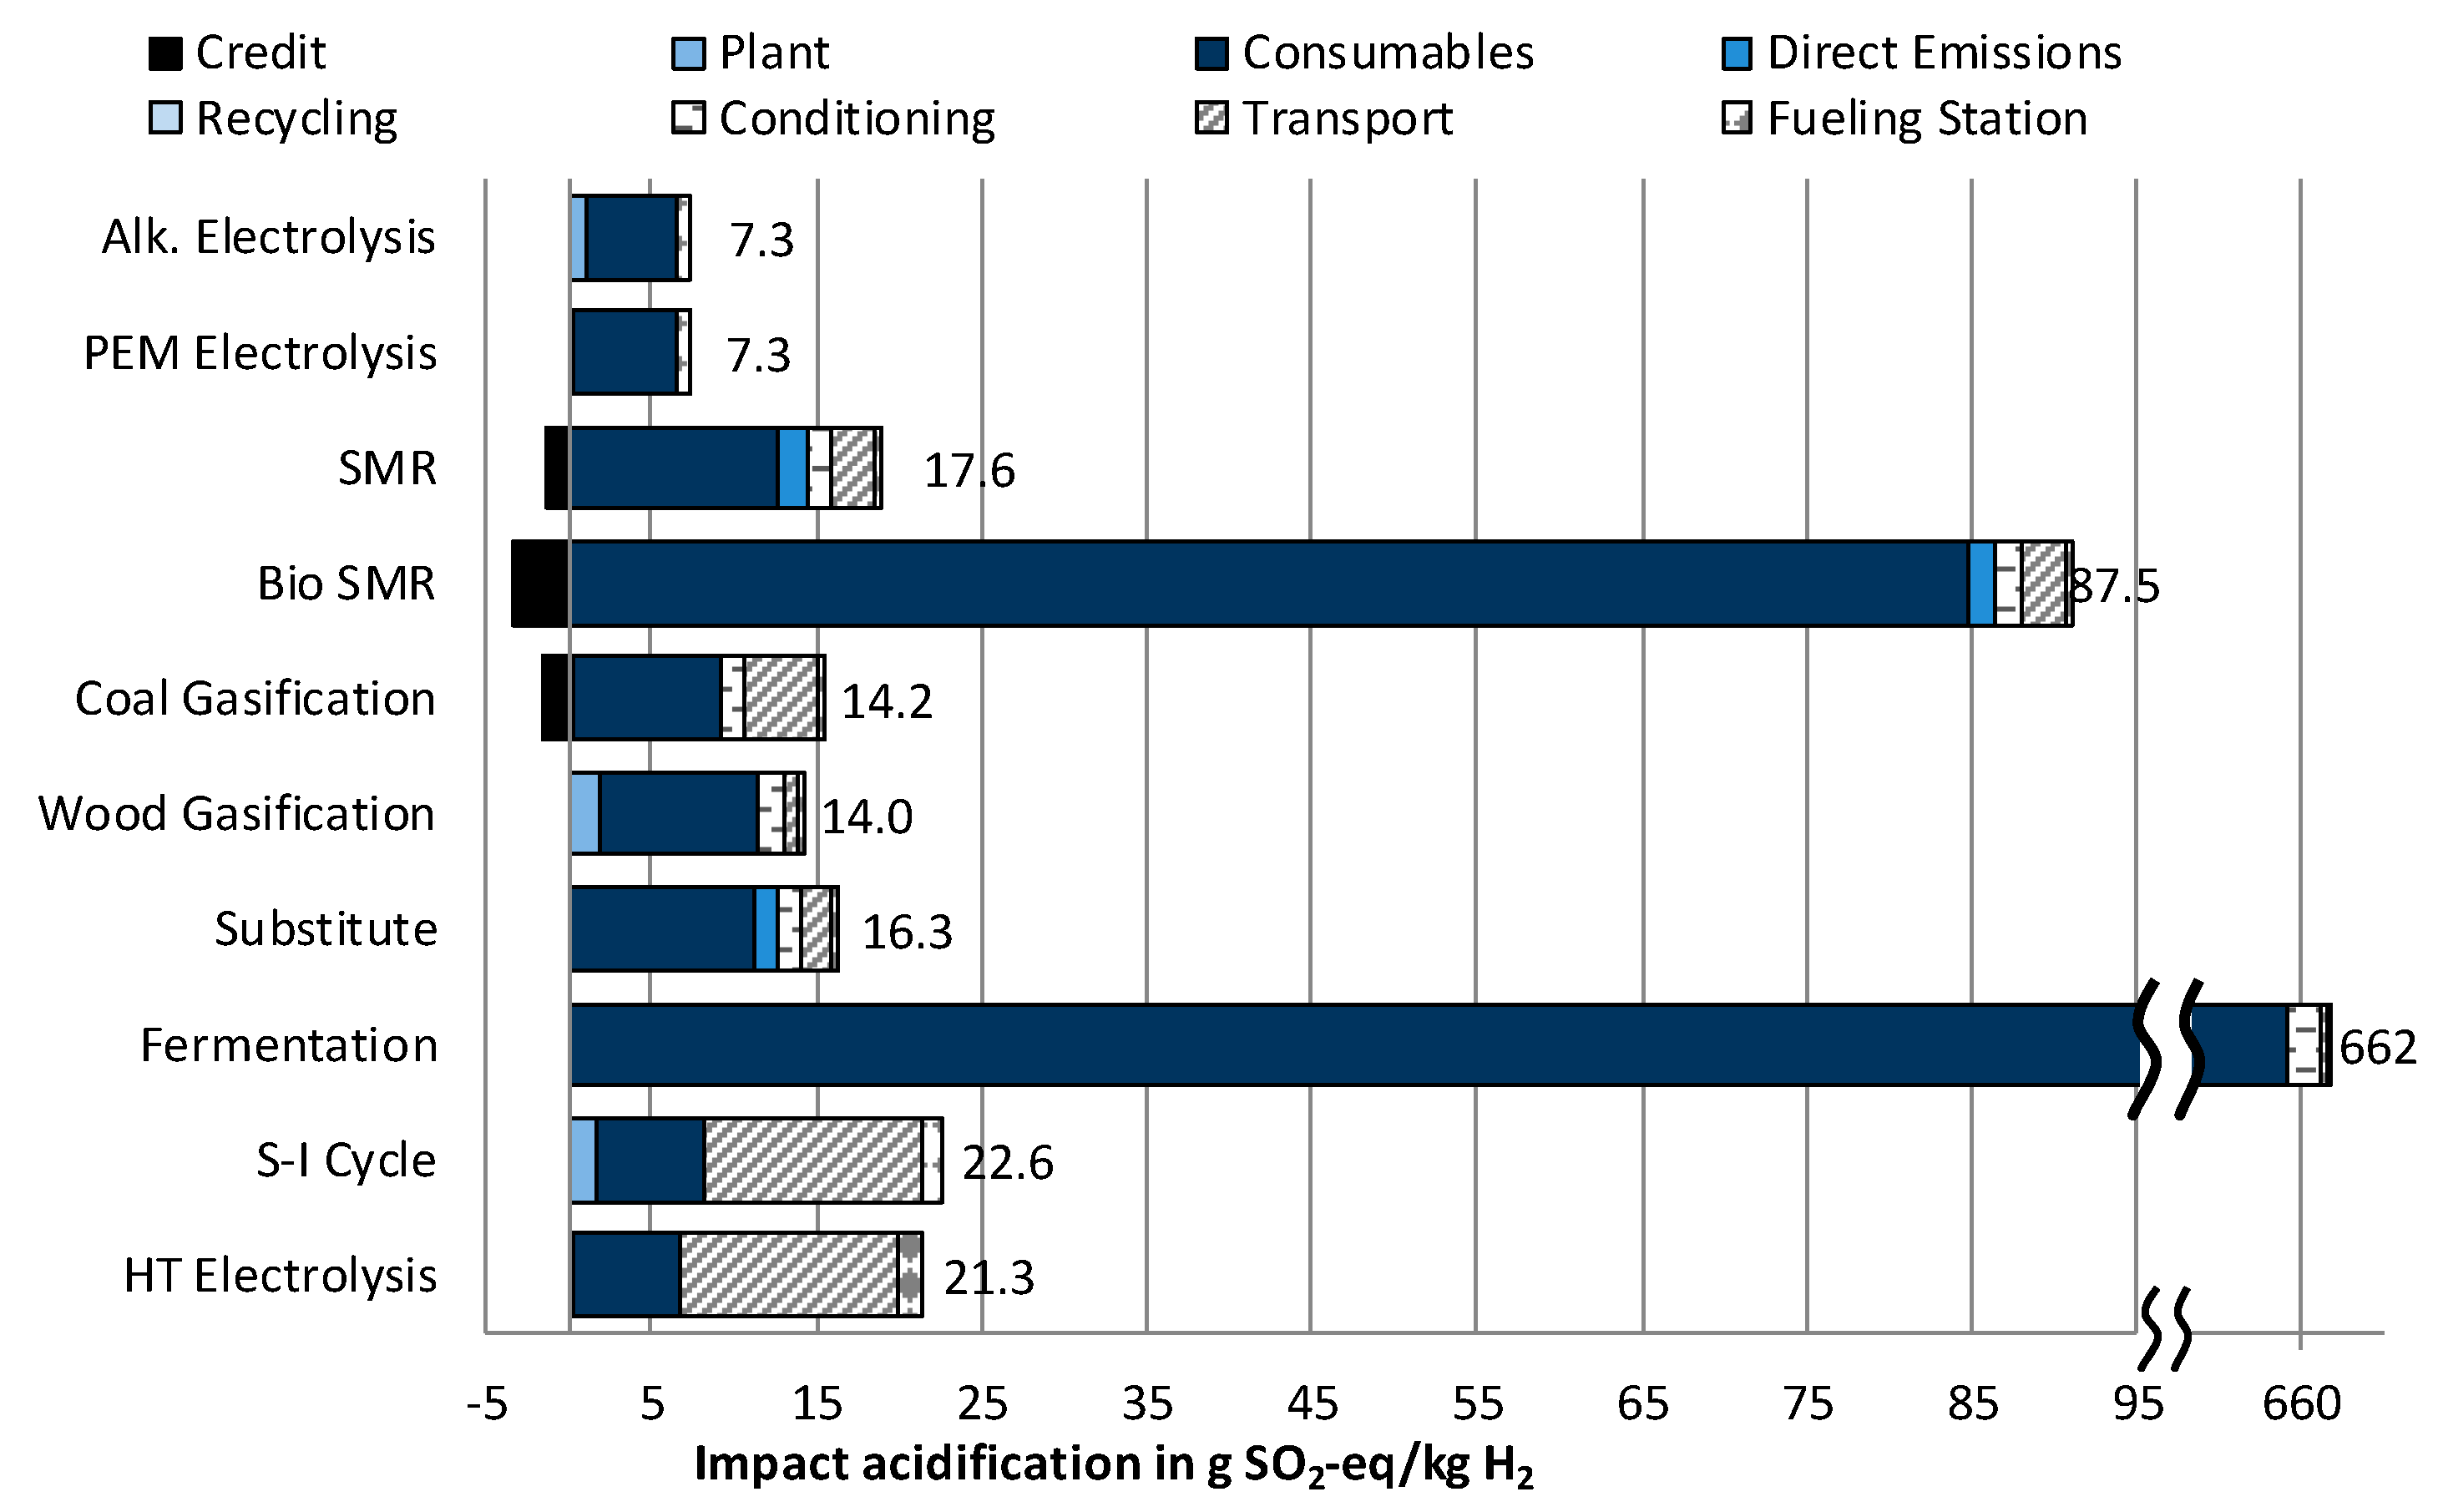
Also for this impact category, Acidification, hydrogen production from wind and solar power shows the lowest results (Figure 3, 6.6 g SO2-eq/kg H2 from wind power, 8.2 and 6.8 g SO2-eq/kg H2 for sulfur-iodine cycle and high-temperature electrolysis). However, due to the sulfur dioxide and nitrous oxide emissions from transport by ship, these overall supply chains exceed with their results almost all other hydrogen supply chains (additional 14.4 g SO2-eq/kg H2). Only hydrogen production with digestible biomass has significantly higher impacts (660 g SO2-eq/kg H2 for fermentative hydrogen production and 83.0 g SO2-eq/kg H2 for biomethane reforming). The digestible biomass assumed here consists not only of manure and organic waste, but also of energy crops (e.g., corn silage). For the cultivation of such energy crops mineral fertilizer and digestate is used, causing ammonia emissions directly on the field. For biomethane reforming, 88% of the acidifying emissions are caused by the biomethane production (84.4 g SO2-eq/kg H2). As the fossil fuel-based hydrogen production processes use efficient flue gas treatment, the direct emissions do not determine the results, but rather the supply of the resources. Additionally, the transport distance can have a significant influence on the overall emissions. Looking only at hydrogen production, coal gasification (7.7 g SO2-eq/kg H2) has lower impacts than wood gasification (11.5 g SO2-eq/kg H2). As coal gasification is optimally performed in big facilities, the transport distances are much longer than for hydrogen from wood (Table 1) (6.3 and 2.8 g SO2-eq/kg H2 for coal and wood gasification). Therefore, the overall emissions on hydrogen supply are lower for wood gasification. The natural gas-based hydrogen production is in close range to other technology options (13.0 g SO2-eq/kg H2 for steam methane reforming and 12.6 g SO2-eq/kg H2 for substituted hydrogen). For these processes, the transportation distance is also crucial for the assessment of the whole supply chain. For some hydrogen production technologies, the construction of the facilities also becomes visible within the results shown in Figure 3 (e.g., alkaline electrolysis due to usage of nickel, 1.1 g SO2-eq/kg H2). This, however, does not determine the overall result.
3.1.3. Impact Category Eutrophication
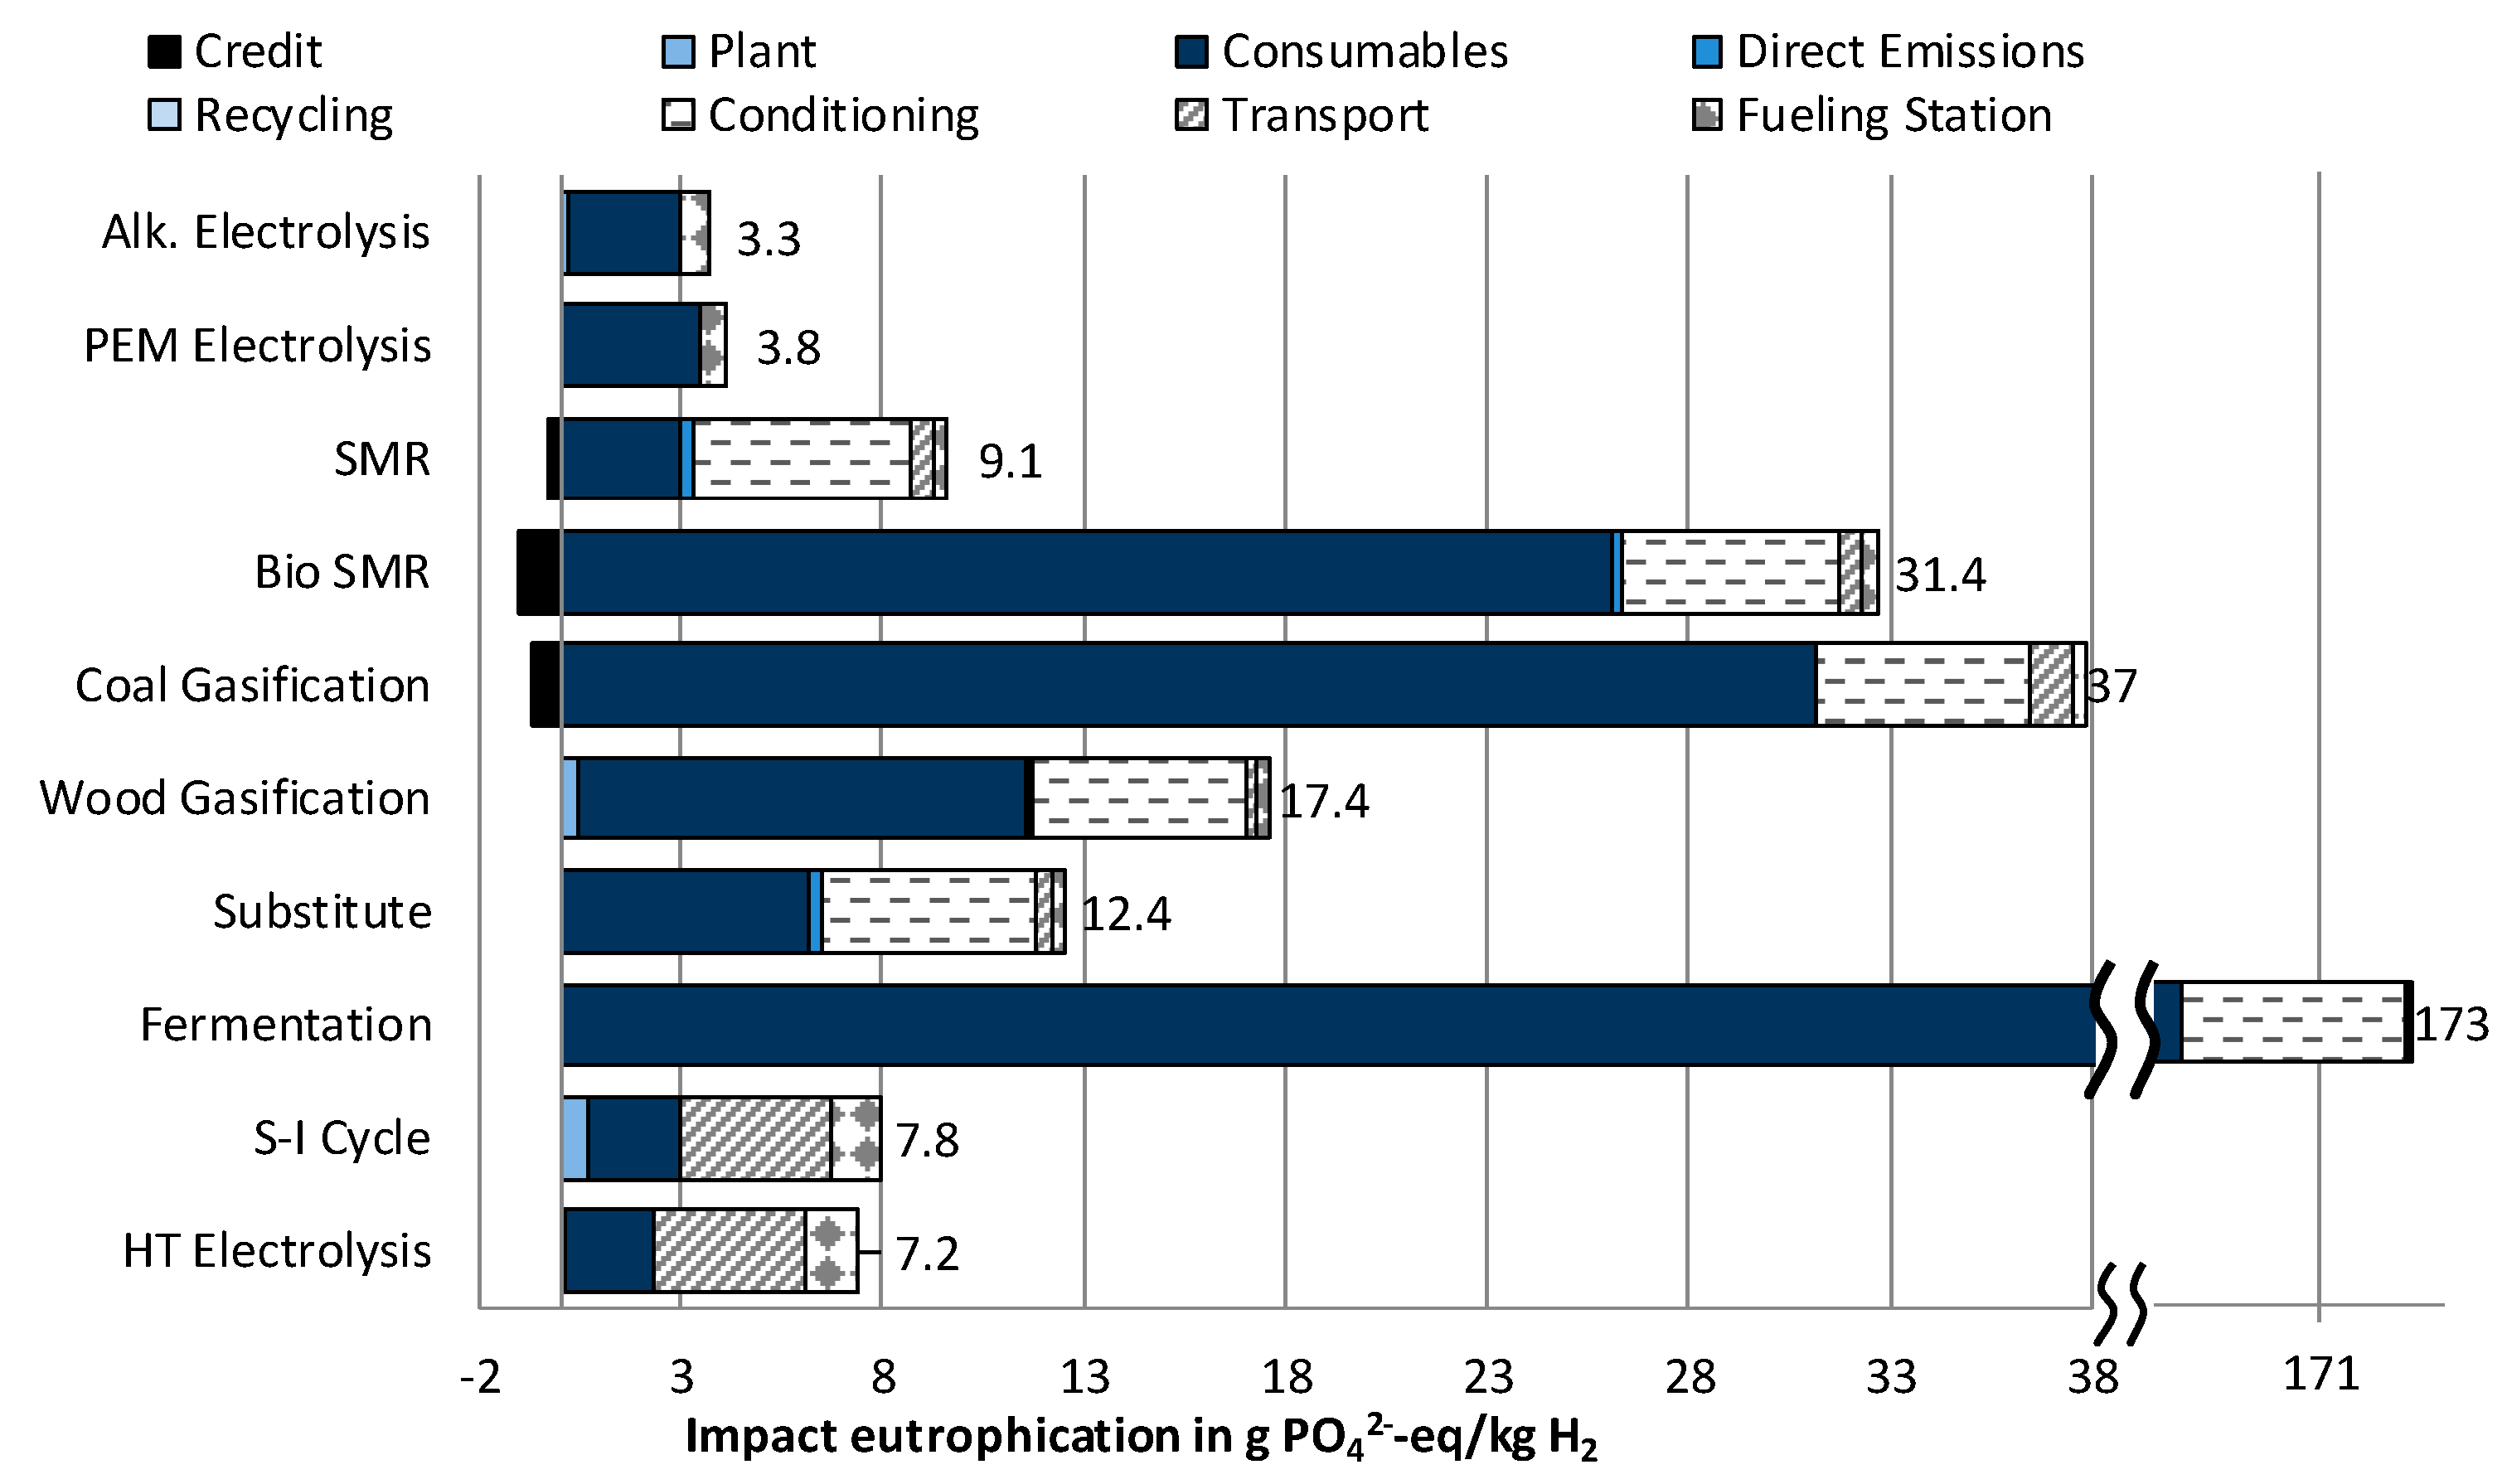
The usage of electricity from the German electricity mix is one of the major aspects determining the impacts on Eutrophication of hydrogen supply chains (Figure 4). This becomes most obvious for the conditioning of the hydrogen for transport (5.4 g PO43− eq/kg H2). In this phase, only electricity for compressing the hydrogen is included. These emissions are caused by the wastewater from lignite pits. Other process chains effected by this are the substituted hydrogen from chemical industry, where the electricity is used to dry the hydrogen (62% of emissions for hydrogen production, 4.0 of total 6.5 g PO43− eq/kg H2), gasification of wood (79% of emissions for hydrogen production, 9.2 of 11.7 g PO43− eq/kg H2) and biomethane reforming, more precise biomethane supply (30% of emissions for hydrogen production). An even higher impact is caused by the usage of fertilizer due to the direct ammonia emissions. Leading to a total impact on Eutrophication for biogas reforming of 25.3 g PO43− eq/kg H2 and of 167.7 g PO43− eq/kg H2 for fermentative hydrogen production. Lowest impacts are provoked by hydrogen production high-temperature electrolysis (2.4 g PO43− eq/kg H2), closely followed by the sulfur-iodine cycle, alkaline electrolysis and steam methane reforming (all 3.0 g PO43− eq/kg H2) and PEM electrolysis (3.4 g PO43− eq/kg H2). For coal gasification, the supply of coal is the main driver within the impacts, leading to 30.4 g PO43− eq/kg H2 emissions for hydrogen production.
3.1.4. Impact Category Photochemical Ozone Creation
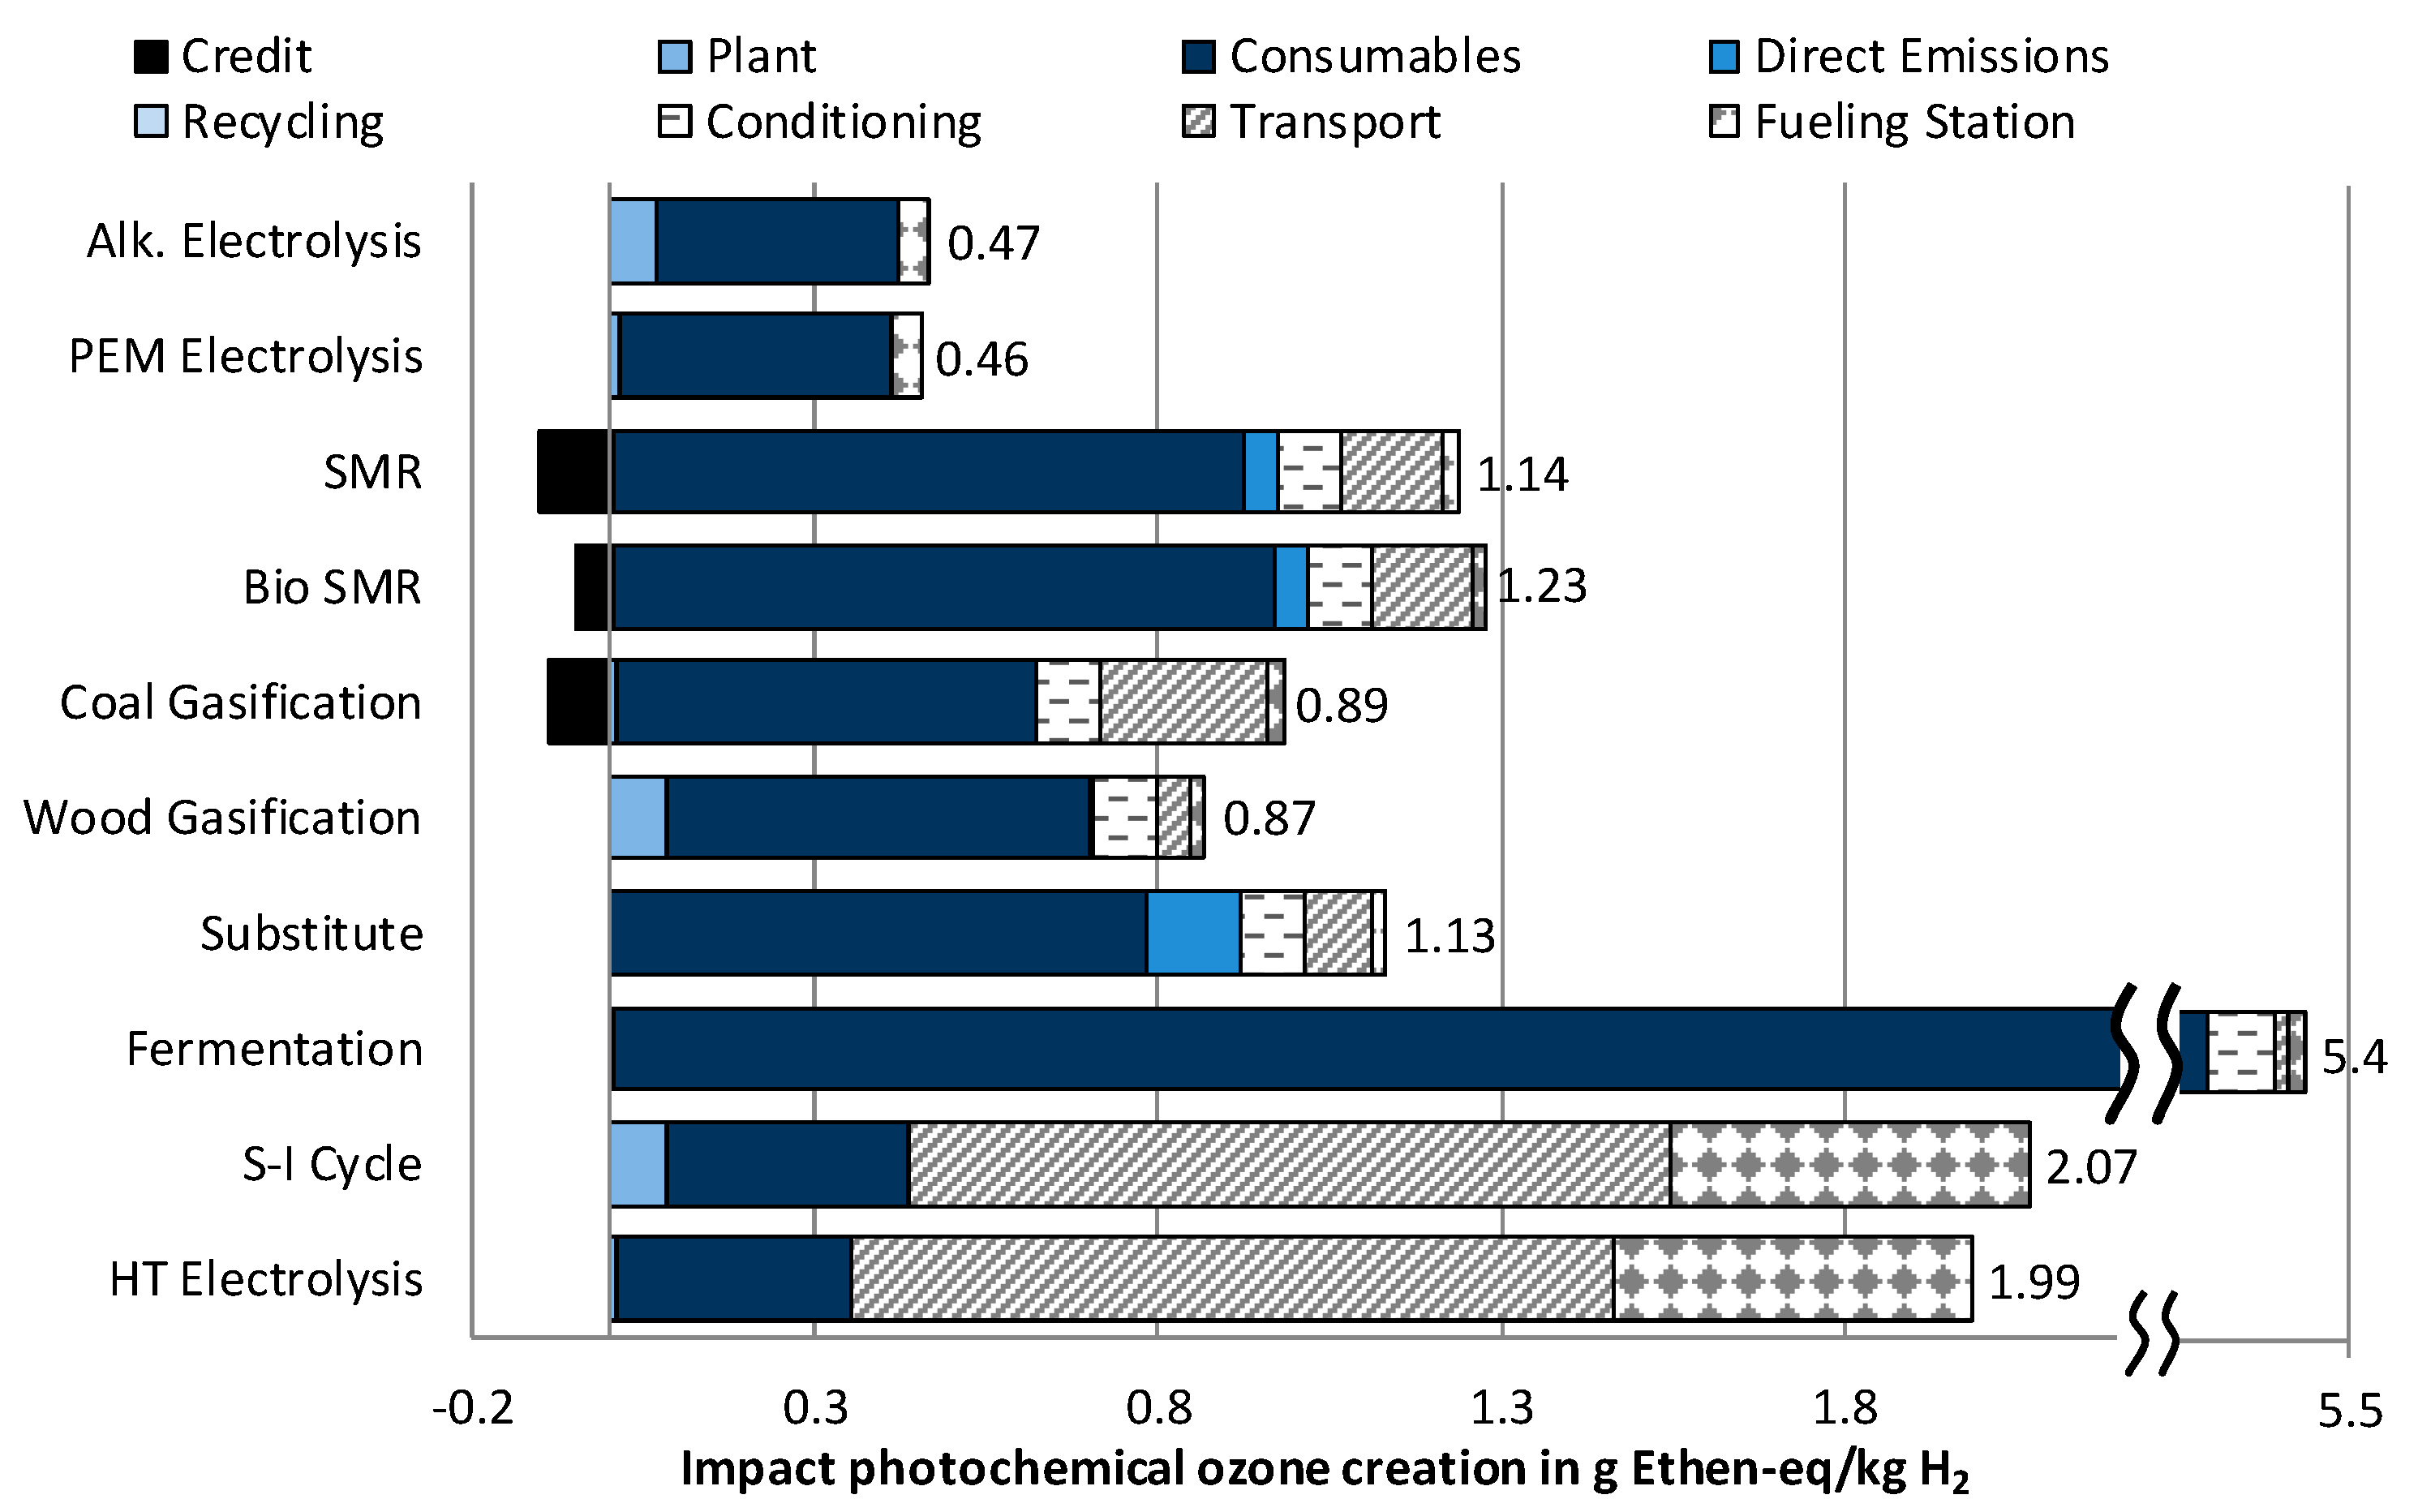
The lowest impact on this impact category for hydrogen production causes the high-temperature electrolysis (0.35 g Ethen-eq/kg H2, Figure 5). Slightly higher emissions are caused by the sulfur-iodine cycle (0.44 g Ethen-eq/kg H2) and hydrogen production by wind power (0.41 and 0.42 g Ethen-eq/kg H2). For this impact category, the high emissions occurring during the transport and distribution of hydrogen to Germany from North Africa are caused by emissions from trucks (0.49 g Ethen-eq/kg H2) and ships (0.24 g Ethen-eq/kg H2)—and here in particular from sulfur dioxide (34% of total transport and distribution emissions). In addition, the emissions from heat production for dehydrogenation have a major impact (34% of total transport and distribution emissions, 0.47 g Ethen-eq/kg H2). For the other hydrogen supply chains, the supply of the resources determines the results. For natural gas (steam methane reforming 0.87 g Ethen-eq/kg H2, substitute in chemical industry 0.92 g Ethen-eq/kg H2) methane slip streams from the pipeline transport and during extraction are responsible for the results shown in Figure 5 (23% of total hydrogen production emissions), as well as sulfur dioxide during extraction (55% of total hydrogen production emissions). In total, 0.46 g Ethen-eq/kg H2 are emitted due to the supply of natural gas. In addition, coal supply causes methane emissions, leading to 0.53 g Ethen-eq/kg H2, and biomass supply emissions from agricultural utility vehicles summing up to 0.97 g Ethen-eq/kg H2 emissions for biogas reforming and 5.30 g Ethen-eq/kg H2 for the fermentative process chain.
3.1.5. Impact Category Particulate Matter
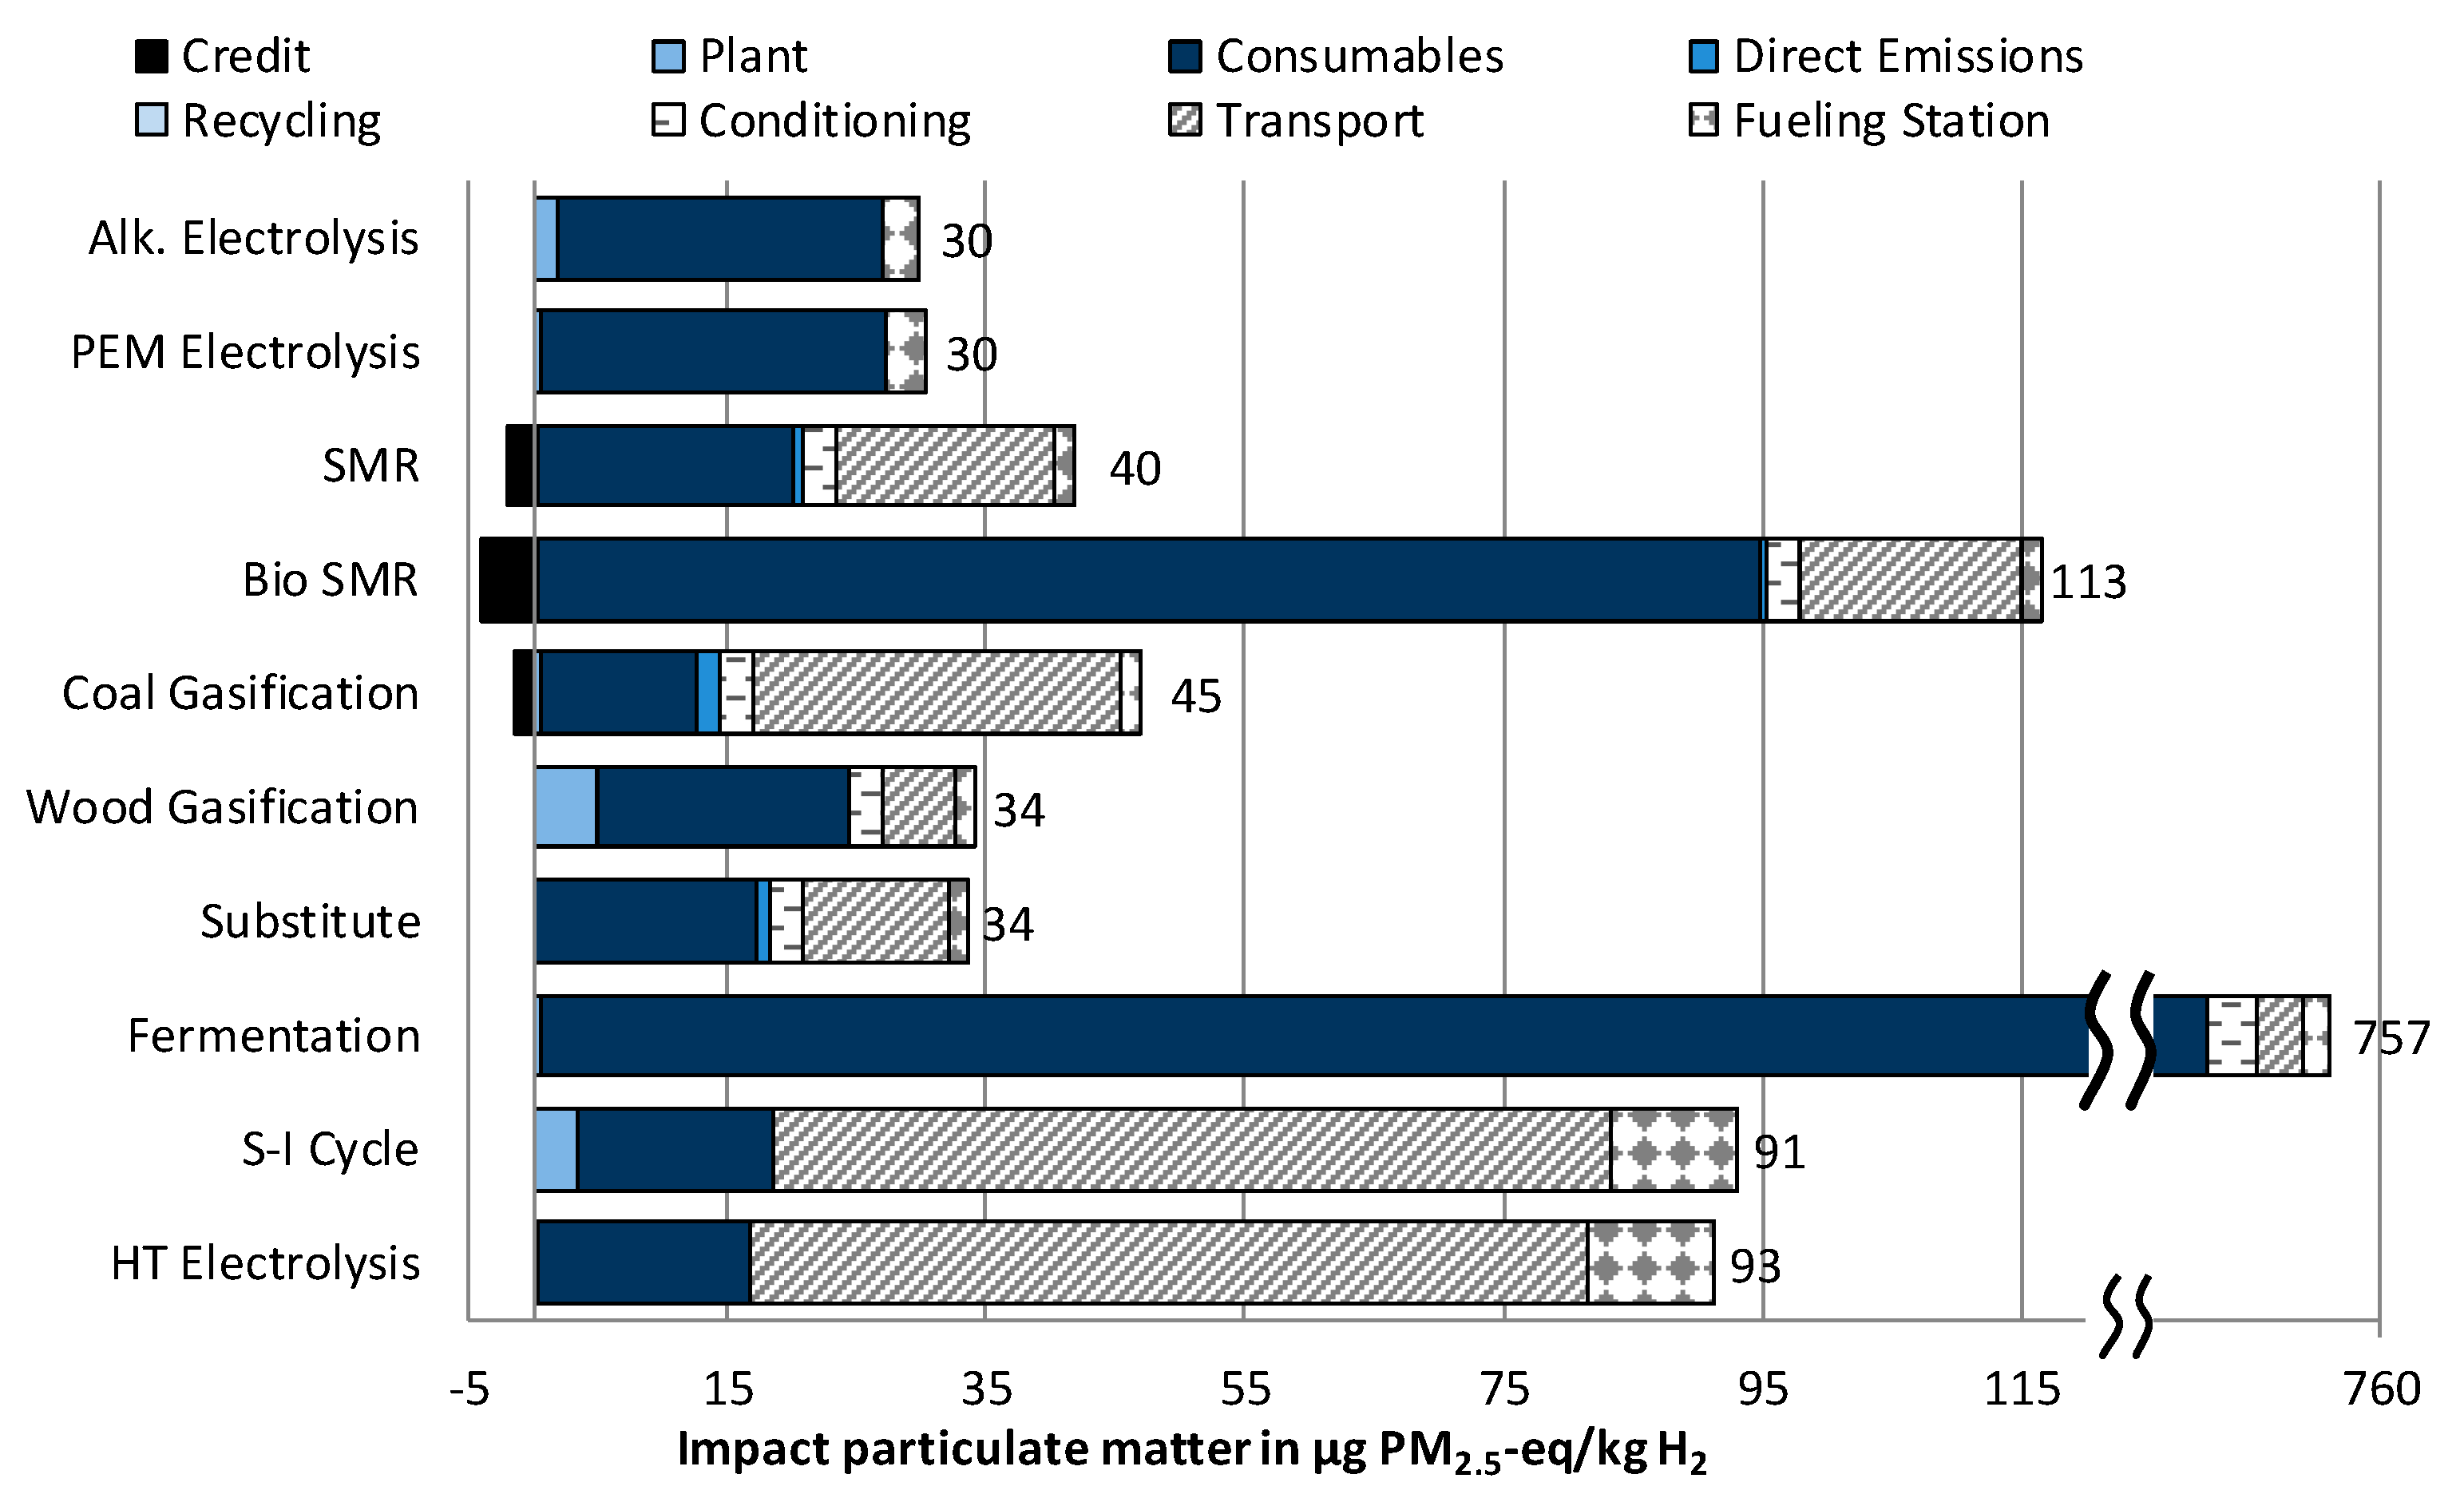
As this impact category is often not determined by primary particulate matter (particles < 10 µm) but by secondary particulate matter (sulfur dioxide, nitrous oxide and ammonia) (Figure 6), similar results to those for the impact category Acidification are revealed, and a similar explanation can be found (e.g., direct ammonia emissions due to fertilizers for biomethane supply). This affect is amplified due to there being more primary particulate matter from agricultural processes (e.g., harvest and grinding of corn). Another source of primary particulate matter is the recycling of wind power plants and here in particular the grinding of the rotor blades. Because of this, electrolysis with wind power even has slightly higher emissions (27 µg PM2.5-eq/kg H2, both technologies) compared to gasification of forest residues (25 µg PM2.5-eq/kg H2) and substituted hydrogen from the industry (18 µg PM2.5-eq/kg H2). Another major source is vehicle emissions (e.g., for transporting the hydrogen). This defines the overall result for hydrogen transport, in particular from Northern Africa (75 µg PM2.5-eq/kg H2). The actual production of hydrogen there only accounts for 17 (high-temperature electrolysis) and 19 µg PM2.5-eq/kg H2 (sulfur-iodine cycle), respectively. The fossil fuel-based production technologies have comparably low particulate matter emissions (steam methane reforming 19 µg PM2.5-eq/kg H2, coal gasification 13 µg PM2.5-eq/kg H2, substituted hydrogen 18 µg PM2.5-eq/kg H2) due to mandatory particle filters.
3.1.6. Impact Category Human Toxicity
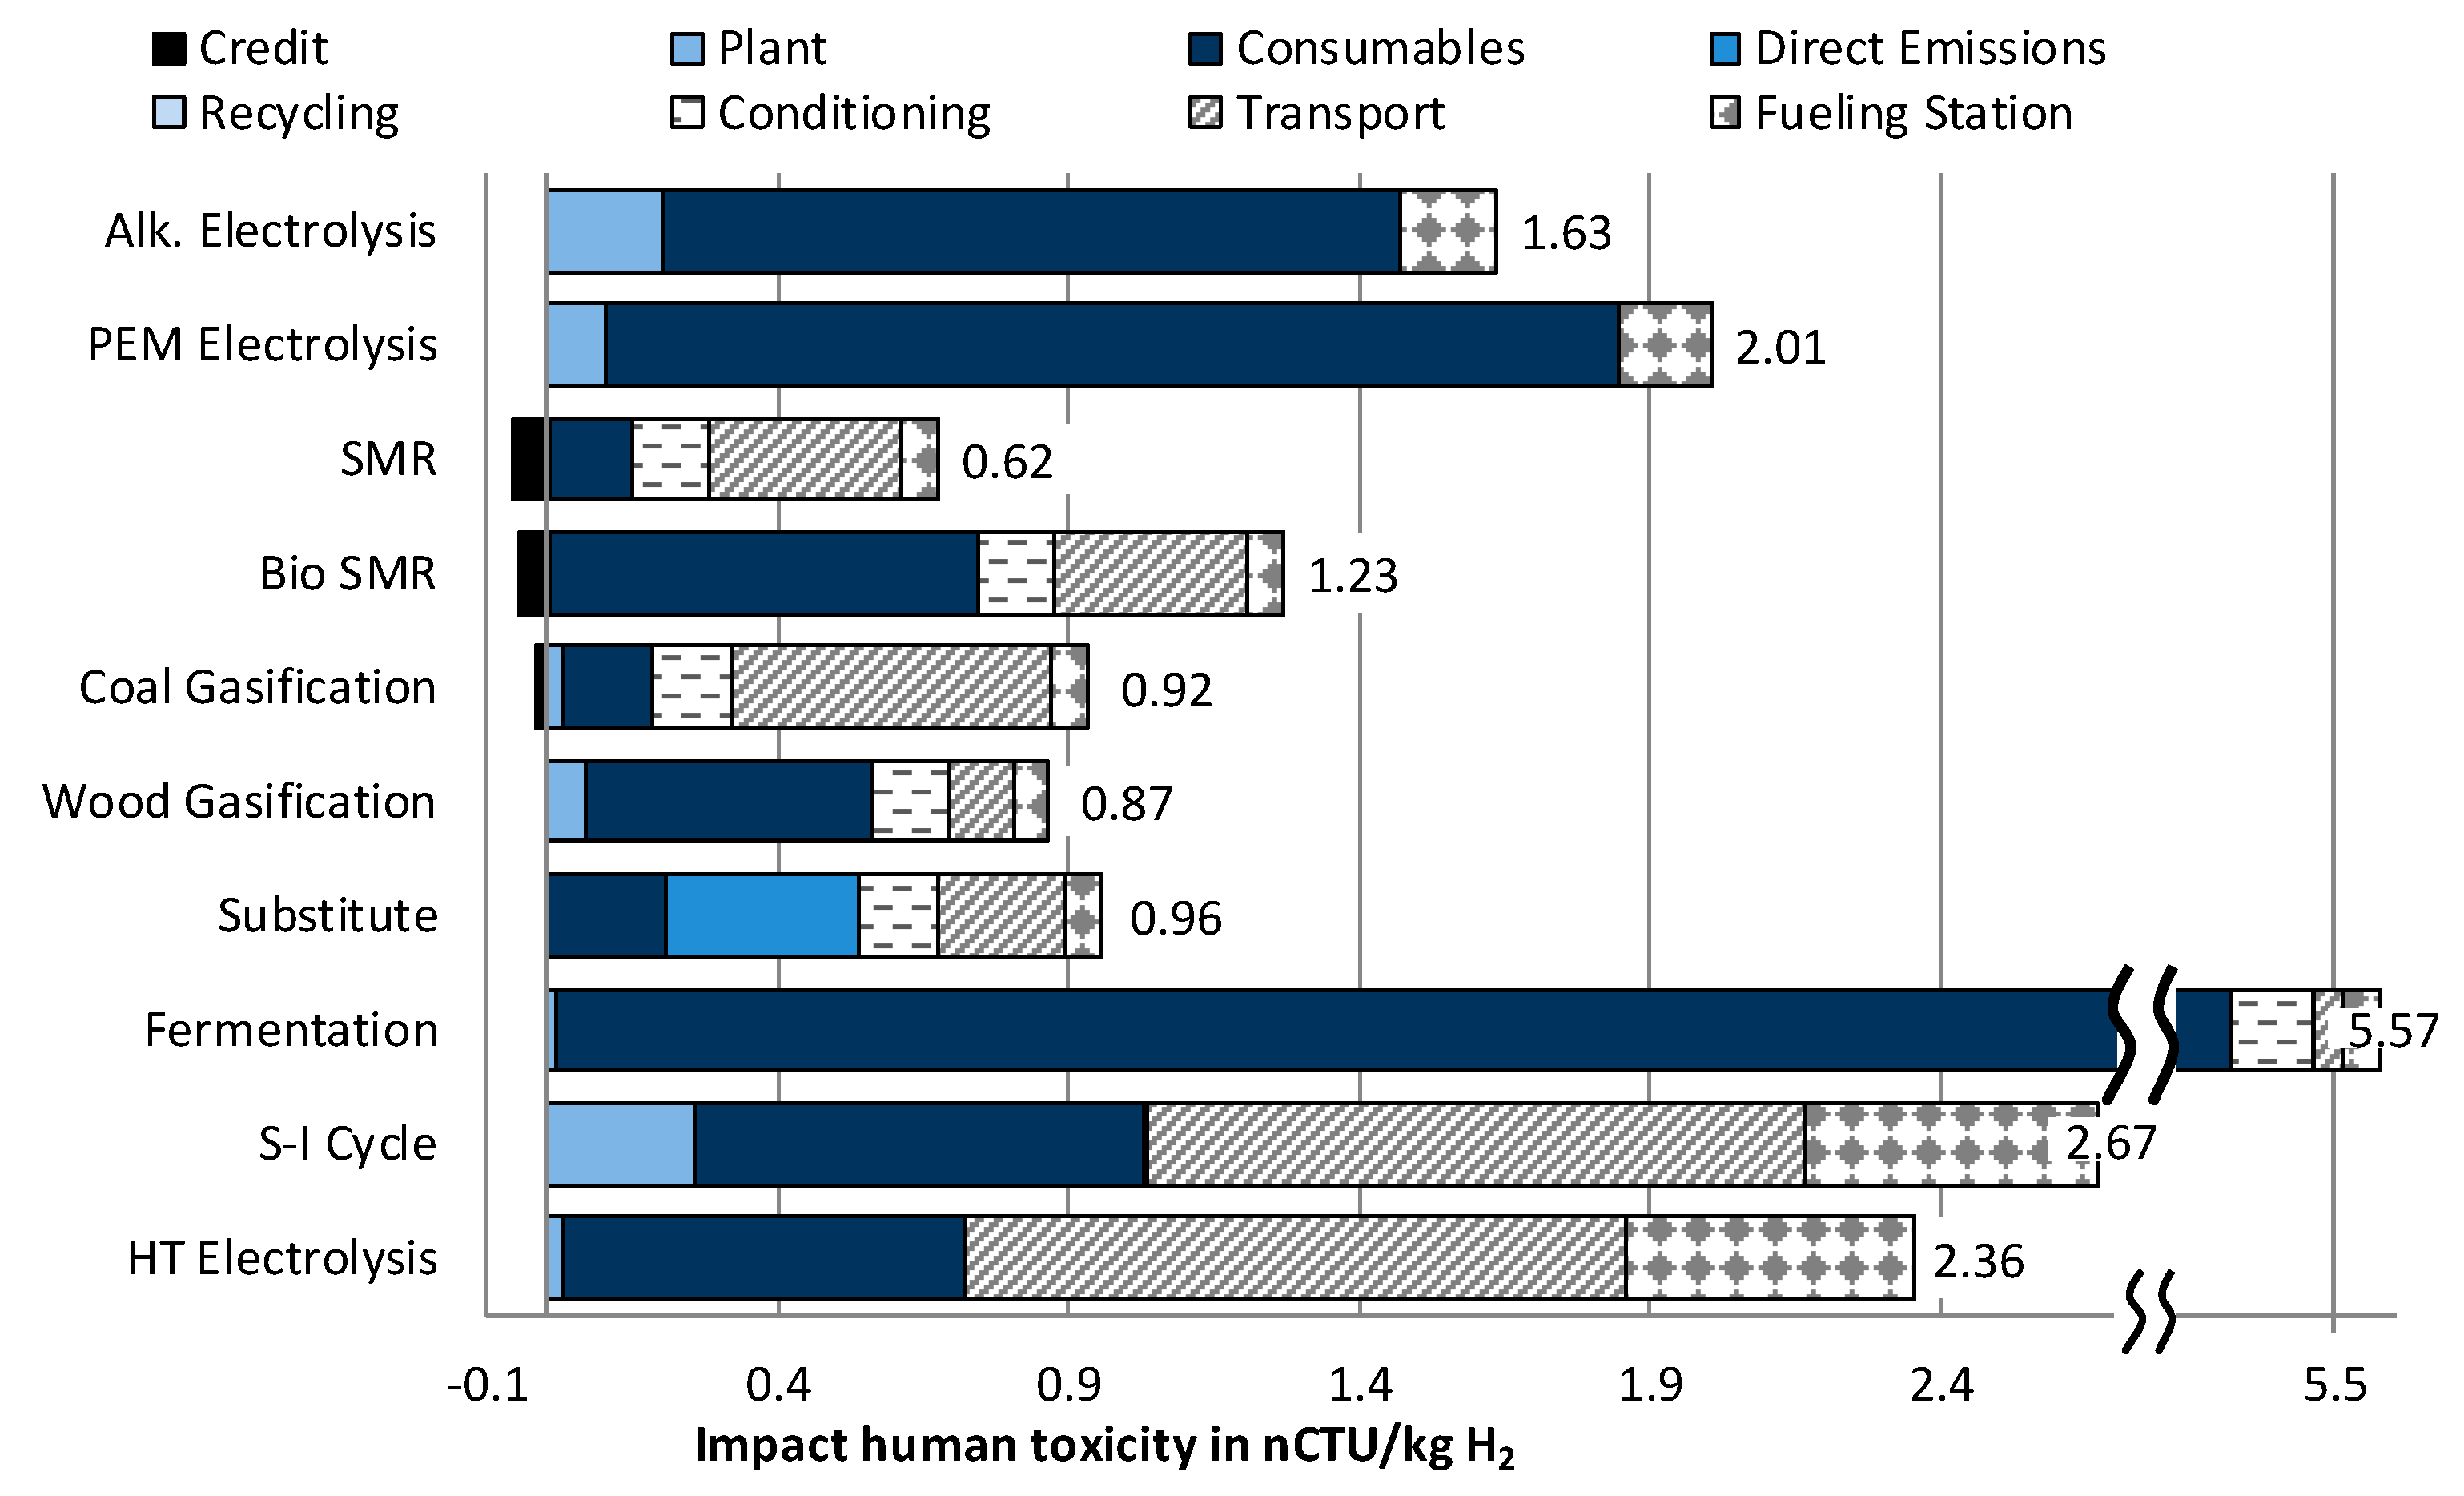
Wind-powered hydrogen production does not show the lowest results for the impact category Human toxicity (1.47 and 1.85 nCTU/kg H2 for alkaline and PEM electrolysis) (Figure 7). This is due to emissions for supplying electricity from wind power. In the reduced list of assessed substances, carbon disulfide is the main source (72% of total hydrogen production emissions) that is emitted in the pre-chains of the construction of wind power plants. Other sources are the extraction of platinum, leading to the results for the construction of the PEM electrolyzer (0.10 nCTU/kg H2), and the extraction of natural gas (0.014 from total 0.09 nCTU/kg H2 for SMR and 0.010 from total 0.54 for substituted hydrogen). Another important substance is acrolein, which is produced by diesel engines. Therefore, transportation processes have a high impact on the results; most important for the results is truck transport (1.14 nCTU/kg H2 from Northern Africa and 0.04–0.55 nCTU/kg H2 within Germany). The lowest impact regarding Human toxicity is for steam methane reforming (0.09 nCTU/kg H2). The direct emissions, however, not only of steam methane reforming (SMR) but also coal gasification (total hydrogen production 0.17 nCTU/kg H2), might be underestimated. For these processes, the direct emissions are picked by hand and emissions like formaldehyde are not considered. For the substituted hydrogen from industry, a broader range of direct emissions is considered, leading to a much larger impact of direct emissions (0.34 from 0.54 nCTU/kg H2) for the combustion of fossil fuels. The assessment could be improved by including more direct emissions in the life cycle inventory. For the gasification of woody biomass, also, more direct emissions are considered. However, these do not provoke higher impacts (0.0 from 0.56 nCTU/kg H2). The supply of digestible biomass is the determinant factor for hydrogen production by biomethane reforming (0.74 from 0.70 nCTU/kg H2) and fermentative hydrogen production (5.32 from 5.34 nCTU/kg H2).
3.1.7. Sensitivity Analysis
In many technical process chains, the used electricity mix is an important factor. As in this paper, the electricity mix is fixed to the base year (Table 2); in the sensitivity analysis, the influence of this assumption on different environmental impact categories is tested. Therefore, a potential future electricity mix mainly based on renewable energy sources is chosen (Table 4).
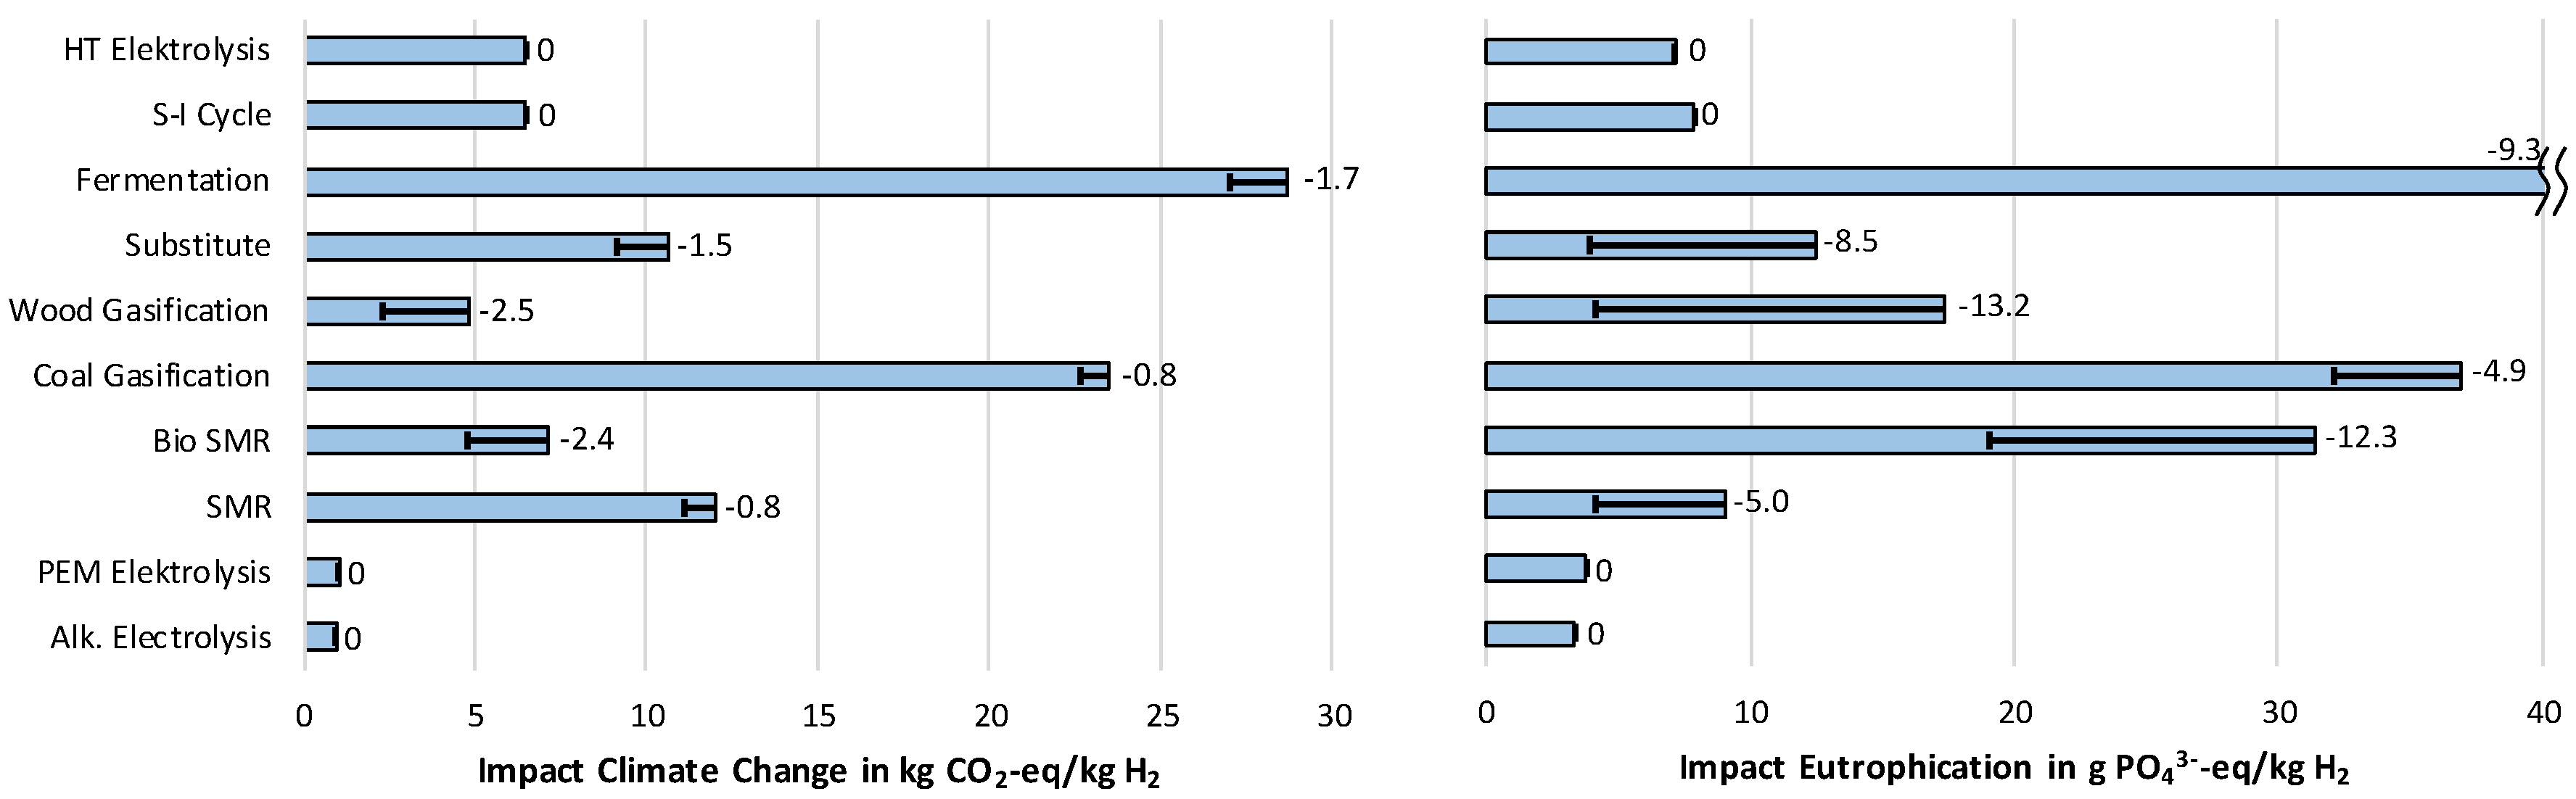
For all impact categories, it is the case that the supply chains based on wind and solar energy experience no major changes in the results, because no electricity from the grid is used. All processes are based on wind and solar power. For the impact category Climate change, some changes in the results for the other supply chains can be seen (left part of Figure 8). In particular, for the gasification of wood the emissions can be significantly reduced (−2.5 kg CO2-eq/kg H2). However, this does not change the order of preference of the analyzed options. For the impact category Eutrophication, the changes are much more distinct. Also, for this impact category the results for gasification of wood are significantly reduced (−13.2 g PO43− eq/kg H2). However, steam methane reforming (SMR) (−5.0 g PO43− eq/kg H2) and substituted hydrogen (−8.5 g PO43− eq/kg H2) can also reduce their emissions significantly. As a result, no clear preference between these three hydrogen supply chains can be given.
For the other impact categories, the changes due to a changed electricity mix are much less distinct and do not change the order of preference for the assessed hydrogen supply chains.
Next to electricity with the grid mix in all process chains, electricity from wind power is used either as energy carrier for hydrogen production (i.e., alkaline and PEM electrolysis) or for cooling and compressing the hydrogen at the HRS. Due to the upscaling of wind power plants (the environmental impacts of upscaled wind power plants are taken from the master thesis of Hanna Seefeldt at Ruhr Universität Bochum in 2018, supervised by Christina Wulf) the future emissions will change. In this sensitivity analysis it is tested, how the upscaling of onshore wind power plants will affect the results of hydrogen supply. The impacts on Climate change might decrease by 16% before 2050. However, this only has a very small effect on the hydrogen supply chains. For all supply chains with hydrogen production not directly at the HRS the change is less than 1%. For the two supply chains with local electrolyzers, this impact category decreases by around 14%. In the end, this does not change the overall assessment of the hydrogen supply chains. The biggest decrease in impact can be found for the impact category Eutrophication. These impacts can be reduced by 28% percent per kWh electricity from wind power. Again, for most of the supply chains this results in a decrease of emissions by maximum 1%. Hydrogen supply chains producing directly at the HRS can reduce their impact by up to 30%. As these are already the supply chains with the lowest impacts, they can extend their supremacy. For the other impact categories, the results look quite similar.
Another parameter that might change in the future is the efficiency of the truck for hydrogen transport. Studies suggest that up to 31.25% more efficient trucks can be operated by 2050 [56,57,58,59]. Figure 9 shows on the left part for the impact category Climate change a reduction of environmental impacts of truck driving by 30%. The strongest decrease in emissions can be observed for the imported hydrogen from Northern Africa (−0.84 kg CO2-eq/kg H2). Their impact is reduced by 16%. This sets these hydrogen supply chains more apart from the reforming of biomethane (1.10 kg CO2-eq/kg H2), but they cannot reach the values for wood gasification (0.68 kg CO2-eq/kg H2). For the other supply chains with road transport in Germany, greenhouse gas emissions can be reduced by up to 14%. However, this does not change the rank order of the assessed process chains. For the impact category Photochemical ozone formation (Figure 9, right diagram), impacts for high-temperature electrolysis and sulfur-iodine cycle can be reduced by one third (−0.52 g Ethen-eq/kg H2). However, these supply chains still cause much higher impacts than most of the other supply chains due to other transport emissions and heat demand for dehydrogenation. Up to 7% can be the reduction of impacts for the other supply chains, which has little effect on the overall results.
Other parameter variations regarding transport with LOHCs, e.g., heat source for dehydrogenation can be found in Wulf and Zapp [41].
3.2. Economic Assessment
3.2.1. Levelized Cost of Hydrogen Supply
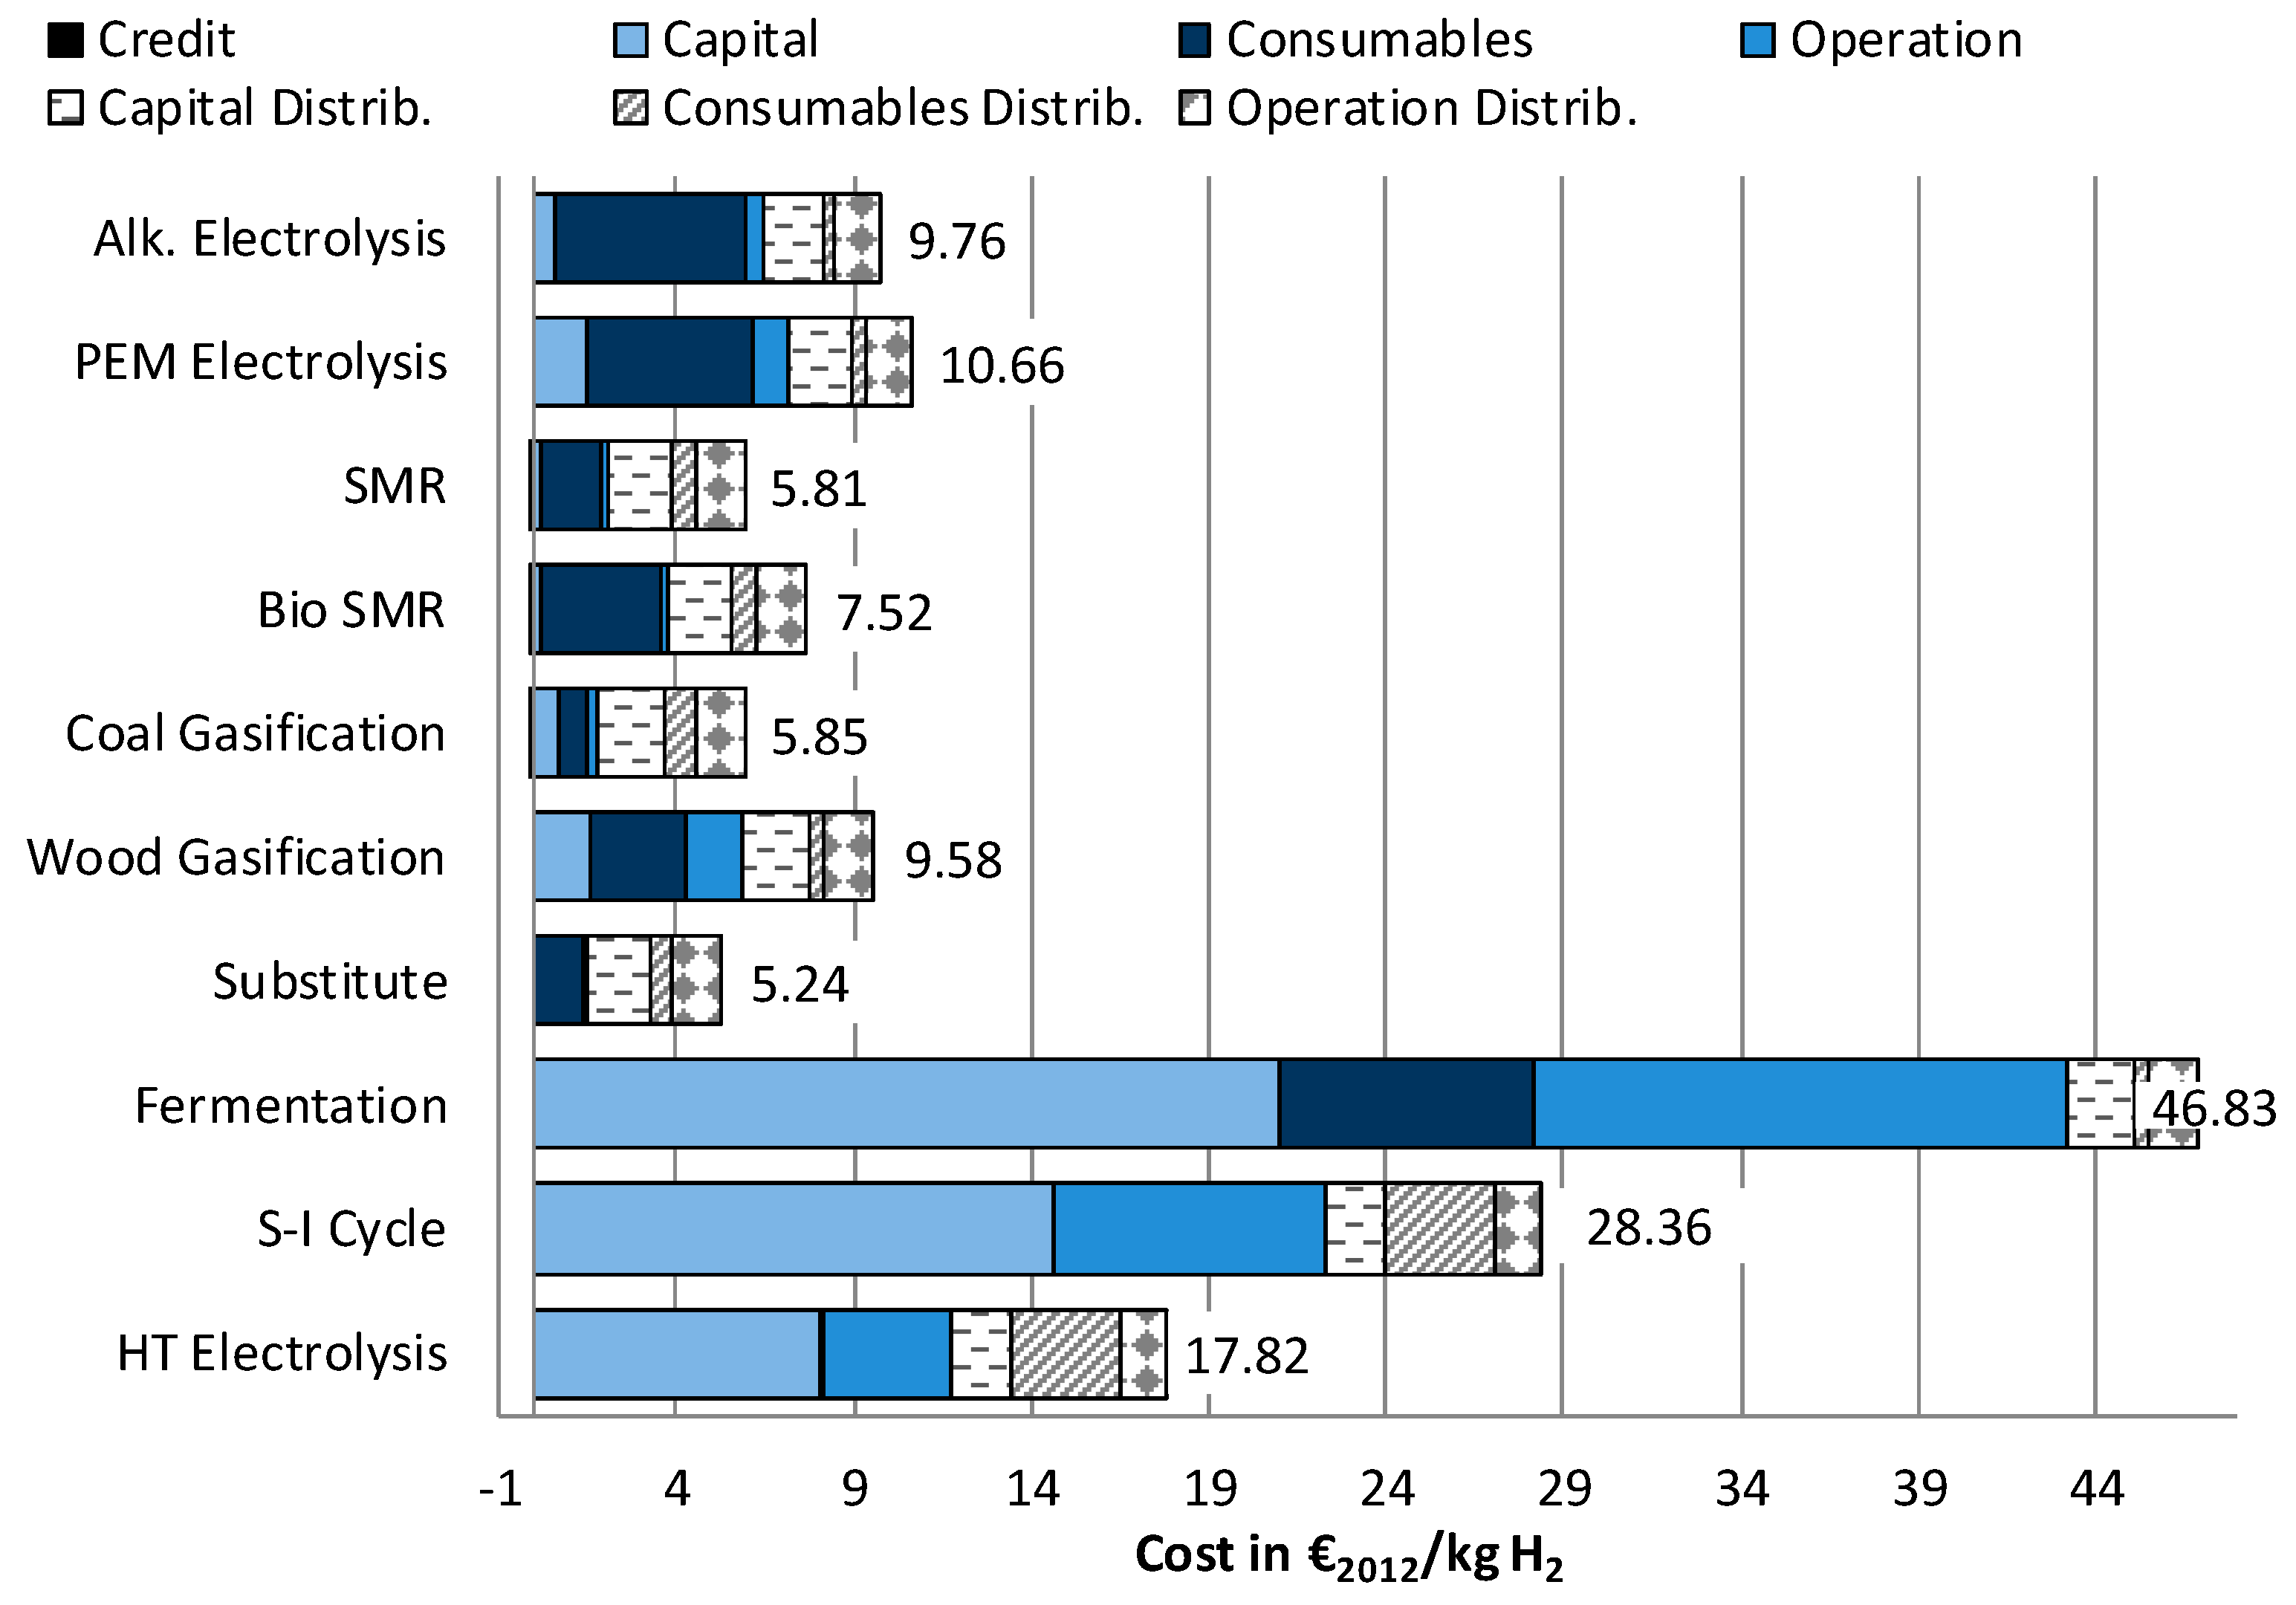
The lowest cost for hydrogen supply (Figure 10) is achieved by the substituted hydrogen from industry (1.45 €/kg H2), due to low costs for investments, as well as operational resources (i.e., natural gas and electricity from the grid). In the same way, fossil fuel-based supply chains (coal gasification, steam methane reforming (SMR)) achieve low hydrogen production costs (1.73 and 1.92 €/kg H2, respectively). In these supply chains, the costs for hydrogen transport and distribution are determinant (between 3.67 and 4.12 €/kg H2). The high costs for investments, i.e., the hydrogen refueling station (HRS) (1.86 €/kg H2), and the corresponding high costs for operation and (2.40 €/kg H2) are the reasons for this. The transport distance, in contrast, has a very small effect on the overall result (between 0.35 and 0.86 €/kg H2). This is why hydrogen from wind power cannot compensate the higher cost for hydrogen production with low distribution costs. Both electrolyzer technologies are affected by the high costs for electricity (5.42 from 6.45 €/kg H2 for alkaline electrolysis and 4.66 from 7.20 €/kg H2). Additionally, due to the lower full load hours, PEM electrolysis has higher costs for investments (1.46 €/kg H2). For biological hydrogen production, not only the low efficiency, which has been for the environmental assessment a major reason for the results, but also the high investment costs for the photobioreactor (71% of investment costs for hydrogen production), as well as the high costs for digestible biomass compared to the fossil-fueled hydrogen production technologies, are significant, leading to a total cost of 43.23 €/kg H2. Compared to the SMR the reforming of biomethane has significantly higher costs (3.26 €/kg H2) due to the higher costs for biomethane than natural gas. For solar power-based hydrogen, production processes the investment costs for the CSP systems are the determining factor (58% sulfur-iodine cycle and 83% high-temperature electrolysis, respectively, of investment costs for hydrogen production, 14.57 and 8.06 €/kg H2). The actual facilities, in particular, the high-temperature electrolysis, have significantly lower costs, leading to a total cost of 22.30 and 11.78 €/kg H2 for sulfur-iodine cycle and high-temperature electrolysis. Added to these high hydrogen production costs are higher costs for transport due to the long distance with trucks. The additional ship transport only amounts to 2% of the actual transport costs.
3.2.2. Sensitivity Analysis
For the economic assessment, too, several parameters can be identified that determine the results. Here the full load hours, investment costs, cost of consumables and the interest rate are varied from a decrease of 50% to an increase of 40% (Figure 11).
The interest rate is varied for the alkaline electrolysis (Figure 11a) and the steam methane reforming (Figure 11b). For both technologies, this parameter has no influence. For the alkaline electrolysis, the electricity cost is the most sensitive input parameter (6.90–12.04 €/kg H2), followed by the investment cost for the hydrogen refueling station (8.32–10.91 €/kg H2). Also, the number of full load hours has some impact (9.46–10.79 €/kg H2). For the other analyzed technologies (SMR (5.65–7.66 €/kg H2), high-temperature electrolysis (14.53–28.62 €/kg H2), gasification of wood (9.26–14.52 €/kg H2), Figure 11b–d), however, the full load hours are by far the most important parameter. For the SMR the next most sensitive parameter is the cost for natural gas (Figure 11b) (4.98–6.65 €/kg H2), while the high temperature electrolysis is more sensible regarding the investment cost for the solar power equipment (Figure 11c) (13.84–21.03 €/kg H2). Also, for the gasification of wood (Figure 11), the investment cost for the facility (8.40–10.99 €/kg H2) is more important than the cost of the feedstock (8.92–10.32 €/kg H2), and the external power supply has almost no influence on the result.
4. Final Considerations
In this paper, a comprehensive assessment of future hydrogen supply chains for mobility in Germany is performed. A variety of hydrogen production technologies using the spectrum of potential energy sources are assessed, not only with an LCA (using six impact categories), but also regarding life cycle costs.
- In five out of six environmental impact categories, wind powered electrolysis reaches the lowest results. However, these hydrogen supply chains have significantly higher costs than the fossil fuel and biomass-based supply chains. The differences between PEM and alkaline electrolysis are very small. If it were necessary to choose only from between these two technologies, a more detailed assessment would be necessary.
- The lowest costs can be achieved with the usage of substituted hydrogen from chemical industry, but with high impacts on climate change.
- The lowest cost of hydrogen supply from renewable sources can be achieved by steam reforming of biomethane, which would reduce the impact on Climate change by roughly 50% compared to conventional steam methane reforming (SMR). Simultaneously, high impacts regarding Acidification and Particulate matter occur.
- Hydrogen production from solar power shows, in itself, very low environmental impacts. When additionally considering, however, the long-distance transport to Germany, higher results are achieved in four out of six impact categories than from fossil fuel-based hydrogen. Furthermore, in the future, the costs of these technologies will also exceed further developed technologies by far.
- In both assessments, LCA and costs, always the biological hydrogen production showed the highest results due to a low efficiency, usage of crop grown biomass and high costs for investments.
- The two technologies used at the moment for hydrogen production—steam methane reforming (SMR) and coal gasification—stand out for their low costs. At the same time, they produce high impacts on Climate Change, and for coal gasification, also on Eutrophication.
In the timeframe assessed here it is not possible to have the cheapest and most environmentally friendly hydrogen supply at the same time. Suggestions to close this gap between environmental and economic results are to reduce costs for electricity from wind power and investment costs for electrolyzers and hydrogen refueling stations further. As an alternative, biomethane could only be produced from waste biomass like manure and organic waste. These, however, are less available resources and could probably not fuel as many hydrogen-driven vehicles as other hydrogen supply chains.
Author Contributions
C.W. conceived and designed the data collection and elaboration, modeling and data calculation in Umberto. M.K. provided direction, guidance and a critical revision of the paper. C.W. analyzed the data and wrote the paper.
Acknowledgments
This work is based on the PhD thesis by Christina Wulf “Wasserstoff im motorisierten Individualverkehr—Möglichkeiten und deren Bewertung” at the Hamburg University of Technology 2017. The thesis was conducted within the project “Wissenschaftliche Begleitung einschließlich technischer, ökologischer und ökonomischer Analysen im Rahmen des Verbundprojekts “Wasserstoffstation Hamburg”” financed by Vattenfall Innovation GmbH. Costs for publishing are covered by Forschungszentrum Jülich GmbH.
Conflicts of Interest
The authors declare no conflict of interest. The founding sponsors had no role in the design of the study; in the collection, analyses, or interpretation of data; in the writing of the manuscript, and in the decision to publish the results.
Appendix A

Table A1.
Data of hydrogen production by alkaline electrolysis (AE) own data and [39,60,61,62,63,64,65,66,67,68] and PEM electrolysis [62,69,70,71,72].
| AE | PEM | ||
|---|---|---|---|
| Capacity | kg/h | 26 | 48 |
| Life time stack | a/a | 10 | 8 |
| Full load hours | h | 7500 | 4000 |
| Operating resources | |||
| Electricity | kWh/kg H2 | 49 | 50 |
| Water | kg/kg H2 | 19 | 19 |
| Potassium hydroxide | g/kg H2 | 0.85 | - |
| Construction materials | |||
| Steel, low alloy | kg | 12,900 | 36,000 |
| Reinforcing steel | kg | - | 1600 |
| Aluminum | kg | 63 | 530 |
| Chrome | kg | 200 | - |
| Nickel | kg | 200 | - |
| Polyethylene granulate | kg | 50 | - |
| Platinum-group metals | g | - | 230 |
| Graphite | kg | - | 2.1 |
| Titan | g | - | 760 |
| Nafion | kg | - | 5.8 |
| Solvent | kg | - | 1.1 |
| Cast iron | kg | - | 260 |
| Copper | g | - | 650 |
| Silicon | kg | - | 1.3 |
| Cost | |||
| Investment | M€ | 1.0 | 2.5 |
| Cost stack replacement | M€/replacement | 0.35 | 0.98 |
Table A2.
Data of hydrogen production by steam methane reforming SMR [60,73,74,75,76,77], coal gasification CG [35,36,74,77,78], wood gasification (WG) [77,79,80] and substituting hydrogen with natural gas in the chemical industry (SUB) [81,82].
| SMR | CG | WG | SUB | ||
|---|---|---|---|---|---|
| Capacity | kg/h | 5000 | 10,000 | 610 | 450 |
| Full load hours | h/a | 7500 | 7500 | 7500 | 7500 |
| Operating resources | |||||
| Electricity | kWh/kg H2 | 0.20 | - | 3.9 | 1.6 |
| Natural gas | MJ/kg H2 | 158 | - | - | 3.0 |
| Coal | kg/kg H2 | - | 7.3 | - | - |
| Wood chips | kg/kg H2 | - | - | - | 3.0 |
| Water | kg/kg H2 | 14.4 | 5.0 | 5.9 | - |
| Triethylene glycol | g/kg H2 | - | 60 | - | - |
| Olivin | g/kg H2 | - | - | 260 | - |
| N2 liquid | g/kg H2 | - | - | 360 | - |
| Ash | g/kg H2 | - | - | 320 | - |
| Steam, credit | kg/kg H2 | 5.3 | - | - | - |
| Electricity, credit | kWh/kg H2 | - | 1.0 | - | - |
| Sulfur, credit | g/kg H2 | - | 91 | - | - |
| Construction materials | |||||
| Steel, low alloy | t | 100 | - | - | - |
| Steel, high alloy | t | 60 | - | - | - |
| Steel, no alloy | t | 240 | - | - | - |
| Zinc | t | 0.3 | - | - | - |
| Aluminum | t | 3.5 | - | - | - |
| Nickel | t | 0.3 | - | - | - |
| Copper | t | 0.1 | - | - | - |
| Concrete | t | 1,300 | - | - | - |
| Plant 1 | Units | - | 87.5 | 4.6 | 1 × 10⁻⁵ |
| Direct emissions | |||||
| CO2 | kg/kg H2 | 8.55 | 19.3 | - | 6.7 |
| CH4 | g/kg H2 | 1.82 | - | 0.1 | 2.0 |
| CO | g/kg H2 | 1.1 | - | 0.01 | 0.17 |
| NMHC | g/kg H2 | 3.4 | - | 0.0007 | 0.32 |
| NOx | g/kg H2 | 2.3 | 0.010 | 0.03 | 1.9 |
| SO2 | mg/kg H2 | 110 | - | 43 | 65 |
| PM2.5 | mg/kg H2 | 22 | 390 | 3.4 | 12 |
| H2S | mg/kg H2 | - | 5.62 | 0.0009 | - |
| Further emissions | 2 | 2 | |||
| Cost | |||||
| Investment | M€ | 89 | 480 | 105 | 0.45 |
| Capacity | kg/h | 60 |
| Full load hours dark fermentation | h/a | 7500 |
| Full load hours photo fermentation | h/a | 3300 |
| Operating resources | ||
| Feedstock mix | kg/kg H2 | 262 |
| Electricity | kWh/kg H2 | 1.8 |
| Heat | kWh/kg H2 | 7.3 |
| Potassium hydroxide | kg/kg H2 | 1.5 |
| Dipotassium phosphate | kg/kg H2 | 0.30 |
| Water | kg/kg H2 | 240 |
| Waste water | m3/h | 1.3 |
| Construction materials | ||
| Plant 1 | Units | 1.0 |
| Cost | ||
| Investment photobioreactor | M€ | 96 |
| Investment balance of plant | M€ | 26 |
1 Anaerobic digestion plant according to [33].
Table A4.
Data of hydrogen production by sulfur-iodine cycle S-I [86,87,88,89,90] and high-temperature electrolysis HT [91,92,93,94].
| S-I | HT | ||
|---|---|---|---|
| Capacity | kg/h | 414 | 208 |
| Full load hours | h/a | 6300 | 6300 |
| Maximum temperature | °C | 850 | 800 |
| Operating resources | |||
| Electricity | kWh/kg H2 | 20 | 36 |
| Heat | kWh/kg H2 | 78 | 2.5 |
| Water | kg/kg H2 | 9 | 9.9 |
| Construction materials | |||
| Sulfuric acid | t | 6.5 | - |
| Iodine | t | 120 | - |
| Helium | t | 2 | - |
| Inconel | t | 40 | - |
| Steel, low alloy | t | - | 6.7 |
| Nickel oxide | kg | - | 910 |
| Yttrium-stabilized zirconium oxide | kg | - | 800 |
| Lanthanum strontium manganite | kg | - | 160 |
| Solvent | t | - | 3.0 |
| Balance of plant 1 | t | 1000 | 50 |
| Direct emissions 2 | |||
| Sulfuric acid | kg | 320 | - |
| Iodine | kg | 5300 | - |
| SO2 | kg | 210 | - |
| Cost | |||
| Investment hydrogen production | M€ | 150 | 10 |
| Investment solar tower power plant | M€ | 220 | 89 |
1 Chemical factory according to [33]; 2 over the whole life time.
| Fueling station | ||
| Capacity | kg/d | 700 |
| Capacity utilization | % | 75 |
| Number storage tank bundles | 1 | |
| Operating resources | ||
| Electricity (onsite H2 production, LOHC) 1 | kWh/kg H2 | 3.2 |
| Electricity (delivered H2) 1 | kWh/kg H2 | 1.0 |
| Construction materials | ||
| Gaseous fueling station 2 | unit | 0.8 |
| Cost | ||
| Investment | M€ | 4.3 |
| Storage tank bundle | M€/bundle | 0.25 |
| High pressure transport | ||
| Capacity per transport | kg | 1100 |
| Pressure level | bar | 500 |
| Operating resources | ||
| Electricity 3 | kWh/kg H2 | 2.2 |
1 Compression and precooling; 2 Size/price depending on capacity of hydrogen production facility (HT/S-I); 3 Compression to 500 bar for transport.
| Capacity dehydrogenation | kW | 970 |
| Full load hours (de)hydrogenation | h | 6570 1 |
| Capacity hydrogenation | MW | 5.8/11.6 2 |
| Operating resources | ||
| Heat dehydrogenation 3 | kWh/kg H2 | 10 |
| Electricity for dehydrogenation | kWh/kg H2 | 1.6 |
| Cost | ||
| Investment dehydrogenation | M€ | 0.78 |
| Investment hydrogenation | M€ | 429/648 2 |
| Cost LOHC | €/kg | 4.0 |
| Demand LOHC | t/fueling station | 40 |
| Transport | ||
| Distance ship | km | 3600 |
| Distance truck (Germany + Algeria) | km | 465 + 650 |
| Storing capacity H2 in LOHC | % (weight) | 6.2 |
| Production LOHC | ||
| Heat | kWh/kg LOHC | 0.37 |
| Electricity | kWh/kg LOHC | 0.06 |
| Chlorine | kg/kg LOHC | 0.52 |
| Toluene | kg/kg LOHC | 1.12 |
| Disposal hydrochloric acid | kg/kg LOHC | 0.49 |
1 Corresponds to 75% capacity utilization of the fueling station; 2 Size/price depending on capacity of hydrogen production facility (HT/S-I); 3 Temperature level of 300 °C.
References
- Global Market Insights. Fuel Cell Electric Vehicle Market Size By Vehicle (PCV, LCV, HCV, E-Bikes, Forklifts), By Distance (Short Range, Long Range), Industry Analysis Report, Regional Outlook (U.S., Canada, Germany, UK, France, Italy, Spain, Sweden, Norway, Netherlands, China, Japan, India, Korea, Brazil, Mexico, Argentina, Saudi Arabia, UAE, South Africa), Growth Potential, Price Trends, Competitive Market Share & Forecast, 2017–2024; Global Market Insights: Selbyville, DE, USA, 2018. [Google Scholar]
- Da Silva Veras, T.; Mozer, T.S.; da Costa Rubim Messeder dos Santos, D.; da Silva César, A. Hydrogen: Trends, production and characterization of the main process worldwide. Int. J. Hydrogen Energy 2017, 42, 2018–2033. [Google Scholar] [CrossRef]
- Hosseini, S.E.; Wahid, M.A. Hydrogen production from renewable and sustainable energy resources: Promising green energy carrier for clean development. Renew. Sustain. Energy Rev. 2016, 57, 850–866. [Google Scholar] [CrossRef]
- Sinigaglia, T.; Lewiski, F.; Santos Martins, M.E.; Mairesse Siluk, J.C. Production, storage, fuel stations of hydrogen and its utilization in automotive applications-a review. Int. J. Hydrogen Energy 2017, 42, 24597–24611. [Google Scholar] [CrossRef]
- Dincer, I.; Acar, C. Review and evaluation of hydrogen production methods for better sustainability. Int. J. Hydrogen Energy 2015, 40, 11094–11111. [Google Scholar] [CrossRef]
- Nikolaidis, P.; Poullikkas, A. A comparative overview of hydrogen production processes. Renew. Sustain. Energy Rev. 2017, 67, 597–611. [Google Scholar] [CrossRef]
- Gnanapragasam, N.V.; Reddy, B.V.; Rosen, M.A. A Methodology for Assessing the Sustainability of Hydrogen Production from Solid Fuels. Sustainability 2010, 2, 1472–1491. [Google Scholar] [CrossRef]
- Kuckshinrichs, W.; Ketelaer, T.; Koj, J.C. Economic Analysis of Improved Alkaline Water Electrolysis. Front. Energy Res. 2017, 5, 1. [Google Scholar] [CrossRef]
- Shaner, M.R.; Atwater, H.A.; Lewis, N.S.; McFarland, E.W. A comparative technoeconomic analysis of renewable hydrogen production using solar energy. Energy Environ. Sci. 2016, 9, 2354–2371. [Google Scholar] [CrossRef]
- Han, W.; Liu, Z.; Fang, J.; Huang, J.; Zhao, H.; Li, Y. Techno-economic analysis of dark fermentative hydrogen production from molasses in a continuous mixed immobilized sludge reactor. J. Clean. Prod. 2016, 127, 567–572. [Google Scholar] [CrossRef]
- Bhandari, R.; Trudewind, C.A.; Zapp, P. Life cycle assessment of hydrogen production via electrolysis—A review. J. Clean. Prod. 2014, 85, 151–163. [Google Scholar] [CrossRef]
- Valente, A.; Iribarren, D.; Dufour, J. Harmonised life-cycle global warming impact of renewable hydrogen. J. Clean. Prod. 2017, 149, 762–772. [Google Scholar] [CrossRef]
- Mehmeti, A.; Angelis-Dimakis, A.; Arampatzis, G.; McPhail, S.; Ulgiati, S. Life Cycle Assessment and Water Footprint of Hydrogen Production Methods: From Conventional to Emerging Technologies. Environments 2018, 5, 24. [Google Scholar] [CrossRef]
- Wulf, C.; Kaltschmitt, M. Life Cycle Assessment of hydrogen supply chain with special attention on hydrogen refuelling stations. Int. J. Hydrogen Energy 2012, 37, 16711–16721. [Google Scholar] [CrossRef]
- Ozawa, A.; Inoue, M.; Kitagawa, N.; Muramatsu, R.; Anzai, Y.; Genchi, Y.; Kudoh, Y. Assessing Uncertainties of Well-To-Tank Greenhouse Gas Emissions from Hydrogen Supply Chains. Sustainability 2017, 9, 1101. [Google Scholar] [CrossRef]
- Burkhardt, J.; Patyk, A.; Tanguy, P.; Retzke, C. Hydrogen mobility from wind energy—A Life Cycle Assessment focusing on the fuel supply. Appl. Energy 2016, 181, 54–64. [Google Scholar] [CrossRef]
- ISO 14040:2006 Environmental Management—Life Cycle Assessment—Principles and Framework; German and English Version; Beuth Verlag: Berlin, Germany, 2006.
- ISO 14044:2006 Environmental Management—Life Cycle Assessment—Requirements and Guidelines; German and English Version; Beuth Verlag: Berlin, Germany, 2006.
- VGB Powertech. Levelised Cost of Electricity; VGB PowerTech e.V.: Essen, Germany, 2015. [Google Scholar]
- Deutsche Bundesbank. Time Series BBK01.WZ3449: Term Structure of Interest Rates on Listed Federal securities (Method by Svensson)/Residual Maturity of 20.0 years/End of Month. Available online: http://www.bundesbank.de/Navigation/EN/Statistics/Time_series_databases/Macro_economic_time_series/its_details_value_node.html?listId=www_skms_it03a&tsId=BBK01.WZ3449 (accessed on 15 September 2017).
- Statista. Inflation Rate in Germany from 1992 to 2015 (Change of CPI Compared to the Previous Year). Available online: https://www.statista.com/statistics/262859/inflation-rate-in-germany-changes-of-the-cpi-compared-to-the-previous-year/ (accessed on 15 September 2017).
- Verband der Chemischen Industrie (VCI). Chemiewirtschaft in Zahlen; Verband der Chemischen Industrie: Frankfurt am Main, Germany, 2017. [Google Scholar]
- Schoots, K.; Ferioli, F.; Kramer, G.; Vanderzwaan, B. Learning curves for hydrogen production technology: An assessment of observed cost reductions. Int. J. Hydrogen Energy 2008, 33, 2630–2645. [Google Scholar] [CrossRef]
- EU (European Union); G. Technology Readiness Levels (TRL). Horizon 2020—Work Programme 2014–2015: General Annexes; European Commission: Brussels, Belgium, 2014. [Google Scholar]
- Reuß, M.; Grube, T.; Robinius, M.; Wasserscheid, P.; Stolten, D. Seasonal storage and alternative carriers: A flexible hydrogen supply chain model. Appl. Energy 2017, 200, 290–302. [Google Scholar] [CrossRef]
- Nitsch, J.; Gerhardt, J.; Wenzel, B. Langfristszenarien und Strategien für den Ausbau der Erneuerbaren Energien in Deutschland bei Berücksichtigung der Entwicklung in Europa und Global: Schlussbericht; Deutsches Zentrum für Luft- und Raumfahrt; Fraunhofer IWES; Ingenieurbüro für neue Energien: Teltow, Germany, 2012. [Google Scholar]
- Capros, P.; de Vita, A.; Tasios, N.; Siskos, P.; Kannavou, M.; Petropoulos, A.; Evangeloppoulau, S.; Zampara, M.; Papadopoulos, D.; Nakos, C.; et al. EU Reference Scenario 2016: Energy, Transport and GHG Emissions Trends to 2050; European Union: Luxembourg, 2016. [Google Scholar]
- European Commission-Joint Research Centre (EU-JRC). Recommendations for Life Cycle Impact Assessment in the European Context—Based on Existing Environmental Impact Assessment Models and Factors; European Commission-Joint Research Centre; Institute for Environment and Sustainability: Luxembourg, 2011. [Google Scholar]
- Hauschild, M.Z.; Goedkoop, M.; Guinée, J.; Heijungs, R.; Huijbregts, M.; Jolliet, O.; Margni, M.; De Schryver, A.; Humbert, S.; Laurent, A.; et al. Identifying best existing practice for characterization modeling in life cycle impact assessment. Int. J. Life Cycle Assess. 2013, 18, 683–697. [Google Scholar] [CrossRef]
- Guinée, J.B.; Gorrée, M.; Heijungs, R.; Huppes, G.; Kleijn, R.; Koning, A.D.; van Oers, L.; Wegener Sleeswijk, A.; Suh, S.; Haes, U.D.; et al. LCA—An Operational Guide to the ISO-Standards: Part 2b: Operational Annex; Universiteit Leiden Institute of Environmental Sciences: Leiden, The Netherlands, 2001; p. 276. [Google Scholar]
- Humbert, S.; Marshall, J.D.; Shaked, S.; Spadaro, J.V.; Nishioka, Y.; Preiss, P.; McKone, T.E.; Horvath, A.; Jolliet, O. Intake Fraction for Particulate Matter: Recommendations for Life Cycle Impact Assessment. Environ. Sci. Technol. 2011, 45, 4808–4816. [Google Scholar] [CrossRef] [PubMed]
- Rosenbaum, R.K.; Bachmann, T.M.; Gold, L.S.; Huijbregts, M.A.J.; Jolliet, O.; Juraske, R.; Koehler, A.; Larsen, H.F.; MacLeod, M.; Margni, M.; et al. USEtox—The UNEP-SETAC toxicity model: Recommended characterisation factors for human toxicity and freshwater ecotoxicity in life cycle impact assessment. Int. J. Life Cycle Assess. 2008, 13, 532–546. [Google Scholar] [CrossRef]
- Swiss Centre for Live Cycle Inventories. Ecoinvent Database Version 3.1; Swiss Centre for Live Cycle Inventories: Zürich, Switzerland, 2014. [Google Scholar]
- Wulf, C.; Linssen, J.; Zapp, P. Power-to-Gas—Concepts, Demonstration and Prospects. In Hydrogen Supply Chains: Design, Deployment and Operation; Azzaro-Pantel, C., Ed.; Elsevier: Amsterdam, The Netherlands, 2018; in press. [Google Scholar]
- Müller-Langer, F.; Tzimas, E.; Kaltschmitt, M.; Peteves, S.D. Techno-economic assessment of hydrogen production processes for the hydrogen economy for the short and medium term. Int. J. Hydrogen Energy 2007, 32, 3797–3810. [Google Scholar] [CrossRef]
- Doctor, R.D.; Molburg, J.C.; Brockmeier, N.F.; Manfredo, L.; Gorokhov, V.; Ramezan, M.; Stiegel, G.J. Life-Cycle Analysis of a Shell Gasification-Based Multi-Product System with CO2 Recovery. In Proceedings of the First National Conference on Carbon Sequestration, Washington, DC, USA, 15–17 May 2001. [Google Scholar]
- Scheftelowitz, M.; Schicketanz, S.; Reinicke, F.; Beil, M. Stromerzeugung aus Biomasse: Zwischenbericht; Deutsches Biomasseforschungszentrum (DBFZ): Leipzig, Germany, 2013. [Google Scholar]
- Kaltschmitt, M.; Weinberg, J.; Stegelmeier, M.; Bohnenschäfer, W.; Gansler, J.; Ebert, M. Teilbericht B: Analyse der Erneuerbaren Energien am Wärmemarkt. In Ökologische und Ökonomische Optimierung des Wärmemarktes; Schultz, R., Hochi, J., Personn, H., Eds.; Ibidem-Verlag: Stuttgart, Germany, 2012; pp. 109–176. [Google Scholar]
- Wurster, R.; Schaloske, M. Wasserstoff und Brennstoffzellen in der Energie- und Mobilitätswende. DWV-Mitteilungen 2015, 19–2, 3–4. [Google Scholar]
- International Maritime Organization (IMO). International Convention for the Prevention of Pollution from Ships (MARPOL): Annex VI Prevention of Air Pollution from Ships; International Maritime Organization IMO: London, UK, 2005. [Google Scholar]
- Wulf, C.; Zapp, P. Assessment of system variations for hydrogen transport by Liquid Organic Hydrogen Carriers. Int. J. Hydrogen Energy 2018. [Google Scholar] [CrossRef]
- Kiesel, F. Bruttostromerzeugung in Deutschland von 1990 bis 2012 nach Energieträgern; AG Energiebilanzen e.V.: Berlin, Germany, 2013. [Google Scholar]
- Müller-Langer, F. Analyse und Bewertung Ausgewählter Zukünftiger Biokraftstoffoptionen auf der Basis fester Biomasse. Ph.D. Thesis, Technische Universität Hamburg, Hamburg, Germany, 2011. [Google Scholar]
- DESTATIS. Imports of Hard Coal up 15.2% in 2013—Press Release 141. Available online: https://www.destatis.de/DE/PresseService/Presse/Pressemitteilungen/2014/04/PD14_141_51.html (accessed on 4 April 2018).
- Belau, T. Energiepflanzen: Daten für die Planung des Energiepflanzenanbaus, 2nd ed.; Kuratorium für Technik und Bauwesen in der Landwirtschaft: Darmstadt, Germany, 2012. [Google Scholar]
- Kaltschmitt, M.; Schlüter, M.; Schulz, D.; Skiba, M.; Özdirik, B. Stromerzeugung aus Windenergie. In Erneuerbare Energien, 5th ed.; Kaltschmitt, M., Streicher, W., Wiese, A., Eds.; Springer Vieweg: Berlin, Germany, 2013; pp. 453–554. [Google Scholar]
- Statista. Industriestrompreise in Deutschland in den Jahren 2000 bis 2016 (in Euro-Cent pro Kilowattstunde). Available online: https://de.statista.com/statistik/daten/studie/155964/umfrage/entwicklung-der-industriestrompreise-in-deutschland-seit-1995/ (accessed on 4 April 2018).
- Heimann, M. Entgelte der Amprion GmbH gültig ab 01.01.2015; Amprion GmbH: Dortmund, Germany, 2014. [Google Scholar]
- DESTATIS. Preise: Daten zur Energiepreisentwicklung; Statistisches Bundesamt: Wiesbaden, Germany, 2014. [Google Scholar]
- C.A.R.M.E.N. Energieholz-Index Grafiken. Available online: http://www.carmen-ev.de/infothek/preisindizes/hackschnitzel/graphiken (accessed on 4 April 2018).
- Deutsche Energie Agentur (DENA). Branchenkompass: Biomethan in KWK; Deutsche Energie Agentur DENA: Berlin, Germany, 2013. [Google Scholar]
- Hamburg Wasser. Gebühren, Abgaben und Preise. Available online: http://www.hamburgwasser.de/tarife-und-gebuehren.html (accessed on 18 August 2017).
- Alibaba.com. Available online: http://www.alibaba.com/ (accessed on 4 April 2018).
- Bundesverband der Energie- und Wasserwirtschaft (BDEW). BDEW-Strompreisanalyse Mai 2016: Haushalte und Industrie; Bundesverband der Energie- und Wasserwirtschaft: Berlin, Germany, 2016. [Google Scholar]
- Ritschel, W.; Schiffer, H.-W. Weltmarkt für Steinkohle; RWE Power: Essen, Germany, 2007. [Google Scholar]
- Schlesinger, M.; Hofer, P.; Kemmler, A.; Kirchner, A.; Koziel, S.; Ley, A.; Piégsa, A.; Seefeldt, S.; Weinert, K.; Lindenberger, D.; et al. Entwicklung der Energiemärkte—Energiereferenzprognose; EWI: Basel, Switzerland; GWS: Köln, Germany; Prognos: Osnabrück, Germany, 2014. [Google Scholar]
- Arndt, W.-H.; Döge, N.; Marker, S. Elektrifizierungspotential Kommerzieller Kraftfahrzeug-Flotten im Wirtschaftsverkehr als Dezentrale Energie-Ressource in Städtischen Verteilnetzen—komDRIVE; Universitätsverlag der TU Berlin: Berlin, Germany, 2017. [Google Scholar]
- Helmholtz Association. Helmholtz Alliance ENERGY-TRANS. Available online: https://www.energy-trans.de/english/24.php (accessed on 8 April 2018).
- Bernath, C.; Bossmann, T.; Deac, G.; Elsland, R.; Fleiter, T.; Kühn, A.; Pfluger, B.; Ragwitz, M.; Rehfeldt, M.; Sensfuß, F.; et al. Langfristszenarien für die Transformation des Energiesystems in Deutschland—Modul 3: Referenzszenario und Basisszenario Studie im Auftrag des Bundesministeriums für Wirtschaft und Energie; Fraunhofer ISI: Karlsruhe, Germany; Consentec GmbH: Aachen, Germany; IFEU: Heidelberg, Germany, 2017. [Google Scholar]
- Pehnt, M. Ganzheitliche Bilanzierung von Brennstoffzellen in der Energie- und Verkehrstechnik; VDI-Verlag: Düsseldorf, Germany, 2002. [Google Scholar]
- Millet, P.; Grigoriev, S. Water Electrolysis Technologies. In Renewable Hydrogen Technologies; Gandia, L.M., Arzamedi, G., Dieguez, P.M., Eds.; Elsevier: Amsterdam, The Netherlands, 2013; pp. 19–41. [Google Scholar]
- Smolinka, T.; Günther, M.; Garche, J. Stand und Entwicklungspotenzial der Wasserelektrolyse zur Herstellung von Wasserstoff aus Regenerativen Energien: NOW-Studie; Fraunhofer ISE, FCBAT: Freiburg, Geramny, 2011. [Google Scholar]
- Melaina, M.; Penev, M. Hydrogen Station Cost Estimates: Comparing Hydrogen Station Cost Calculator Results with Other Recent Estimates; National Renewable Energy Laboratory (NREL): Golden, CO, USA, 2013. [Google Scholar]
- Wurster, R. HyWays—An Integrated Project to Develop the European Hydrogen Energy Roadmap—Deliverable 1.4: Technology Fact Sheets; European Commission: Brussels, Belgium, 2007. [Google Scholar]
- Qin, D.; Brooker, P.; Srinivasan, S. Hydrogen Fueling Stations Infrastructure; University of Central Florida: Cocoa, FL, USA, 2014. [Google Scholar]
- Geitmann, S. USA Investieren in Wasserstoff-Infrastruktur: HZwei Blog. Available online: http://www.hzwei.info/blog/2014/10/20/usa-investieren-in-wasserstoff-infrastruktur/ (accessed on 8 March 2018).
- Hydrogenics. HySTAT® Hydrogen Generators; Hydrogenics: Oevel, Belgium, 2011. [Google Scholar]
- Ernst and Young; Ludwig-Bölkow Systemtechnik; Becker Büttner Held. Fahrplan zur Realisierung einer Windwasserstoff-Wirtschaft in der Region Unterelbe: Kurzdarstellung; ChemCoast e. V.: Laatzen, Germany, 2013. [Google Scholar]
- Bernhart, W.; Riederle, S.; Yoon, M. Fuel Cells: A Realistic Alternative for Zero Emission? Roland Berger Strategy Consultants: Stuttgart, Germany, 2013. [Google Scholar]
- Carmo, M.; Fritz, D.L.; Mergel, J.; Stolten, D. A comprehensive review on PEM water electrolysis. Int. J. Hydrogen Energy 2013, 38, 4901–4934. [Google Scholar] [CrossRef]
- Proton on Site. C Series: Hydrogen Generation Systems; Proton on Site: Wallingford, CT, USA, 2014. [Google Scholar]
- Krewitt, W.; Pehnt, M.; Fischedick, M.; Temming, H.V. Brennstoffzellen in der Kraft-Wärme-Kopplung: Ökobilanzen, Szenarien, Marktpotenziale; Erich Schmidt Verlag GmbH & Co.: Berlin, Germany, 2004. [Google Scholar]
- Katikaneni, S.P.; Al-Muhaish, F.; Harale, A.; Pham, T.V. On-site hydrogen production from transportation fuels: An overview and techno-economic assessment. Int. J. Hydrogen Energy 2014, 39, 4331–4350. [Google Scholar] [CrossRef]
- Simbeck, D.; Chang, E. Hydrogen Supply: Cost Estimate for Hydrogen Pathways: Scoping Analysis; National Renewable Energy Laboratory (NREL): Golden, CO, USA, 2002. [Google Scholar]
- Bressan, L.; Davis, C. Driving down costs in hydrogen production. Process. Shale Feedstocks 2013, 18, 23–27. [Google Scholar]
- Kabelac, S.; Gnielinski, V.; Kind, M.; Martin, H.; Mewes, D.; Schaber, K.S.P. VDI-Wärmeatlas: [Berechnungsunterlagen für Druckverlust, Wärme- und Stoffübergang]; Zehnte, B., Erweiterte, A., Eds.; Springer: Berlin/Heidelberg, Germany, 2006. [Google Scholar]
- McKinsey. A Portfolio of Power-Trains for Europe: A Fact-Based Analysis: The Role of Battery Electric Vehicles, Plug-in Hybrids and Fuel Cell Electric Vehicles; McKinsey: Düsseldorf, Germany, 2011. [Google Scholar]
- Kreutz, T.; Williams, R.; Consonni, S.; Chiesa, P. Co-production of hydrogen, electricity and CO from coal with commercially ready technology. Part B: Economic analysis. Int. J. Hydrogen Energy 2005, 30, 769–784. [Google Scholar] [CrossRef]
- Gellert, S. Thermochemische Herstellung von Wasserstoff aus Biomasse unter Besonderer Berücksichtigung der Rohgasreformierung. Ph.D. Thesis, Hamburg University of Technology, Hamburg, Germany, 2013. [Google Scholar]
- Gunnarsson, I. GoBiGas-Projektet Omvandling av Skogsavfall till Färdigt Fordonsbränsle; Göteborg Energi: Göteborg, Sweden, 2014. [Google Scholar]
- HaasEngineering. Gastrocknungsanlage; HaasEngineering: Gundelfingen, Germany, 2009. [Google Scholar]
- Knörr, W.; Schacht, A.; Schmidt, P.R.; Weindorf, W.; Michaelis, J.; Wietschel, M.; Merten, F.; Viebahn, P.; Holdi, H. Überleitung der Ergebnisse aus GermanHy in das Emissionsberechnungsmodell TREMOD: Schlussbericht Teil II; Nationale Organisation Wasserstoff- und Brennstoffzellentechnologie NOW: Berlin, Germany, 2013. [Google Scholar]
- Claasen, P.A.M. HYVOLUTION: Non-Thermal Production of Pure Hydrogen from Biomass; Dienst Landbouwkundig Onderzoek, Food & Biobased Research: Wageningen, The Netherlands, 2011. [Google Scholar]
- Ochs, D.; Wukovits, W.; Ahrer, W. Life cycle inventory analysis of biological hydrogen production by thermophilic and photo fermentation of potato steam peels (PSP). J. Clean. Prod. 2010, 18, 88–94. [Google Scholar] [CrossRef]
- Djomo, S.N.; Blumberga, D. Comparative Life Cycle Assessment of three biohydrogen pathways. Bioresour. Technol. 2011, 102, 2684–2694. [Google Scholar] [CrossRef] [PubMed]
- Liberatore, R.; Lanchi, M.; Giaconia, A.; Tarquini, P. Energy and economic assessment of an industrial plant for the hydrogen production by water-splitting through the sulfur-iodine thermochemical cycle powered by concentrated solar energy. Int. J. Hydrogen Energy 2012, 37, 9550–9565. [Google Scholar] [CrossRef]
- Lattin, W.; Utgikar, V. Global warming potential of the sulfur–iodine process using Life Cycle Assessment methodology. Int. J. Hydrogen Energy 2009, 34, 737–744. [Google Scholar] [CrossRef]
- Kaltschmitt, M.; Weinrebe, G.; Wulf, C. Solarthermische Stromerzeugung. In Erneuerbare Energien: Systemtechnik, Wirtschaftlichkeit und Umweltaspekte, 5th ed.; Kaltschmitt, M., Streicher, W., Wiese, A., Eds.; Springer Vieweg: Berlin, Germany, 2013; pp. 263–352. [Google Scholar]
- Leybros, J.; Gilardi, T.; Saturnin, A.; Mansilla, C.; Carles, P. Plant sizing and evaluation of hydrogen production costs from advanced processes coupled to a nuclear heat source. Part I: Sulphur–iodine cycle. Int. J. Hydrogen Energy 2010, 35, 1008–1018. [Google Scholar] [CrossRef]
- Giraldi, M.R.; François, J.-L.; Castro-Uriegas, D. Life cycle greenhouse gases emission analysis of hydrogen production from S–I thermochemical process coupled to a high temperature nuclear reactor. Int. J. Hydrogen Energy 2012, 37, 13933–13942. [Google Scholar] [CrossRef]
- Patyk, A.; Bachmann, T.M.; Brisse, A. Life Cycle Assessment of H2 generation with high temperature electrolysis. Int. J. Hydrogen Energy 2013, 38, 3865–3880. [Google Scholar] [CrossRef]
- Mathiesen, B.V.; Ridjan, I.; Connolly, D.; Nielsen, M.P.; Vang Hendriksen, P.; Bjerg Mogensen, M.; Højgaard Jensen, S.; Dalgaard Ebbesen, S. Technology Data for High Temperature Solid Oxide Electrolyser Cells, Alkali and PEM Electrolysers; Department of Development and Planning, Aalborg University: Aalborg, Denmark, 2013. [Google Scholar]
- Harvego, E.A.; McKellar, M.G.; Sohal, M.S.; O’Brien, J.E.; Herring, J.S. Economic Analysis of the Reference Design for a Nuclear-Driven High-Temperature-Electrolysis Hydrogen Production Plant; Idaho National Laboratory (INL): Idaho Falls, ID, USA, 2008. [Google Scholar]
- Guan, J.; Minh, N.; Ramamurthi, B.; Ruud, J.; Hong, J.-K.; Riley, P.; Weng, D. High Performance Flexible Reversible Solid Oxide Fuel Cell; GE Global Research Center: Torrance, CA, USA, 2004. [Google Scholar]
- The Linde Group; Daimler AG. Linde und Daimler bauen. DWV-Mitteilungen 2014, 18–2, 20. [Google Scholar]
- Hampel, B.; Bauer, S.; Heublein, N.; Hirsch, C.; Sattelmayer, T. Feasibility Study on Dehydrogenation of LOHC Using Excess Exhaust Heat From a Hydrogen Fueled Micro Gas Turbine. In Proceedings of the ASME Turbo Expo 2015: Turbine Technical Conference and Exposition, Monteral, QC, Canada, 15–19 June 2015. [Google Scholar]
- Teichmann, D. Konzeption und Bewertung einer Nachhaltigen Energieversorgung auf Basis Flüssiger Wasserstoffträger (LOHC); Friedrich-Alexander-Universität, Erlangen-Nürnberg: Erlangen, Germany, 2015. [Google Scholar]
- Brückner, N.; Obesser, K.; Bösmann, A.; Teichmann, D.; Arlt, W.; Dungs, J.; Wasserscheid, P. Evaluation of Industrially Applied Heat-Transfer Fluids as Liquid Organic Hydrogen Carrier Systems. ChemSusChem 2014, 7, 229–235. [Google Scholar] [CrossRef] [PubMed]
- Adametz, P.; Müller, K.; Lechner, R.; Müller, S.; Brautsch, M.; Arlt, W. Energy and Carbon Foot Print Analysis of the Production of a Liquid Organic Hydrogen Carrier. In Proceedings of the AIChE Annual Meeting, Salt Lake City, UT, USA, 8–13 November 2015. [Google Scholar]
Figure 1.
Analyzed hydrogen supply chains.

Figure 2.
Impact of hydrogen supply on Climate change.

Figure 3.
Impact of hydrogen supply on Acidification.

Figure 4.
Impact of hydrogen supply on Eutrophication.

Figure 5.
Impact of hydrogen supply on Ozone creation.

Figure 6.
Impact of hydrogen supply on Particulate matter.

Figure 7.
Impact of hydrogen supply on Human toxicity.

Figure 8.
Sensitivity analysis: change due to an electricity mix based on renewable energy sources on the impact categories Climate change (left diagram) and Eutrophication (right diagram).
Figure 8.
Sensitivity analysis: change due to an electricity mix based on renewable energy sources on the impact categories Climate change (left diagram) and Eutrophication (right diagram).

Figure 9.
Sensitivity analysis: change due to improved electricity generation for wind power on the impact categories Climate change (left diagram) and Photochemical ozone creation (right diagram).
Figure 9.
Sensitivity analysis: change due to improved electricity generation for wind power on the impact categories Climate change (left diagram) and Photochemical ozone creation (right diagram).
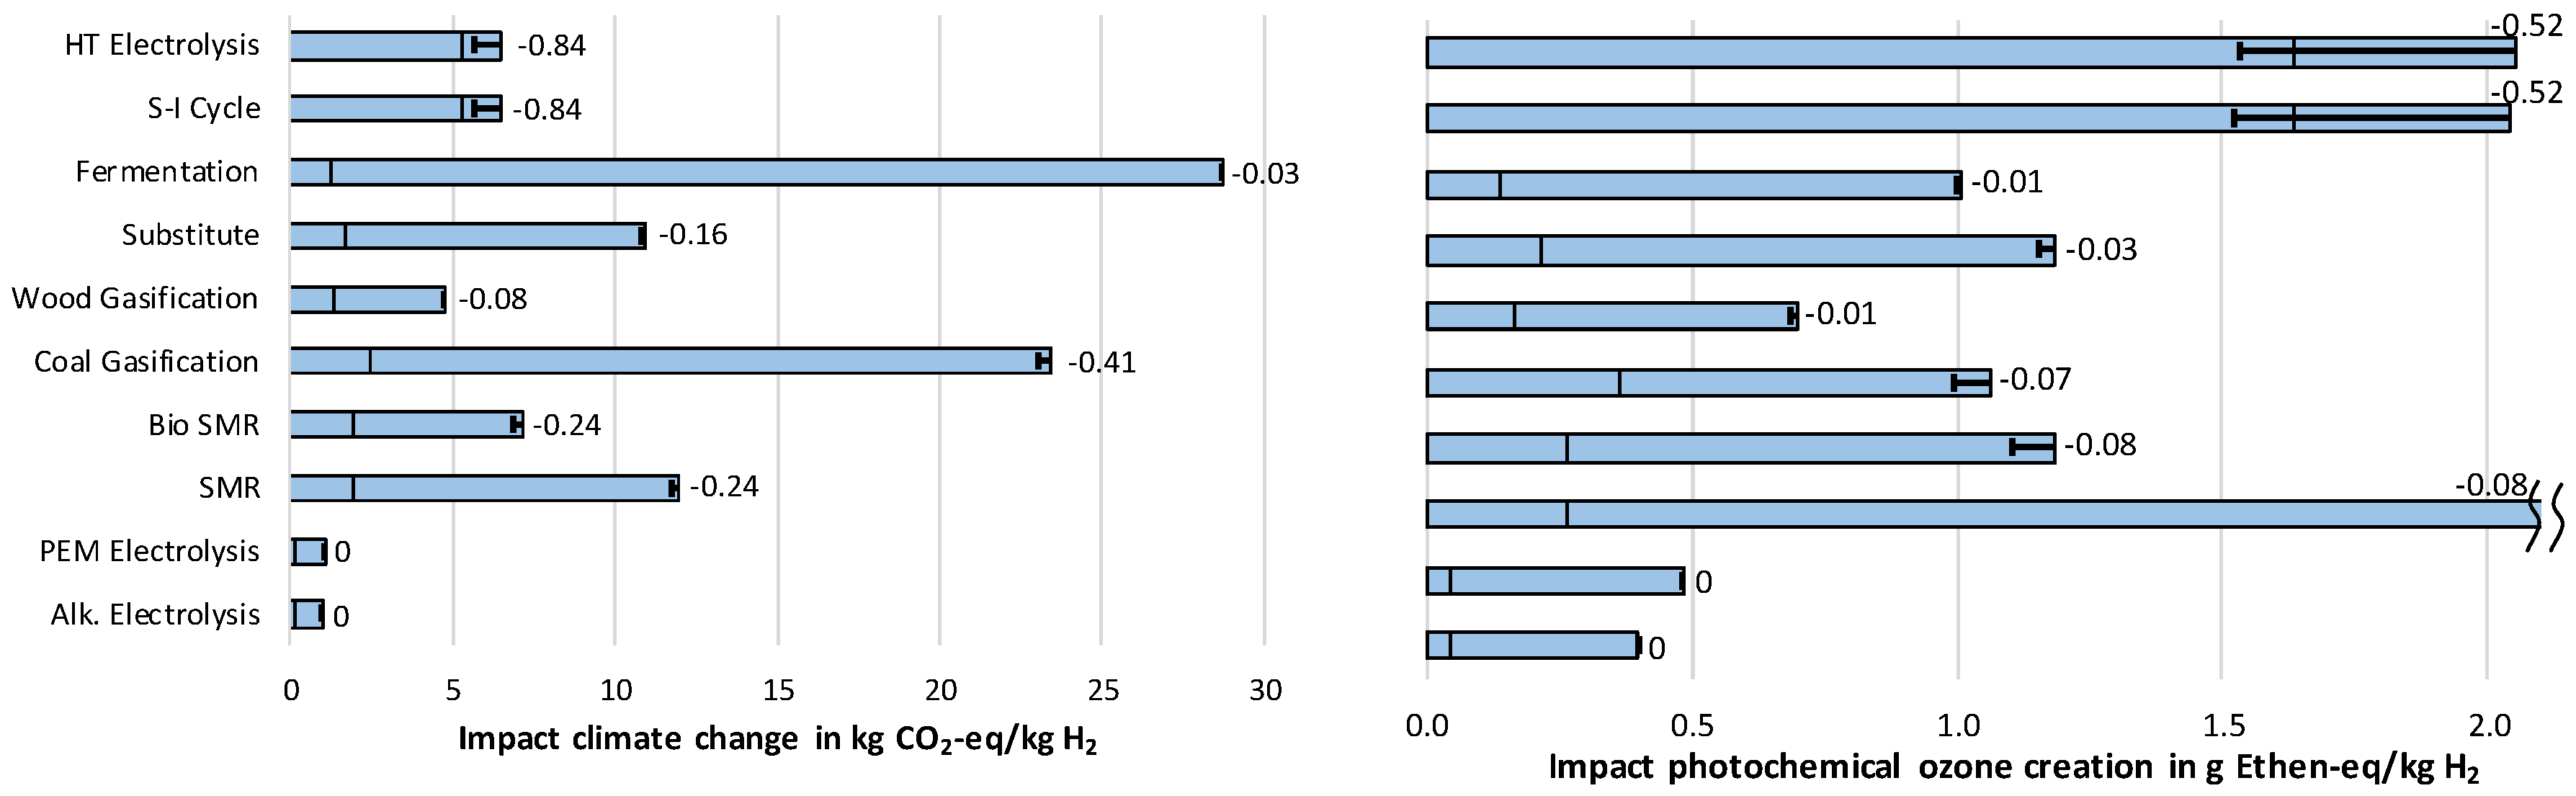
Figure 10.
Cost of hydrogen supply.

Figure 11.
Sensitivity analysis of hydrogen supply cost for (a) alkaline electrolysis, (b) steam methane reforming, (c) high-temperature electrolysis, (d) gasification of wood.
Figure 11.
Sensitivity analysis of hydrogen supply cost for (a) alkaline electrolysis, (b) steam methane reforming, (c) high-temperature electrolysis, (d) gasification of wood.
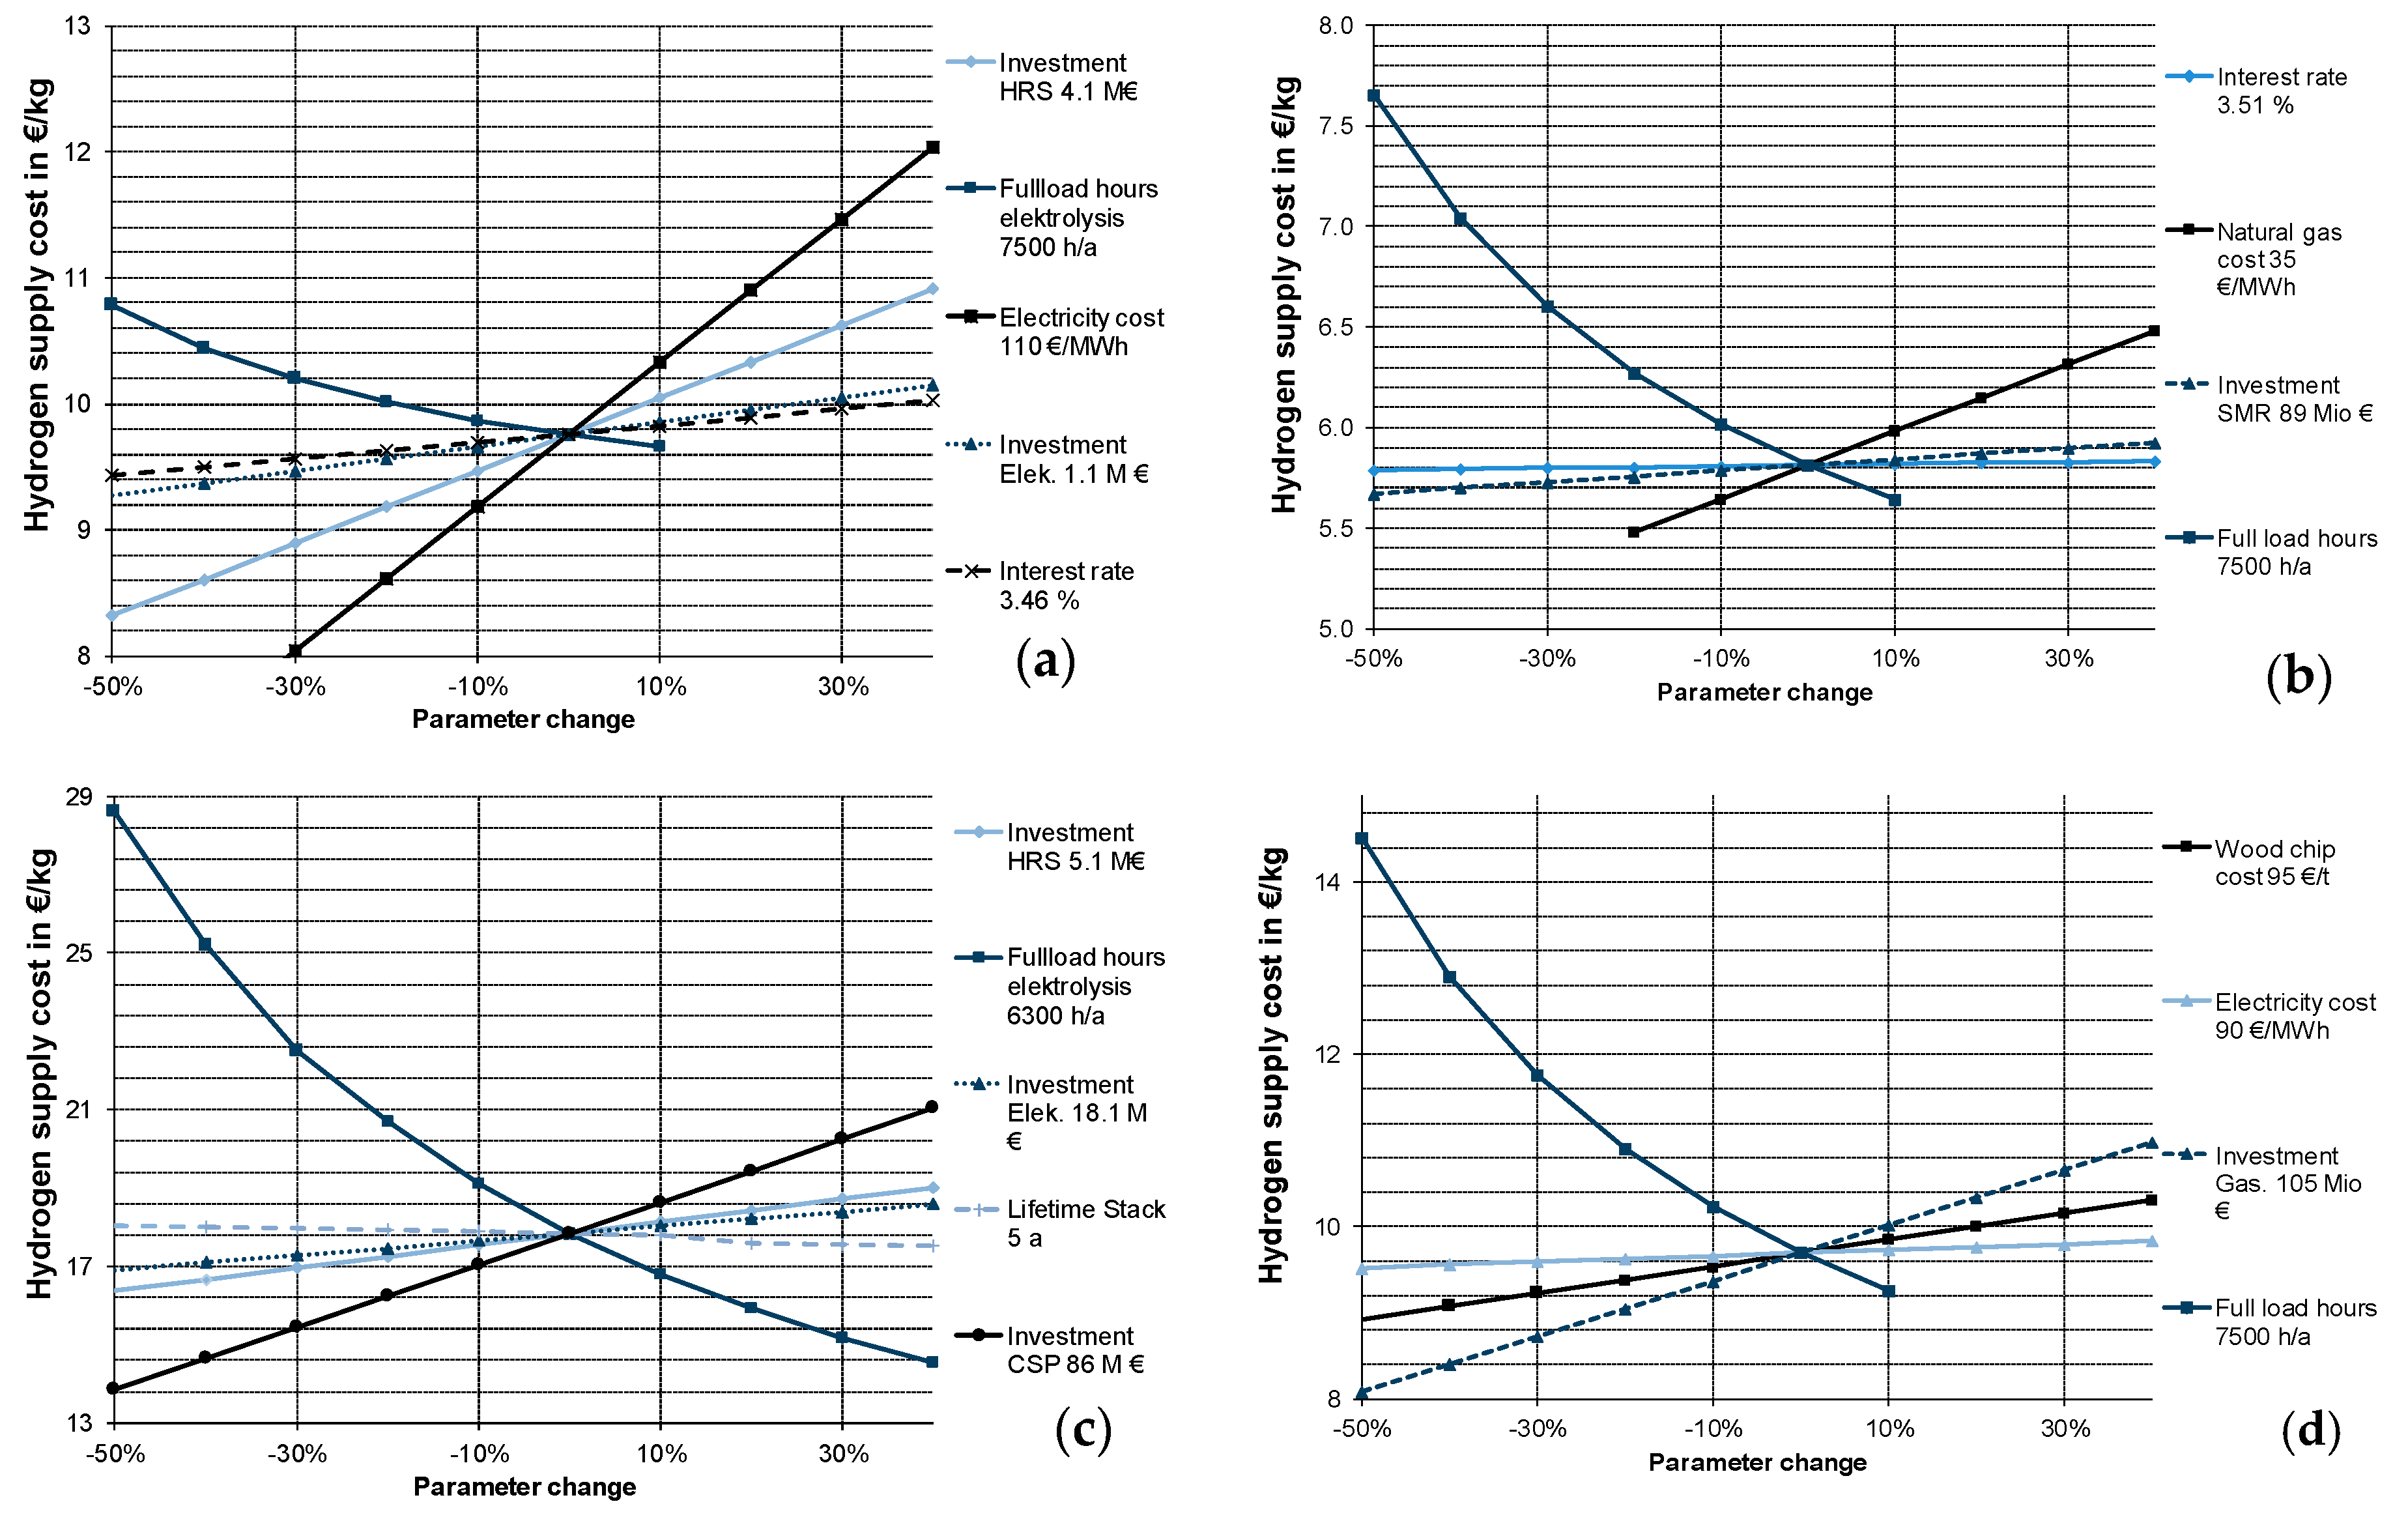
Table 1.
Transport distances for hydrogen production in Germany.
| Technology | Production Capacity (kg/h) | Number Plants | Transport Distance (km) |
|---|---|---|---|
| Steam reforming | 5000 | 5 | 150 |
| Coal gasification | 10,000 | 1 | 250 |
| Wood gasification | 610 | 43 | 50 |
| Combined fermentation | 60 | 430 | 20 |
| Substitution | 450 | 58 | 100 |
Table 2.
German electricity mix of the base year [42].
Table 2.
German electricity mix of the base year [42].
| Lignite | % | 25.0 |
| Hard coal | % | 18.0 |
| Solid biomass | % | 1.9 |
| Biogas | % | 4.5 |
| Hydropower | % | 3.6 |
| Photovoltaics | % | 4.4 |
| Wind power | % | 8.4 |
| Natural gas | % | 12.4 |
| Nuclear power | % | 15.7 |
| Oil | % | 1.1 |
Table 3.
Costs of operational resources for hydrogen production [43,44,45,46,47,48,49,50,51,52,53,54].
| Energy | ||
| Electricity grid mix Germany | ct€/kWh | 8.95 |
| Electricity from wind power 1 | ct€/kWh | 10.95 |
| “Surplus” wind power electricity 2 | ct€/kWh | 9.18 |
| Natural gas | ct€/kWh | 3.47 |
| Hard coal | €/t | 105 |
| Forest chips | €/t | 95.0 |
| Digestible biomass | €/t | 17.2 |
| Biomethane | ct€/kWh | 7.0 |
| Auxiliary supplies | ||
| Water/sewage water | €/m³ | 3.83 |
| Triethylene glycol | €/t | 985 |
| Potassium hydroxide | €/t | 606 |
| Olivine | €/t | 76.0 |
| Nitrogen | €/t | 183 |
| Dipotassium phosphate | €/t | 1360 |
| Waste | ||
| Ash | €/t | 60 |
1 cost grid mix + green certificate for wind power; 2 electricity generation cost + grid usage charge.
Table 4.
Potential future electricity mix [26].
Table 4.
Potential future electricity mix [26].
| Lignite | % | 0.0 |
| Hard coal | % | 2.1 |
| Solid biomass | % | 4.4 |
| Biogas | % | 4.9 |
| Hydropower | % | 4.4 |
| Photovoltaics | % | 16.5 |
| Wind power | % | 51.8 |
| Natural gas | % | 11.5 |
| Nuclear power | % | 0.0 |
| Oil | % | 0.0 |
| Geothermal power | % | 3.3 |
© 2018 by the authors. Licensee MDPI, Basel, Switzerland. This article is an open access article distributed under the terms and conditions of the Creative Commons Attribution (CC BY) license (http://creativecommons.org/licenses/by/4.0/).
Share and Cite
MDPI and ACS Style
Wulf, C.; Kaltschmitt, M. Hydrogen Supply Chains for Mobility—Environmental and Economic Assessment. Sustainability 2018, 10, 1699. https://doi.org/10.3390/su10061699
AMA Style
Wulf C, Kaltschmitt M. Hydrogen Supply Chains for Mobility—Environmental and Economic Assessment. Sustainability. 2018; 10(6):1699. https://doi.org/10.3390/su10061699
Chicago/Turabian StyleWulf, Christina, and Martin Kaltschmitt. 2018. "Hydrogen Supply Chains for Mobility—Environmental and Economic Assessment" Sustainability 10, no. 6: 1699. https://doi.org/10.3390/su10061699
Note that from the first issue of 2016, this journal uses article numbers instead of page numbers. See further details here.