Abstract
In the last decade, sub-Saharan African countries have taken various measures to plan for and adapt to floods in order to reduce exposure and its impacts on human health, livelihoods, and infrastructure. Measuring the effects of such initiatives on social resilience is challenging as it requires to combine multiple variables and indicators that embrace thematic, spatial, and temporal dimensions inherent to the resilience thinking and concept. In this research, we apply a subjective resilience indicator framework and a before-after-control-intervention (BACI) evaluation to empirically measure the impacts of the “Live with Water” (LWW) project on suburban households in Dakar, Senegal. Our framework is based on an empirically measurable resilience index that combines anticipatory, adaptive, and absorptive capacity—considered as structural dimensions—with the concept of transformative capacity—considered as a temporal reconfiguration of the first three dimensions. Our finding let us estimate that the project increased the absorptive and the anticipatory capacities by 10.6% and 4.6%, respectively. However, adaptive capacity remained unchanged. This may be explained by the fact that the project was more successful in building drainage and physical infrastructures, rather than improving multi-level organizations and strategies to cope with existing flood events. Decoupling implementation time between physical infrastructures and longer term institutional and livelihood based support could both improve projects’ results and their evaluations.
Keywords:
urban resilience; flood; impact evaluation; BACI; subjective resilience; Senegal; sub-Saharan Africa 1. Introduction
Flooding remains a major hazard accounting for 900,000 people affected in West Africa every year and more than 2 million in the whole continent (Emdat database 2018) (http://emdat.be/emdat_db/). This is especially the case in urban areas where the concentration of population and infrastructure implies higher flood exposure. Rapid rural to urban migration and extreme climate variability are key factors driving the rise in flood disasters in sub-Saharan African cities [1,2,3]. For example, in 2008 and 2012 floods affected respectively 264,000 and 163,000 families in Senegal damaging numerous schools, health centers, and other infrastructures (Emdat database 2018). The destruction of neighborhoods entails population displacement, relocation, and social-disruption [4,5]. Flooding also has critical consequences on health by compromising access to sanitation, safe drinking water, and health care [5,6,7]. Poor urban planning as well as poor living conditions are exacerbating urban dwellers’ vulnerability to flood [8,9,10]. Hence, helping people to become more resilient to flood disaster in the context of environmental change and migration is urgent [9,11]. While large-scale drainage infrastructures are important measures to be taken, they remain insufficient in the context of sub-Saharan developing countries [12]. In response to this urgent need, some novel initiative of participatory or integrated flood management have been initiated in sub-Saharan Africa [11,13]. These initiatives focus on different domains such as multi-level flood management and governance, urban restructuration, drainage, sanitation infrastructures, improved urban planning, and environmental education.
A key challenge for research is to understand the long-term effects of such initiatives on flood resilience of vulnerable urban dwellers in order to improve the effectiveness and efficiency of future interventions. Current literature on urban flood has largely focused on understanding the main drivers of vulnerability such as inadequate urban planning, uncontrolled migration and extreme climate variability [8,10]. However, very little research has analyzed the social-ecological outcomes of flood adaptation programs supporting urban dwellers’ resilience. Knowledge gained through the assessment of flood resilience can provide insights on the effectiveness of the different project activities and inform further interventions in this field. This paper aims to assess to what extent the Live with Water (LWW) project, which was implemented as part of the Building Resilience and Adaptation to Climate Extremes and Disasters (BRACED) (http://www.braced.org/) program, improved the resilience of vulnerable populations in Dakar suburbs, Senegal.
1.1. The BRACED-Live with Water Project
The research presented was implemented in the context of the LWW project launched in 2013 under the BRACED program funded by the British Department for International Development (DFID). The overarching objective of the project was to improve the flood resilience of vulnerable households located in 10 municipalities of Dakar, Senegal (Figure 1). The program included four categories of interventions: (a) implementation of drainage infrastructure for a total cost of US$ 2.5 million to reduce households’ exposure to flood, along with improving mobility, living conditions and health protection; (b) organizational and logistical support to local waste management, including waste collection and recycling; (c) incentivizing income generating activities through urban gardening and waste recycling; (d) support to community organization and contingency planning to organize flood relief and the sustainable management of drainage infrastructure. After the initial project planning and preparation phase, the implementation of the different interventions took place from October 2016 to December 2017.
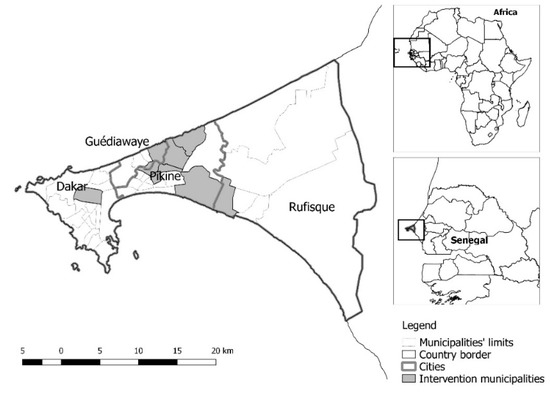
Figure 1.
Research and intervention areas. The figure shows the location of each of the 10 intervention municipalities within the Dakar suburbs where the “Live with Water” project was implemented.
1.2. Measuring Subjective Social Resilience
Classical approaches to flood “resistance” are increasingly giving place to flood policies with a perspective of achieving “resilience” [14]. Building flood resilience requires strengthening the ability of individuals, households, communities and governments, and non-government stakeholders to anticipate, absorb, and adapt to flood disaster [15]. Measuring the effects of national or international programs supporting social resilience is a theoretical and practical challenge for environmental and development research [16]. In general terms, resilience refers to the magnitude of disturbance that a social-ecological system can tolerate before to move to a different state [17]. Multiple frameworks have been proposed to capture the core dimensions of social resilience and convert them into observable indicators [18,19,20,21]. Social resilience was defined as the adaptive and learning capacity of individuals, groups, and institutions to self-organize and to maintains social system function in response to a disturbance [18]. It also includes the capacity to resist and absorb disturbance by mobilizing enough resources. Several challenges persist in finding appropriate measurement of resilience, such as the difficulty to collect precise indicators in the multiple dimensions required by a resilience analysis and the difficulty to make the findings comparable from a dimension to another due to the difference of units and benchmarks criteria [20]. Furthermore, resilience cannot be analyzed from a static perspective as per definition it is an “adaptive cycle”, a process that is only measurable through time [17]. In our view, operationalizing research on social resilience benefits from considering three types of methodological adjustments: (i) the measure of subjective resilience; (ii) the construction of a contextual framework of indicators; and (iii) the use of impact evaluation methods to get a precise measure of changes through time and space [22].
The first adjustment is facilitated by a shift from objective to subjective measurement. The idea of “subjective resilience” [23] starts from the evidence that collecting precise and objective measurements in multiple domains or dimensions—such as health, income, or governance aspects—as part of a general concept of resilience is challenging due to recall bias of respondents and often inadequate databases, especially in developing countries. An approach to subjective resilience is based on the assumption that the directly affected populations are particularly suitable to provide information about their own perception of resilience. As it is difficult to get precise measurement from interviews (e.g., exact family income and flood risk estimates), especially in areas with low literacy rates, it is necessary to build indexes using ranking or attitude scales. Detailed methodologies have been already proposed to collect data on subjective resilience [23,24].
The second adjustment starts from the principle that there is no single ‘right’ framework to assess resilience but multiple approaches that need to be contextualized and adapted to the purpose, the scope and the resources of the planned research. In the context of climate change mitigation and adaptation program, the BRACED “3As and T” framework [25] proposes the following four core dimensions of resilience that can be then adapted to context specific indicators: (1) ‘Anticipatory capacity’ is the capacity of a social system to anticipate an extreme event or a shock by preparedness, planning, information sharing and collective action. (2) ‘Absorptive capacity’ is the capacity to resist an extreme event or a shock through the mobilization of sufficient resources to create a safety buffer. (3) ‘Adaptive capacity’ is the capacity to respond to an extreme event or a shock by changing the way the social system is functioning in normal time and find alternative solutions to cope with the situation. (4) ‘Transformative capacity’ is a time framed dimension of ‘unintended’ or ‘deliberate’ change embracing the first three dimensions toward a general improvement of resilience. Table 1 provides an example of context specific indicators fitting with the “3As and T” core dimensions used in the present research.

Table 1.
“3As and T” framework of resilience adapted from Bahadur et al., 2015 [25]
The third adjustment explores the possibility to use impact evaluation methods to measure the amount of change in resilience that are due to a given intervention (i.e., policy, infrastructures, income generating activities). Robust impact assessment methods are increasingly being used in environmental and conservation research [26,27,28,29]. Also called ‘before-after-control-intervention’ (BACI), these methods combine at least one baseline study with a follow-up in a treatment area (the area where the outcomes of an intervention are expected) and a control area (the area without the intervention) to capture the counterfactual scenario (what would have happened without the intervention) [30,31]. The resulting ‘difference-in-differences’ is the estimated treatment effect of the intervention on the targeted group [32]. It calculates the amount of change through time and space that can be directly attributed to the intervention and can, in this way, be a measure of the outcomes of this intervention in terms of resilience.
2. Materials and Methods
2.1. Measure of Impact
The research results from a transdisciplinary process [33] involving several universities in Switzerland and Senegal, NGOs, civil engineers, and field facilitators carried out from October 2016 to December 2017. Each partners contributed to define research objectives and provided inputs and information to the core research team. Although overall research included various qualitative and quantitative tools. In the present paper, we only present the results related to the quantitative impacts on resilience mainly based on a household survey. We adopted a BACI method [34,35] (Figure 2) to measure the impact of the LWW intervention on the resilience of the targeted population living in 10 communes located in the Eastern area of Dakar (suburbs) (Figure 1). To support the data collection process, a GIS database was set up including information about the project intervention, the limit of the quartiers and a map of flood risk exposure inspired from a methodology used in similar context [36]. The following parts describe in more details each steps of the research.
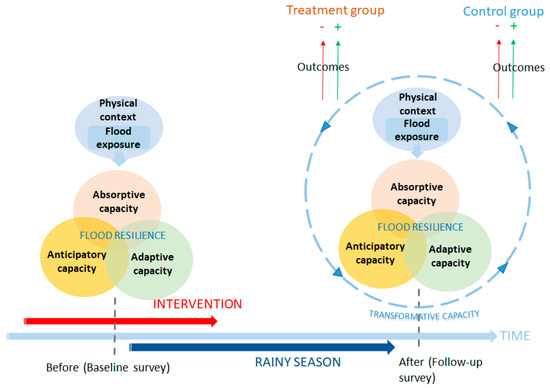
Figure 2.
A BACI methodological framework to evaluating flood resilience.
2.2. Data Preparation and Collection
2.2.1. Preparation of the Intervention
As part of a research/action project the research methodology was coordinated with the LWW project activities. From January to April 2017, an engineer consulting team mandated by the project created a risk exposure map (REM) to provide detailed information about flood risks according to four levels: null (0 cm of water), low (1–50 cm), medium (50–100 cm), and high (+1 m) (Figure 3). The REM was calculated using the Caesar-Lisflood model [37] using (i) a corrected digital terrain model of 5m spatial resolution, (ii) watershed and water collector areas from the current drainage infrastructure plan of Dakar city, and (iii) a theoretical maximal rainfall intensity event of 110 mm in 24 h as input data estimated from Dakar’s meteorological information (Senegalese National Agency of Civil Aviation (ANACIM) (http://www.anacim.sn/meteorologie/)). According to the obtained REM, the engineer consulting team together with their partners in Senegal identified in the field 114 potential intervention areas (PIA). PIAs were based on a multicriteria analysis taking into account the relevance, feasibility, durability, and cost of each specific intervention. On those PIAs a total of 42 were selected to be treated with the application of the four categories of interventions of the LWW project (described under 1.1) according to available budget, relevance and other feasibility criteria. The remaining points (72 without intervention) were considered as control points. The latter were defined as areas where the population is subject to a similar level of exposure as for the treatment population, according to the REM. To establish the limits around each PIA in both control and treatment, an expert technician manually drew an area considered as the PIA including several houses, communication channels and other public spaces based on his contextual knowledge using a geographical information systems technology.
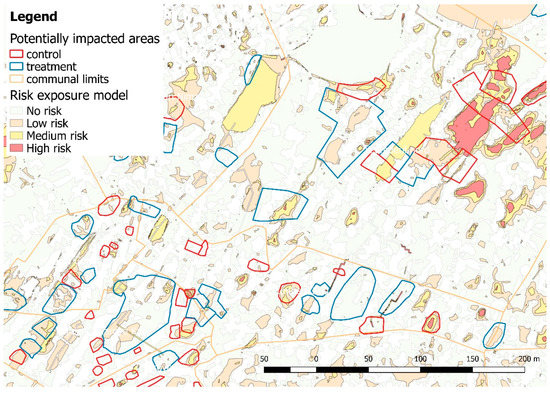
Figure 3.
Illustration of the risk exposure map and its overlap with potentially impacted areas (PIAs).
A population estimation was established from the population density in the area and the total surface of PIA, using data from the Senegalese national statistics agency. In April and May 2017, we carried out a census survey to identify the households located inside PIAs. Using the GeoODK software, 10 survey teams consisting of five numerators and one supervisor each performed a preliminary census with heads of concession (including several households) to get the precise number of households, their contact information and the GPS points of the concession in which they are located. This helped to avoid selection bias in the field (i.e., the numerator only interviewing the people available at the moment of the visit).
2.2.2. Sampling
A stratified sample procedure was adopted. The total number of households living in the PIAs were 8798 according to the census. Our budget allowed for surveying up to 3000 households in each of the baseline and follow-up campaign. Using the Qgis software, we overlapped the layer of the REM with the georeferenced points of all households’ locations in the PIA (Figure 3). Only 10% of the households were located in the high and medium exposure areas. The rest of the population was located in the low and null areas. To make sure we covered the most impacted population, we selected all the households located in the high and medium exposed areas and randomly selected 30% of the households located in the low and null areas in both control and treatment areas. During the data collection process most of the households identified in the census could be found in the field leading to the surveyed sample presented in Table 2 below.
Table 2.
Survey sample distribution according to the level of flood risks
2.2.3. Survey Data Collection
We conducted one baseline (N = 2911) and one follow-up survey (N = 2625) on two subsample of households distributed across a treatment and a control population. Due to time constraints (only 14 months including both the intervention and the impact evaluation), we conducted the baseline in June–July 2017 during the implementation of part of the intervention but before the rainy season was started (July–September 2017). Most survey questions in the baseline were retrospectively asked about the previous rainy season (July–September 2016). Our follow-up took place soon after the rainy season (in November–December 2017) just before the formal end of the project (31 December 2017) enabling us to measure the effect of the intervention directly after a flood period. We are aware that the long recall period between the baseline data and the previous flood is a limitation to the present impact evaluation. However, respondents seemed comfortable to respond to our questions and to remember their situation eight months before our baseline survey. A team of 50 numerators, 10 field coordinators, and 5 data controllers worked during both campaigns. Surveys were collected using the ODK application for Android. It took approximatively 1.5 h/household to implement. Apart from the resilience specific indicators used in this paper, it covered several related topics such as health and sanitation, costs of flood damages, waste management, education, and incomes. The survey was completely anonymized and responded to the ethical clearance criteria of the national ethical committee for health research in Senegal (ethical clearance no. 00000078 MSAS/DPRS/CNERS).
2.3. Data Analysis: Outcome Indicators of Resilience and ‘Difference-in-Differences’ Estimators in Semi-Experimental Design
2.3.1. The Flood Exposure Index
From our empirical data we calculated a flood exposure index which is a measure of the level of severity in flood experienced by respondents during a given rainy season. This index, based on respondents’ perceptions, combines different measures of flood intensity.
Flood exposure index (FEI) is given by the following formula
where Fi is the perceived level of severity of the flood experienced by the respondent in general during the previous rainy season (from 0 to 4); Fh is the perceived level of severity of the flood having directly affected the house of the respondent (from 0 to 5); Fs is the perceived level of flood severity in the streets surrounding respondents’ house (from 0 to 7).
2.3.2. “3As” Indexes
Our measure of social resilience is given by the combination of three sets of variables, each given by a different index of respectively: anticipatory capacity, absorptive capacity, and adaptation capacity.
Each of the “3As” is calculated using the same formula but with different selected indicators
where represent each of the anticipatory, adaptive, and absorptive capacity indexes and S1, 2, 3, n represent the selected indicators 1, 2, 3, n, presented in Table 1. Each selected indicator was binary coded (yes/no). Adaptation capacity was only calculated for those households having responded yes to the question “Were you affected by flood during the last rainy season?”. All the indexes (from 0 to 7, 8, or 9) were reported to a 100% basis to facilitate comparability between each other.
2.3.3. Difference-in-Differences
For each of the outcome variable, we calculated the difference-in-differences (DID). Equation (3) illustrates the DID estimator and describes how DID can be calculated according to an established methodology [31]. Y is the outcome variable, subscript 0 and 1 mean pre- and post-treatment level; subscript t and c mean treatment or control units of observation. E is the expectations operator representing the treatment effect across all treatment and control units. The estimator is conditional on other variable (X).
We estimate conditional DIDs using linear regression and the following equation from Puhani [38]
is the outcome variable for household i corresponding to each of the 3As index. is the treatment variable (= 1 if i received the treatment and = 0 if i did not received the treatment), is an indicator of period (= 1 if it is the post-treatment period and = 0 if it is a pre-treatment period). represents the regression constant. The coefficient is the estimator for our treatment effect (T-effect): the difference between the differences in the treatment group after the intervention and the difference in the control group over the same period. and are respectively the coefficients of the indicator treatment and period variables. is the error term.
We also calculated DID for each of the 24 binary selected indicator variables by subtracting the proportion of households experiencing changes in the treatment with the one experiencing changes in the control. A Chi-square test was performed across treatment and control results to see if the changes were significantly different.
3. Results
3.1. Detailed Changes in Households’ Selected Indicators of Subjective Flood Resilience
The proportion of change in the difference-in-differences for each selected indicator of subjective flood resilience is presented in Figure 4 below. The results show a generally positive tendency although not statistically significant for the larger part of the selected indicators. Only 8 of the 24 variables of resilience present a significant increase and one a significant and high decrease.
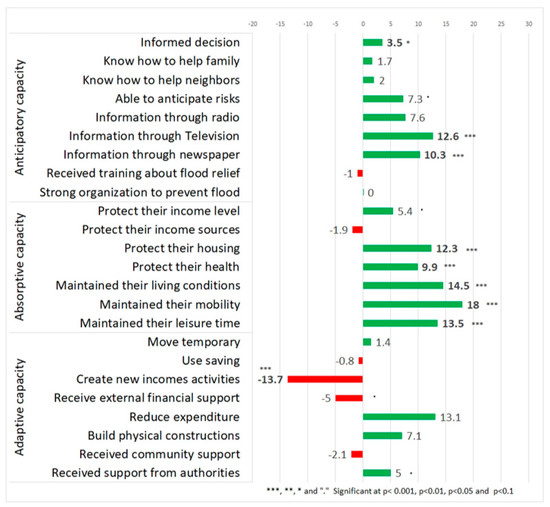
Figure 4.
Difference-in-differences for each of the selected indicators of resilience. The numbers show the proportion of additional increase (green) or decrease (red) in the treatment compared to the control group from the baseline to the follow-up. Results are given in % of households having responded positively to each question. For example, 12.3 under “protect their housing” means that in the treatment group, 12.3% more households have reported to be able to protect their housing against flood than in the control group compared to the baseline proportion.
Within the anticipatory capacity indicator, the variables related to information access about flood show a clear and significant increase and may be attributed to the LWW project’s effort to disseminate information through its broad media campaign. However, no clear and significant improvement can be observed in households’ knowledge on how to behave to help their family or their neighbors and to anticipate the risks related to flood due to the intervention.
Absorptive capacity selected indicators are by far the most positively impacted. Eighteen percent more households considered being able to maintain their mobility despite the rainy season in the area where LWW created drainage infrastructure (P-Chi < 0.001). Another 14.5% of households believed they could maintain their living conditions despite the rainy season (P-Chi < 0.001). Households perceiving their leisure time and health conditions were preserved have also increased more in the treatment than the control compared to previous rainy season in 2016.
Those generally positive results contrast with the indicators of adaptive capacity. Quite surprisingly, the treatment group experienced a reduction by 13.70% in the households’ capacity to create new incomes sources to compensate the material loss and other impacts caused by the flood (P-Chi = 0.013). No significant impact is also visible on the capacity of the households to receive external support from authorities or the community through collective action during a flood event. A positive but insignificant tendency appears in the capacity of the households to build physical constructions to protect from flood and to temporarily reduce their expenditure during a flood event.
3.2. Measuring Subjective Flood Resilience Using Each of the “3As” as a Composite Index
Looking at the composite “3As” indexes of flood resilience provides an overview of the magnitude of change in households’ resilience. The bar chart in Figure 5 presents the distribution of households in each class of relative improvement or decrease for the treatment and the control. Absorptive capacity is the most normally distributed with a proportionally similar number of people presenting a reduced and increased index. The general shift of blue bars from the left to the right of the distribution represents the amount of positive change supposedly due to the intervention.
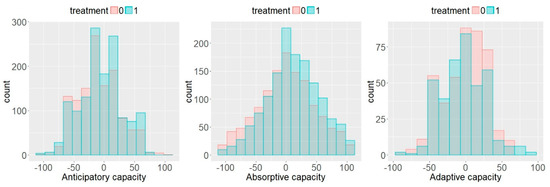
Figure 5.
Bar chart showing the distribution of households according to the proportion of difference-in-differences. Treatment bars are in blue and control one are in red. The unequal size of blue and red bars that are not overlapping in treatment and control show the difference-in-differences.
This tendency is confirmed in Table 3 below presenting the outputs of the multiple regressions where the outcomes variables are the flood exposure index as well as the three resilience indexes (3As) generated by Equation (4) exposed in the methods part.
Table 3.
Treatment effect on the flood exposure index and the three dimensions of resilience synthetic variables.
The flood exposure index shows in more general terms how each household was physically affected by flood. This indicator presents a tendency of statistically significant decrease (−4.5%) in flood exposure due to the intervention. Absorptive capacity is the most positively impacted with an expected increase of a bit more than 10% (= 10.6). Anticipatory capacity shows a lower similar positive tendency (4.6%), while change in adaptive capacity remains non-significant.
4. Discussion
Our research attempted to present an overview of the impacts of the “Live with Water” approach to flood management [39], which incentivizes local stakeholders to treat water as a resource instead of a threat [40] by creating income generating activities and support local flood management. Although the BRACED-LWW project was implemented in a very short period of time (a total of approximately 14 months), some significant impacts could already be observed on urban flood resilience. By physically protecting households from floodwater, the drainage infrastructures led to a clear reduction of households’ flood exposure entailing an improvement of their resilience. These changes were most particularly visible on households’ absorptive capacity, with improvements in housing infrastructure, health conditions, living conditions, mobility, and leisure periods. The LWW project has also had a visible influence on producing and diffusing information about flood risks and about the measures to be taken in order to anticipate disaster, with the dissemination of information through TV and newspapers being the most important components for improving anticipatory capacity at households’ level. These results clearly emphasize the importance of addressing smaller flood events in complement to other large scale and primary drainage infrastructures [14].
However, some limitations of the approach clearly appear through the analysis of people’s anticipatory and adaptive capacities. Except for better access to information, most people did not feel that they were able to anticipate flood risk adequately by knowing how to behave to help their family or other people in their neighborhoods. Other experiences have shown that local competences in flood preparedness can be reached through adequate and regular training support [11,41]. Due to time constraints, training was only provided to the local committee coordinators in the LWW project. Furthermore, the absence of impact on adaptive capacity is potentially due to the very short recall period and the large time spans usually needed for adaptation changes to be well rooted in local collective action [14,15]. This result could also be due to the unachieved implementation of the contingency plans and other organizational support at the level of the 30 zonal committees set up at the time of the experiment. Contingency plan implementation is a long-term process as for its participatory and multi-level dimensions. Although those accompanying measures were considered as the added value of the LWW program, a delay in starting their elaboration and the difficulty to find consensus among the involved stakeholders have considerably undermined their adoption and implementation prior to the end of the project. The relatively short time spans of development interventions is a recurrent challenge for project-based interventions and particularly affects developing countries who rely on external funding to implement these projects [42].
As a matter of fact, in other sub-Saharan countries, our results suggest the project-based interventions such as the LWW program tend to put more emphasis on short-term impacts on absorptive capacity aspects, while adaptive and anticipatory capacity components require longer-term approaches to be consolidated [11,22,43]. This explains why their effects are difficult to appreciate in the longer term, especially because monitoring of impacts usually end with the interventions themselves in such international program. Accompanying measures to support local organizations in supporting the follow-up of contingency plans and local livelihood-based activities such as waste recycling and urban greening are required at least one year after the end of each project intervention. This would have considerably facilitated the local appropriation of the innovations brought by the LWW project and would have also certainly influenced the results of our study.
From a theoretical and methodological point of view, our approach combining subjective resilience with a robust BACI method enabled a multi-dimensional measurement through time and space, and represents in our view a good tool for the evaluation of flood resilience and adaptation programs. By using subjective indexes estimated by the households’ respondents themselves, compared to external measurements, it has become possible to cover a broader set of indicators contributing to a more holistic appreciation of resilience [23,24]. Our experience also highlighted the importance of using robust BACI methods to take into account the temporal dimension of resilience often neglected by research based on a single data collection period [15,20]. The DID is particularly helpful to isolate external factors of change through time and space that are not due to the intervention by comparing the double difference instead of the simple change through time. As for example, in our case rainy seasons at baseline (2016) and follow-up (2017) presented a small decrease in rainfall intensity (275.31 mm and 252.76 mm, respectively, according to ANACIM). Without a control group, the improvement of absorptive capacity in 2017 could have been attributed to the meteorological drivers instead of the project intervention.
Ideally, a decoupling between impact monitoring tied to development interventions and ex-post monitoring to assess longer-term impacts would also be needed. Ex-post-monitoring should include at least two data collection events corresponding to short (1 year) and mid-term (1–5 years) effects of the project. In our case, the short recall period between the baseline and follow-up data collection does not give any indications on the long-term effects of the project and therefore, whether a deep institutional change is likely to take place or not in the longer term. Disaster reduction interventions are no exception [22].
5. Conclusions
In the example of the BRACED-LWW project, collaborative research combining the different academic and non-academic stakeholders has proven to be a powerful design, allowing a coordination of research and interventions activities, knowledge, and information exchanges and to provide a relevant interpretation of results that can potentially support a progressive improvement of resilience programs [39]. To continue in this line, the scientific evaluation of action-oriented flood resilience and adaptation programs can significantly improve their efficiency and accuracy by combining our three recommended adjustments: (i) the use of subjective resilience indexes instead of (or in complement to) precise socio-ecological measurements [23]; (ii) the use of a contextual indicator framework organized according to the three dimensions of resilience—anticipatory, absorptive, and adaptive core capacity [25]; and (iii) the use of a BACI methodological approach to take into account the spatial and temporal dimensions and isolate project’s or program’s specific impacts [30,31]. In addition, further research/action programs using panel data and semi-experimental impact evaluation methods should take into account that the temporality of development interventions must be decoupled from the temporality of social appropriation, adaptation, and systemic transformation, that are key components of resilience.
Author Contributions
Conceptualization, P.B.; Data curation, P.B., M.M.C.S., and C.I.S.; Formal analysis, P.B.; Funding acquisition, M.S.W. and C.I.S.; Methodology, P.B., M.S.W., M.M.C.S., A.D., and C.I.S.; Project administration, A.K. and A.D.; Resources, A.K.; Supervision, P.B., A.K., A.D., S.F., and C.I.S.; Validation, P.B.; Visualization, P.B.; Writing—original draft, P.B.; Writing—review & editing, P.B., M.S.W., S.B., and C.I.S.
Funding
This research was funded by the Department for International Development (DFID) under the Building Resilience and Adaptation to Climate Extremes and Disasters program.
Acknowledgments
Authors acknowledge further logistical support from the Consortium pour la Recherche Economique et Sociale (CRES), Dakar, Senegal.
Conflicts of Interest
The authors declare no conflict of interest. The funders had no role in the design of the study; in the collection, analyses, or interpretation of data; in the writing of the manuscript, or in the decision to publish the results.
References
- Barrios, S.; Bertinelli, L.; Strobl, E. Climatic change and rural–urban migration: The case of sub-saharan africa. J. Urban Econ. 2006, 60, 357–371. [Google Scholar] [CrossRef]
- Broekhuis, A.; de Bruijn, M.; de Jong, A. Urban-rural linkages and climatic variability. In The Impact of Climate Change on Drylands; Springer: Berlin, Germany, 2004; pp. 301–321. [Google Scholar]
- Black, R.; Bennett, S.R.; Thomas, S.M.; Beddington, J.R. Climate change: Migration as adaptation. Nature 2011, 478, 447–449. [Google Scholar] [CrossRef] [PubMed]
- Gueye, C.; Fall, A.S.; Tall, S.M. Dakar, touba and the senegalese cities network produced by climate change. Curr. Opin. Environ. Sustain. 2015, 13, 95–102. [Google Scholar] [CrossRef]
- Guha-Sapir, D.; Vos, F.; Below, R.; Penserre, S. Annual Disaster Statistical Review 2011: The Numbers and Trends; UCL: London, UK, 2012. [Google Scholar]
- Diallo, A.; Ndam, N.T.; Moussiliou, A.; Dos Santos, S.; Ndonky, A.; Borderon, M.; Oliveau, S.; Lalou, R.; Le Hesran, J.-Y. Asymptomatic carriage of plasmodium in urban dakar: The risk of malaria should not be underestimated. PLoS ONE 2012, 7, e31100. [Google Scholar] [CrossRef] [PubMed]
- World Health Organization (WHO). Quantitative Risk Assessment of the Effects of Climate Change on Selected Causes of Death, 2030s and 2050s; WHO: Geneva, Switzerland, 2014. [Google Scholar]
- Maheu, A. Urbanization and flood vulnerability in a peri-urban neighbourhood of dakar, senegal: How can participatory gis contribute to flood management? In Climate Change and the Sustainable Use of Water Resources; Springer: Berlin, Germany, 2012; pp. 185–207. [Google Scholar]
- Sané, O.D.; Gaye, A.T.; Diakhaté, M.; Aziadekey, M. Critical factors of vulnerability that enable medina gounass (dakar/senegal) to adapt against seasonal flood events. J. Geogr. Inf. Syst. 2016, 8, 457–469. [Google Scholar] [CrossRef]
- Mbow, C.; Diop, A.; Diaw, A.T.; Niang, C.I. Urban sprawl development and flooding at yeumbeul suburb (dakar-senegal). Afr. J. Environ. Sci. Technol. 2008, 2, 75–88. [Google Scholar]
- Mulligan, J.; Harper, J.; Kipkemboi, P.; Ngobi, B.; Collins, A. Community-Responsive Adaptation to Flooding in Kibera, Kenya. Available online: https://www.icevirtuallibrary.com/doi/10.1680/jensu.15.00060 (accessed on 10 June 2018).
- Dasylva, S. Inondations à Dakar et au Sahel: Gestion Durable des Eaux de Pluie; Enda Éditions: Dakar, Senegal, 2009. [Google Scholar]
- O’Donnell, E.C.; Lamond, J.E.; Thorne, C.R. Learning and action alliance framework to facilitate stakeholder collaboration and social learning in urban flood risk management. Environ. Sci. Policy 2018, 80, 1–8. [Google Scholar] [CrossRef]
- Djalante, R.; Holley, C.; Thomalla, F. Adaptive governance and managing resilience to natural hazards. Int. J. Disaster Risk Sci. 2011, 2, 1–14. [Google Scholar] [CrossRef]
- Alexander, M.; Priest, S.; Mees, H. A framework for evaluating flood risk governance. Environ. Sci. Policy 2016, 64, 38–47. [Google Scholar] [CrossRef]
- Hammond, M.J.; Chen, A.S.; Djordjević, S.; Butler, D.; Mark, O. Urban flood impact assessment: A state-of-the-art review. Urban Water J. 2015, 12, 14–29. [Google Scholar] [CrossRef]
- Carpenter, S.; Walker, B.; Anderies, J.M.; Abel, N. From metaphor to measurement: Resilience of what to what? Ecosystems 2001, 4, 765–781. [Google Scholar] [CrossRef]
- Maclean, K.; Cuthill, M.; Ross, H. Six attributes of social resilience. J. Environ. Plan. Manag. 2014, 57, 144–156. [Google Scholar] [CrossRef]
- Ifejika Speranza, C.; Wiesmann, U.; Rist, S. An indicator framework for assessing livelihood resilience in the context of social–ecological dynamics. Glob. Environ. Chang. 2014, 28, 109–119. [Google Scholar] [CrossRef]
- Béné, C. Towards a quantifiable measure of resilience. IDS Work. Pap. 2013, 2013, 1–27. [Google Scholar] [CrossRef]
- Jacobi, J.; Schneider, M.; Bottazzi, P.; Pillco, M.; Calizaya, P.; Rist, S. Agroecosystem resilience and farmers’ perceptions of climate change impacts in cocoa farms in alto beni, bolivia. Renew. Agric. Food Syst. 2013, 30, 170–183. [Google Scholar] [CrossRef]
- Pelling, M.; Wisner, B. Disaster Risk Reduction: Cases from Urban Africa; Routledge: Abingdon, UK, 2012. [Google Scholar]
- Jones, L.; Tanner, T. Measuring ‘Subjective Resilience’: Using Peoples’ Perceptions to Quantify Household Resilience. Available online: https://www.odi.org/publications/9631-measuring-subjective-resilience-using-peoples-perceptions-quantify-household-resilience (accessed on 10 June 2018).
- Alonso-Tapia, J.; Nieto, C.; Ruíz, M.A. Measuring subjective resilience despite adversity due to family, peers and teachers. Span. J. Psychol. 2013, 16. [Google Scholar] [CrossRef] [PubMed]
- Bahadur, A.V.; Peters, K.; Wilkinson, E.; Pichon, F.; Gray, K.; Tanner, T. The 3as: Tracking Resilience across Braced. Overseas Development Institute (ODI), 2015. Available online: https://www.odi.org/publications/9840-3as-tracking-resilience-acrossbraced (accessed on 10 June 2018).
- Baylis, K.; Honey-Rosés, J.; Börner, J.; Corbera, E.; Ezzine-de-Blas, D.; Ferraro, P.J.; Lapeyre, R.; Persson, U.M.; Pfaff, A.; Wunder, S. Mainstreaming impact evaluation in nature conservation. Conserv. Lett. 2016, 9, 58–64. [Google Scholar] [CrossRef]
- Ferraro, P.J. Counterfactual thinking and impact evaluation in environmental policy. New Dir. Eval. 2009, 2009, 75–84. [Google Scholar] [CrossRef]
- Ferraro, P.J.; Hanauer, M.M. Advances in measuring the environmental and social impacts of environmental programs. Annu. Rev. Environ. Resour. 2014, 39, 495–517. [Google Scholar] [CrossRef]
- Ferraro, P.J.; Pattanayak, S.K. Money for nothing? A call for empirical evaluation of biodiversity conservation investments. PLoS Biol. 2006, 4, e105. [Google Scholar] [CrossRef] [PubMed]
- Gertler, P.J.; Martinez, S.; Premand, P.; Rawlings, L.B.; Vermeersch, C.M.J. Impact Evaluation in Practice; The International Bank for Reconstruction and Development: Washington, DC, USA, 2011. [Google Scholar]
- Pattanayak, S. Rough Guide to Impact Evaluation of Environmental and Development Programs; South Asian Network for Development and Environmental Economics: Kathmandu, Nepal, 2009. [Google Scholar]
- Wooldridge, J.M. Econometric Analysis of Cross Section and Panel Data; MIT Press: Cambridge, MA, USA, 2010. [Google Scholar]
- Pohl, C.; Hadorn, G.H. Principles for Designing Transdisciplinary Research; Oekom: Munich, Germany, 2007. [Google Scholar]
- Underwood, A. On beyond baci: Sampling designs that might reliably detect environmental disturbances. Ecol. Appl. 1994, 4, 3–15. [Google Scholar] [CrossRef]
- Woodhouse, E.; Homewood, K.M.; Beauchamp, E.; Clements, T.; McCabe, J.T.; Wilkie, D.; Milner-Gulland, E.J. Guiding principles for evaluating the impacts of conservation interventions on human well-being. Philos. Trans. R. Soc. B Biol. Sci. 2015, 370. [Google Scholar] [CrossRef] [PubMed]
- Clement, A.R. An application of geographic information system in mapping flood risk zones in a north central city in nigeria. Afr. J. Environ. Sci. Technol. 2013, 7, 365–371. [Google Scholar]
- Coulthard, T.J.; Neal, J.C.; Bates, P.D.; Ramirez, J.; Almeida, G.A.; Hancock, G.R. Integrating the lisflood-fp 2d hydrodynamic model with the caesar model: Implications for modelling landscape evolution. Earth Surface Processes Landf. 2013, 38, 1897–1906. [Google Scholar] [CrossRef]
- Puhani, P.A. The treatment effect, the cross difference, and the interaction term in nonlinear “difference-in-differences” models. Econ. Lett. 2012, 115, 85–87. [Google Scholar] [CrossRef]
- Herk, S.; Zevenbergen, C.; Rijke, J.; Ashley, R. Collaborative research to support transition towards integrating flood risk management in urban development. J. Flood Risk Manag. 2011, 4, 306–317. [Google Scholar] [CrossRef]
- Butler, C.; Pidgeon, N. From ‘flood defence’ to ‘flood risk management’: Exploring governance, responsibility, and blame. Environ. Plan. C Gov. Policy 2011, 29, 533–547. [Google Scholar] [CrossRef]
- Takao, K.; Motoyoshi, T.; Sato, T.; Fukuzondo, T.; Seo, K.; Ikeda, S. Factors determining residents’ preparedness for floods in modern megalopolises: The case of the tokai flood disaster in Japan. J. Risk Res. 2004, 7, 775–787. [Google Scholar] [CrossRef]
- Carmona, A.R. El Proyectorado: Bolivia Tras 20 Años de Ayuda Externa; Intermón Oxfam Editorial: Spain, 2008; Volume 16. [Google Scholar]
- Vedeld, T.; Coly, A.; Ndour, N.M.; Hellevik, S. Climate adaptation at what scale? Multi-level governance, resilience, and coproduction in saint louis, senegal. Nat. Hazards 2016, 82, 173–199. [Google Scholar] [CrossRef]
© 2018 by the authors. Licensee MDPI, Basel, Switzerland. This article is an open access article distributed under the terms and conditions of the Creative Commons Attribution (CC BY) license (http://creativecommons.org/licenses/by/4.0/).