Optimization Models to Improve Estimations and Reduce Nitrogen Excretion from Livestock Production

1
Department of Applied Statistics and Operational Research and Quality, Universitat Politècnica de València, Camino de Vera, s/n 46022 Valencia, Spain
2
Department of Economy and Social Sciences, Universitat Politècnica de València, Camino de Vera, s/n 46022 Valencia, Spain
*
Author to whom correspondence should be addressed.
Sustainability 2018, 10(7), 2362; https://doi.org/10.3390/su10072362
Submission received: 3 June 2018
/
Revised: 1 July 2018
/
Accepted: 5 July 2018
/
Published: 7 July 2018
(This article belongs to the Special Issue Livestock Production and Industrial Ecology)
Abstract
:Sustainable food production plays a key role at different levels, such as countries, producers and consumers worldwide. Commitments of countries to reducing environmental impact include livestock production due to its contribution to greenhouse gases and other pollutants. The purpose of this research is to design and validate optimization models to improve assessments of emissions from livestock. As feed consumed is the principal source of the emissions, we have developed an aggregated optimization model to assess feed intake and therefore emissions at country level, by using the best technical and statistical data. This model provides a common framework to assess livestock emissions for all countries and in particular in the European Union. The model has been validated in the Spanish intensive pig sector, which is the principal producer by head count of the European Union. Results from several scenarios, which differ in animal protein and energy needs, have been compared to those from other methodologies and the Spanish National Inventory System, which assesses greenhouse gases and pollutants annually. This model can be adapted to other species, and applied to other countries and at farm level. Finally, this model is a useful tool to evaluate the effects on the emissions related to changes in animal nutrition, price and supply of raw materials, as well as agricultural and environmental policies.
1. Introduction
European countries have commitments to reducing greenhouse gases (GHG) and pollutant emissions under various protocols and directives. These commitments require the assessment and annual reporting of national gaseous emissions, as well as their future projections in established formats, according to Intergovernmental Panel on Climate Change (IPCC) Guidelines [1] and the air pollutant emission inventory guidebook from the European Environment Agency (EEA) [2]. States are also required to draw up programs for the progressive reduction of their annual national emissions. Several authors have highlighted the need for having accurate estimates, and tools to inform mitigation strategies [3].
In the European Union (EU) GHG emissions decreased in most sectors between 1990 and 2014. At the end of this period, the level was 24.4% below the 1990 level, according to the 2014 GHG inventory [4]. Of this reduction 20% is in agriculture, where the main source of emissions of carbon dioxide, methane, and nitrous oxide is livestock production [5]. Nevertheless, the GHG emissions from livestock in the EU represent 10% of the total. Enteric fermentation of ruminants and manure management were the main sources of methane, which could be reduced by modifications in animal diet [6,7].
In addition, due to negative effects on health, environment and climate, the EU regularly estimates pollutant emissions from the following sectors: energy, industrial processes and product use, agriculture, waste and other sources. The main pollutants are nitrogen oxides, non-methane volatile organic compounds (NMVOCs), sulfur oxides and ammonia. Agriculture is responsible for 94% of the ammonia, mainly from the livestock sector, which produces two third of the total [8]. Although ammonia emissions have dropped by 26% since 1990, several authors have pointed out the importance of reducing them more, as well as improving the quality of their estimations from livestock. The amount of nitrogen in excreta depends on several factors, such as animal category as well as feed and management [9]. Emissions from livestock can be mitigated through improvements in animal management techniques including nutrition, housing and waste management [7,10,11,12,13]. Maurer et al. [14] carried out a recent review of technologies for emissions mitigation from livestock operations focused on animal housing, manure storage and handling and manure land application.
The general approach to calculating emission inventories is to multiply activity data by emission factor, which quantifies the emission per unit of activity. Although there are some differences between GHG and pollutant inventories, such as the need to take emission abatement into account in the latter case, both are based on three methodologies, known as Tiers, depending on available information. Tier 1 methods are the simplest ones and apply linear relation between activity data from statistical information and default emission factors. In Tier 2 the only difference to Tier 1 is that the emission factors are country-specific. Finally, Tier 3 is based on more complex models and/or data from facility level.
To the best of our knowledge, the emission inventories from livestock use Tiers 1 or 2 approaches, which are mainly based on manure management, although the influence of animal diets is well-known. Westhoek et al. [15] quantified the pollution reduction if people consumed fewer animal products; nevertheless, there is little research on how to decrease GHG and pollutants by modifying animal diets. Only Moraes et al. [16] applied goal programming to minimize diet costs and methane emissions by using data from lactating cows in California.
Hou et al. [9] developed an aggregate linear programming model to estimate feed use and nitrogen excreta from livestock in the EU at country level. This model represents an interesting approach, which provides a uniform methodology that can be applied in all countries and thus to improve comparisons between them. Nevertheless, due to the high level of aggregation in both animal and feed categories, as well as some weaknesses of the model design, more research is needed to increase the quality of the pollutant estimates through optimization models. Maroto et al. [17] and Segura et al. [18] developed a more detailed linear programming model for Spanish livestock, which also had some drawbacks related mainly to the reliability of agricultural statistics.
As feed intake is the most important variable in predicting emissions, which depend on animal diet, the general objective of this research is to design a decision support system (DSS) based on optimization models to improve the quality and accuracy of emission factors of GHG and other pollutant from livestock at country level. Firstly, we have developed an aggregate linear programming model to estimate real consumption of feed by animals. Secondly, validation of this model has been carried out by implementing this model in the Spanish pig sector, which is the principal producer in the EU. Pork represents 37% of total meat production worldwide.
The rest of the paper is organized as follows: Section 2 explains in detail the linear programming model developed to estimate the emissions of livestock at country level and DSS to implement and update it to calculate annual emissions. The implementation in the Spanish pig sector using the LINGO language to generate models is presented briefly in Section 3. The main results obtained from optimal solutions by solving models for a six-year period (2008–2013) in different scenarios are then reported. In the discussion we compare the results of this research with those of other studies and methodologies. Finally, conclusions and future research are presented in the last section.
2. New Methodology: A Linear Programming Model at Country Level
Optimization models are powerful tools for understanding and solving complex problems. Nevertheless, building and validating appropriate models to solve real problems is not easy. The main concepts of optimization models are variables, objective function, constraints and coefficients. Variables represent the controllable aspects, the objective function measures the decision maker’s objective as a function of the variables, while constraints are mathematical expressions, which restrict the values of variables, which are the unknowns. The coefficients represent the uncontrollable aspects of the problem, usually known as technical data. If all functions are linear, we have developed a linear programming (LP) model.
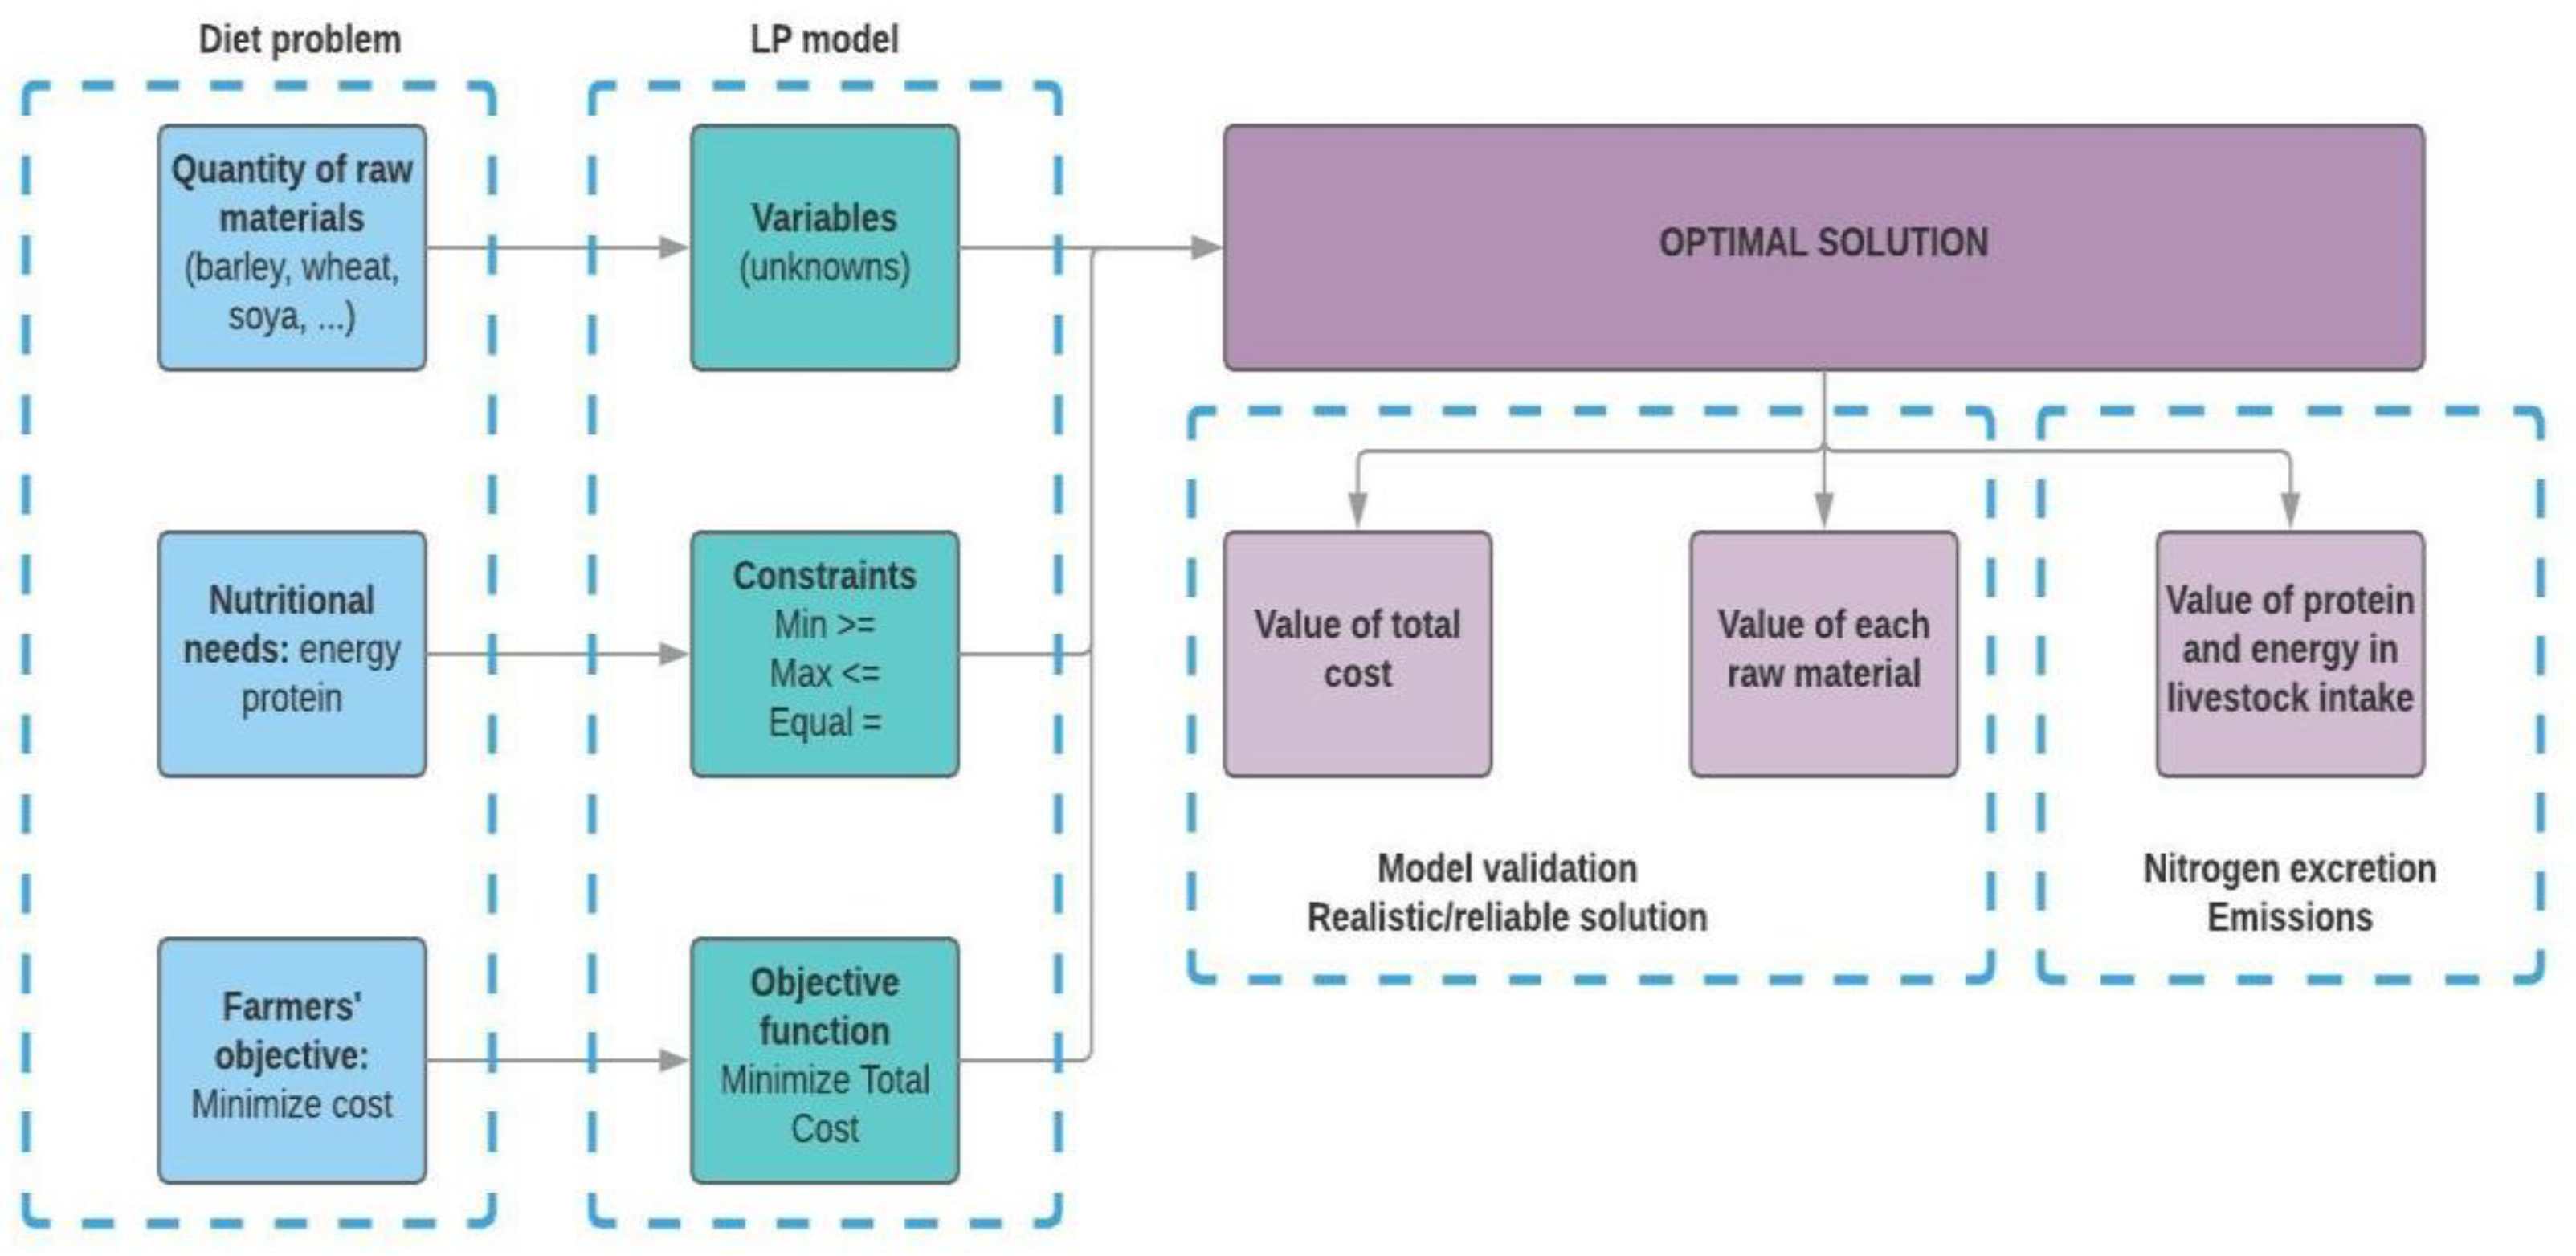
The diet problem is a classical linear programming model focused on people nutrition. For several decades, farmers and factories have calculated rations and feed for livestock by using software based on linear programming models, which are similar to the diet problem. In the case of livestock, as Figure 1 shows, the variables of the model are the quantity of raw materials, such as barley, wheat, rye, corn, soy, …, measured for example in tons or kilograms. The nutritional needs (energy, protein and calcium among others) are considered in the model constraints. Each animal category has specific nutritional needs, depending on species (pig, poultry, cattle, …), age and production cycle. Constraints are equations, which can represent minimum needs by using greater or equal to inequalities, maximum requirements expressed by lesser or equal to inequalities, as well as constraints where the left-hand side (LHS) is equal to right-hand side (RHS) of the equation. The objective function of feed models consists of minimizing total cost, because the farmer’s goal is to produce as cheaply as possible. In short, when solving this LP model, the optimal solution is obtained, which provides the quantities of raw materials which satisfy livestock requirements and minimize production cost, as well as the exact quantity of energy and protein in animal intake. We can build this model at farm or country level. In the first case, the optimal solution indicates to the farmer which raw materials and how much of them must be bought and used for feeding livestock to minimize production cost, satisfying nutritional needs of animals. As expert recommendations are established as minimum or maximum requirements, the real value of protein and energy can be greater than the minimum or lesser than the maximum, due to the structure of market prices of different available cereals and soya for example. As the emission factors of livestock production depend on protein and energy intake, they are also linked to prices of raw materials, which are available for the farm or in the country (Figure 1).
The greenhouse and pollutant gases inventories need reliable estimates at national level and a common framework for all countries is advisable [3,19]. As livestock emissions are known functions of animal diet, we have developed an aggregated linear programming model for livestock at country level as explained below.
First, we define the variables as the quantity in tons of raw material i that animal category j consumes in the reference year in a country, where n is the amount of raw materials usually consumed by all m livestock categories.
It is common that the variable values are limited by upper bounds depending on the type of feed and the animal category.
In addition, the minimum and/or maximum nutritional requirements of livestock, such as energy, protein or cereal feed, limit the values of the variables in the optimal solution, as Equations (3) and (4) show where n is the number of raw materials (i), p is the number of nutritional requirements (k) and m the number of animal categories (j).
The technical coefficients (armi,k) are the amount of requirement k that one unit of raw material i has. Thus, the LHS of the constraints represents the total quantity of the requirement k used for feeding the animal category j. The RHS of the constraints is the total quantity of the nutrient k that animal category j needs in one year as a minimum in greater than or equal to constraints or as a maximum in lesser than or equal to constraints.
There are nutrients with both minimum and maximum values, for example protein. Nevertheless, others have either minimum or maximum values. Moreover, there are other types of constraints, for example sets of raw materials, such as cereals, which have minimum and maximum values.
The available stock of raw materials in the country, calculated as production plus imports minus exports, in a reference year constitutes another group of constraints. The sum of all variables by raw material i should be less than or equal to the available stock of this raw material. There are m constraints, as many constraints as the number of raw materials included in the model (Equation (5)).
To facilitate understanding and evaluating the optimal solution, it is interesting to define other variables, such as Xi that represents the total amount of raw material i used by the country livestock in the reference year (Equation (6)).
The objective function consists of minimizing the total animal feed cost by multiplying the unit prices by quantities of raw materials used for feeding all animals in the country (Equation (7)). This objective is consistent with the real strategy of livestock production considering that the production of feed-stuffs in factories and farms minimizes costs.
where pi is the price of raw material i.
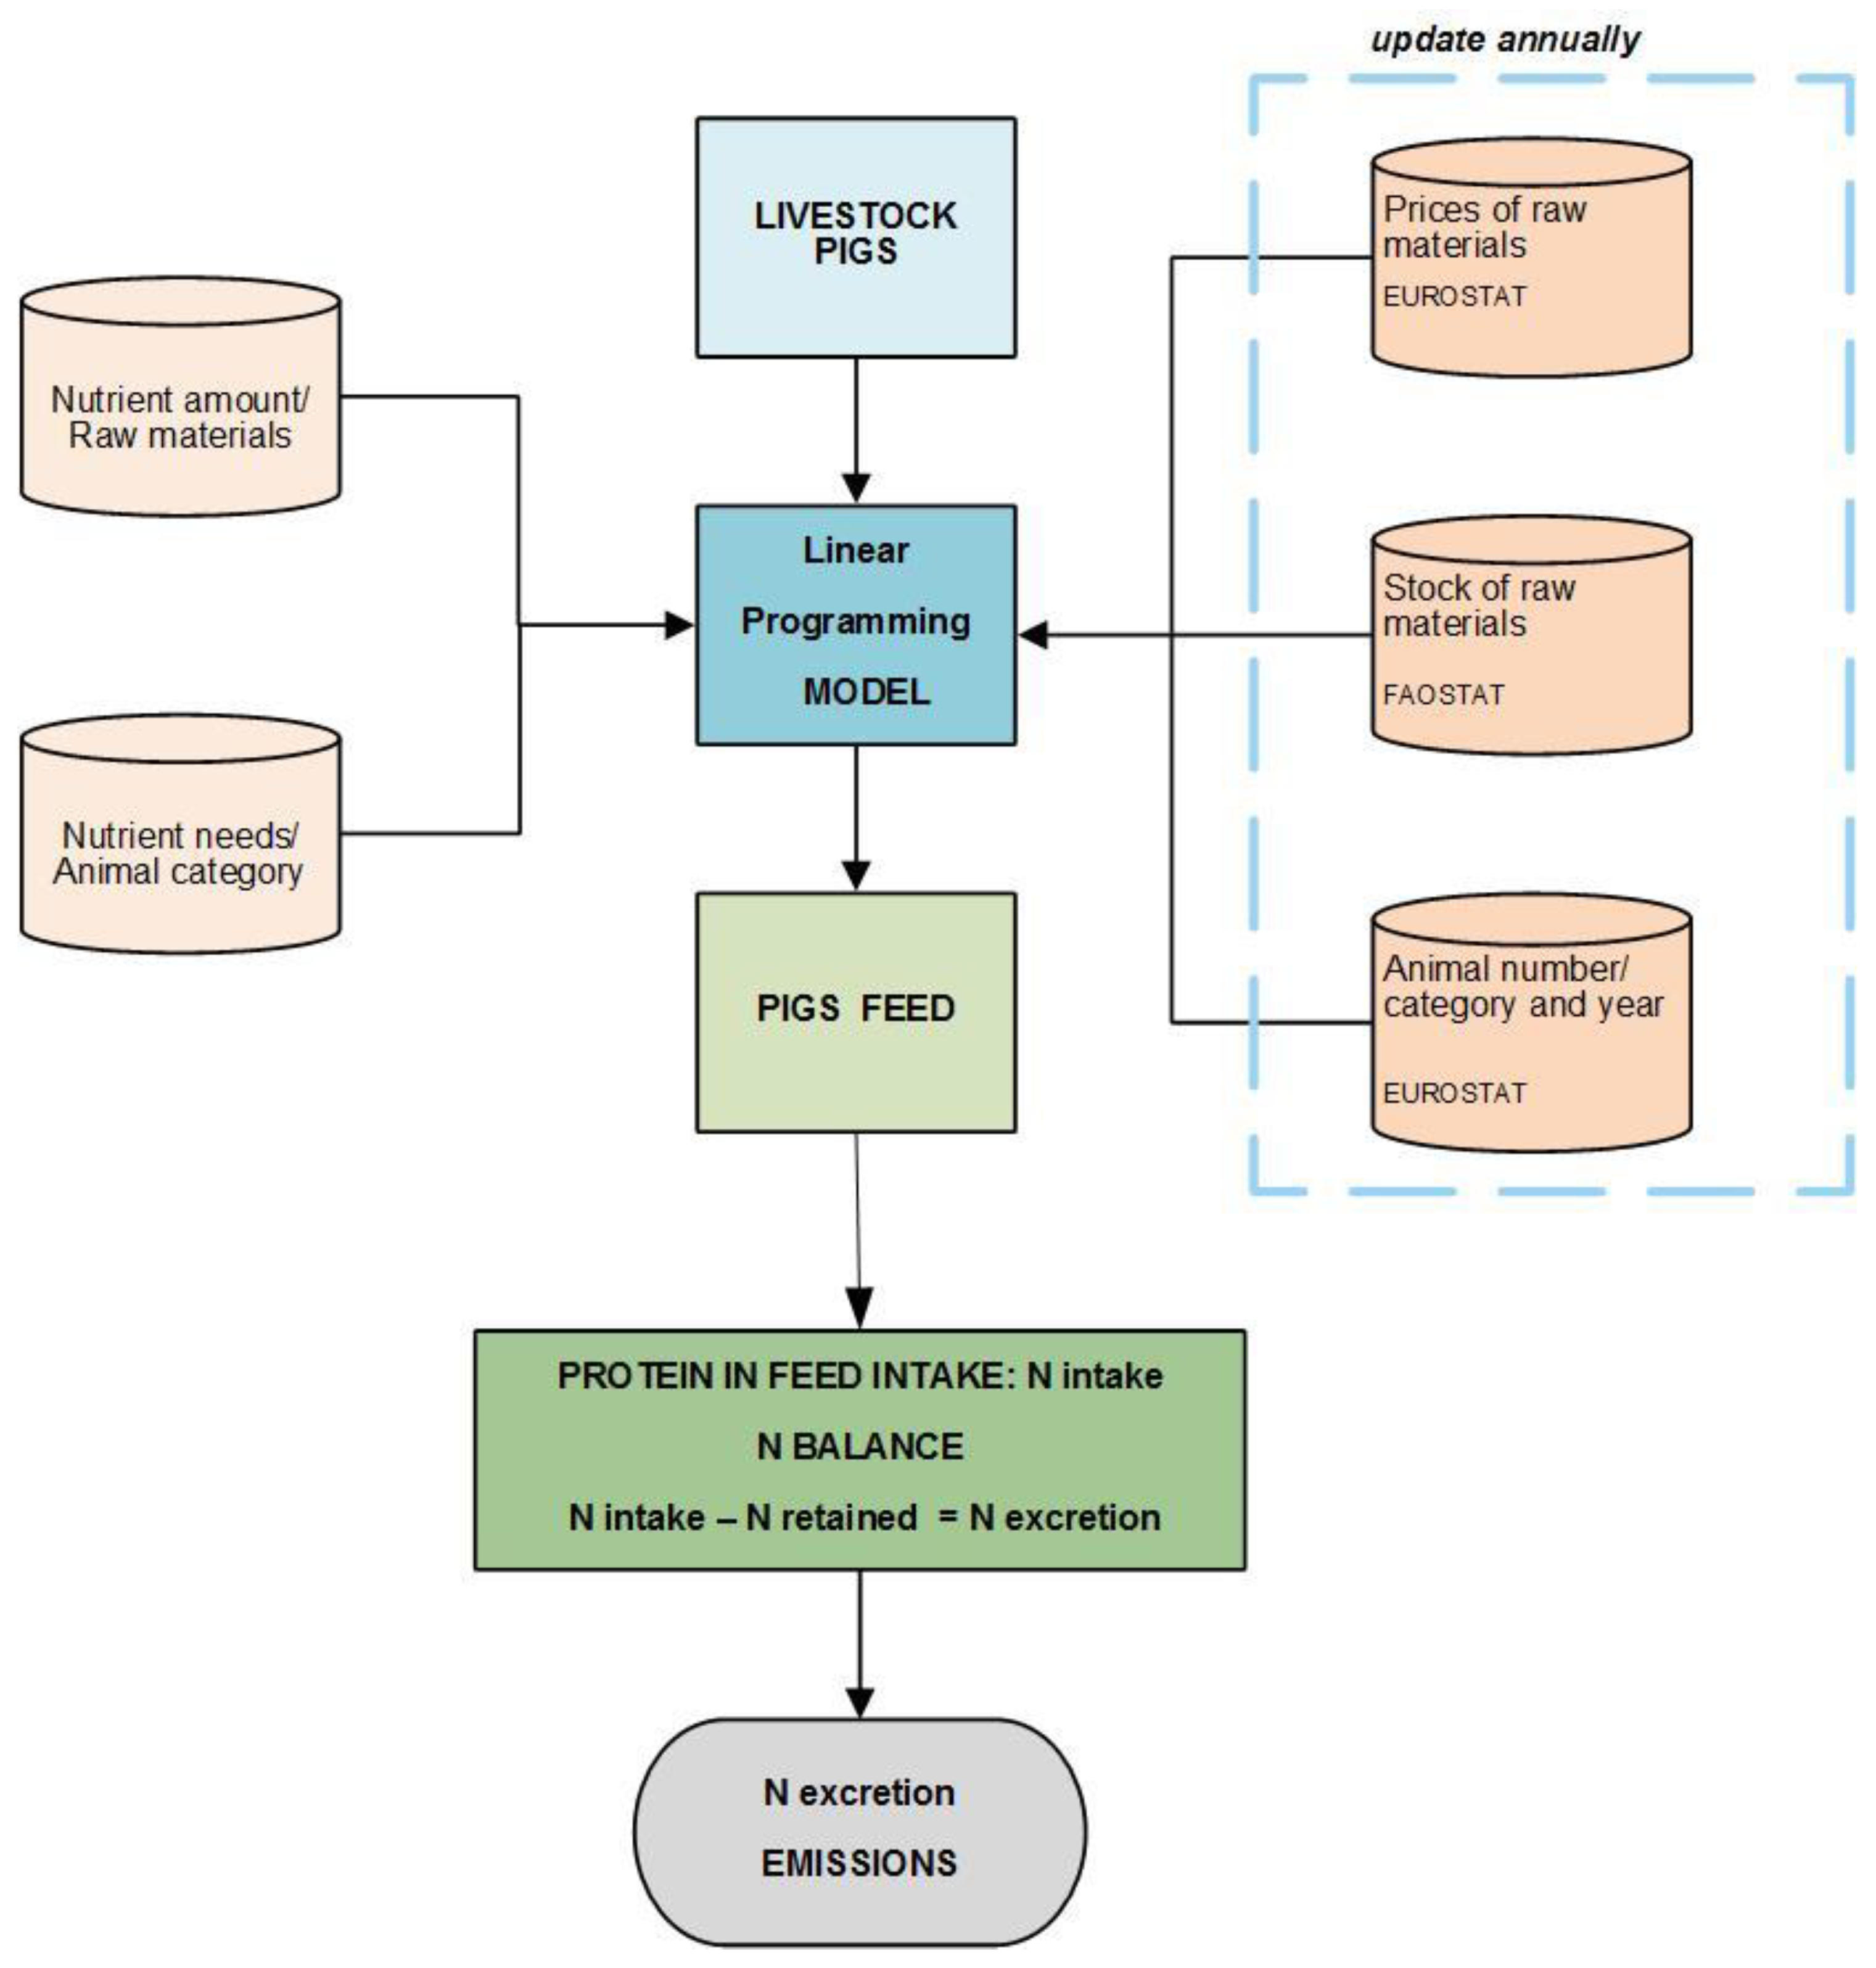
The Equations from (1) to (7) represent the complete aggregated linear programming model. Figure 2 shows a decision support system based on this optimization model, which allows annual emissions from livestock in a country to be calculated. After defining the animal categories, technical data from raw materials and animal needs should be collected from reliable and country-specific sources, such as Fundación Española para el Desarrollo de la Nutrición Animal (FEDNA) [20] in Spain, CVB in (Veevoedertabel) Holland, INRA in France, Atlas PREMIER in UK and NRC in USA. These data only need to be updated from time to time when there are significant changes. Nevertheless, prices and stock of raw materials, as well as the number of animals produced are data, which should be updated annually from statistics, such as FAOSTAT [21] and/or EUROSTAT [22]. All these data are the values of the coefficients of the model, that is, the technical coefficients and RHS of the constraints, as well as the coefficients of the objective function. After solving the LP model an optimal solution is obtained, as shown in Figure 1, in particular the quantity of protein in feed intake by animal category. Then, considering the ratio between crude protein and nitrogen (N) in animal intake, the nitrogen balance approach allows us to estimate the nitrogen excretion, which is equal to the total amount of nitrogen consumed minus the nitrogen retained in animal products (live-weight gains, milk, …). Finally, N excreted in urine and feces is partially applied to the land and partially emitted as ammonia to the atmosphere. This is a brief explanation of the influence of feed composition and animal productivity on nitrogen emissions.
To validate this aggregated model, it has been implemented in the Spanish pig sector, characterized by intensive production, as pork is the most consumed meat worldwide and Spain is the principal producer in the EU as indicated in the introduction.
Countries apply different methodologies to assess nitrogen excretion to estimate emissions from livestock included in national inventories, making difficult to carry out comparisons among them. The aggregated LP model proposed at country level provides a transparent and consistent approach to be applied in all countries, in particular in the European Union, using reliable technical and statistical data. The model can be also applied to farms to estimate nitrogen excretion at this level. Nevertheless, further efforts are necessary to scale up farm results to the national scale needed for national inventories, because there is a lack of useful statistical information to determine national emissions from farm results.
3. Results: Implementation in the Spanish Pig Sector
3.1. Model Implementation
The model explained in the previous section has been applied to the Spanish pig sector. Firstly, the model has been implemented using the LINGO language [23], which is necessary to be able to check it for several scenarios and years, as well as to maintain and scale it up to other species and countries easily.
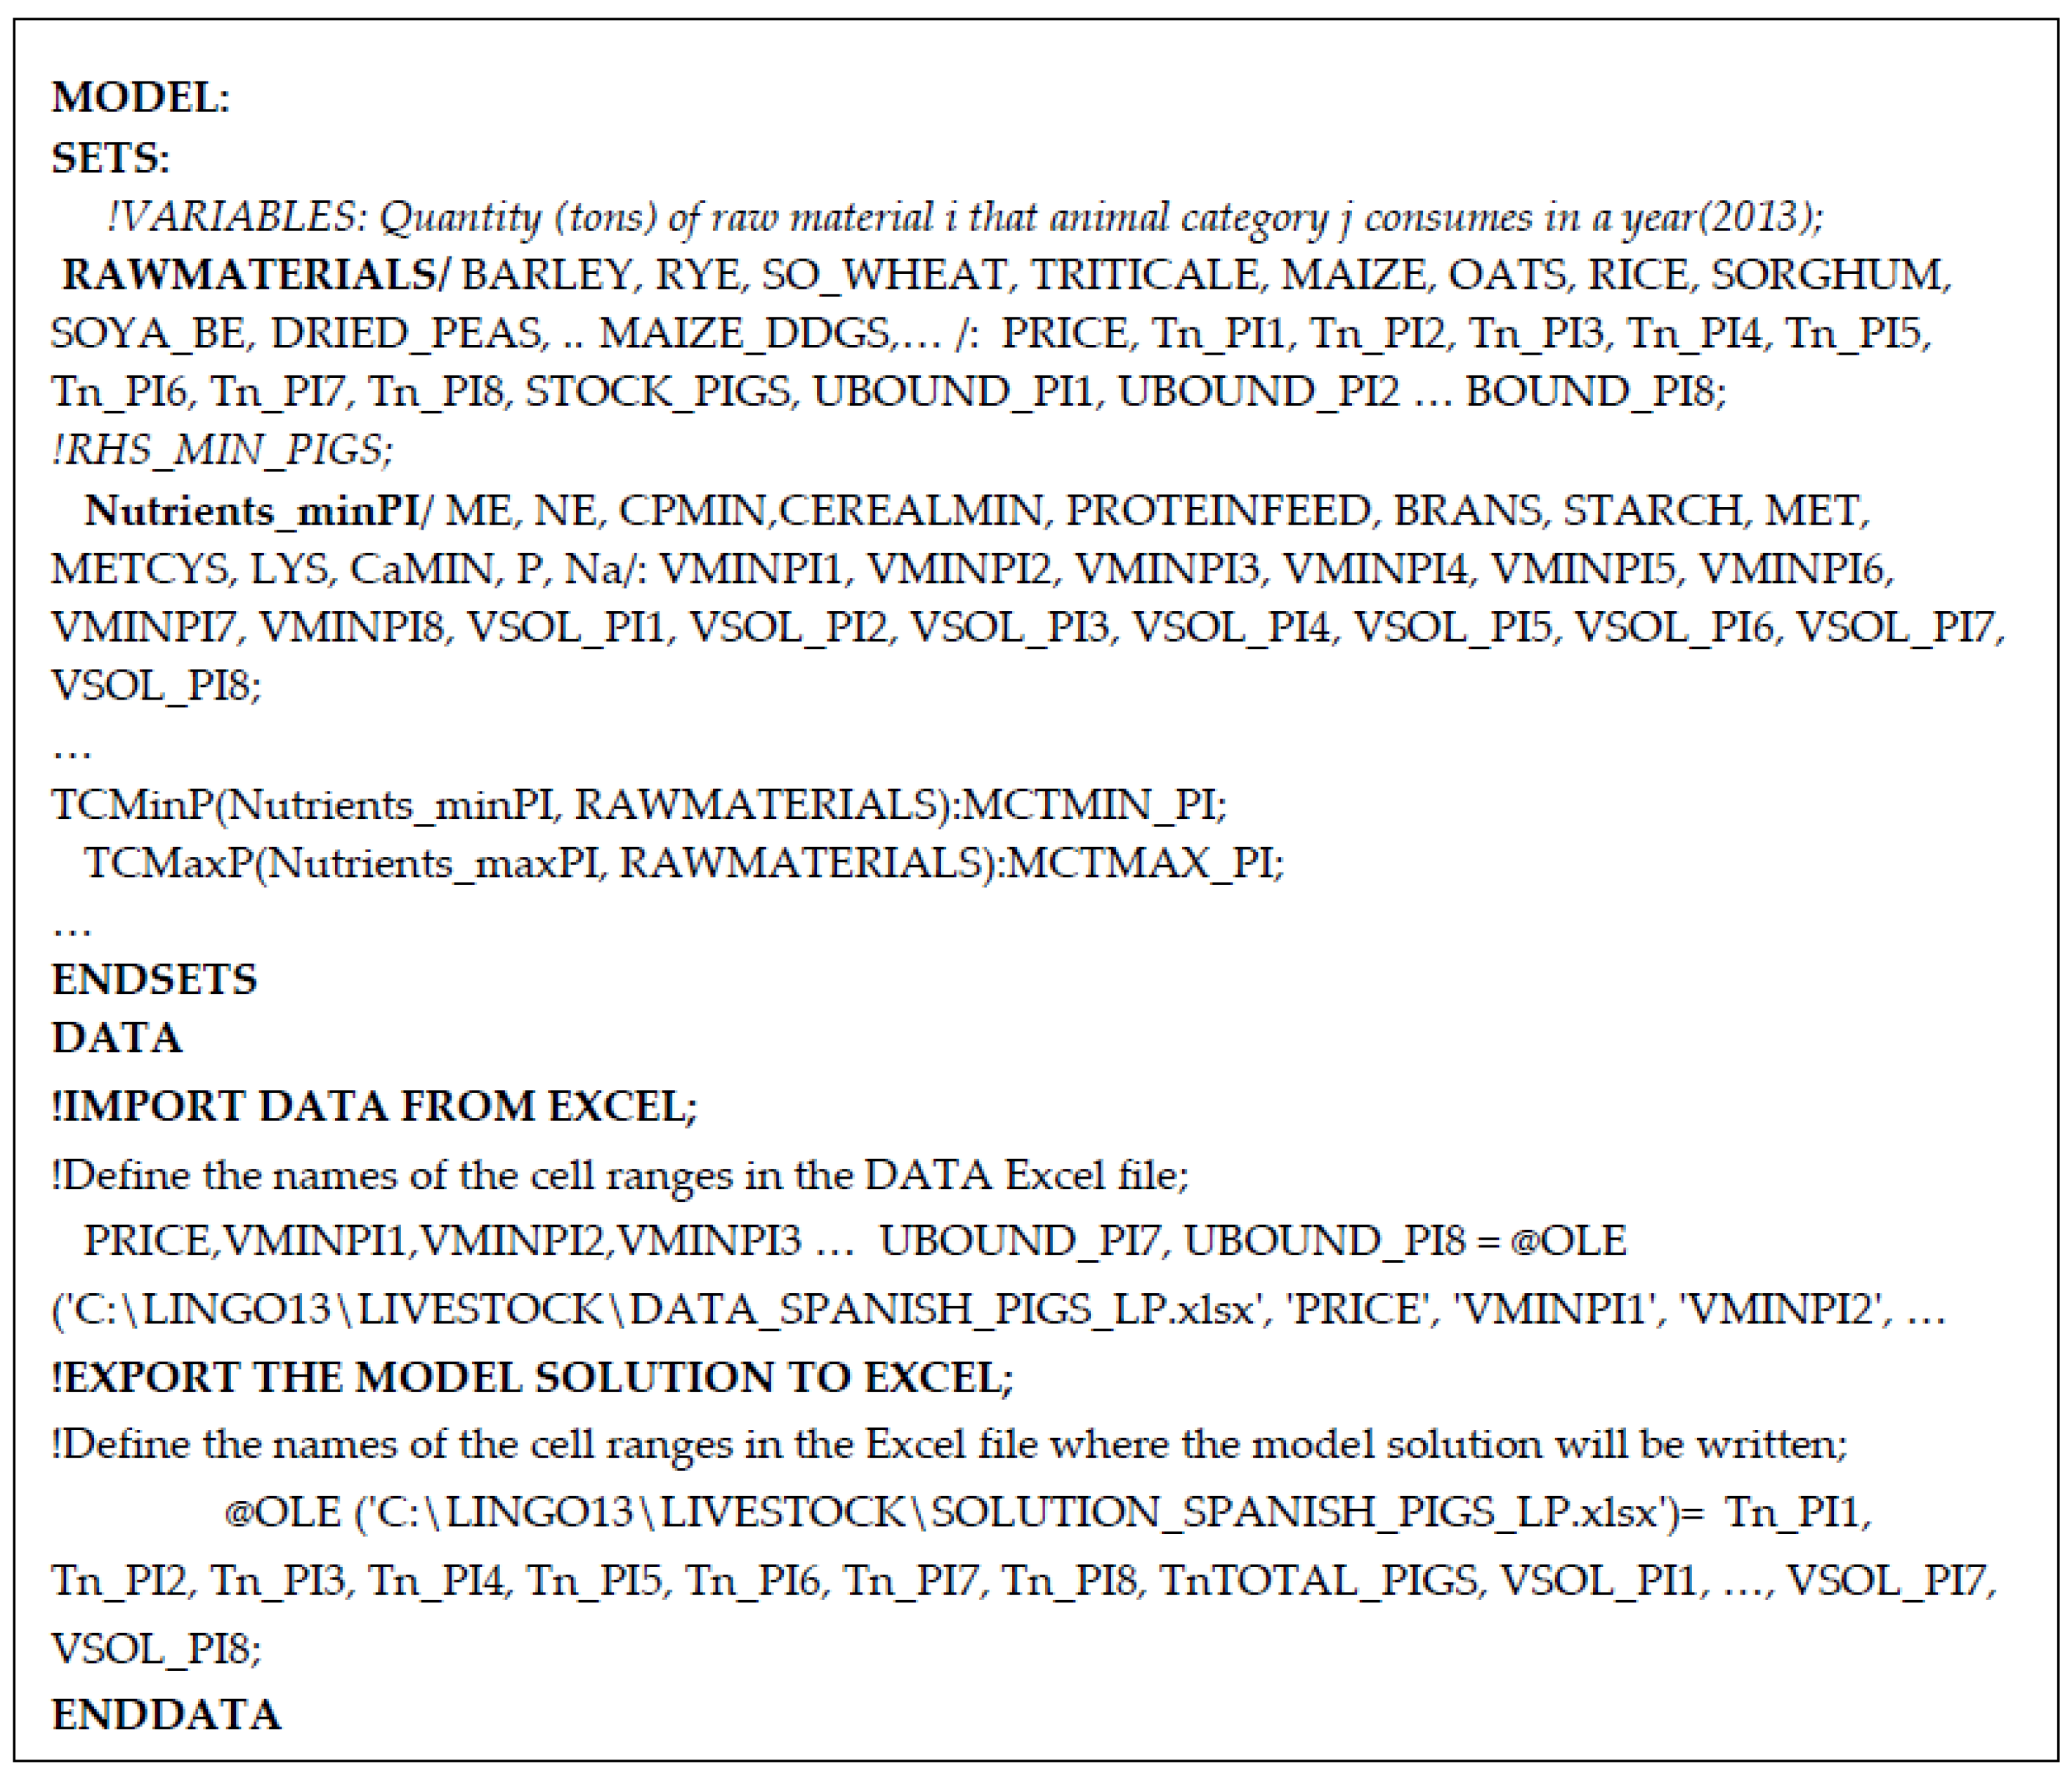
Figure 3 and Figure 4 partially present the code, and the complete program is available in the supplementary material. First, as shown in Figure 3, we have defined several sets, such as Raw Materials, by using an explicit list of them: barley, wheat, and so on, up to 21, which are mainly cereals, protein-rich feed and by-products of cereals. There are several attributes (they can be coefficients or variables) for each raw material, for example price, tons consumed by each one of the eight animal categories and their upper bounds. Other primitive sets are the requirements by each animal category, for example, energy and protein, they have a minimum limit, a maximum limit or both. To solve the model, we also need the values of RHS coefficients of constraints and the technical coefficient matrix, which is a derived set created from nutrient needs and raw materials. There are at least two matrices by animal category, one for minimum constraints and one for maximum constraints.
Figure 3 also shows the data section, which is useful to import data from, and export the solution of the model to, Excel files, by defining range names in the spreadsheet and using real-time Object Linking and Embedding (OLE)-based transfers. @OLE is an interface function for moving data back and forth from Excel using OLE links. This section allows us to isolate the data from the equations of the model, making it much easier to make changes to the data independently of the model. Therefore, the data section leads to easier model maintenance and facilitates scaling up the model to larger dimensions. In addition, the spreadsheet is a very useful tool for presenting the results generated by our model.
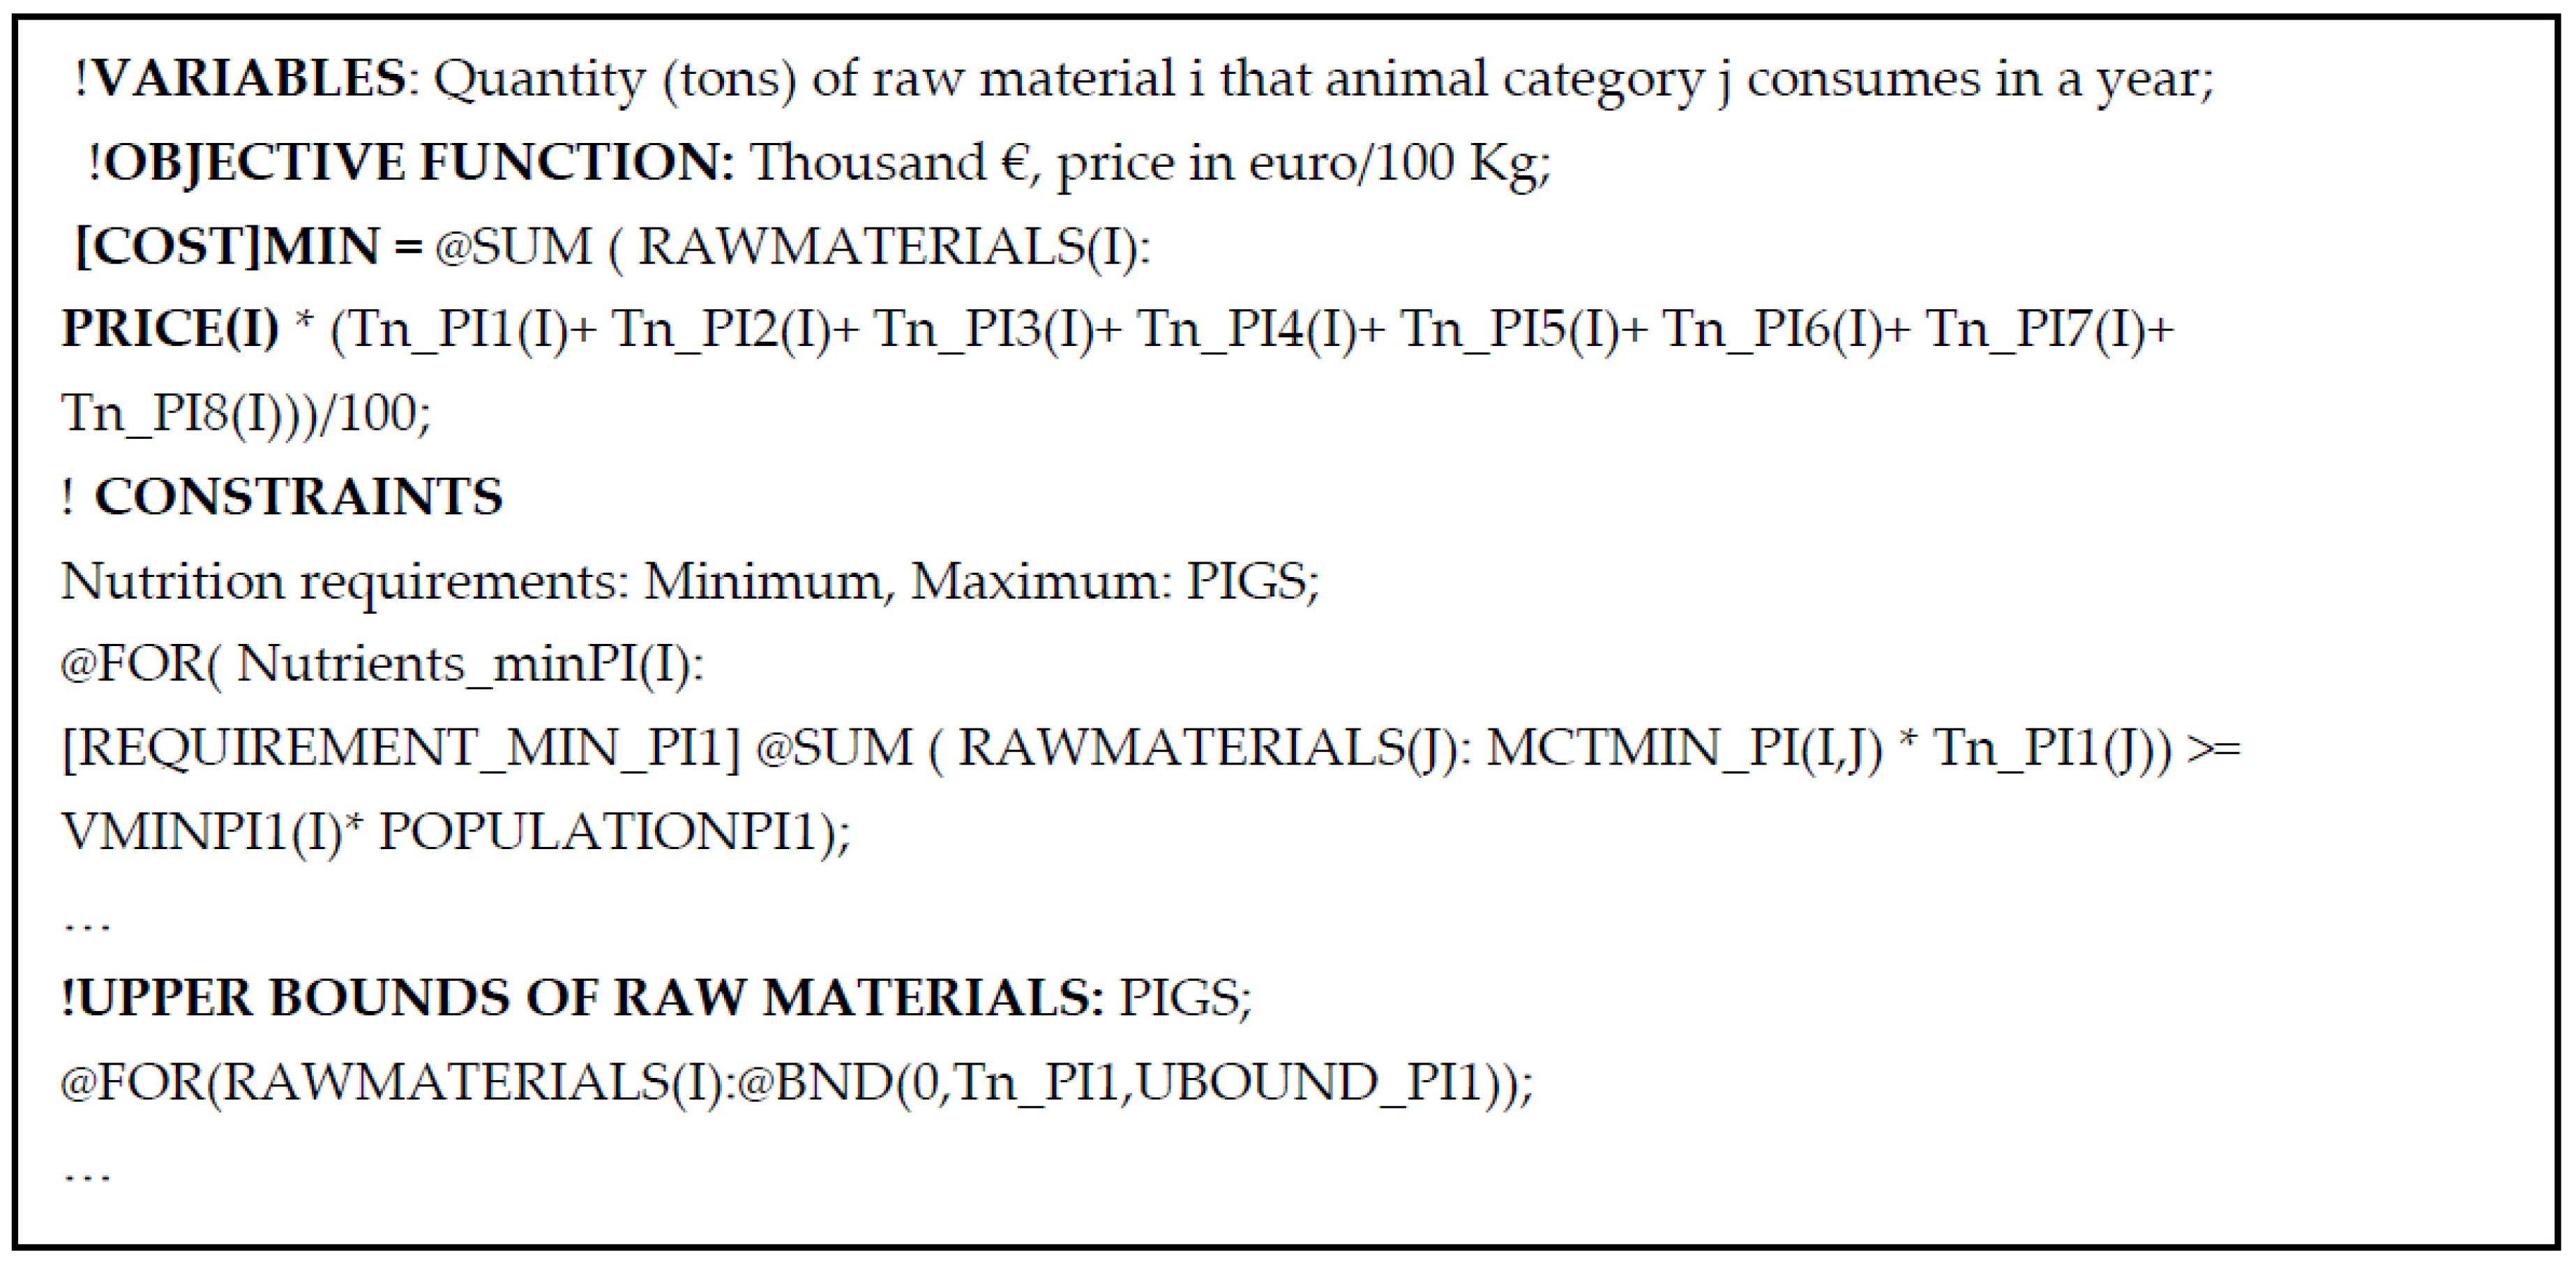
Figure 4 shows the sections related to the objective function, constraints and upper bounds. The @SUM function allows us to write several summation expressions and the @FOR function is used to generate constraints across members of a set.
3.2. Data and Optimal Solutions in Different Scenarios
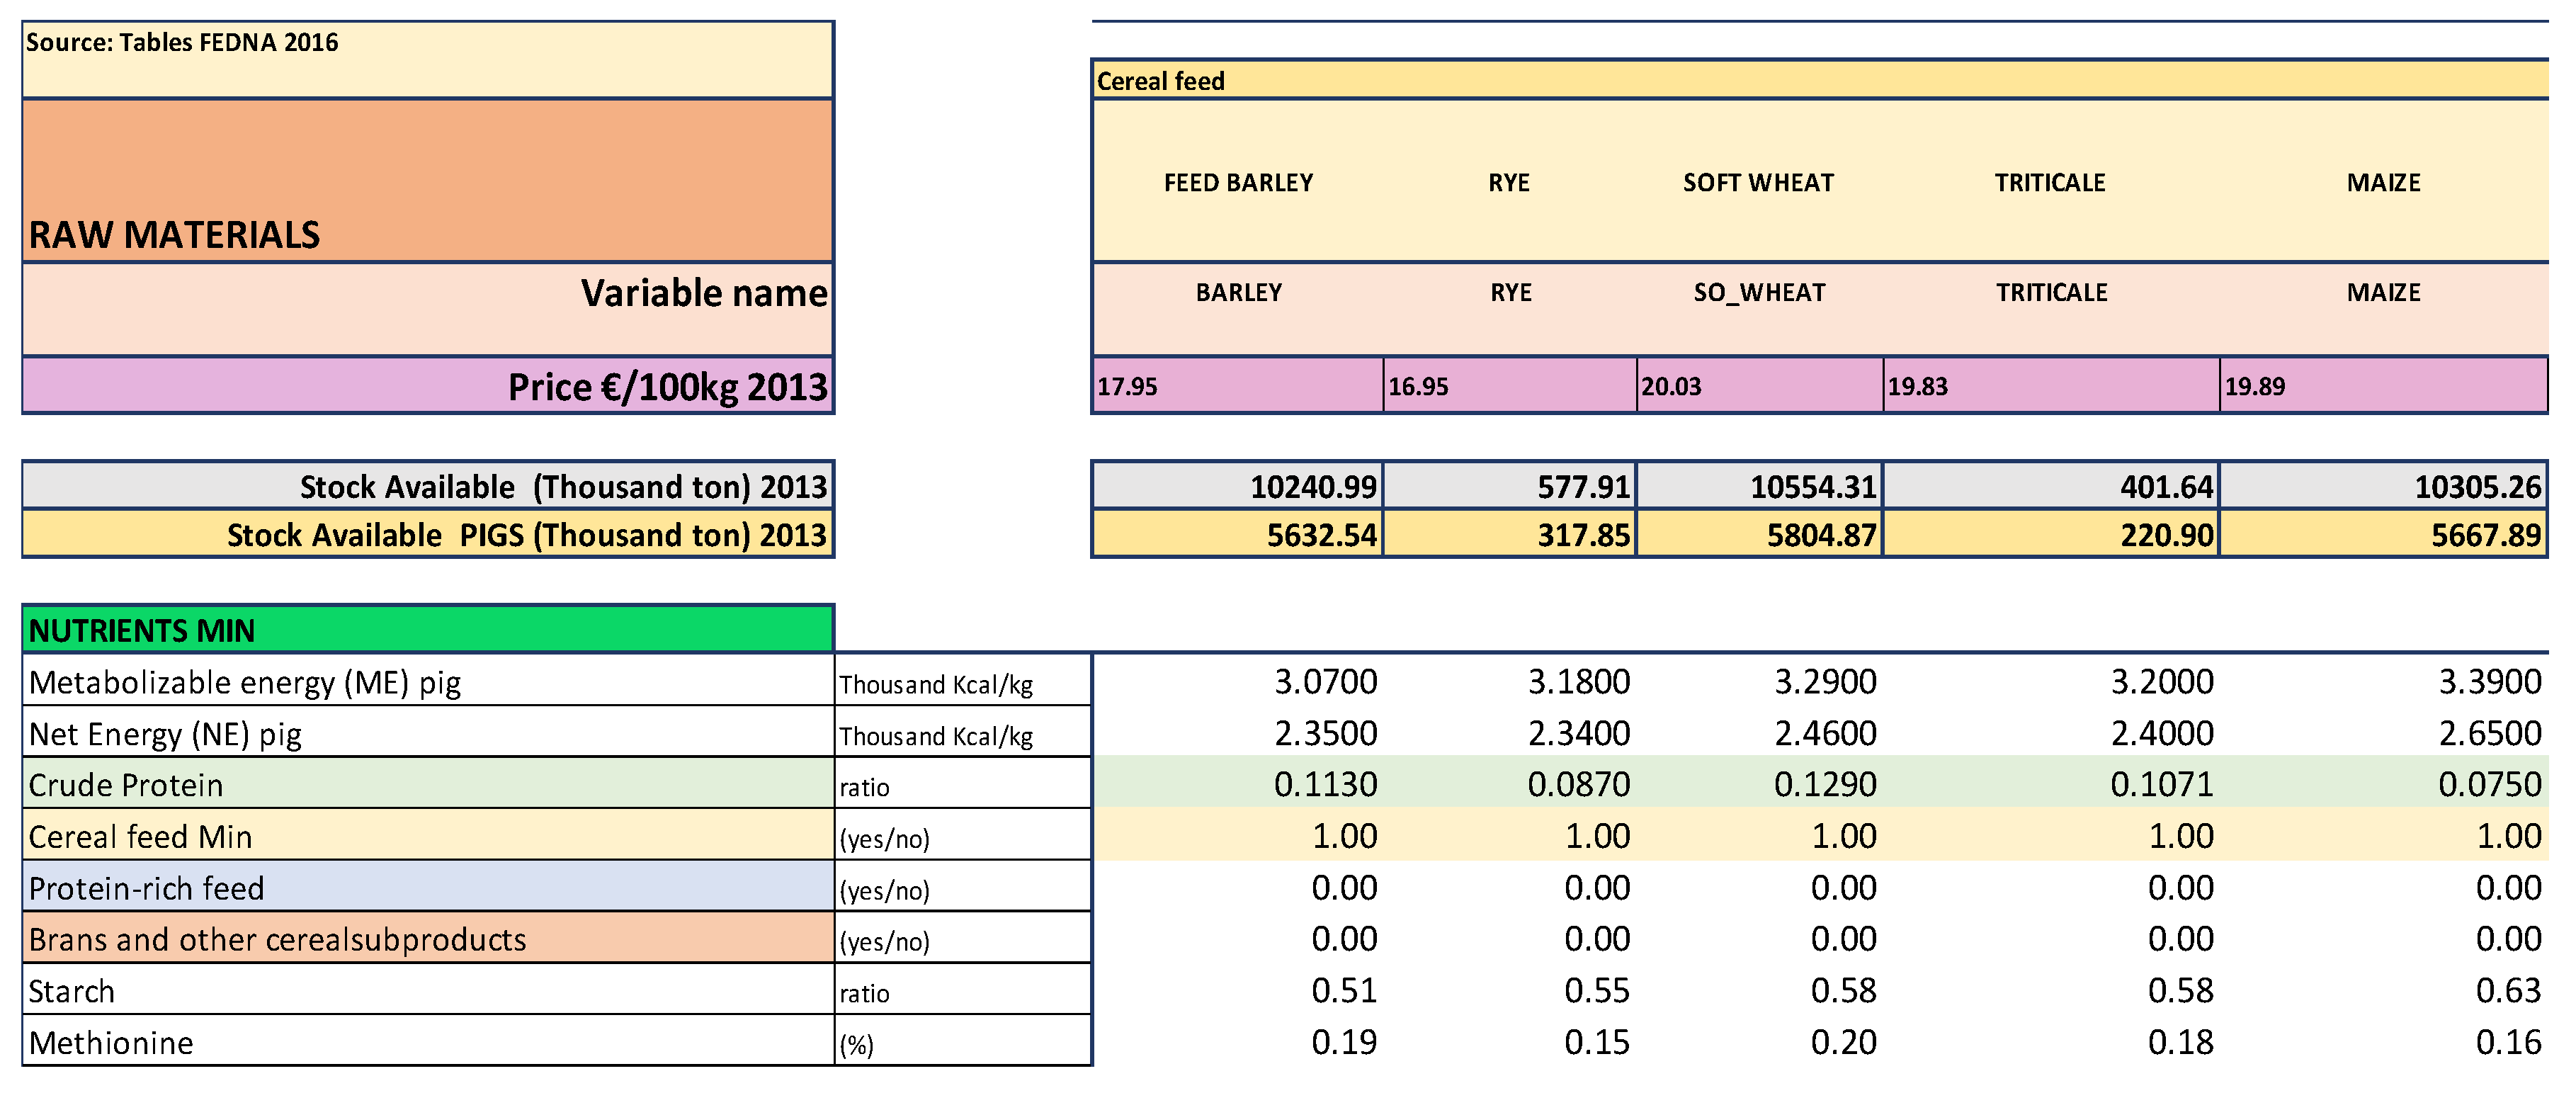
Figure 5 shows a partial overview of the data file. The minimum model size is 168 variables and 144 constraints. Nevertheless, LINGO considers more variables and constraints to facilitate importing and exporting data and the optimal solution, as well as to make the interpretation of results easier. Therefore, the model size is 333 variables and 331 constraints. LINGO obtains the optimal solutions in between 181and 382 iterations in 1–2 s, depending on year and scenario.
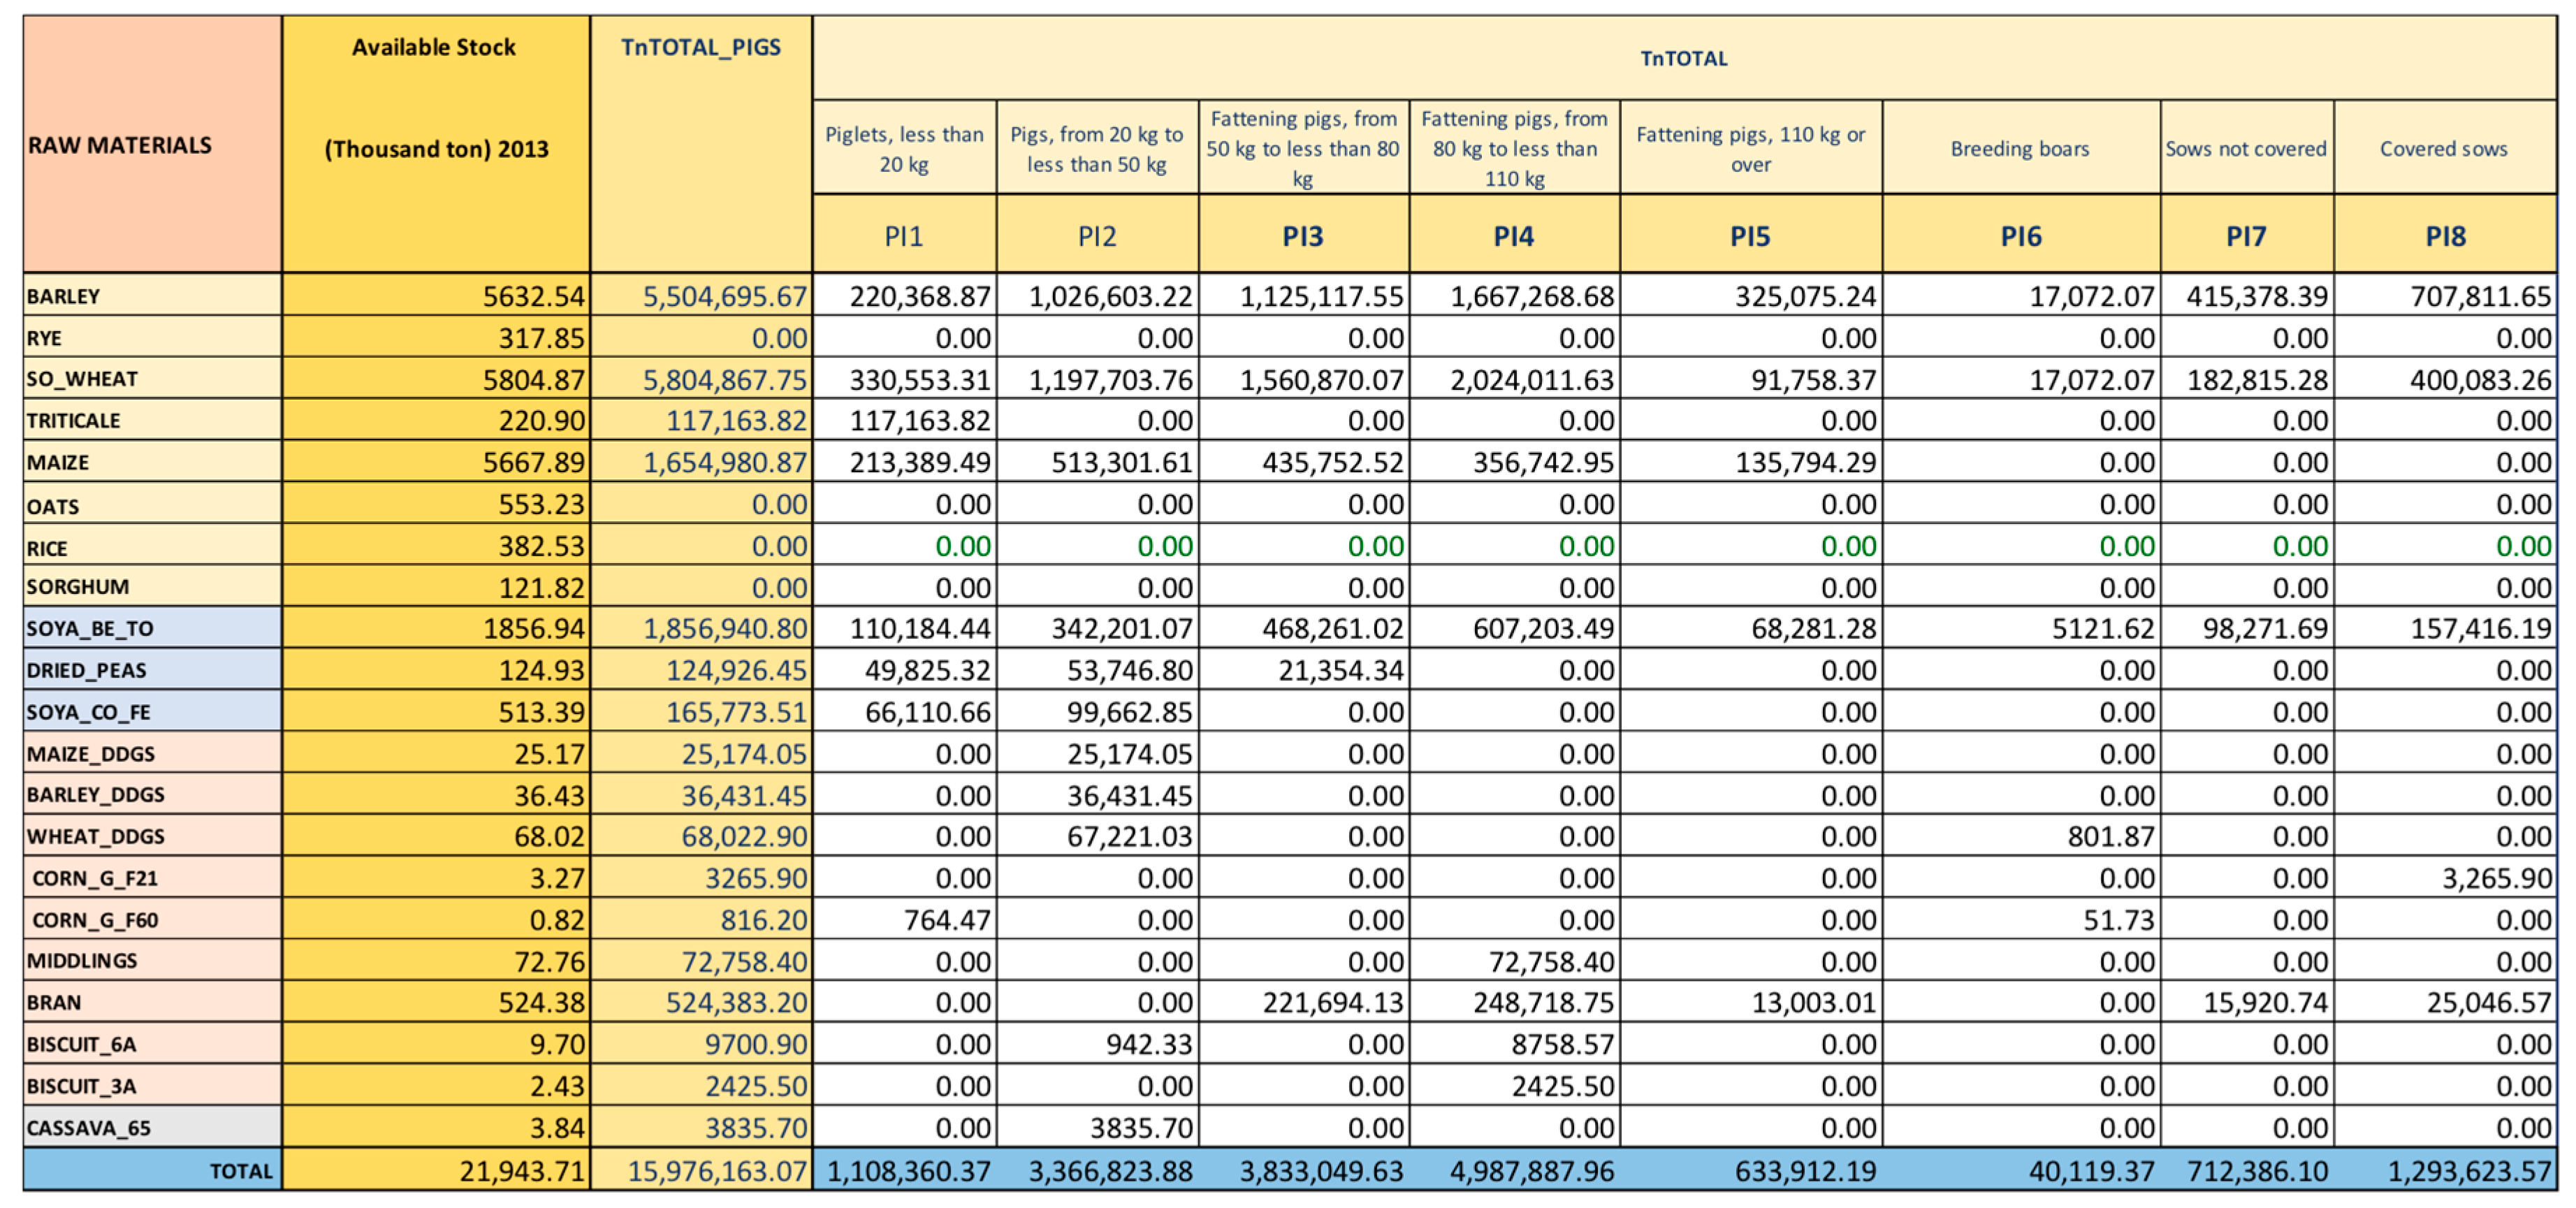
As there is no information about the quantity of raw materials consumed by pigs in Spain, we solved the model for different scenarios, depending on the percentage of the total feed consumed by this species, which varied from 50 to 70%. Logically, the total cost of pig feed increases when the availability of raw materials decreases. Hou et al. [9] estimated that pigs consume 53% of cereals in the European Union. Thus, this research assumes that the pig sector used at most 55% of total raw materials in the country. Figure 6 presents an example of an optimal solution. The optimal solutions obtained for the period from 2008 to 2013 include between 81% and 82% cereals, protein-rich feed represent around 13% and 4–6% are mainly by-products of cereals.
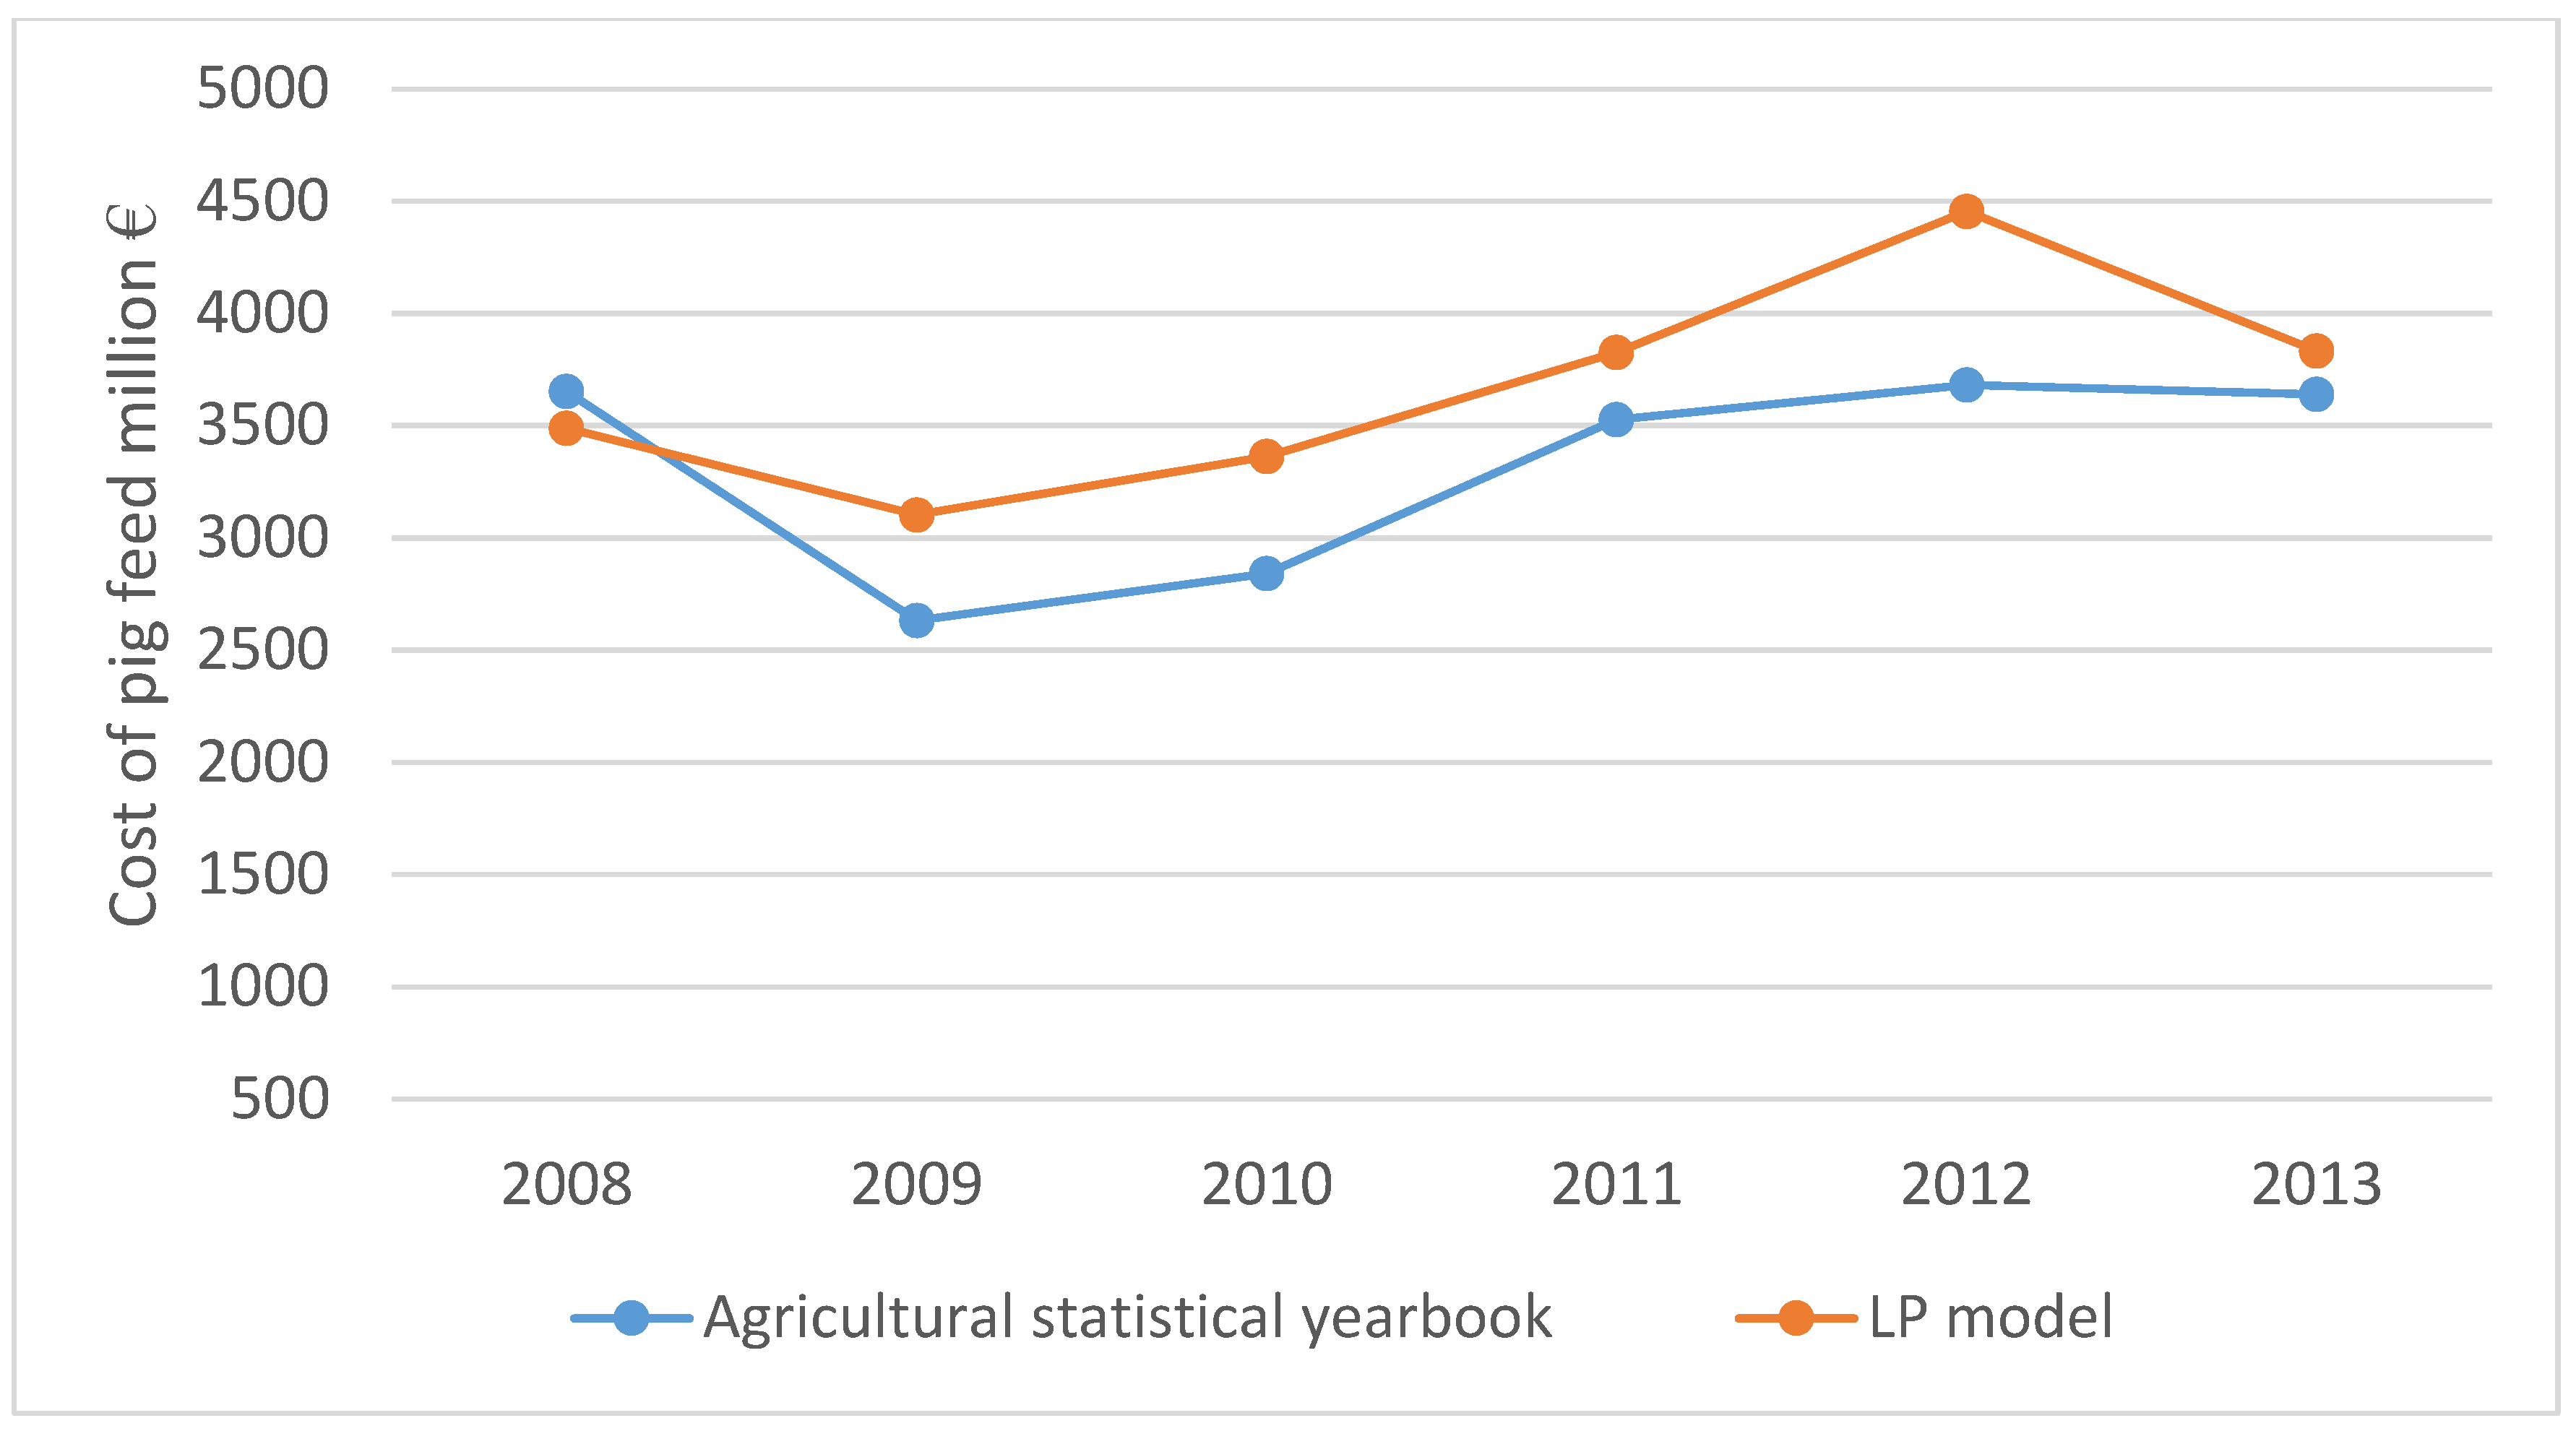
To validate the model the total cost of pig feed obtained by the previously developed linear programming models and the Spanish Agricultural statistical yearbook were compared for the period 2008 to 2013, as is shown in Figure 7. The difference between the total costs of feeding from these two sources varies from 5% to 20%, depending on the year. Thus, the optimization models are a good representation of the real situation considering the variability of prices throughout the year.
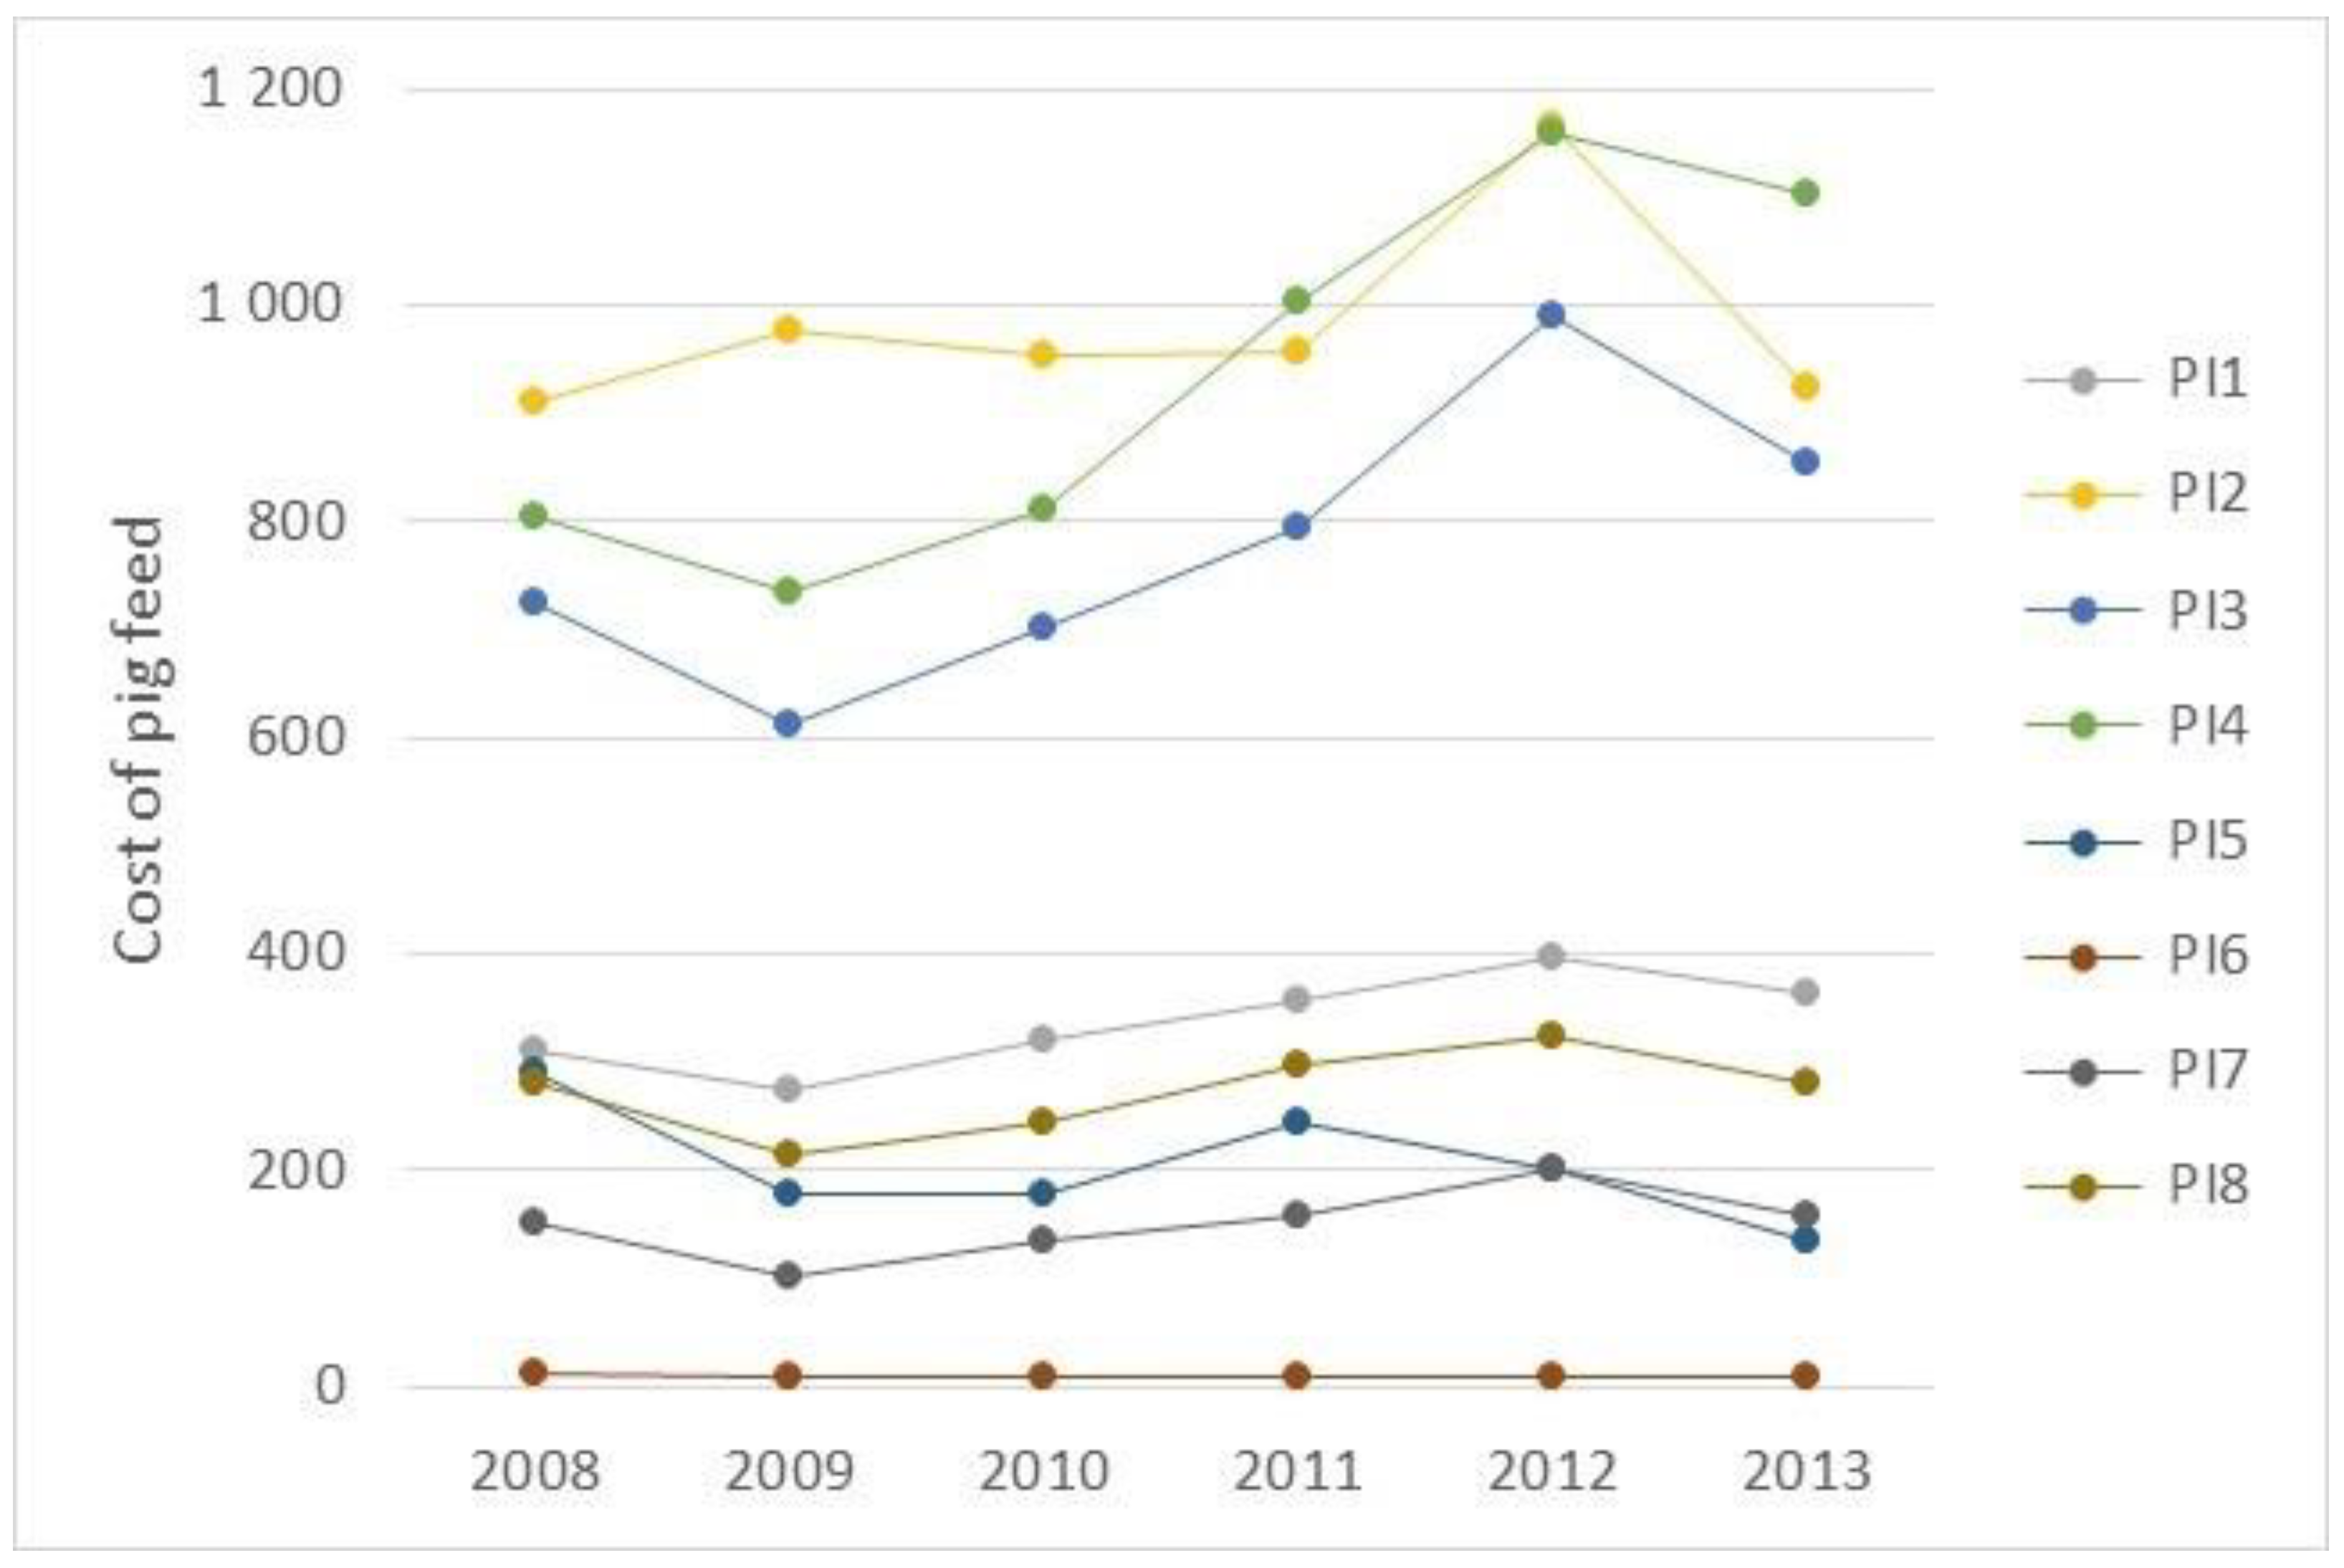
The evolution of the cost of feed from the linear programming models by animal category in the six-year period are presented in Figure 8. This figure highlights that the highest costs are concentrated in three categories, which are pigs from 20 kg to less than 50 kg (PI2) and fattening pigs from 50 kg to less than 110 kg (PI3 and PI4). Considering the stability of the pig population during the period, the lowest cost in 2009 is due to lower prices of raw materials, while the highest cost in 2012 is due to the high prices that year.
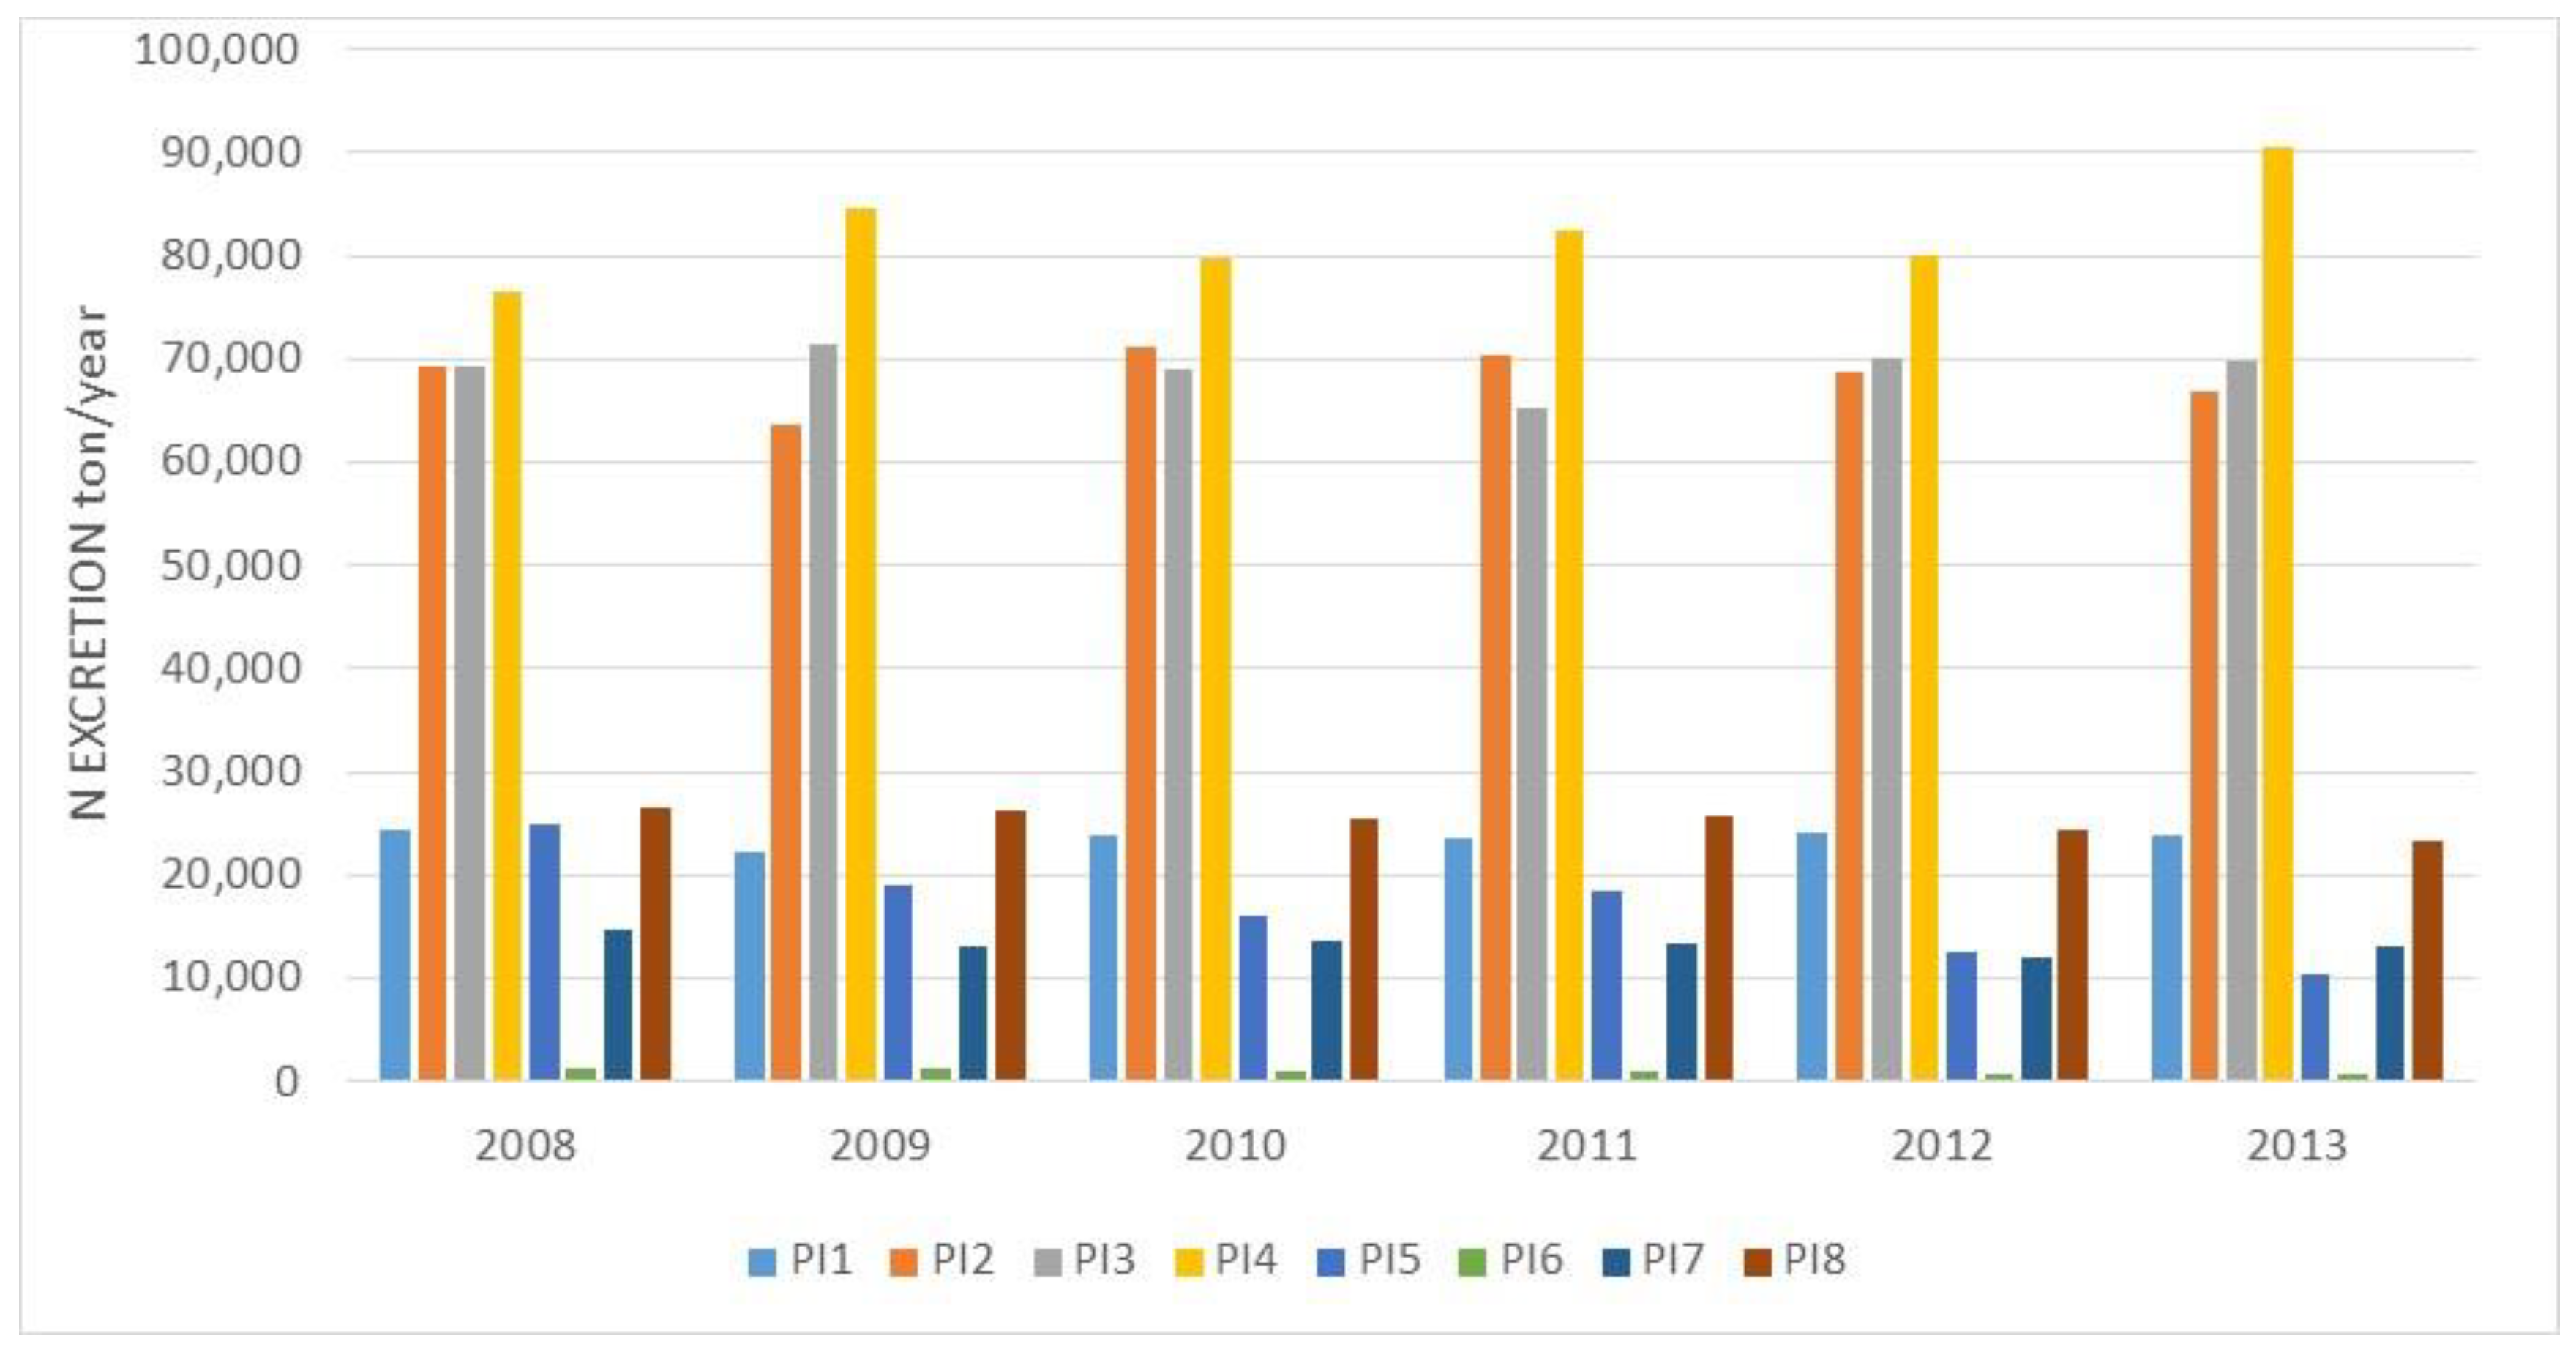
The value of crude protein, measured in kg/head and year, consumed by the pig sector is obtained from the optimal solution of the model for every year from 2008 to 2013. The nitrogen intake and the nitrogen retention are calculated by applying the nitrogen balance approach and finally the nitrogen excretion as the difference between the two. Figure 9 shows this important emission factor for each one of eight pig categories from 2008 to 2013. The three categories PI2, PI3 and PI4 contribute most of the nitrogen excretion and therefore most of the emissions from the pig sector. This is an important result to reduce the impact on environment by modifying animal diets.
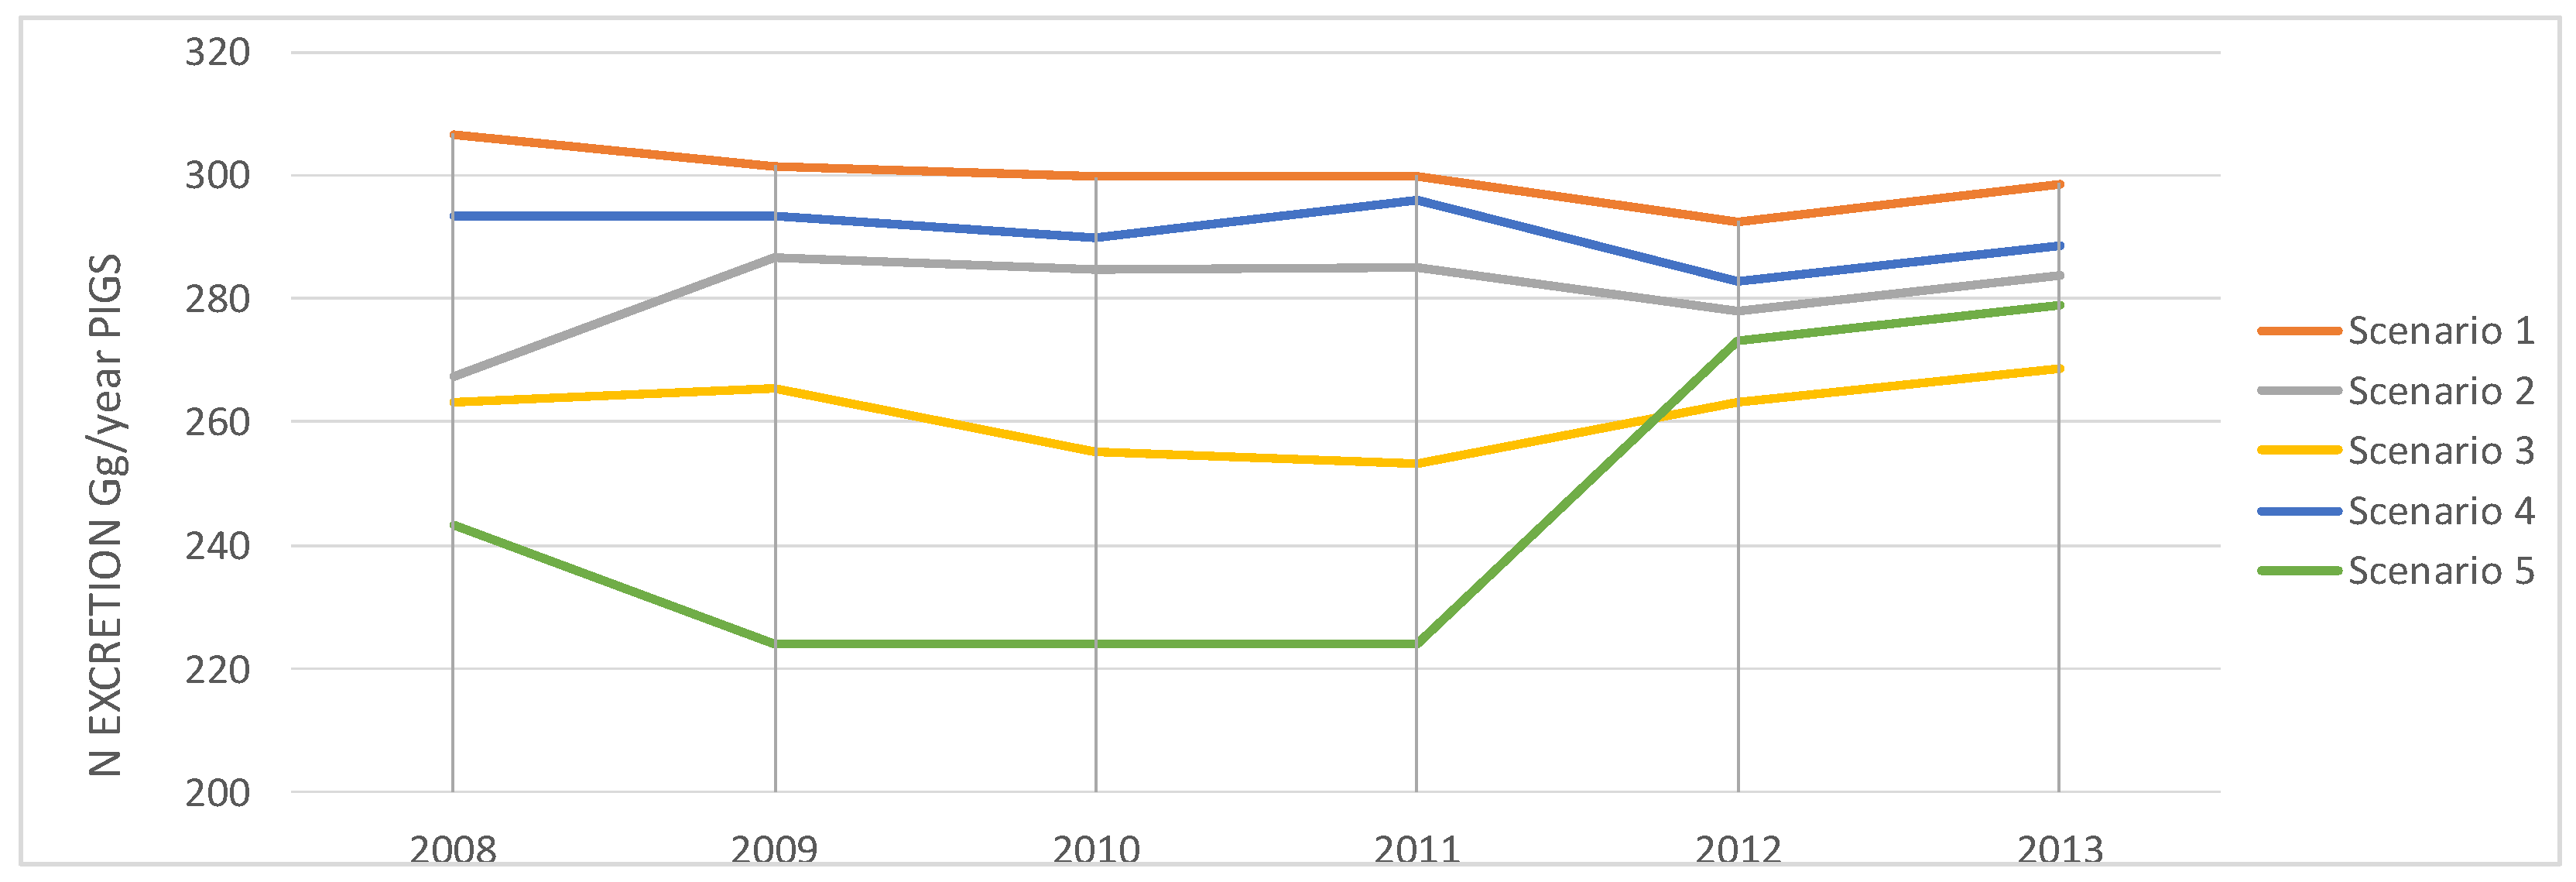
To compare the results from the linear programming models to other methodologies, we have solved the models in different scenarios for the six-year period, whose corresponding nitrogen excretions can be seen in Figure 10.
Scenario 1 shows results obtained by using data from FEDNA tables [20] which are the source of technical coefficients of the models, as well as nutritional recommendations from experts for the Spanish pig sector. Scenario 2 is similar to scenario 1, except the needs of Metabolizable Energy (ME), Net Energy (NE) and Crude Protein (CP), which are 5% less than in scenario 1. In scenario 3 this reduction is 10% with respect to scenario 1.
In scenarios 4 and 5 energy needs are equal to scenario 1, but CP is reduced by 0.5% in scenario 4 and by 1% in scenario 5. For example, if the recommendation for an animal category is 15% of crude protein, then the model is run using 14.5% in scenario 4. This change has the effect of decreasing by approximately 3% the RHS of CP constraints compared to scenario 1. This percentage is around 6–7% less in scenario 5.
In general, nitrogen excretion is quite stable for all scenarios and years of the period. As the most expensive raw materials in the period 2008–2013 are the protein-rich feed, the solutions of the models always have the minimum crude protein, which is directly related to the emission factor (nitrogen excretion). Thus, the least contaminating scenarios are those with less protein, that is, scenarios 3 and 5, as shown in Figure 10. These results are compared with other methodologies as shown in Table 1.
The aggregated linear programming model is compared to other approaches through real data and results obtained from their implementation in the Spanish pig sector for a six-year period is presented in Table 1.
The nitrogen excretion in the Spanish National Inventory, considering the latest calculations, [25], has lower values than those obtained from the linear programming models in scenario 1, but higher than those of scenarios 3 and 5 for the first four years and lower in the last two years of the period. It is interesting to highlight that the conversion ratio between crude protein (CP) and N intake used in the National inventory methodology (CP/6.25) and that of the LP model (CP/5.8) is different in that LP overestimated N excreted when compared to the values from the National inventory. In addition, the methodology used in the National Inventory is based on manure management, while our approach is based on composition of diets at country level, which is in the origin of emissions.
4. Discussion and Conclusions
The proposed linear programming model calculates the feed intake of the pig sector from the following information: Metabolizable and net energy, crude protein and other requirements of pigs established in nutrition tables (FEDNA), available stock and price of raw materials in the country, by using a similar procedure as the market. That is, the assignment of feed consumed to animal categories covers their needs and minimizes the cost considering available raw material in the country. Therefore, the optimization model provides more accurate emission factors than other methodologies. The Spanish national inventory applies “standard diets” based on “expert knowledge”. It is difficult, if not impossible, to check with published articles and statistics whether the “standard diets” are representative of farms in the pig sector. Hou et al. [9] used “average conditions” in the country to establish the requirements of animals, in addition to include all pigs in one category. Thus, the optimization model proposed in this paper provide more accurate emission factors than the two previous methodologies. At the same time, the quality of estimations is improved as the data included are from reliable sources, which can be checked, as indicated by the quality control procedure of national inventories in Europe.
Hou et al. [9] developed a linear programming model for the European Union at country level, which is the only study based on the same idea of estimating emissions from animal diets. Nevertheless, their level of aggregation is very high as all pigs are included in one unique category, although the needs of piglets, fattening pigs and sows are very different. In addition, the raw materials were aggregated into eight categories, of which only three are relevant for the pig sector (cereals, protein-rich feed and brans). Therefore, the data for the technical coefficients, such as the quantity of energy and protein content in raw material are estimated at aggregated level. Considering that Hou et al. [9] considered eight animal categories (dairy cows, other cattle, sheep, pigs, broilers, …) and eight feed classes (protein-rich, cereals, brans, grass, …), the size of the models have a maximum of 64 variables. The number of constraints is 40, due to minimum and maximum requirements of energy and protein, as well as other restrictions related to the fraction in diet from each feed class for all livestock species.
The size of the linear optimization models proposed in this research, mentioned in the results section, is higher, as all usual raw materials for feeding pigs are considered explicitly, as well as the eight pig categories from European statistics. In addition to metabolizable energy, and crude protein, we include other minimum and/or maximum requirements, such as net energy, cereal, protein-rich, brans and other by-products, starch, dry matter, ether extract and calcium. Finally, the main difference between both optimization models is the objective function. We minimize the total cost of pig feed, which is the real situation in practice. Thus, the DSS proposed is a good representation of intensive livestock production, which is based on the market mechanism of minimizing costs and satisfying animal needs. This is not the case in the other proposal, because it minimizes the difference between national feed supply and overall feed requirements by all animal categories in a country, which is equivalent to maximizing feed use, assuming feed surplus has zero or positive value.
Despite differences between both optimization models, scenarios 2, 3 and 5 are closer to the conditions of the methodology used in Hou et al. [9] than scenario 1 because these authors considered that the quantity of energy needed for the pig sector is between 90–110% of the requirements for average conditions. Results from Hou et al. [9] are calculated for a three-year period and are in between those from scenarios 3 and 5 (Table 1). It is interesting to highlight that the model of Hou et al. [9] included a minimum of 5% and a maximum of 40% for protein-rich feed. These values for cereals are 0 for minimum and 85% for maximum. The optimal solutions of our models have 13% of protein-rich feed and 81–82% of cereals.
Livestock production is necessary to provide meat to feed the human population and projections indicate a growing demand in the future. Nevertheless, animal production has an impact on the environment because it is the main source of ammonia and nitrous oxide emissions, as well as other problems due to the over application of livestock manure to land, which could result in leaching of nitrates to groundwater. Thus, it is very relevant to design advanced systems, which do not only use real data to improve estimations of emissions of GHG and other pollutants, but also work as DSS to simulate different scenarios to make better decisions.
This work presents a new approach based on a linear programming model that assists in improving the quality and accuracy of emission factors of pollutants and greenhouse gases of livestock at country level. The model is complete because it considers all significant aspects of the problem and can be included in the Tier 3 methodology of IPCC, as an advanced model to estimate emissions. The model is adaptive and easy to update annually from EUROSTAT and FAO statistics. This approach has been validated by applying it to the Spanish pig sector, which is the main producer in the EU. This model is a balanced proposal, which uses the best technical and statistical data and provides country-specific emission factors by using a common framework for all European countries and worldwide.
Finally, the optimization model provides an approach which is easy to implement for other species (cattle, poultry, …), other countries and at other levels, such as farms. It is a useful tool to study, at low cost, the effects of the diet on pollutants and GHG emissions due to differing aspects, such as changes in the price structure of raw materials, expert nutrition recommendations and agricultural and environmental policies to maintain the sustainability of the food value chain. In future research it would be interesting to apply and validate this approach to other species, such as poultry, and explore additional contributions of goal programming models to reduce emissions from livestock production.
Author Contributions
M.S. designed the model and implemented the code to generate and solve the models, as well as the analysis of results. C.M. supervised the research and carried out model validation, literature review and analysis of results. C.G. has collaborated in carrying out the literature review, data collection and writing-review. Baldomero Segura has focused on the interpretation of data and results of the models.
Funding
This research was funded by the Regional Ministry of Education, Research, Culture and Sport of the Autonomous Government of the Valencian Region, Spain, grant number AICO/2017/066.
Acknowledgments
The authors would like to thank the Regional Ministry of Education, Research, Culture and Sport for funding the research project “Sustainability of the food value chain from production to responsible consumption”. We would also like to thank help received from all experts and participants in the project. We also thank the three reviewers for their suggestions to improve the paper.
Conflicts of Interest
The authors declare no conflict of interest. The funders had no role in the design of the study; in the collection, analyses, or interpretation of data; in the writing of the manuscript, and in the decision to publish the results.
References
- IPCC Climate Change 2013. The Physical Science Basis. Working Group I Contribution to the Fifth Assessment Report of the Intergovernmental Panel on Climate Change (IPCC). 2013. Available online: http://www.climatechange2013.org (accessed on 15 May 2016).
- European Environment Agency. EMEP/EEA Air Pollutant Emission Inventory Guidebook. 2016. Available online: https://www.eea.europa.eu/publications/emep-eea-guidebook-2016 (accessed on 20 May 2016).
- Herrero, M.; Gerber, P.; Vellinga, T.; Garnett, T.; Leipe, A.; Opio, C.; Westhoek, H.J.; Thornton, P.K.; Oleseng, J.; Hutchings, N.; et al. Livestock and greenhouse gas emissions: The importance of getting the numbers right. Anim. Feed Sci. Technol. 2011, 166–167, 779–782. [Google Scholar] [CrossRef]
- European Environment Agency. Analysis of Key Trends and Drivers in Greenhouse Gas Emissions in the EU between 1990 and 2014. EEA Report. Available online: https://www.eea.europa.eu/publications/analysis-of-key-trends-ghg/ (accessed on 20 May 2016).
- Cabaraux, J.F.; Philippe, F.X.; Laitat, M.; Canart, B.; Vandenheede, M.; Nicks, B. Gaseous emissions from weaned pigs raised on different floor systems. Agric. Ecosyst. Environ. 2009, 130, 88–92. [Google Scholar] [CrossRef]
- Lesschen, J.P.; Van den Berg, M.; Westhoek, H.J.; Witzke, H.P.; Oenema, O. Greenhouse gas emission profiles of European livestock sectors. Anim. Feed Sci. Technol. 2011, 166–167, 16–28. [Google Scholar] [CrossRef]
- Wei, S.; Bai, Z.H.; Chadwick, D.; Hou, Y.; Qin, W.; Zhao, Z.Q.; Jiang, R.F.; Ma, L. Greenhouse gas and ammonia emissions and mitigation options from livestock production in peri-urban agriculture: Beijing—A case study. J. Clean. Prod. 2018, 178, 515–525. [Google Scholar] [CrossRef]
- European Environment Agency. European Union Emission Inventory Report 1990–2014 under the UNECE Convention on Long-Range Transboundary Air Pollution (LRTAP). EEA Report. Available online: https://www.eea.europa.eu/publications/annual-eu-emissions-inventory-report (accessed on 20 May 2016).
- Hou, Y.; Bai, Z.; Lesschen, J.P.; Staritsky, I.G.; Sikirica, N.; Ma, L.; Velthof, G.L.; Oenema, O. Feed use and nitrogen excretion of livestock in EU-27. Agric. Ecosyst. Environ. 2016, 218, 232–244. [Google Scholar] [CrossRef]
- Pitesky, M.; Stackhouse, K.; Mitloehner, F. Clearing the air: Livestock’s contribution to climate change. In Advances in Agronomy; Academic Press: Cambridge, MA, USA, 2009; Volume 103, Chapter 1. [Google Scholar]
- Maurer, D.L.; Koziel, J.A.; Kalus, K.; Andersen, D.S.; Opalinski, S. Pilot-Scale Testing of Non-Activated Biochar for Swine Manure Treatment and Mitigation of Ammonia, Hydrogen Sulfide, Odorous Volatile Organic Compounds (VOCs), and Greenhouse Gas Emissions. Sustainability 2017, 9, 929. [Google Scholar] [CrossRef]
- Sajeev, E.P.M.; Amon, B.; Ammon, C.; Zollitsch, W.; Winiwarter, W. Evaluating the potential of dietary crude protein manipulation in reducing ammonia emissions from cattle and pig manure: A meta-analysis. Nutr. Cycl. Agroecosyst. 2018, 110, 161–175. [Google Scholar] [CrossRef]
- Lyng, K.; Bjerkestrand, M.; Stensgård, A.E.; Callewaert, P.; Hanssen, O.J. Optimising Anaerobic Digestion of Manure Resources at a Regional Level. Sustainability 2018, 10, 286. [Google Scholar] [CrossRef]
- Maurer, D.; Koziel, J.A.; Harmon, J.D.; Hoff, S.J.; Rieck-Hinz, A.M.; Andersen, D.S. Summary of performance data for technologies to control gaseous, odor, and particulate emissions from livestock operations: Air Management Practices Assessment Tool (AMPAT). Data Brief 2016, 7, 1413–1429. [Google Scholar] [CrossRef] [PubMed]
- Westhoek, H.; Lesschen, J.P.; Rood, T.; Wagner, S.; De Marco, A.; Murphy-Bokern, D.; Leip, A.; van Grinsven, H.; Sutton, M.A.; Oenema, O. Food choices, health and environment: Effects of cutting Europe’s meat and dairy intake. Glob. Environ. Chang. 2014, 26, 196–205. [Google Scholar] [CrossRef] [Green Version]
- Moraes, L.E.; Fadel, J.G.; Castillo, A.R.; Casper, D.P.; Tricarico, J.M.; Kebrea, E. Modeling the trade-off between diet costs and methane emissions: A goal programming approach. J. Dairy Sci. 2015, 98, 5557–5571. [Google Scholar] [CrossRef] [PubMed]
- Maroto, C.; Fernández, C.; Segura, B.; García-Rebollar, P.; Alcaraz, J.; Torres, A. A new methodology to estimate the emissions of pollutant gases of Spanish livestock: An aggregate Linear Programming model. In Proceedings of the 23rd European Conference on Operational Research, Bonn, Germany, 5–8 July 2009. [Google Scholar]
- Segura, B.; Maroto, C.; Torres, A. An Optimization Model to Estimate the Emissions of Pollutant Gases of Spanish Livestock. In Proceedings of the ALIO-INFORMS Joint International Meeting, Buenos Aires, Argentina, 6–9 June 2010. [Google Scholar]
- Velthof, G.L.; Hou, Y.; Oenema, O. Nitrogen excretion factors of livestock in the European Union: A review. J. Sci. Food Agric. 2015, 95, 3004–3014. [Google Scholar] [CrossRef] [PubMed]
- FEDNA. Available online: http://fundacionfedna.org/tablas-fedna-composicion-alimentos-valor-nutritivo (accessed on 16 May 2016).
- Food and Agriculture Organization Corporate Statistical Database (FAOSTAT). Available online: http://www.fao.org/faostat/en/#country/203 (accessed on 18 June 2017).
- EUROSTAT. Available online: http://ec.europa.eu/eurostat/data/database (accessed on 14 June 2017).
- LINDO Sytems. Available online: https://lindo.com/index.php/products/lingo-and-optimization-modeling (accessed on 10 July 2017).
- Anuario de Estadística Agraria. 2016. Available online: http://www.mapama.gob.es/es/estadistica/temas/publicaciones/anuario-de-estadistica/2016/default.aspx?parte=3&capitulo=15&grupo=4 (accessed on 15 May 2016).
- MAPAMA. Inventario Nacional de Emisiones de Gases De Efecto Invernadero 1990–2016. Available online: http://www.mapama.gob.es/es/calidad-y-evaluacion-ambiental/temas/sistema-espanol-de-inventario-sei-/ (accessed on 2 April 2018).
Figure 1.
The diet problem for livestock: Linear Programing model and nitrogen excretion.

Figure 2.
Decision Support System to determine nitrogen excretion from livestock production.

Figure 3.
Partial code to generate models: sets, import data and export solution to Excel.

Figure 4.
Partial code to generate models: objective function, constraints and upper bounds.

Figure 5.
Partial overview of data file. Available stock of raw material is equal to production plus imports minus exports (Thousands of ton).
Figure 5.
Partial overview of data file. Available stock of raw material is equal to production plus imports minus exports (Thousands of ton).

Figure 6.
Values of the variables in the optimal solution for pig categories in 2013. Available stock of raw material is equal to production plus imports minus exports (Thousands of ton).
Figure 6.
Values of the variables in the optimal solution for pig categories in 2013. Available stock of raw material is equal to production plus imports minus exports (Thousands of ton).

Figure 7.
Annual cost of pig feed comparing the linear programming models and the Agricultural Statistical Yearbook in million € [24].
Figure 7.
Annual cost of pig feed comparing the linear programming models and the Agricultural Statistical Yearbook in million € [24].

Figure 8.
Annual cost of feed in million € obtained from linear programming models by animal category in the pig sector. PI1: Piglets less than 20 kg, PI2: Pigs from 20 kg to less than 50 kg, PI3: Fattening pigs from 50 kg to less than 80 kg, PI4: Fattening pigs from 80 kg to less than 110 kg, PI5: Fattening pigs 110 kg or over, PI6: Breeding boars, PI7: Sows not covered, PI8: Covered sows.

Figure 9.
Nitrogen excretion by pig category in ton/year from 2008 to 2013. PI1: Piglets less than 20 kg, PI2: Pigs from 20 kg to less than 50 kg, PI3: Fattening pigs from 50 kg to less than 80 kg, PI4: Fattening pigs from 80 kg to less than 110 kg, PI5: Fattening pigs 110 kg or over, PI6: Breeding boars, PI7: Sows not covered, PI8: Covered sows.

Figure 10.
Nitrogen excretion of pigs by scenario in Gg/year. FEDNA: Fundación Española para el Desarrollo de la Nutrición Animal (Spanish country-specific data and recommendations); Scenario 2 = Metabolizable energy, net energy and crude protein 5% less; Scenario 3 = Metabolizable energy, net energy and crude protein 10% less; Scenario 4 = Crude protein 0.5% less. Scenario 5 = Crude protein 1% less.


Table 1.
Nitrogen excretion from Spanish pig sector: comparison to other approaches.
| PIGS | 2008 | 2009 | 2010 | 2011 | 2012 | 2013 |
|---|---|---|---|---|---|---|
| Population pigs thousand head | 26,289.62 | 25,342.62 | 25,704.04 | 25,634.86 | 25,250.37 | 25,494.71 |
| Nmodel LP Gg/year (FEDNA 2013) (scenario 1) 1 | 306.65 | 301.58 | 299.82 | 299.97 | 292.54 | 298.61 |
| Nmodel LP Gg/year/(scenario 2) 2 | 267.41 | 286.50 | 284.82 | 284.97 | 277.91 | 283.68 |
| Nmodel LP Gg/year/(scenario 3) 3 | 263.15 | 265.33 | 255.17 | 253.31 | 263.28 | 268.75 |
| Nmodel LP Gg/year/(scenario 4) 4 | 293.42 | 293.27 | 289.93 | 295.89 | 282.85 | 288.72 |
| Nmodel LP Gg/year/(scenario 5) 5 | 243.38 | 224.06 | 223.93 | 223.93 | 273.16 | 278.83 |
| National Inventory (Spain) | 280.58 | 270.50 | 257.29 | 258.68 | 254.81 | 257.20 |
| N Hou et al. 2016 Gg/year | 239.05 | |||||
| CAPRI 6 (2004) Gg/year (Velthof et al., 2015) | 460.07 | 443.50 | 449.82 | 448.61 | 441.88 | 446.16 |
1 FEDNA: Fundación Española para el Desarrollo de la Nutrición Animal (Spanish country-specific data and recommendations); 2 Scenario 2 = Metabolizable energy, net energy and crude protein 5% less; 3 Scenario 3 = Metabolizable energy, net energy and crude protein 10% less; 4 Scenario 4 = Crude protein 0.5% less. 5 Scenario 5 = Crude protein 1% less; 6 CAPRI: Common Agricultural Policy Regionalized Impact.
© 2018 by the authors. Licensee MDPI, Basel, Switzerland. This article is an open access article distributed under the terms and conditions of the Creative Commons Attribution (CC BY) license (http://creativecommons.org/licenses/by/4.0/).
Share and Cite
MDPI and ACS Style
Segura, M.; Maroto, C.; Ginestar, C.; Segura, B. Optimization Models to Improve Estimations and Reduce Nitrogen Excretion from Livestock Production. Sustainability 2018, 10, 2362. https://doi.org/10.3390/su10072362
AMA Style
Segura M, Maroto C, Ginestar C, Segura B. Optimization Models to Improve Estimations and Reduce Nitrogen Excretion from Livestock Production. Sustainability. 2018; 10(7):2362. https://doi.org/10.3390/su10072362
Chicago/Turabian StyleSegura, Marina, Concepción Maroto, Concepción Ginestar, and Baldomero Segura. 2018. "Optimization Models to Improve Estimations and Reduce Nitrogen Excretion from Livestock Production" Sustainability 10, no. 7: 2362. https://doi.org/10.3390/su10072362
Note that from the first issue of 2016, this journal uses article numbers instead of page numbers. See further details here.