1. Introduction
Over the last two decades, one can observe an increasing interest in green materials, technologies, and services. This is caused partially due to the depletion of natural resources as well as the steadily increasing environmental responsibility and awareness of climate change. Raw chemicals coming from oil feedstock are steadily being replaced with sustainable ones in order to reduce the carbon footprints and ecological human imprints on the environment. These chemicals and their derived materials are often bio-sourced, coming from industrial crops and products. The use of thermoplastic polymers formulated from corn starches is a typical example of this [
1].
Another approach to sustainable materials development is to use agro-waste coming from the cultivation of, e.g., cereal crops. Currently, the most important cereal crop in Europe is common wheat (
Triticum Aestivum), which is cultivated for its starchy grains and used as food. By-products, namely, chaffs and straws, are mainly used to feed animals, fertilize soils, and produce heat energy from combustion. In terms of the carbon footprint, burning cereal waste such as wheat chaff makes no sense. Furthermore, cereal agro-wastes are difficult to pelletize due to their low-lignin and high-extractives content [
2].
The annual global harvest of wheat is about 755 million tons, which represents about 29.4% of the total grain seed production [
3]. The total wheat harvest in the European Union (EU) is 134.5 million tons, which represents about 44.7% of total the EU grain seed production [
4].
About 20% of wheat agro-waste is chaff [
5], suggesting that approximately 30 million tons of wheat chaff are produced annually in the European Union, which represents 1.5 times the wood volume needed to produce particle boards in the European Union [
6]).
Apart from energy consumption in transportation, most of the energy produced by modern Western society is consumed in building heating and ventilation systems (almost one-half and one-third of the contribution to CO
2 emissions [
7]). It has to be taken into account that the overall energy consumption of a building is not only the energy used for its functioning. Energy embodied in the building materials during their manufacturing process, installation, and end-of-life disposal has to be considered as well. Therefore, when it comes to thermal insulation materials, there are two aspects of possible energy savings-functional (energy saved because of the thermal performance of the insulation) and embodied (energy consumed in production, installation, and disposal of such insulation). Therefore, the opportunity for agro-wastes to be used as thermal insulation in sustainable building construction is straightforward.
For a material to qualify as a building thermal insulation, low density, high specific heat capacity and low thermal conductivity are usually required. To be more specific, a thermal conductivity of <0.1 W m
−1 K
−1 is required for a material to qualify as a building thermal insulation [
8].
The current approach to thermal-energy-loss calculations is through simplified mathematical models of the building envelope behavior. These models are mainly based on the knowledge of a single thermophysical parameter–the thermal conductivity (λ in W m−1 K−1) of individual materials. More and more researchers are nowadays coming up with studies discussing the reliability of the present state of the art, many of them offering software algorithms for calculations of heat losses based on multiparametric mathematical models. One can doubt the current legacy and technical standards based on simplified models of thermal performance and real behavior of building systems in continually changing climatic conditions after comparing the calculations of energy loss based on different mathematical models. In other words, these models assume a four-season climate, typically with cold winters and hot summers, while the climate is changing and the differences between the seasons are less pronounced.
So far, straw bales [
9], wooden products [
10], bamboo [
11], and other materials sourced from industrial crops, such as corn cobs [
12], sunflower stalks [
13], cotton stalks [
14], hemp fibers [
15], or less common fibers such as Ichu fibers [
16] have been used as thermal insulation in building construction.
Thermal conductivity, specific heat capacity, and density are fundamental thermophysical parameters used to characterize the thermal behavior of insulation materials. They are connected through the following equation:
Unlike artificial materials, bio-based cellulosic materials show relatively high density and specific heat capacity which might be beneficial for heat accumulation to compensate sudden temperature fluctuations and to keep the indoor building environment at a constant temperature.
The specific heat capacities and thermal conductivities of some of the recently examined unconventional bio-sourced and bio-based materials are summarized in a review by Asdrubali et al. [
7]. The thermal conductivities (W m
−1 K
−1) of bagasse (0.046–0.055), kenaf (0.034–0.043) and pineapple-leaf fibers (0.035–0.042) are very close to those of traditional insulation materials such as mineral wool (0.033–0.040) or expanded polystyrene (0.031–0.038). Most of the other unconventional materials showed thermal conductivities less than 0.1 W m
−1 K
−1, the highest one being the thermal conductivity of banana and polypropylene (PP) commingled yarn (0.157–0.182). Due to their anatomical structure, the heat capacities and thermal conductivities of these materials depend strongly on the sample orientation towards the heat flow from the source. Unlike conventional thermal insulation materials, they are anisotropic; for example straw bales show the thermal conductivities of 0.045–0.056 W m
−1 K
−1 and 0.056–0.08 W m
−1 K
−1 in perpendicular and parallel direction, respectively [
17].
Thermal performance of complex heterogeneous structural elements composed of various materials is usually determined in a hot box apparatus. A hot box consists of two closed rooms, each room is kept at a constant but different temperature. The specimen to be tested is placed in between the so-called hot and cold chambers of the box. Because of the temperature gradient, heat flow between the two rooms through the specimen is measured and the thermal resistance of the structure is determined [
18]. Depending on the structural complexity and the material heterogeneity of the tested elements, thermal bridges due to joints have to be considered and evaluated in the calculations [
19,
20].
In spite of the advantages of unconventional plant agrowaste thermal insulation, such as low price, low energy consumption in production and during in-site mounting, simple and ecological end-of-life disposal, and local economy benefits owing to the use of local resources and do-it-yourself affordable housing projects, the application of agrowaste insulation in the building industry is still less popular than the use of manmade materials.
There is quite a contradiction in the implementation of unconventional construction materials. On the one hand, materials of a bio-based origins bring all the benefits for a sustainable future; on the other hand, materials of such an origin are a source of material property variability due to variable plant growth in variable climate and soil conditions. Therefore, technical standardization, quality control, and mass production are difficult, perhaps leading to certain caution or a lack of confidence of the developers, builders, and, consequently, investors. However, this is little discomfort compared to the long-term performance of bio-based materials and their environmental benefits, especially when considering the EU Directives 2010/31/EU [
21] and 2012/27/EU [
22] that aim for considerable energy-consumption reduction of the building industry in the very near future. For this reason, any research focused on testing real-size sustainable demonstrator samples is important as it can convince builders and investors to make greater use of such energy-saving renewable materials.
As a contribution to this development, a thermal insulation panel from agricultural waste was developed. The panel consisted of a medium-density fiberboard (MDF) envelope reinforced with wood scantlings (shell) which was filled with loosely laid dried wheat chaff (core). The steady-state thermal properties such as thermal transmittance and thermal conductivity were measured in a hot box. Furthermore, the structure was subjected to dynamic thermal loading which was designed to simulate typical winter weather conditions in Central Europe. Specifically, the thermal performance in the range of +6 °C to −13 °C was found.
2. Materials and Experimental Methods
This section starts with a description of the experimental methods used to characterize wheat chaff as an insulation filler of the panel. It continues with a description of the insulation panel composition and structure. A modified guarded hot box method was used to determine the thermal transmittance of the panel in steady-state conditions. The panel was further subjected to dynamic thermal loading and its overall thermal performance was compared to a rock-wool insulation panel.
2.1. Wheat Chaff Characterization
2.1.1. Relative Humidity
In order to determine the moisture content (relative humidity), the weight ratio between the wet (as received,
wm) and the dried samples (
wd, 105 °C ± 2 °C for 6 h) was determined:
The moisture content was determined on 10 100-g samples.
2.1.2. Fraction Distribution
Three random samples of approximately 100 g of wheat chaffs were collected and their fractions were verified based on sieve analysis using a screening machine with a metal mesh set in accordance with ISO 3310-1 [
23].
2.1.3. Scanning Electron Microscopy (SEM)
Samples were gold sputtered and inspected under a scanning electron microscope (SEM) (Tescan Orsay Mira 3). A low accelerating voltage of 15 kV was used to limit the loss of surface detail in the micrographs resulting from excessive depth of penetration of the electron beam within the samples.
2.1.4. Specific Heat Capacity
The measurement of heat capacity was carried out on a Mettler-Toledo Star 1 differential scanning calorimeter (DSC) at a heating rate of 5 °C/min. Three runs were carried out, one with empty reference and empty sample pans to correct for asymmetry of the DSC, one with an empty reference pan and a pan filled with indium for calibration, and one with an empty pan and a pan filled with the sample. After the steady state was obtained, the heat capacity was determined from the heat flux difference from the following equation:
where
Φ = dQ/dt is the heat flow rate in W;
cP is the specific heat capacity at constant pressure in kJ kg
−1 K
−1;
m is the weight in kg; subscripts
sp-r,
c-r and
b-r are the mean sample, calibration, and blank run, respectively; and superscripts
sp and
cal are the mean sample and calibration with indium, respectively.
Samples of up to 10 mg were used and sealed in 20 µL aluminum crucibles, and a nitrogen flow of 25 mL/min was maintained throughout the test. Prior to measurements, the DSC oven was burnt out for 10 min at 600 °C/air flow to remove volatile impurities. Measurements were performed at a temperature range of 5–40 °C and the heat capacity was determined as a function of temperature. The heat capacity data were collected from a second heating run after controlled cooling. The wheat chaff samples were used as a powder or compact anatomical structure.
2.1.5. Panel Response Time Constant
Before the dynamic wall test, the response time
τs (h) was calculated to estimate the duration of the test. A simplified method according to ASTM C1363-97 [
24] was used:
where
C is the heat capacity of the panel per unit of transverse area (kJ m
−2 K
−1) and
Rt is the total thermal resistance of the panel (m
2 K W
−1). The heat capacity and thermal resistance of the panel components were taken from DSC measurements and from a steady-state test. The calculation took into account the density and morphology of the wheat chaffs, as well as their orientation and volume fraction in the panel. The response time
τs of the thermal impulse design was used to define the dynamic thermal load time and to ensure a uniform heat flow across the tested panel for measuring thermal transmittance. The heat capacity of the panel per unit of transverse area was calculated using the following relationship:
where
c is the measured specific heat capacity (J kg
−1 K
−1),
ρ is the density (kg m
−3) and
d is the thickness of the panel (m).
2.2. Insulation Panel Composition and Structure
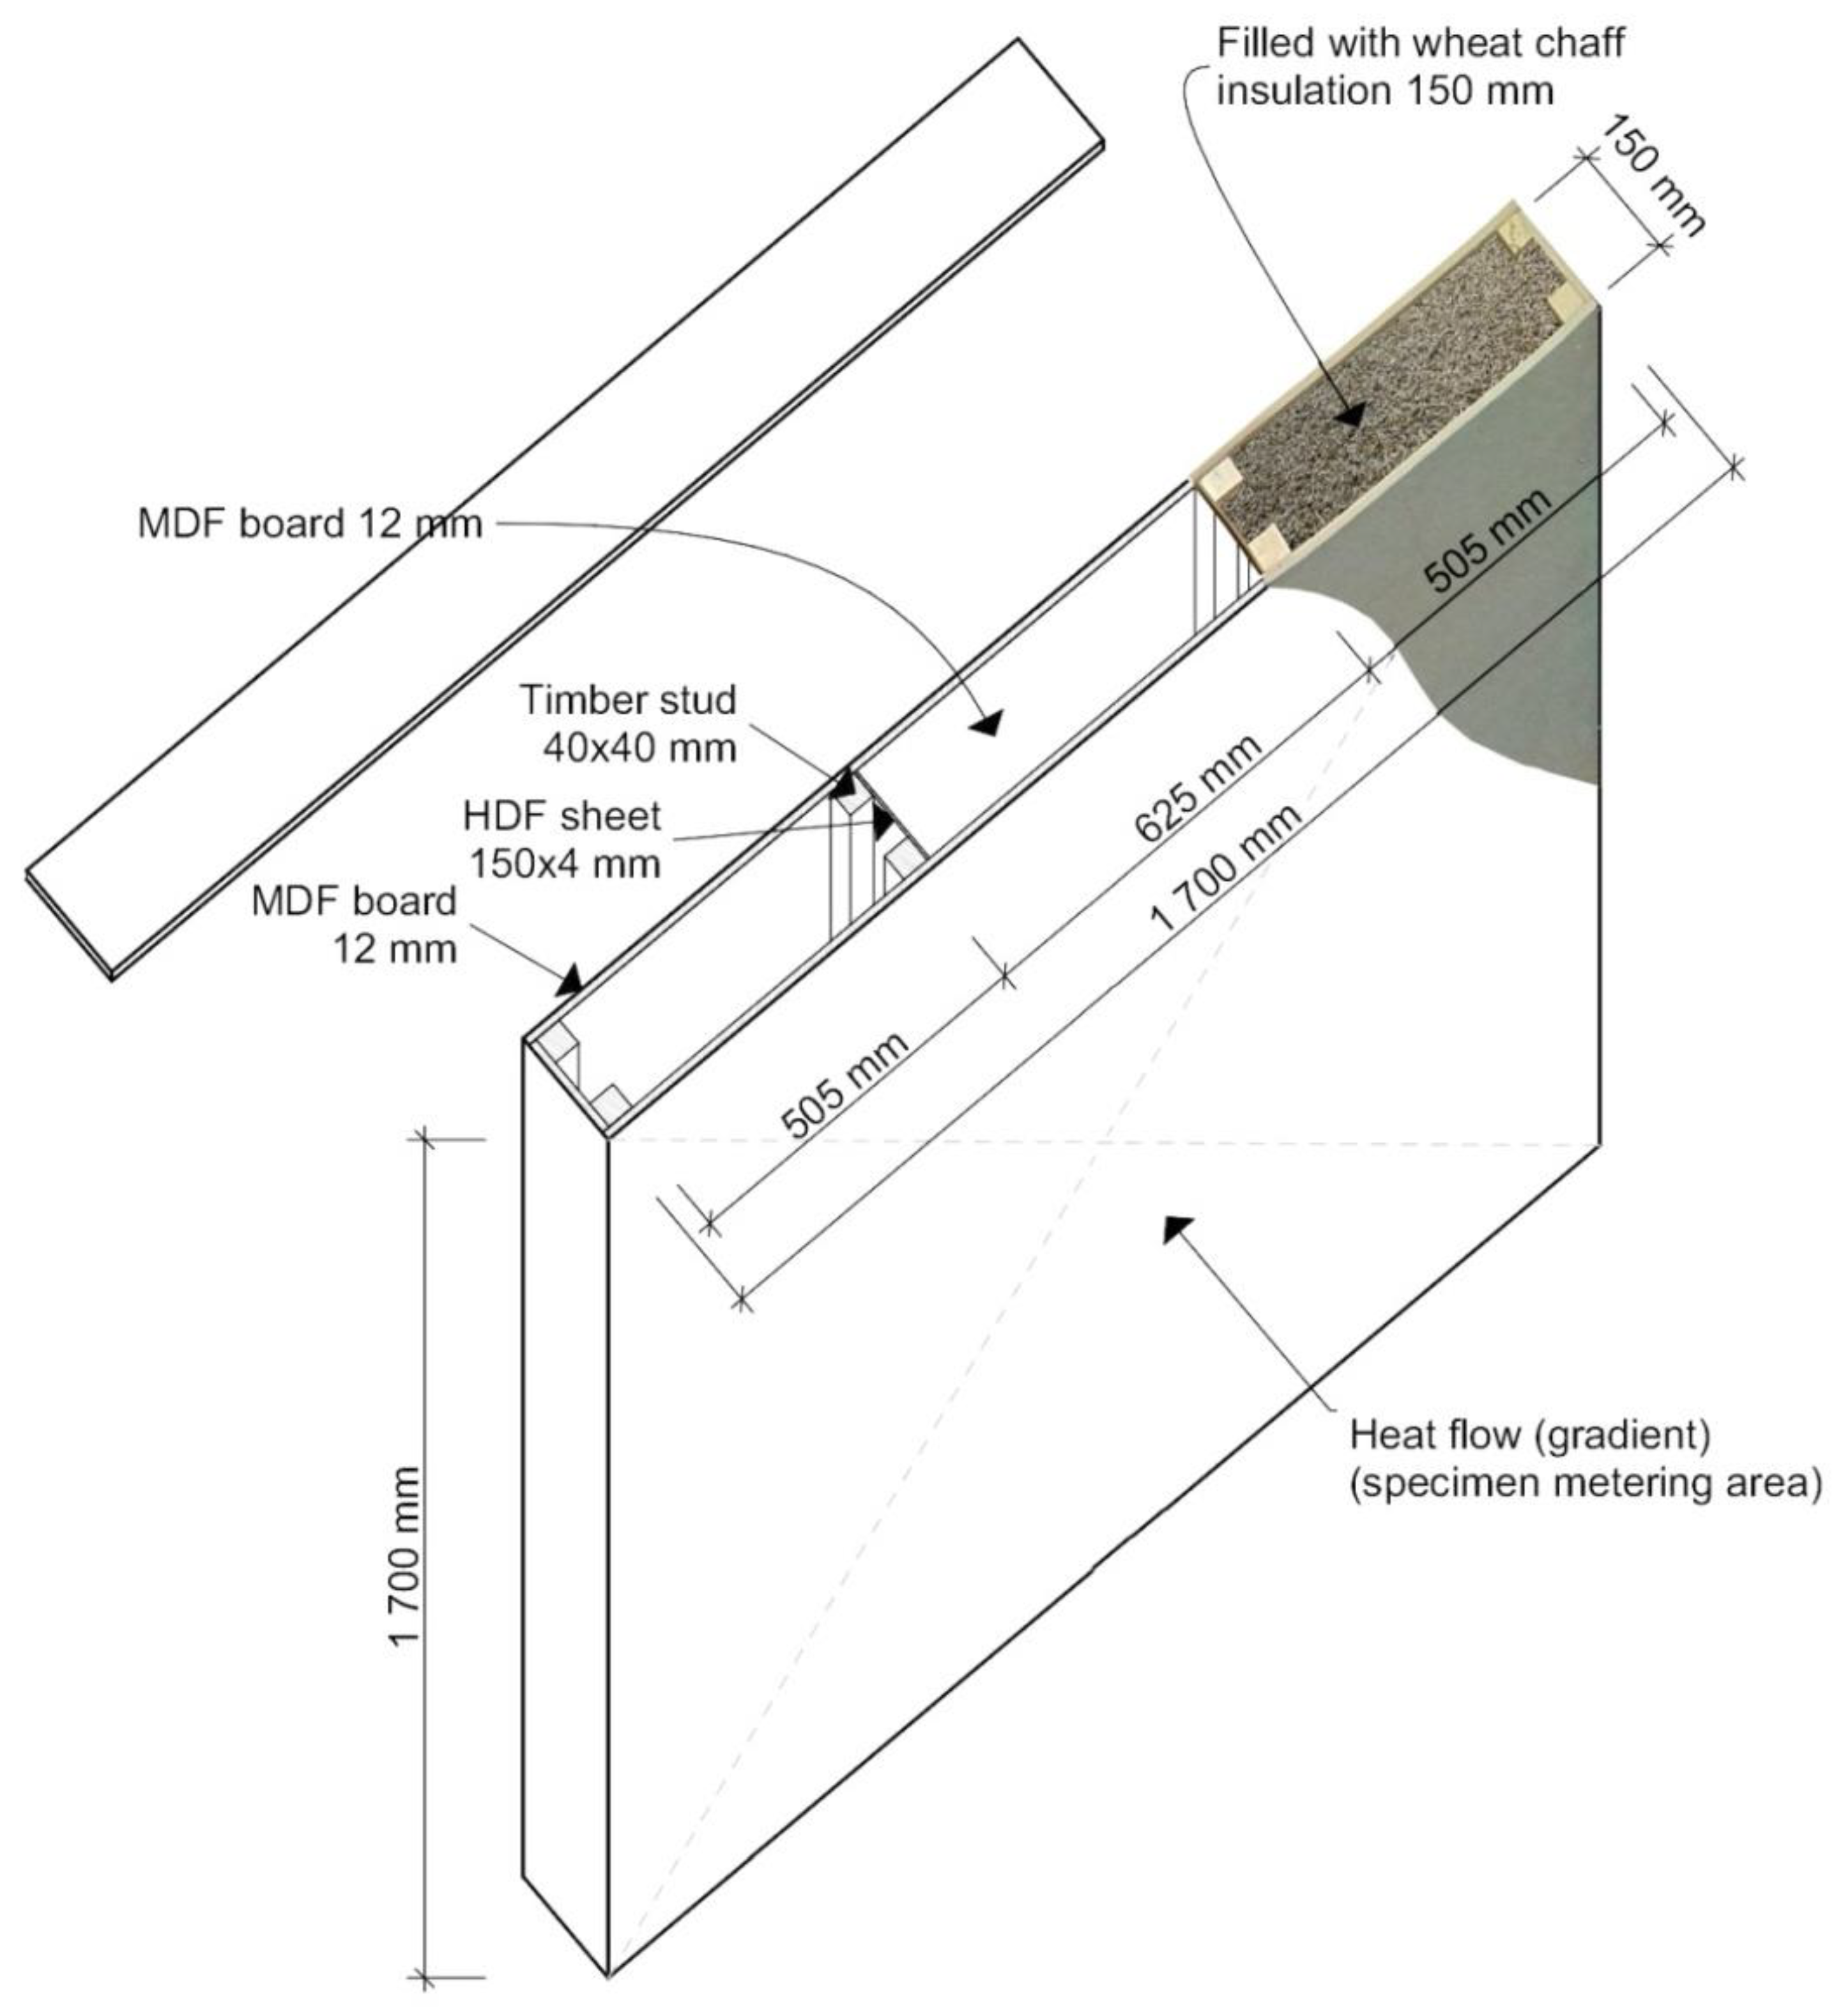
A sandwich panel (outer dimensions of 1700 × 1700 × 174 mm—length × height × width), consisting of an MDF envelope and a wheat chaff insulation core, was manufactured (
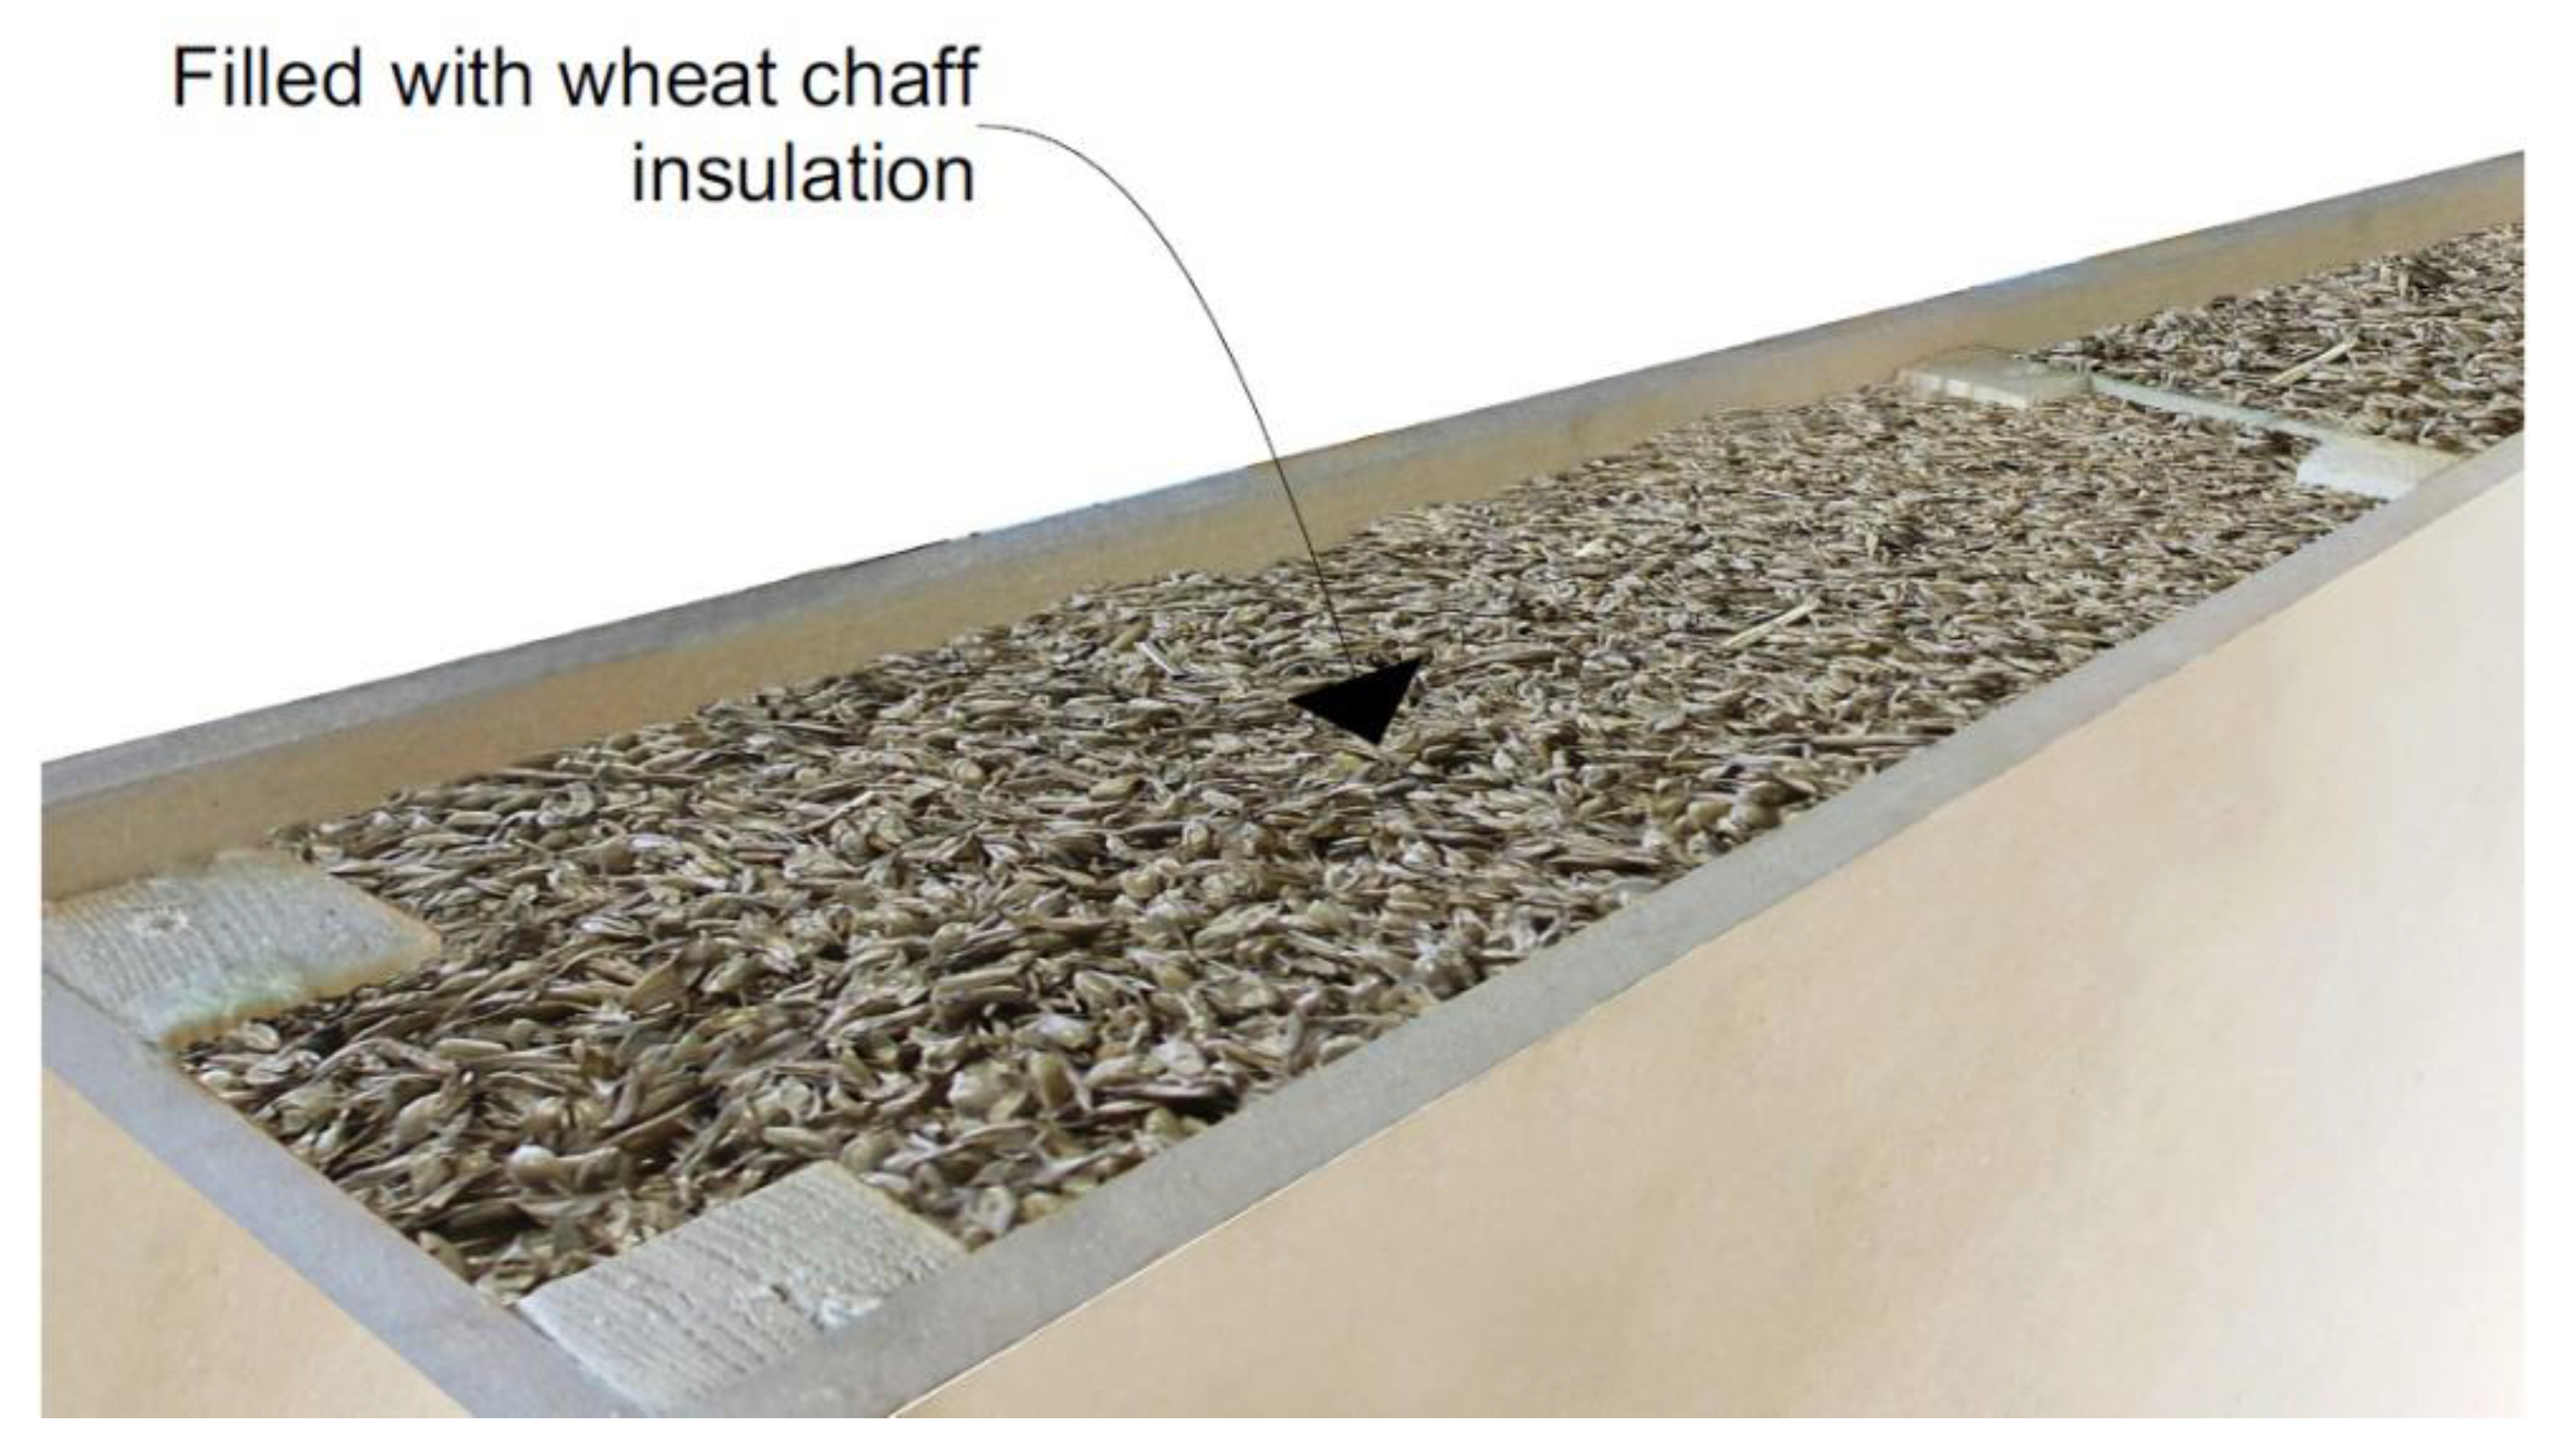
Figure 1). The inner cavity of the panel was filled with thermal insulation of wheat chaff, loosely laid and randomly horizontally oriented (
Figure 2). Because the thermal insulation loosely filled the cavity and no binder was used, upper and bottom MDF lids were used to seal the panel, slightly pressing the insulation filler.
The envelope MDF boards (Egger CZ Ltd., Hradec Králové, Czech Republic) of 12-mm thickness were chosen because of their cross-section homogeneity and, therefore, homogeneous thermal conductivity (0.14 W m−1 K−1). For the reason of structural stability, the inner cavity of the panel was divided into three compartments separated by studs composed of 1700 × 40 × 40 mm pine wood scantlings and high-density fiberboard (HDF) of 4-mm thickness and thermal conductivity of 0.17 W m−1 K−1. All the wooden, MDF, and HDF components of the panel were screwed together with 1.5 × 15 mm screws.
2.3. Hot Box Design (Modified Guarded Hot Box)
Thermal energy performance of the tested samples in steady-state and dynamic conditions was determined in the modified guarded hot box. The guarded hot box method according to EN ISO 8990 [
25] was used and modified. Several modifications were made to the hot box to reduce thermal losses through its envelope. The box consisted of two chambers, the cold chamber with the cooling system to maintain a low (thus cold) temperature, and a hot chamber to maintain a high (thus hot) temperature. Both chambers were separated by the sample.
Figure 3 shows the difference between a guarded hot box, as designed by the appropriate standard, and the modified hot box used in the experiments. The box was placed in a laboratory with HVAC-controlled temperature and humidity. The temperature on the hot side of the measuring box was always set to be the same as the ambient temperature (24 °C), leading to the elimination of the overall system heat losses (refer to
Figure 3, heat flow φ
3) and the 3D heat dissipation through the sample (refer to
Figure 3, heat flow φ
2).
Strictly speaking, this box is modified, i.e., the entire hot part is protected as the temperatures in the room and the hot chamber are the same. Therefore, there is no need to use a separate metering chamber and it is possible to neglect three-dimensional heat propagation within the sample panel (φ2).
Figure 4 shows the outline of the modified hot box together with the position of the sample. At the beginning of the experiment, the hot chamber was opened and the sample was positioned in the box as a “septum”. A temperature difference between the chambers established a heat flow through the wall (φ
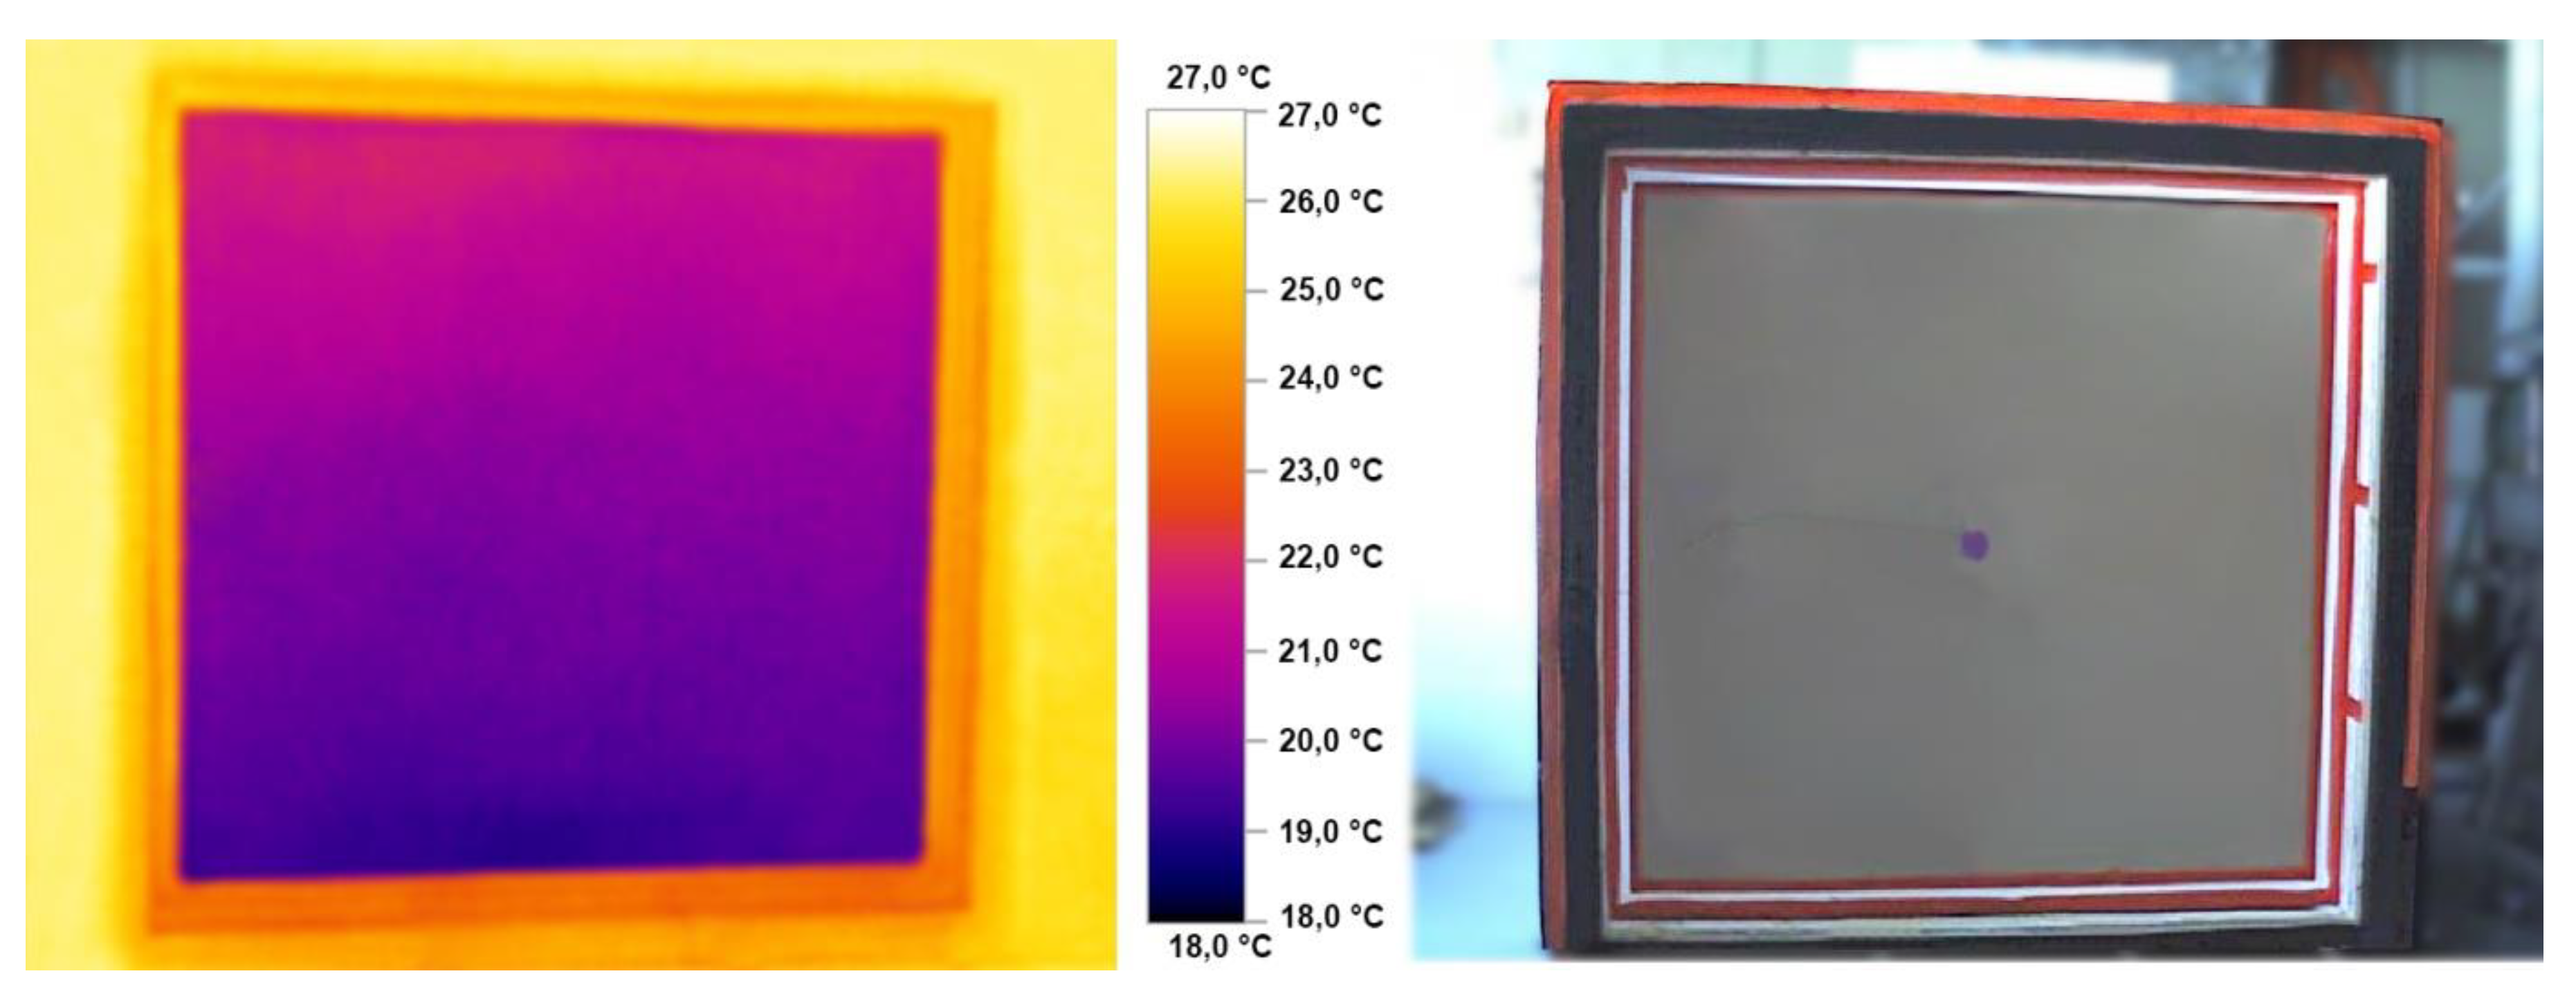
1). A gap between the panel and the box was filled with an additional mineral wool insulation and the whole panel/box wall perimeter was sealed with an airtight tape, making thermal losses negligible. The heat and airtightness quality was checked with a thermal camera after 12 h of conditioning the sample. The panel to be tested was placed in the hot box with the hot chamber left open and kept at room temperature (which was HVAC controlled). The heat flow across the test panel was established through a temperature difference between the hot box chambers: the cold one was maintained at 6 °C and the hot one was maintained at 24 °C (left open in a room of the same temperature). The sample was conditioned for 12 h prior to when the infrared image was taken. This procedure was done with every panel tested before the thermal loading experiments had started.
The uniform surface temperature depicted in
Figure 5 supports the idea of using a reduced amount of temperature sensors. In order to further support the use of a reduced amount of temperature sensors, the temperature field around the internal reinforcing stud (HDF/wood) was determined using Area software 2017. The location of the sensors can be seen in
Figure 4. The surface sensors were located in the middle of the panel, which means that the surface sensors were located between the HDF/wood reinforcing frames.
Inside both chambers, the air temperature was measured using the Testo Saveris Base with wireless humidity and temperature sensors. On each side of the measured sample, a set of temperature sensors was placed on the surface to measure surface temperatures. Air temperatures and humidity were measured on the cold and hot sides 200 mm from the sample surface. All the monitored parameters (air temperature, surface temperature, and heat flow passing through the sample) were transferred online to a computer.
Both chambers of the hot box had external dimensions of 2 × 0.65 × 1.97 m, with an additional neck in the cold part to connect the cooling system. The box could easily be opened (like doors) to fit the sample panel inside of it. Both opening parts were fitted with wheels for easier handling, while the steel strap belts served to close the device. The supporting parts of the chamber (bottom, ceiling, and side walls) were made of 50 × 50 mm wooden prisms filled with thermal insulation from 50-mm expanded polystyrene. To this layer, another layer of 100-mm thick expanded polystyrene was added to reduce heat losses through the peripheral wall of the chamber. The total thermal insulation thickness of the circumferential walls of the two chambers was 150 mm. Expanded polystyrene was used as a low emissivity material in the hot box interior. Air velocity in the cold chamber was measured by a digital anemometer and the values of 0.3–0.7 m s−1 were measured.
2.4. Hot Box Instrumentation
The total thermal transmittance
Ut (W m
−2 K
−1) of the experimental panel was calculated as the ratio of thermal energy φ
1 (W) passing through sample area
A (m
2) perpendicular to the heat flow and
Tai −
Tae was the difference in air temperatures between the hot and cold sides of the sample (in K):
The total thermal resistance Rt (m2 K W−1) of the experimental panel was calculated as the inverted value of the total thermal transmittance.
Referring back to
Figure 3, the heat flow through the sample (φ
1 in watts) was determined as the input power (φ
p in watts); φ
3 and φ
4 in watts were neglected. The inlet heat flow in the hot chamber was calculated from the power of the electric heater being powered and regulated by a PID (proportional–integral–derivative) panel controller with an additional temperature probe in the hot chamber. Electric power outgoing from the PID controller was measured using the Rohde & Schwarz HZC 815 power analyzer.
There was a cooling system for maintaining low temperatures in the cold chamber. The metering area of the test sample was 1.7 × 1.7 m.
The thermal conductivity calculation of the wheat chaff/mineral wool was based on the thermal resistance calculation
R (m
2 K W
−1):
where
d (m) is the thickness of the material (chaff/wool/MDF),
Rsi is the internal surface thermal resistance (m
2 K W
−1),
Rse is the external surface thermal resistance (m
2 K W
−1), λ (W m
−1 K
−1) is the thermal conductivity of the material (chaff/wood/MDF), and
where
Tsi −
Tse is the difference in surface temperatures between the hot and cold side of the sample (K),
A is the surface of the panel (m
2),
φ1 is the heat flow in the sample (W), and the thermal conductivity of the MDF boards
λMDF (W m
−1 K
−1) is given by the manufacturer.
2.5. Experiment Design—Panel Response to Dynamic Thermal Loading
The panel was subjected to a dynamic thermal loading. The hot chamber temperature (
Tai) was continuously maintained at 24 °C. The temperature in the cold chamber (
Tae) fluctuated between +6 °C and −13 °C. The air temperature in the hot chamber
Tai was continuously measured (every minute) as an indication of the structure’s reaction to temperature changes. The total heat flow depending on time, as the total energy leaked through the panel
Esearched (Wh), was calculated using
Usearched for every minute according to the following equation:
where
Usearched is the thermal transmittance (W m
−2 K
−1) given by the calculation using a solver function,
A is the surface of the panel (m
2),
Tai −
Tae is the difference in air temperatures between the hot and cold side of the sample (K), and
t is the time (h).
where
Eexperimental is the total energy leaked through the sample (Wh). The solver function finds a variable
Usearched to minimize the difference between
Eexperimental and
Esearched calculated as
Q.
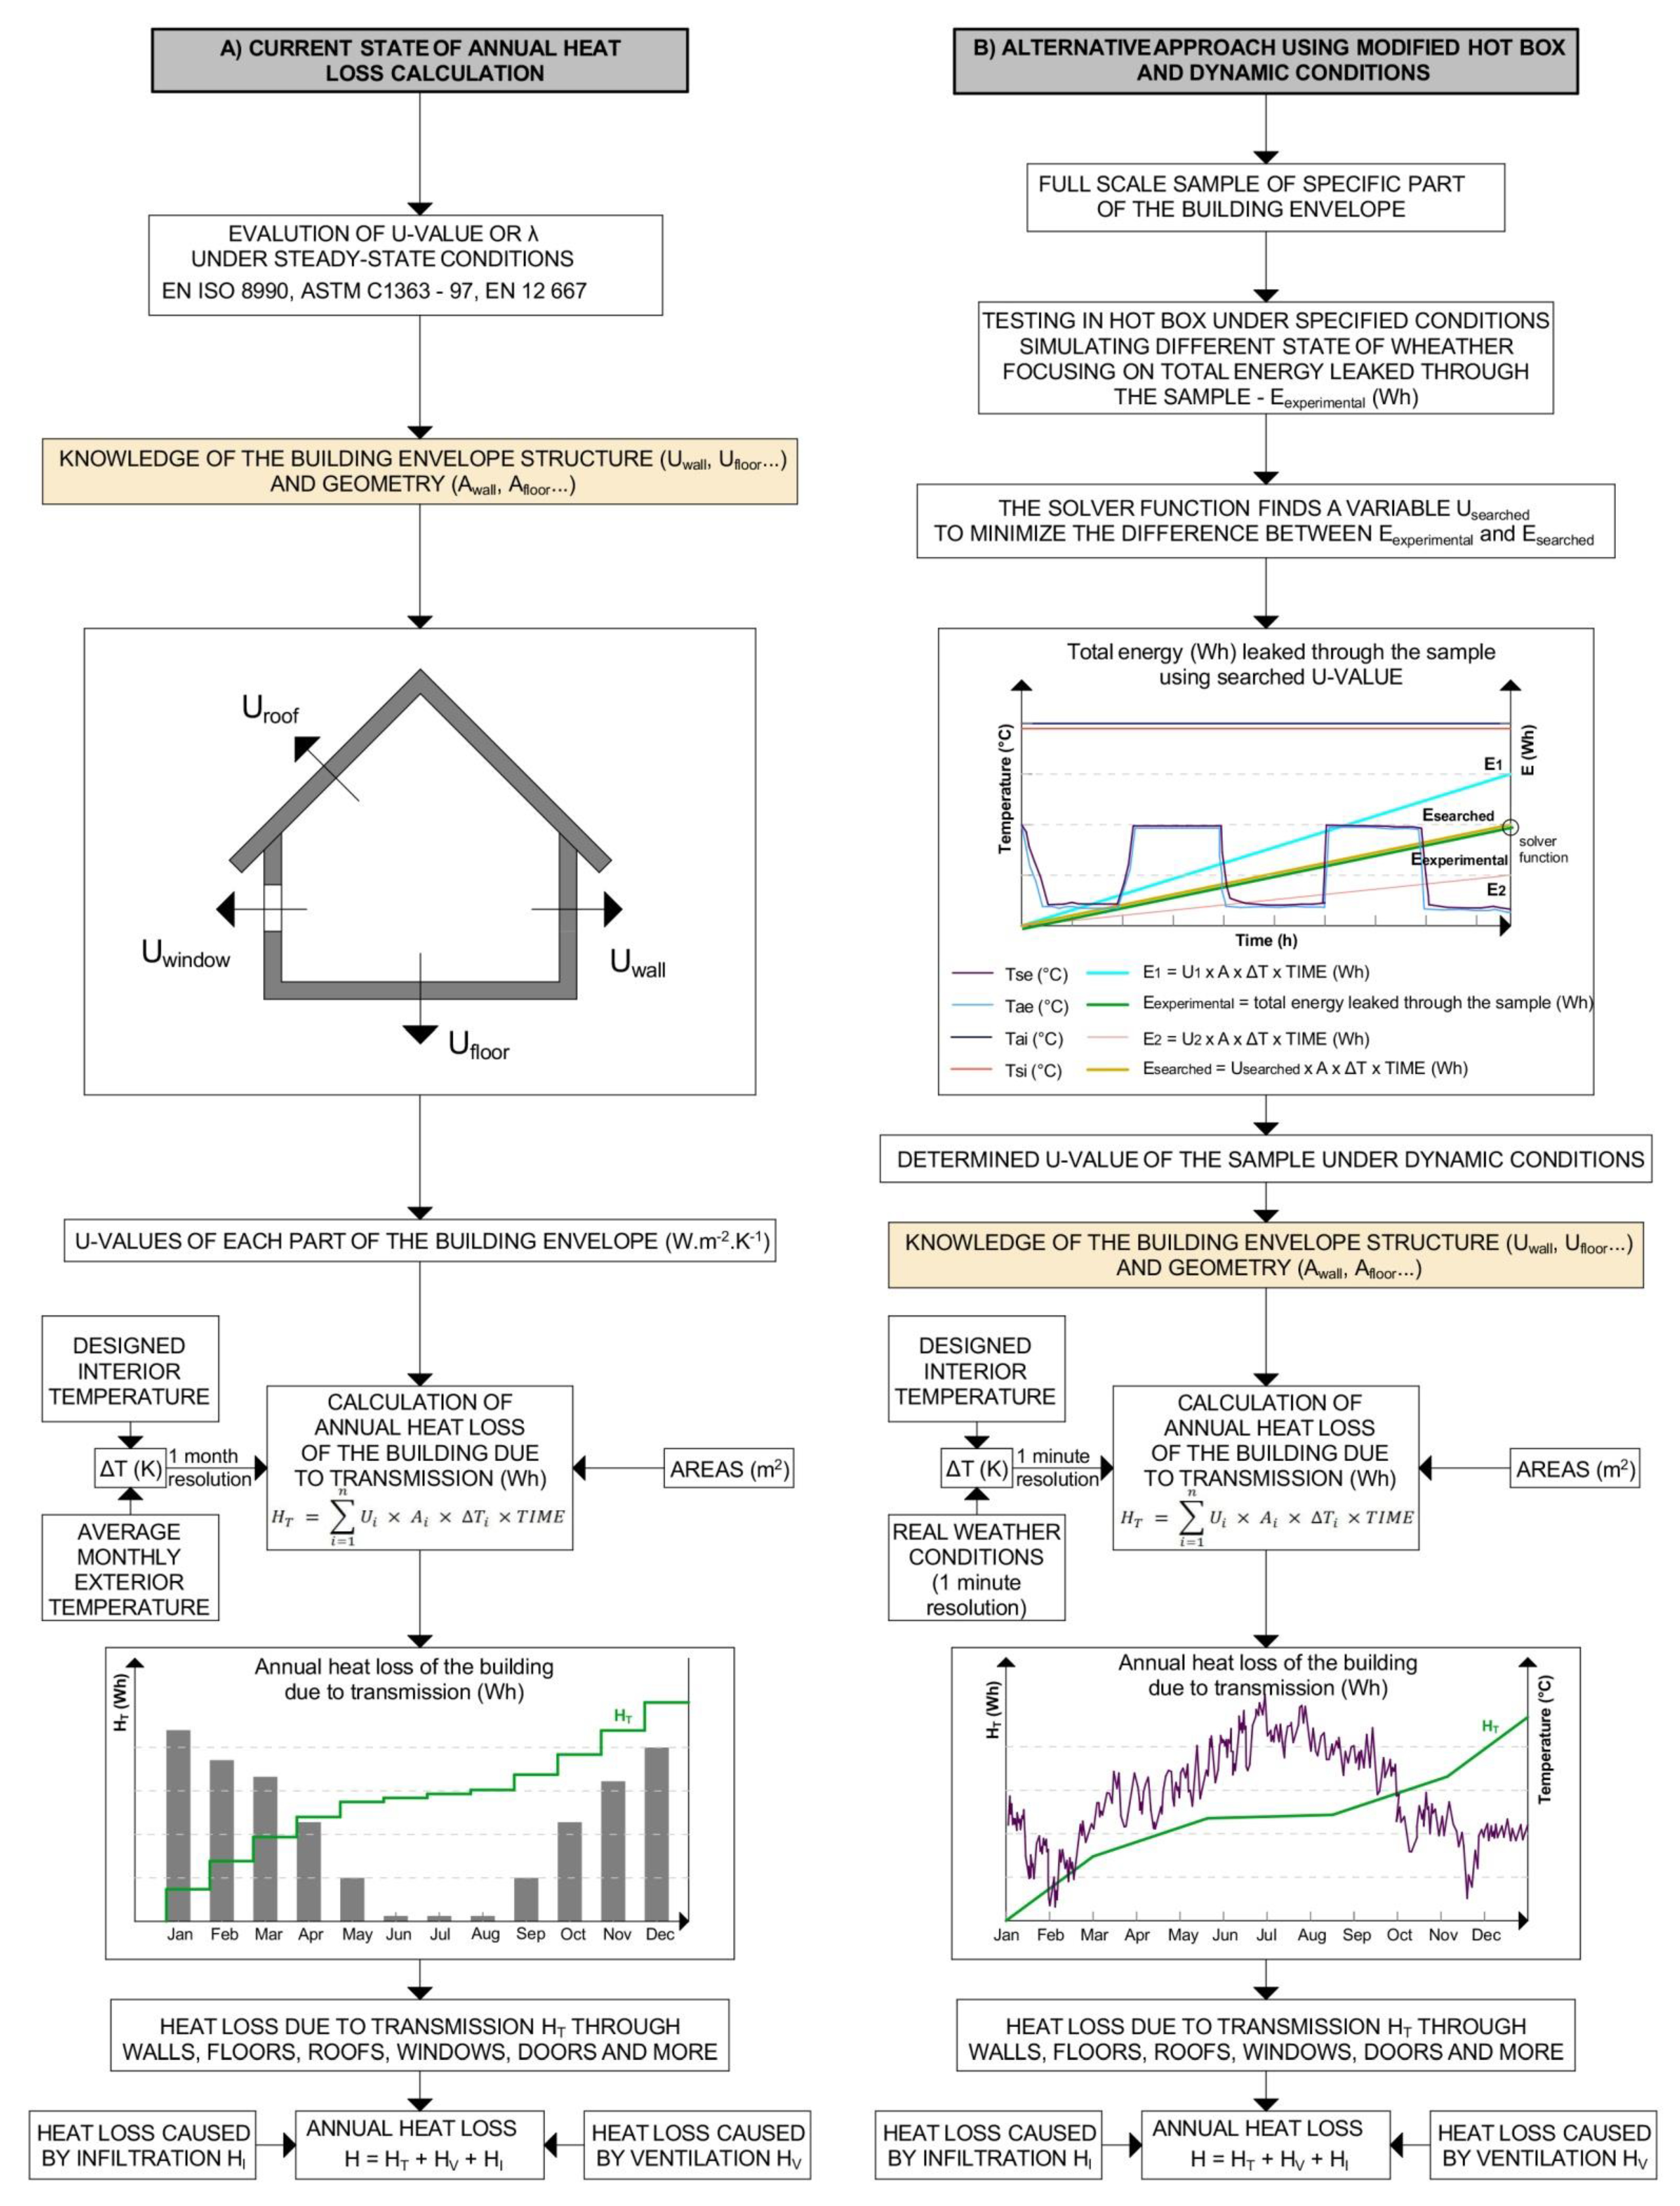
The alternative approach according to
Figure 6B brings the opportunity to measure the total energy (Wh) leaked through the sample and to find the appropriate
U value using dynamic conditions. Heat capacity, thermal response to real weather conditions, and water/vapour content influence can be better incorporated in this test method compared to the currently used steady-state conditions (
Figure 6A). A more accurate calculation of the total annual heat loss due to transmission can be provided by using the long-term real climate temperatures collected at 1 min resolution.
3. Results and Discussion
3.1. Wheat Chaff Microstructural and Physical Characterization
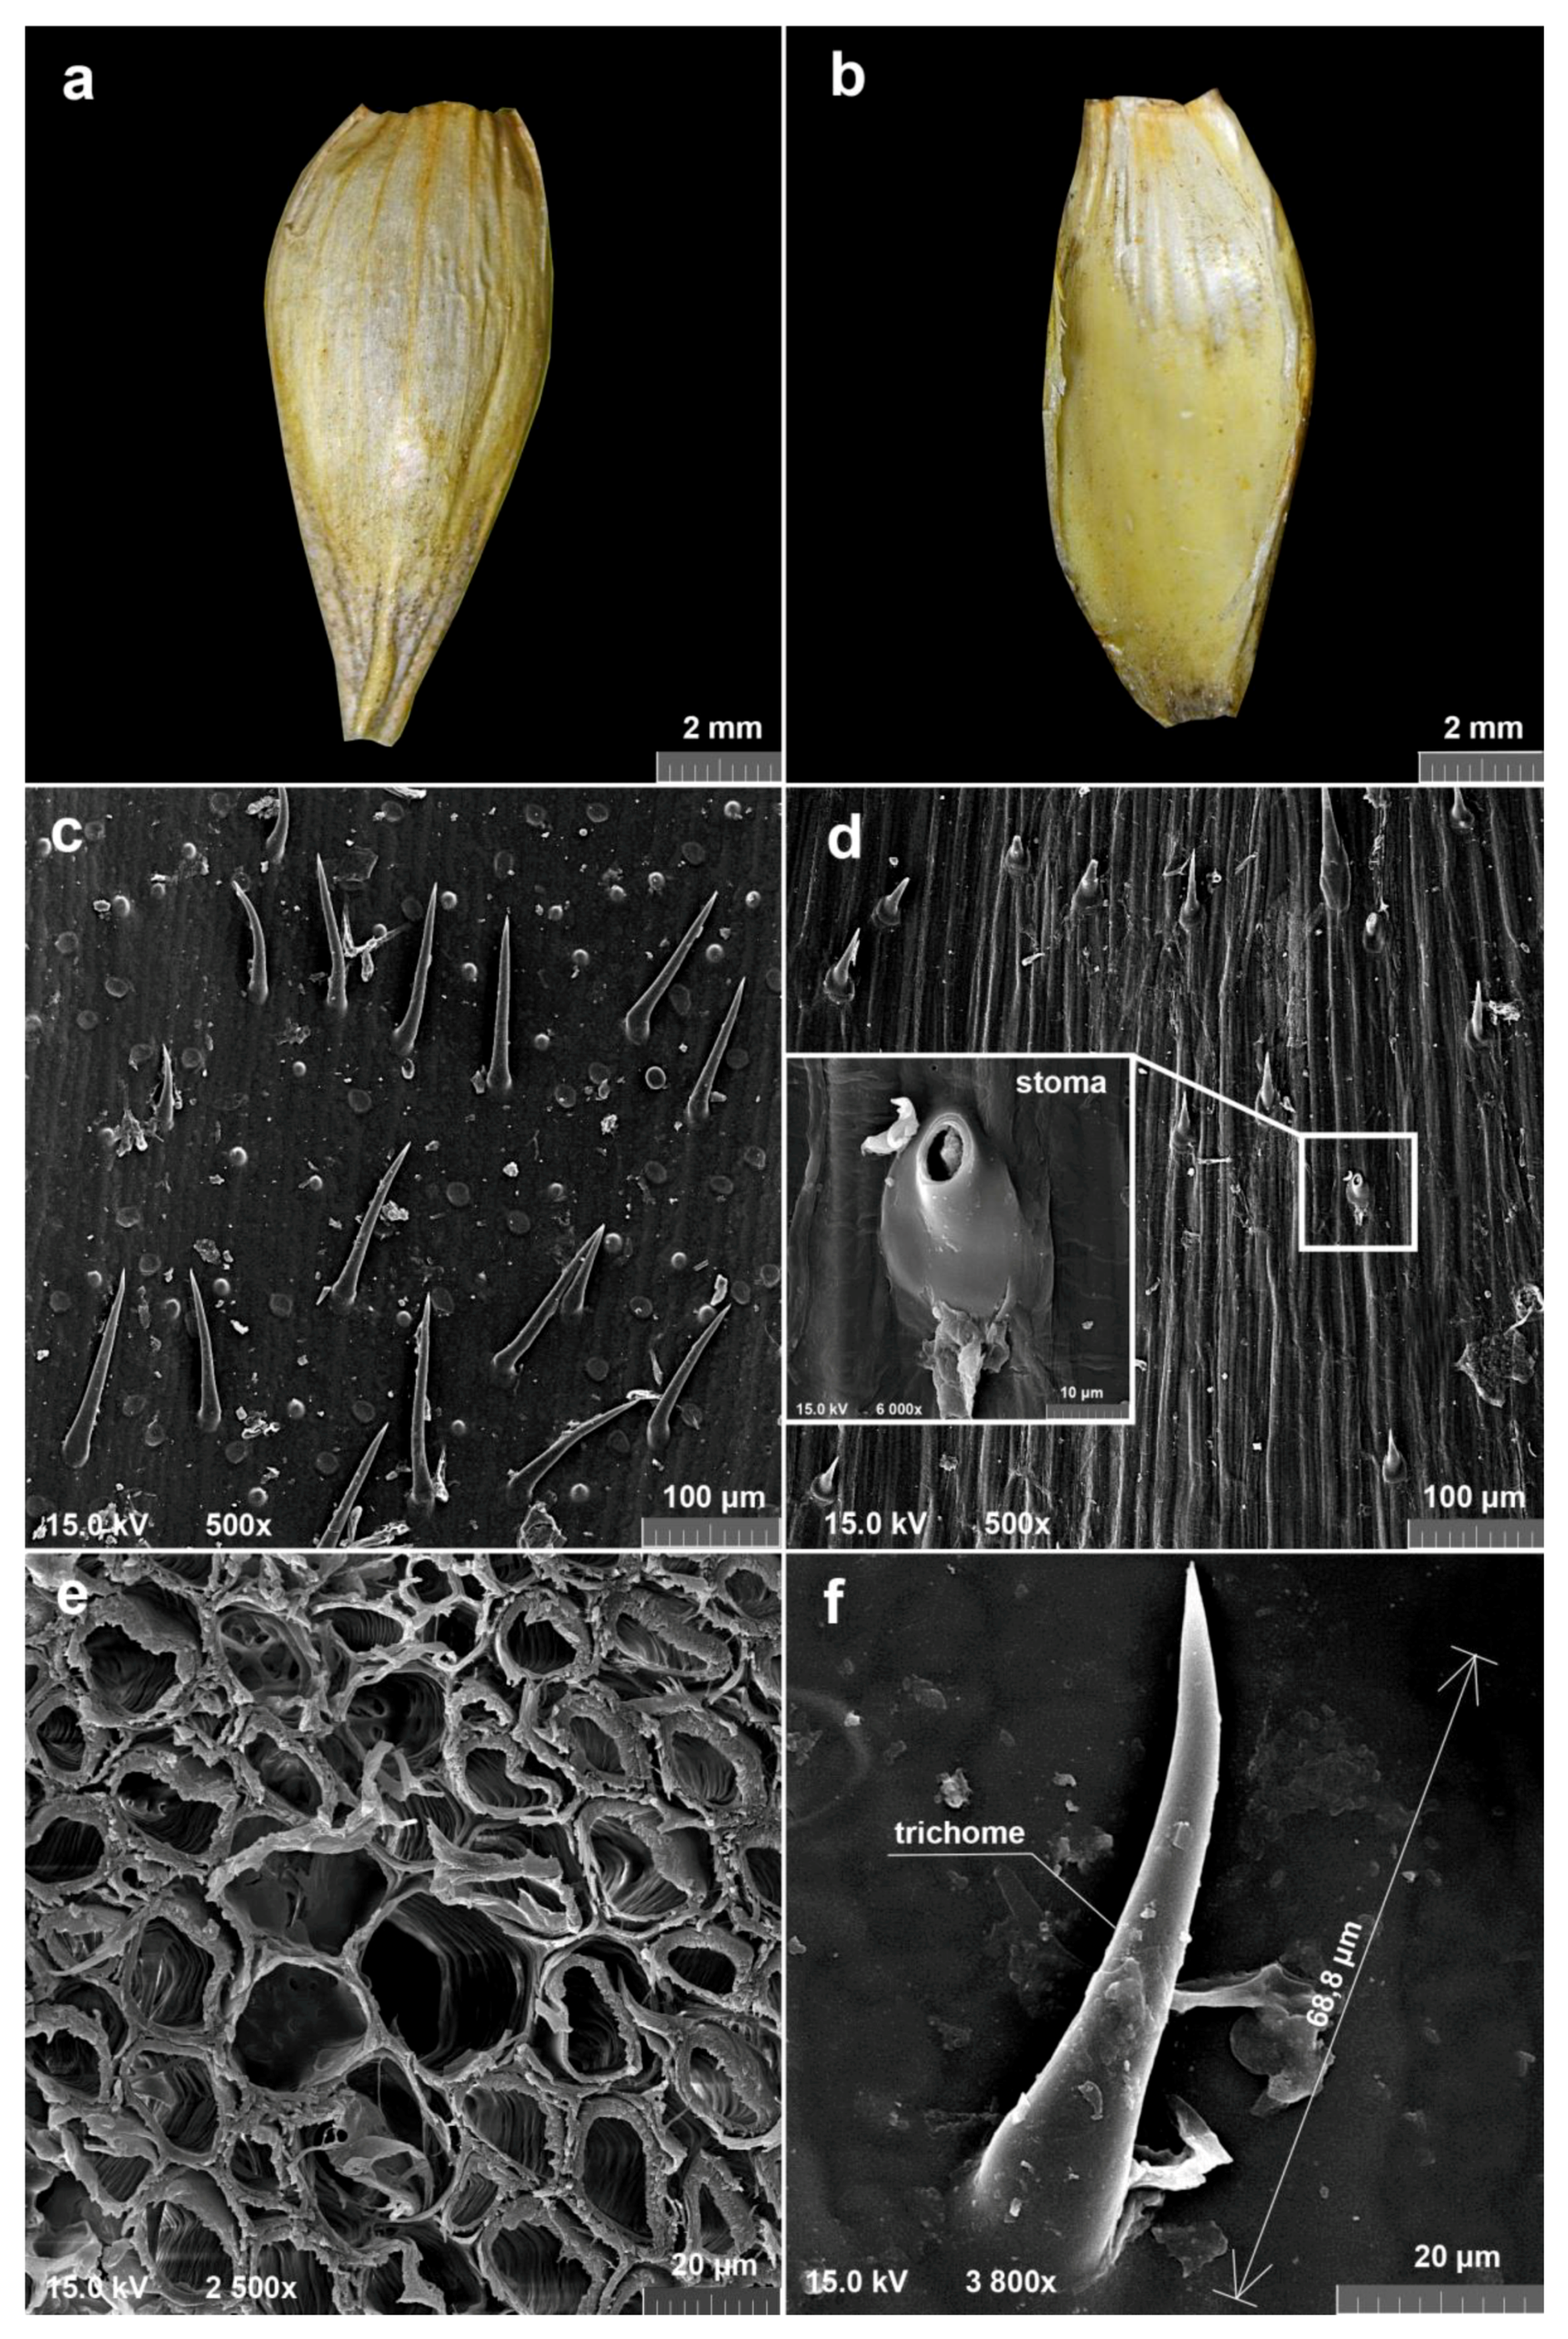
The MDF cavity of the insulation panel was filled with a loosely laid, predried wheat chaff mixture from a local supplier. The relative humidity was 3.5% ± 0.1%. Typical individual chaff has an oval shape as can be seen from
Figure 7a,b. The maximum average length of the chaff was 9.51 ± 0.76 mm and the width was 3.77 ± 0.42 mm, both measured on 100 samples using a digital sliding scale.
Table 1 shows the fractions of wheat-chaff distribution obtained from sieve analysis. Due to the wheat threshing to separate grains, chaff can be damaged, i.e., split or broken. Therefore, the sieve analysis gave the wheat chaffs’ width distribution. Comparing the dimensions determined from digital caliper measurement on undamaged samples with the sieve distribution fractions, it can be concluded that only about one-fifth of the chaffs survived threshing and handling. Nevertheless, even broken pieces maintain the airy cellular morphology responsible for thermos insulation properties of the chaffs (
Figure 7e). The fractions of <0.25 can be considered a powder which, unlike unbroken wheat chaffs, may have rather isotropic thermophysical properties, as will be discussed later.
The bulk density of the insulation was determined as the ratio between the total weight of the chaffs casted in the panel cavity and the volume of that cavity, leading to a density of 104 kg/m3.
SEM micrographs presented in
Figure 7 show the structure of the outer (c) and the inner (d) surface of the chaff with a detail of a trichome, which is a leafy spike that can be found on both surfaces of a chaff. Unlike the inner surface, the outer one contains many long trichomes together with shallow holes, residua after dead hair loss.
A hollow cavity MDF wooden panel filled with wheat-chaff thermal insulation and a panel of the same construction filled with mineral-wool thermal insulation was manufactured. The panels were subjected to thermal loading under steady-state and dynamic thermal conditions in a modified guarded hot box with temperature shifts on the cold side of the hot box.
3.2. U-Value Calculation of Panel from Steady-State Conditions
Measurements were performed after conditioning the closed hot box apparatus with the tested sample inserted. Temperatures were recorded at least 4 h after the steady state was established, i.e., temperature fluctuations were in the range of 1% maximum. The temperature in the hot chamber Tai (°C) was continuously maintained at 24 °C, while the temperature in the cold chamber Tae (°C) was set to −13 °C.
The details of the measurements performed on three wheat chaff panels, including thermal transmittance, are summarized in
Table 2. The average thermal conductivity of wheat chaff determined under steady-state conditions from all three measurements was 0.048 ± 0.001 W m
−1 K
−1. The average thermal transmittance of the entire sandwich panel was 0.307 ± 0.004 W m
−2 K
−1 and the average thermal resistance was 3.263 ± 0.040 m
2 K W
−1.
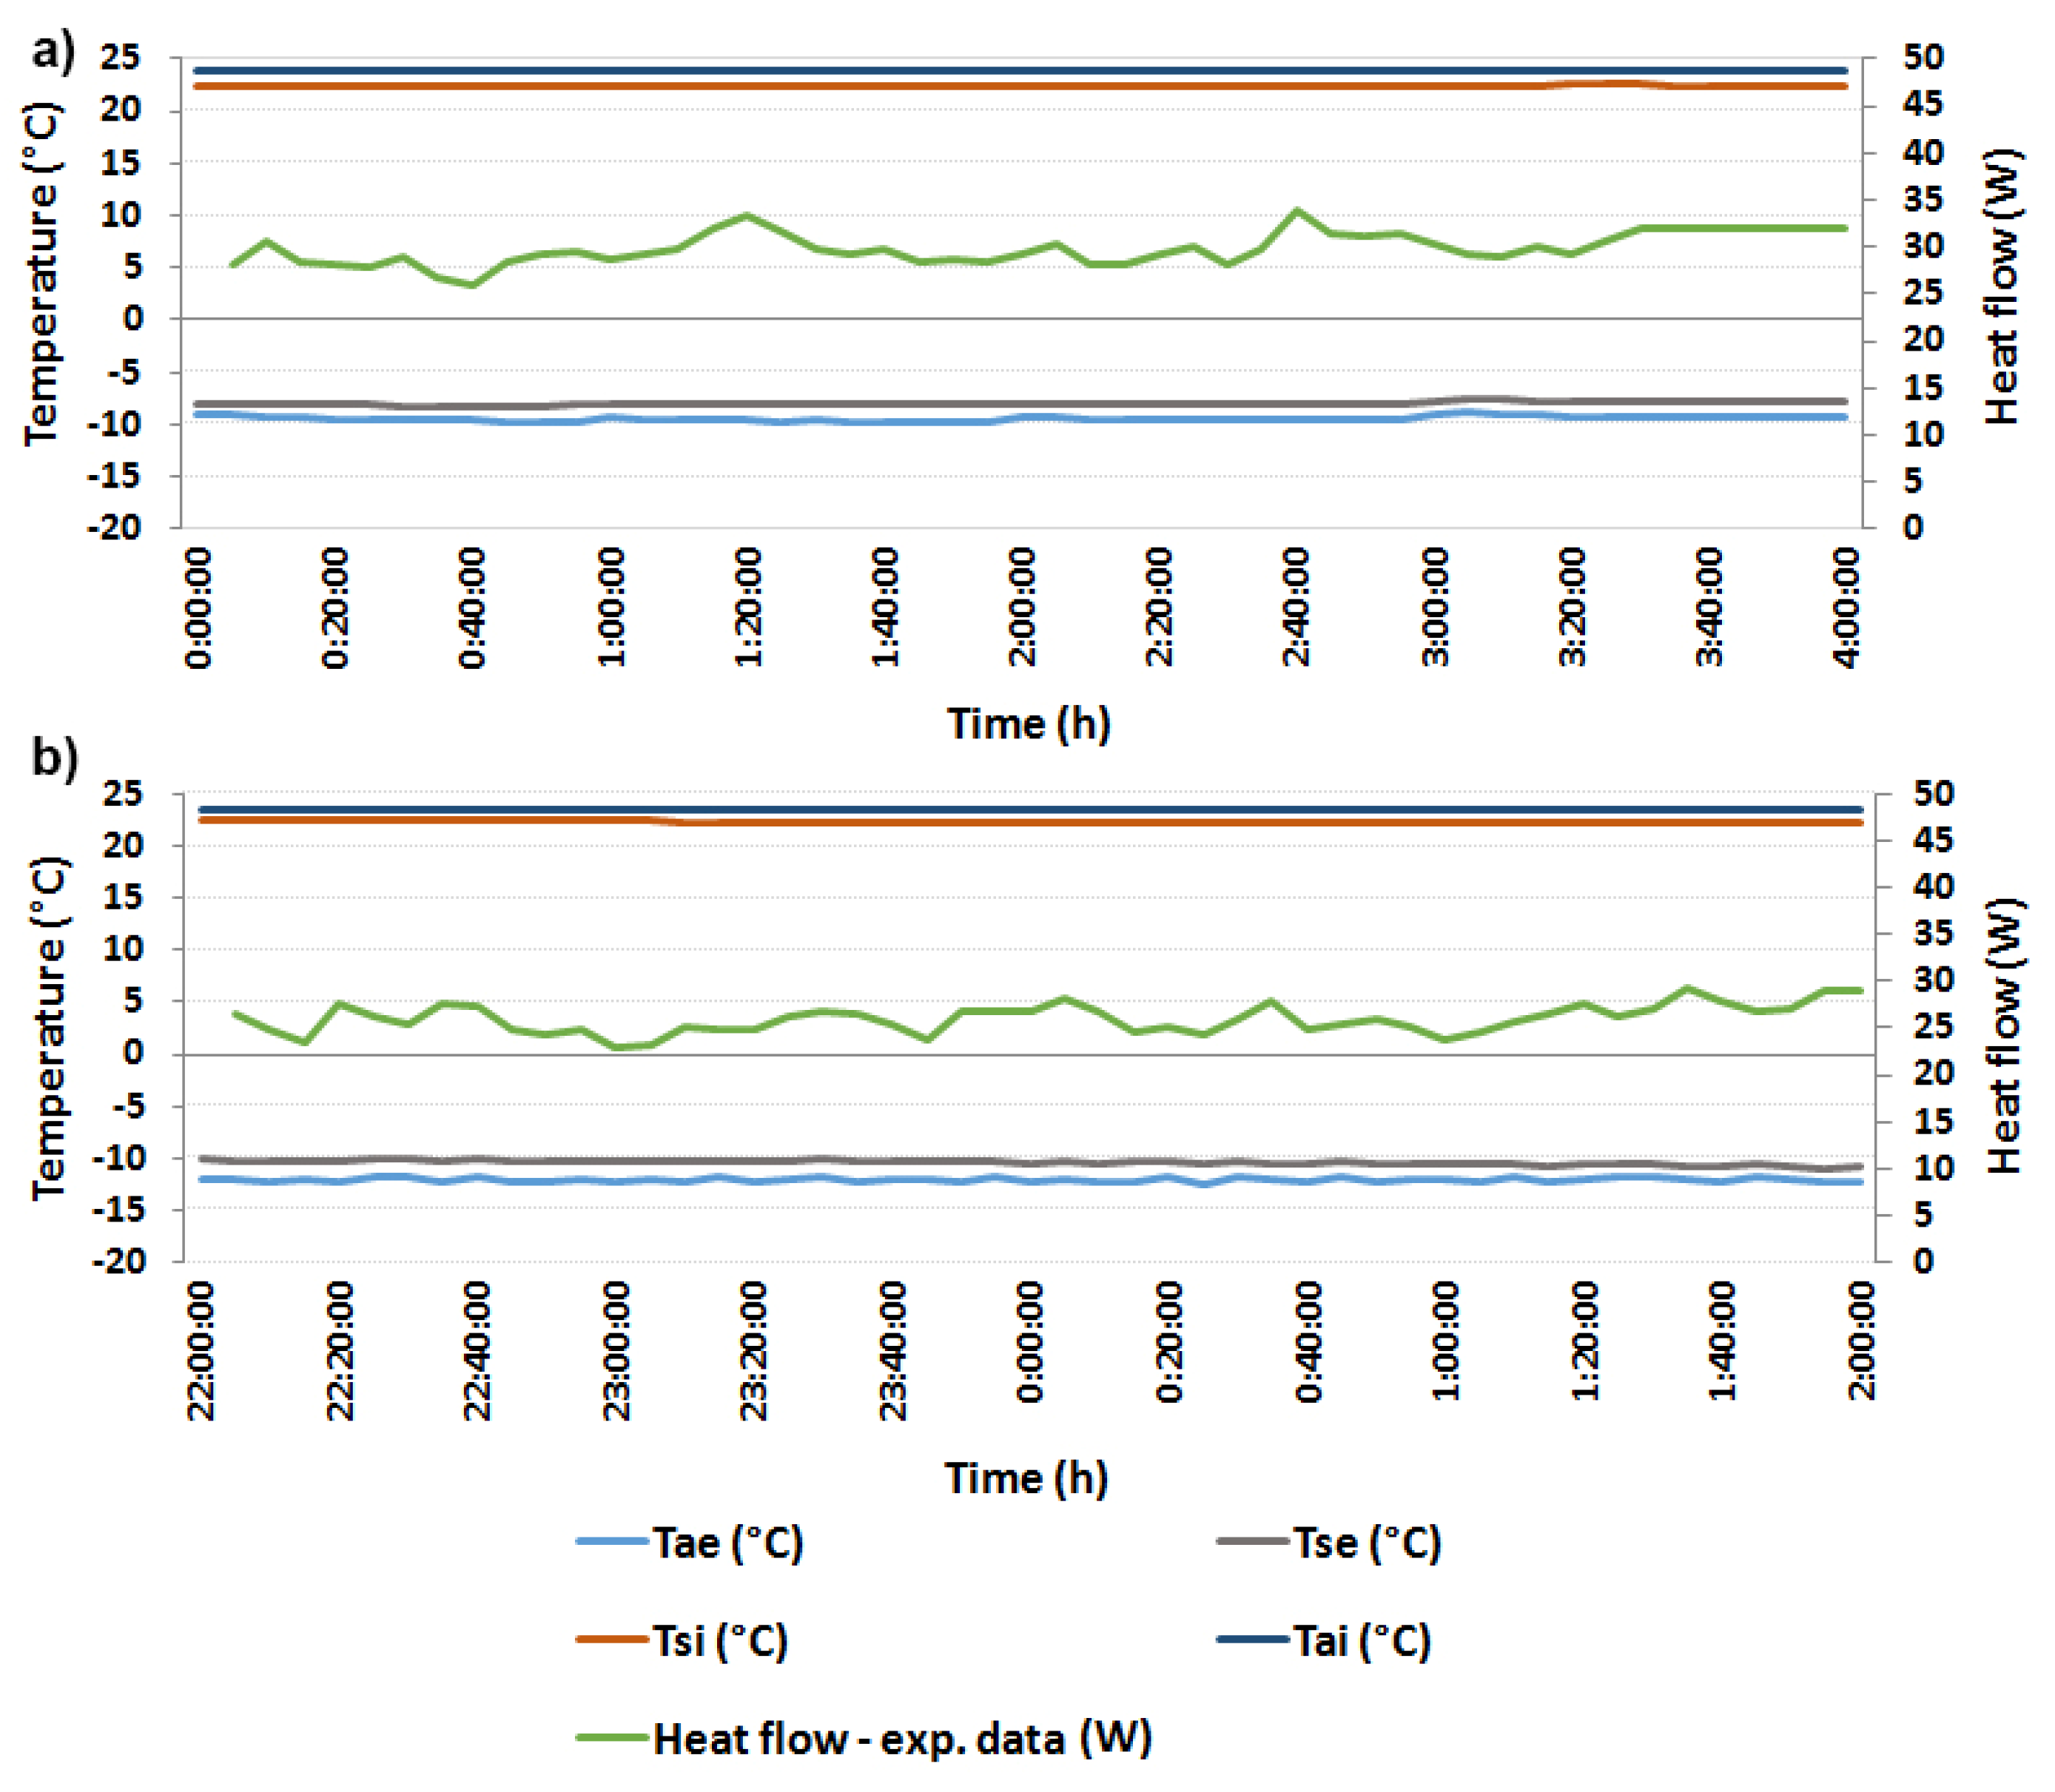
All of the surface temperatures were constant throughout all of the tests, with a maximum difference of 0.02 °C on the hot side and 0.2 °C difference on the cold side. The air temperature fluctuations in the hot chamber were approximately ± 0.02 °C and approximately ± 0.2 °C in the cold chamber (
Figure 8). The laboratory room temperature was monitored continuously at 24 ± 0.5 °C.
The results of the panel wall containing mineral wool are summarized in
Table 3. The average thermal conductivity of mineral wool was 0.040 ± 0.003 W m
−1 K
−1. The average thermal transmittance of the entire sandwich panel was 0.255 ± 0.016 W m
−2 K
−1 and the average thermal resistance was determined as 3.930 ± 0.250 m
2 K W
−1.
3.3. Specific Heat Capacity
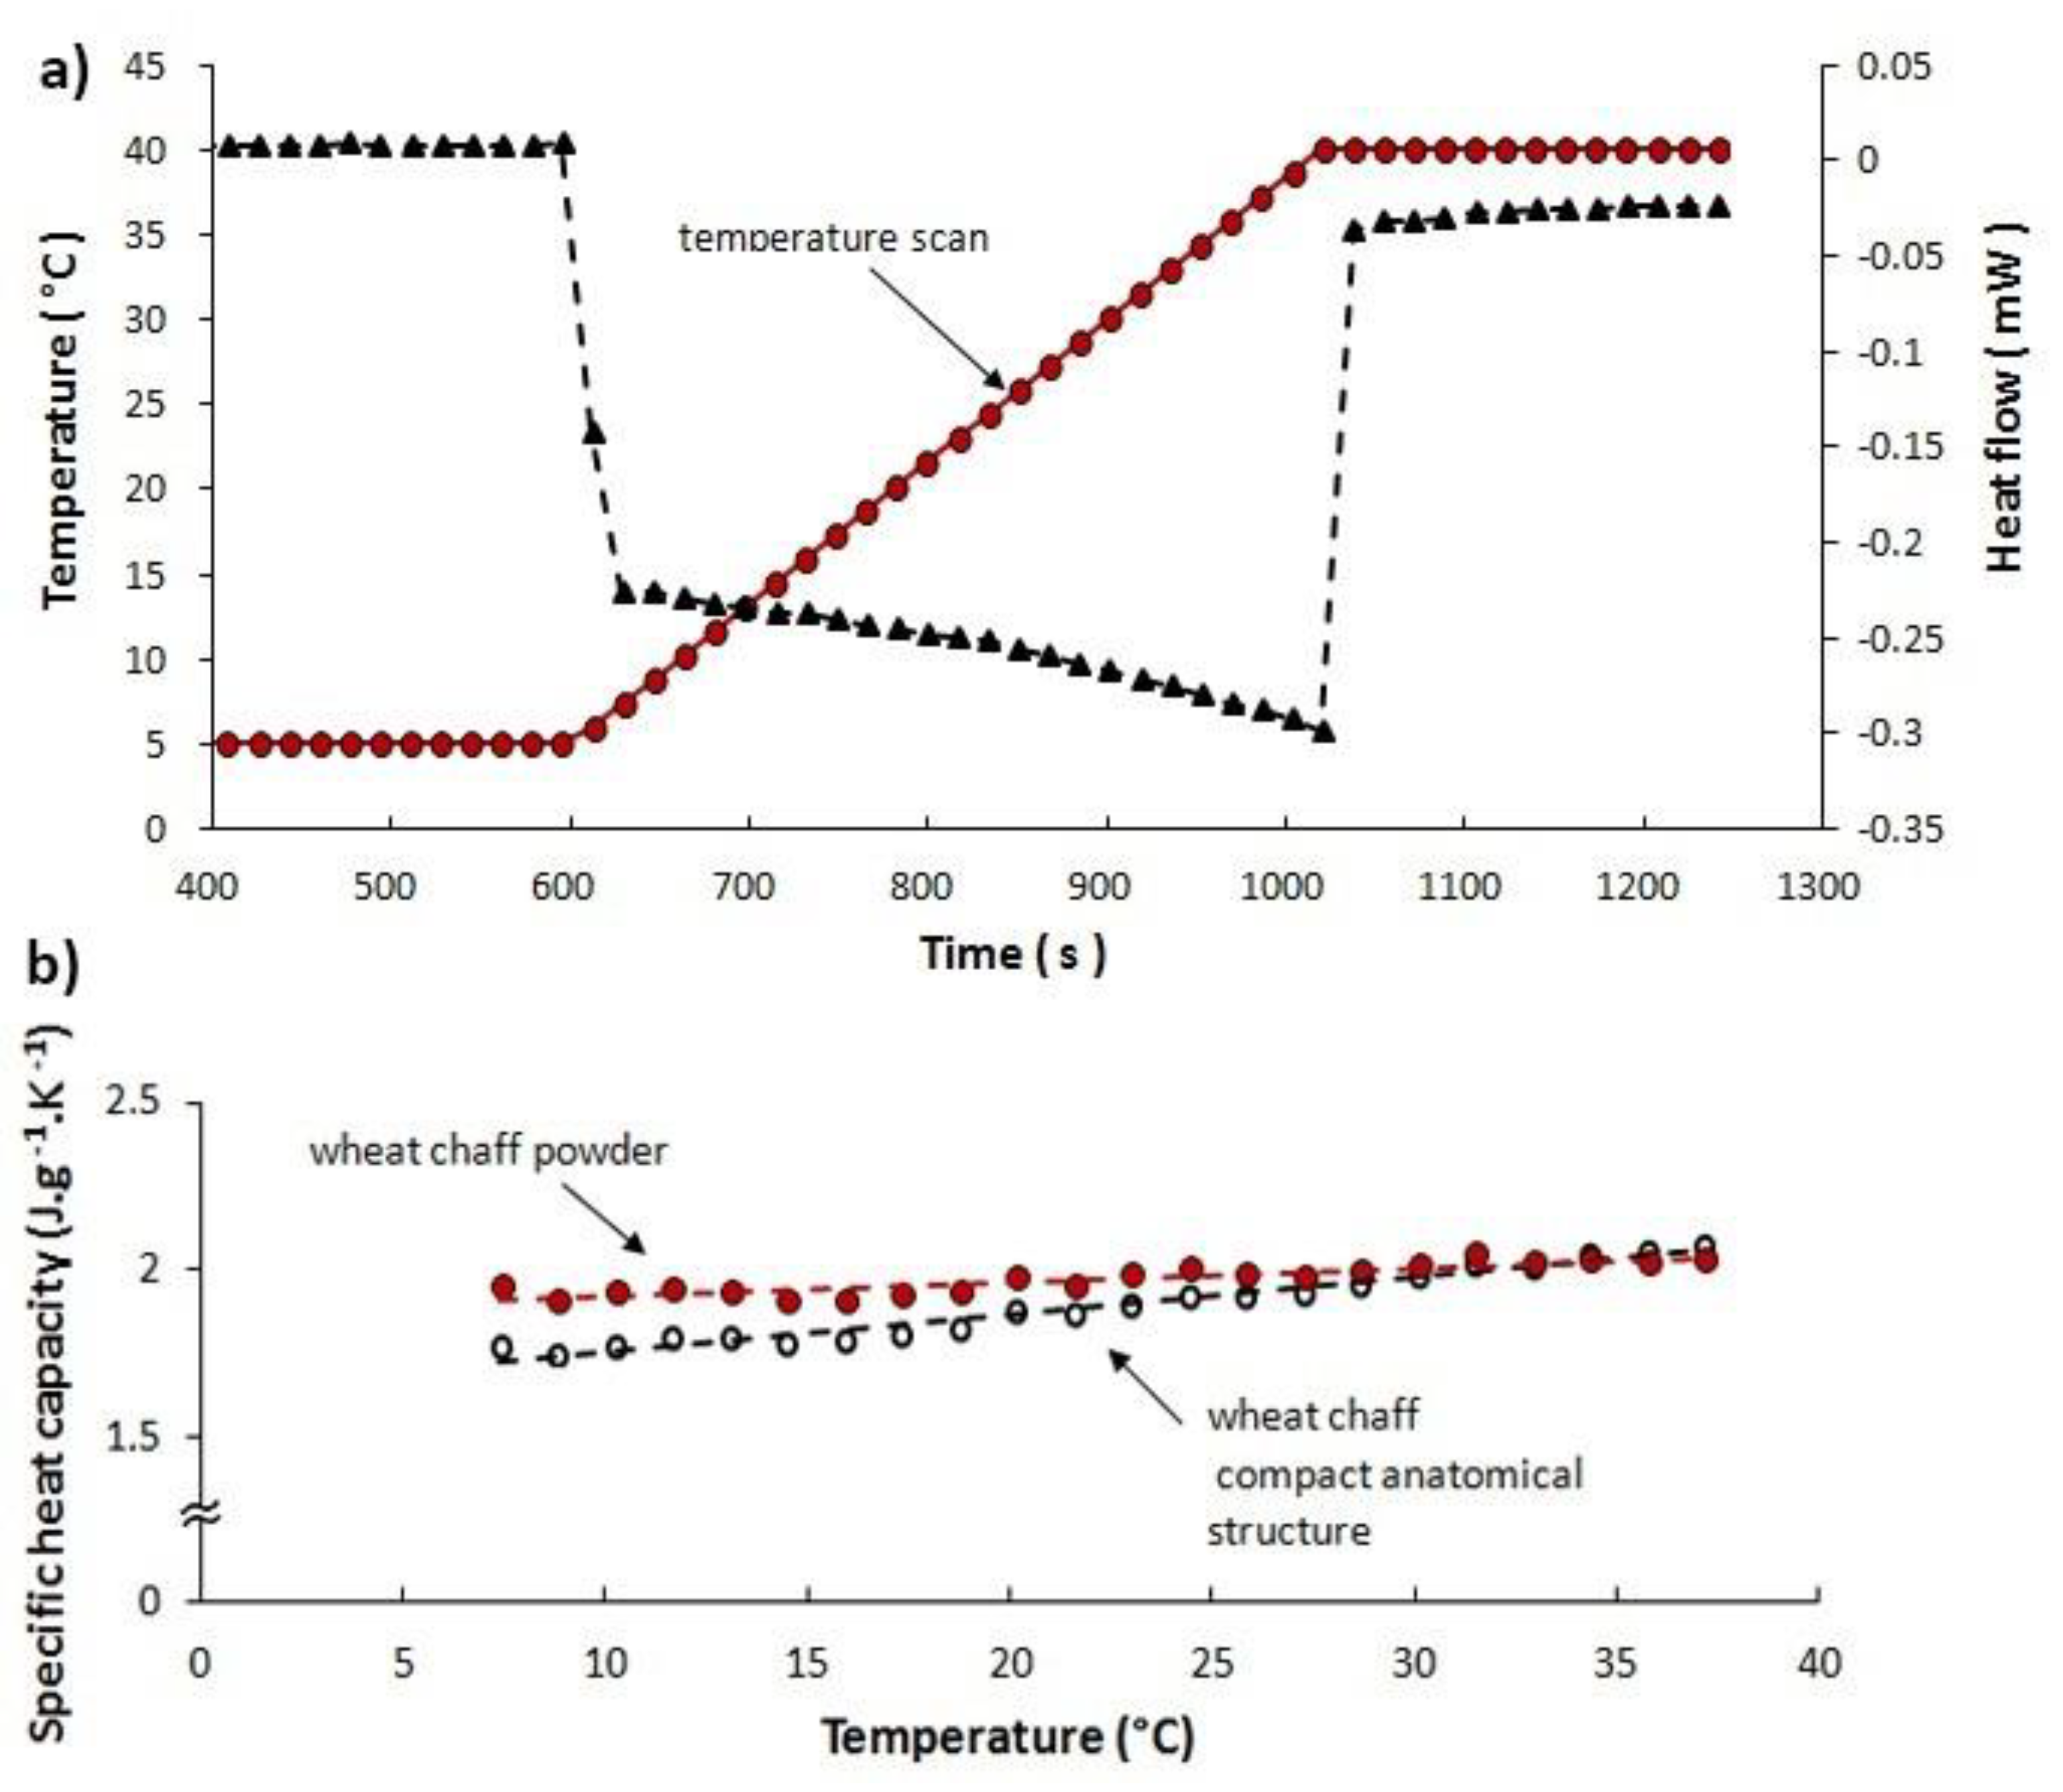
Figure 9a shows the DSC temperature program and the corresponding heat flow through the sample curve to extract values of specific thermal capacity. Measurements were performed on the wheat chaff powder to eliminate the effect of the anisotropic anatomical structure as well as on the pristine botanical structure, placed perpendicular to the heat flow.
Figure 9b shows the results in the temperature range of 5–40 °C. As can be seen from the same figure, the specific heat capacity is an increasing function of temperature for both the powder and the chaff.
The average values of the specific heat capacity of the compact anatomical chaff structure are lower than the powder values, approximately up to about 30 °C. The average specific heat capacity at 25 °C was 1.8 kJ kg
−1 K
−1 for the compact anatomical structure and 1.9 kJ kg
−1 K
−1 for the powder. These values are higher compared to other lignocellulosic materials like wood pellets, bamboo, or low-density fiberboards [
11,
26,
27]. Perhaps the different chemical composition as well as morphology of the solid lingocellulosic phase plays a role. Nevertheless, the dependence of heat capacity on temperature showed a similar trend. The tested specimens were predried to eliminate the influence of relative humidity on heat capacity determination.
Specific heat capacity, density, and panel thickness were used to determine the heat capacity per unit of the transverse surface C = 54.6 kJ m−2 K−1 and the approximate total thermal resistance of Rt = 3.3 m2 K W−1. The time constant (i.e., response time) of the wheat chaff panel wall was τs = 49.5 h. In each case, the time constant in the heterogeneous walls depends not only on the total thermal resistance and the heat capacity but also on the arrangement of different materials with different thermal properties.
3.4. Panel Response to Dynamic Thermal Loading
The dynamic thermal test was performed by changing the temperature of the outside air
Tae (°C) in the cold chamber after a certain amount of time, as can be seen in
Table 4. The temperature was controlled by an electronic controller with a pre-set temperature program. Before the test was started, the sample was conditioned under the pre-set conditions for 24 h with the air temperature in the cold chamber of the hot box maintained at 6 °C and the air temperature in the hot chamber maintained at 24 °C.
The tested panel was subjected to a thermal cyclic loading with a period of 24 h, the first one being 17 h after conditioning, with the temperature in the hot chamber Tai (°C) continuously set at 24 °C. The temperature in cold chamber Tae (°C) periodically changed between −13 °C and +6 °C/24 h for four days. The temperature program was based on the average real climate conditions recorded at the local meteorological station, Prague–Suchdol, Czech Republic, within last few years.
During the tests, the following data were collected: the surface temperatures
Tse (°C) and
Tsi (°C), the air temperature
Tae (°C) and
Tai (°C), and the total energy (in Wh) leaking through the sample (designated as an “Experimental (Wh)” in
Figure 10) at an intervals of 1 min.
The air temperature
Tai (°C) in the hot chamber was continuously monitored (recorded every minute) as an indication of the sample reaction to the thermal impulse.
Figure 10 shows the automatic defrosting cycle of the cooling system after approximately 12 h. The total energy leaking through the sample was recorded experimentally (W) as a function of time. Furthermore, it was also calculated from Equation (9) and plotted as an “
Esearched” in
Figure 10.
Figure 10 shows the results from two independent measurements, comparing the wheat chaff panel reaction and the mineral-wool panel reaction to dynamic thermal conditions as described in the previous paragraph. The temperatures on the cold side were changed periodically after 24 h during the 88 h of testing. The main results from these tests under dynamic thermal conditions are the curves describing the total energy leaked through the sample as a function of time.
Figure 10 shows
Eexperimental (Wh) for both the wheat chaff and mineral wool panels.
Esearched was calculated using Equation (9).
Usearched was found after the measurement using a solver function in MS Excel.
The total thermal transmittance of the entire sandwich panel filled with the wheat chaff insulation was 0.298 W m−2 K−1 and the total thermal resistance value was 3.356 m2 K W−1. The thermal conductivity of the wheat chaff itself was 0.047 W m−1 K−1.
The total thermal transmittance of the entire sandwich panel filled with mineral wool insulation was 0.267 W m−2 K−1 and the total thermal resistance value was 3.745 m2 K W−1. The thermal conductivity of the mineral wool was 0.042 W m−1 K−1.
As can be seen, the U-values of the two insulation panels tested were very close. As a main conclusion, the steady-state measurements gave more optimistic thermal properties for the panel filled with mineral wool. The data from measurements conducted under dynamic conditions provided comparable values for both panels. Therefore, the test conditions may strongly influence the performance of a panel in the test, leading to bio-based thermal insulation being rejected in favor of artificial thermal insulation.
Figure 11 shows in detail the temperature field across the panel wall close to the internal reinforcing element (HDF/wood). Linear thermal transmittance ψ across the reinforcing stud was calculated using the Area software according to EN ISO 10 211 [
28] (typical accuracy ±5%). The linear thermal transmittance of the stud was determined as ψ = 0.003 W m
−1 K
−1. Such a low value was the reason for a uniform temperature distribution on the external surface of the panel, as can be seen in
Figure 4. Nevertheless, it was included in the resulting values of the thermal transmittance, thermal resistance, and thermal conductivity.
The results reported in this study provide a thermal transmittance determination based on dynamic temperature as a function of time, set in the cold chamber of the hot box (
Figure 10). Contrary to the standardized steady-state testing with a constant temperature in the cold box, the method depicted herein can determine the thermal transmittance and thermal conductivity values that include the effect of the heat capacity and the rate of absorption of thermal energy with a nonlinear course, whose exact calculation through mathematical models would not be straightforward but time-consuming and based on many simplifying assumptions.
In conclusion, the use of agricultural wastes as a sustainable insulating material seems to be promising in terms of both sustainability and the ability of the insulation to keep the indoor air environment at a constant temperature.
4. Conclusions
Insulation wall panels for sustainable building construction were manufactured from wheat-chaff agricultural waste. The panels consisted of a wooden envelope made of medium-density fiberboards (MDF), reinforced with wooden studs, and a hollow cavity filled with wheat chaff.
Thermal transmittance (U-values) under static and dynamic thermal conditions of the insulation panels were determined using a modified guarded hot box method.
The obtained U-values of the wheat chaff insulation panels were compared to the panels of the same construction filled with mineral wool.
For each measured panel, the U-values determined under steady-state and dynamic conditions were different. After 88 h of dynamic thermal loading, mineral wool showed a 5% higher U-value compared to steady-state conditions, while wheat chaff showed a 3% lower U-value.
As can be seen, the hot box method under dynamic thermal conditions can be used for realistic simulation of the thermal behavior of building envelopes.
Moreover, it is expected that the U-value determination from the hot box method under dynamic thermal loading may be more precise and realistic, especially when it comes to bio-based materials with relatively high thermal capacity.
Furthermore, it has been shown that lignocellulosic agrowaste material such as wheat chaff can be used as a viable sustainable alternative to mineral-wool thermal insulation. To have a building envelope insulation panel with the same thermal resistance, only a 10% thicker layer of wheat chaff is needed compared to common mineral wool.


