Article

Characterizing Sand and Dust Storms (SDS) Intensity in China Based on Meteorological Data

1
Key Laboratory of Watershed Geographic Sciences, Nanjing Institute of Geography and Limnology, Chinese Academy of Sciences, Nanjing 210008, China
2
International Ecosystem Management Partnership, United Nations Environment, Beijing 100101, China
3
Key Laboratory of Ecosystem Network Observation and Modeling, Institute of Geographic Sciences and Natural Resources Research, Chinese Academy of Sciences, Beijing 100101, China
4
Key Laboratory of Space Utilization, Technology and Engineering Center for Space Utilization, Chinese Academy of Sciences, Beijing 100094, China
5
United Nations Environment, United Nations Avenue, Gigiri, P.O. Box 30552, Nairobi 00100, Kenya
*
Author to whom correspondence should be addressed.
Sustainability 2018, 10(7), 2372; https://doi.org/10.3390/su10072372
Submission received: 12 June 2018 / Revised: 29 June 2018 / Accepted: 3 July 2018 / Published: 9 July 2018
(This article belongs to the Special Issue Dust Events in the Environment)

Abstract

:
Sand and dust storms (SDS) are global phenomena that significantly impact the socio-economy, human health, and the environment. The characterization of SDS intensity is a fundamental aspect of SDS issues and studies. In this study, a sand and dust storms index (SDSI) is developed to characterize SDS intensity by addressing the potential impacts of sand and dust storms on sensitive elements. Compared with other indices, SDSI includes four SDS-related components: SDS frequency, SDS visibility, SDS duration, and SDS wind speed. Using SDSI, this study characterizes the SDS intensity in the Three-North Forest Shelterbelt Program (TNFSP) region of China. The SDSI results show that high values of SDSI are mostly concentrated in southern Xinjiang, western and central Inner Mongolia, western and central Gansu, and northern Ningxia. By analyzing the SDSI components, over half of the stations experienced sand and dust storms no more than once per year on average. Most of the SDS events reduced horizontal visibility to less than 500 m, one-third of SDS events last more than two hours, and the wind speed of over half of the SDS events varied between 10–17 m/s. In comparison with SDS frequency, SDSI performs better in reflecting the spatial and temporal variation of SDS events. Therefore, instead of SDS frequency, SDSI can be applied to studies relevant to SDS intensity. Finally, five major SDS transportation routes were identified based on the surface prevailing wind direction, SDSI, and the existing literature. The SDS routes, combined with SDSI, could help governments and policy-makers cooperate on a regional level to combat SDS events more effectively.

1. Introduction

Sand and dust events are atmospheric processes that result in a reduction in visibility when strong and turbulent winds blow over desert or aridisol surfaces [1]. As a common phenomenon in arid and semi-arid areas, they have a variety of regional names and categories. For example, in the Middle East, sand and dust events are classified as one of the following three types: shamal, frontal, and convective [2]. Shamal events are the sand and dust storms coming from the north that are observed in summer and winter [3]. Frontal events mix the dust in the air and transport it great distances. Frontal storms can be classified into prefrontal, postfrontal, and shear-line. Convective storms can also be divided into three types: haboobs, dust devils, and inversion downburst storms. In China, five types of sand and dust events have been defined by the China Meteorological Administration (CMA): floating dust, blowing dust, sand and dust storms, strong sand and dust storms, and severe sand and dust storms [4,5,6]. Floating dust is defined as dust in the air when there is no wind or the wind speed is less than 3 m/s, so sand and dust are suspended in the air, increasing the air turbidity and reducing horizontal visibility to <10 km. Blowing dust is a weather phenomenon created when sand and dust are raised by winds, making the air fairly turbid and reducing horizontal visibility to 1–10 km. Sand and dust storms are defined as sand and dust that are raised by winds, considerably increasing the air turbidity and reducing horizontal visibility to less than 1 km. Strong sand and dust storms are defined as sand and dust raised by winds, making the air very turbid and reducing horizontal visibility to <500 m. Severe sand and dust storms are defined as sand and dust raised by winds, making the air extremely turbid and reducing horizontal visibility to <50 m. Based on the synoptic codes of the World Meteorological Organization (WMO), sand and dust events are categorized as dust storms, blowing dust, dust haze, and dust whirls. Of these, dust storms are the result of surface winds raising large quantities of dust into the air and reducing visibility to less than 1 km [7]. In this study, we refer to sand and dust storms (SDS) using the definition of dust storms from the WMO.
Worldwide concern about sand and dust events has increased, given their impacts on the socio-economy, human health, and the environment [8,9,10,11]. Each year, an estimated 2000 Mt of dust are emitted into the atmosphere, 75% of which is deposited onto land and 25% of which is deposited onto oceans [12]. During this process, dust significantly affects the energy balance and physical, chemical, and biogeochemical cycles on the global scale. Middle Eastern dust (MED) events, especially from the Arabian Peninsula, Jordan, Iraq, Syria, and Kuwait, usually result in observed increased rates of morbidity and mortality for cardiovascular and respiratory diseases [13,14,15,16]. For example, from 2010 to 2012, the number of hospital admissions at the Razi Hospital in Iran was 3338 on MED days. However, this number was only 1438 on normal days [17]. In Australia, a single large dust storm on 23 September 2009, which was called Red Dawn by the local media, resulted in total losses of approximately AUD $299 million [18]. Northern China has also been recognized as one of the major sources of sand and dust events in East Asia [19,20,21]. Due to the sand and dust storm on 5 May 1993, 85 people died, 373,000 ha of crops were destroyed, 16,300 ha of fruit trees were damaged, 120,000 herds of animals died or were lost, more than 4000 houses were buried, more than 1000 km of irrigation channels were buried, and 10–30 cm of topsoil were lost [22].
SDS intensity is always a fundamental aspect of SDS-related studies, including SDS sources identification [23,24,25,26], SDS route tracing [27,28,29,30], and SDS impact and risk assessment [31,32,33]. Among the existing literature, different measures have been used to describe SDS intensity. SDS frequency is most often determined by counting the number of SDS days during a set period. Visibility is another efficient method that is used to reflect SDS intensity. For example, in China, sand and dust storms are classified as sand and dust storms, strong sand and dust storms, and severe sand and dust storms, based on the visibility of the SDS events. Some researchers have also focused on the relationship between SDS duration and SDS intensity and frequency [34,35]. In addition, SDS intensity is closely related to surface wind speed [7,36]. In Northern China and Inner Mongolia, the long-term mean surface wind speed was report to be about 5 to 6 m/s [29]. Wind systems are also dominant in determining dust transportation routes. Although these indices (SDS frequency, SDS visibility, and SDS wind speed) are closely related to SDS intensity, none is capable of accurately characterizing SDS intensity. Researchers have been developing comprehensive indices to express SDS intensity [37,38,39]. This study defines a new SDS intensity index to depict the spatial and temporal variation in SDS intensity in China.

2. Materials and Methods
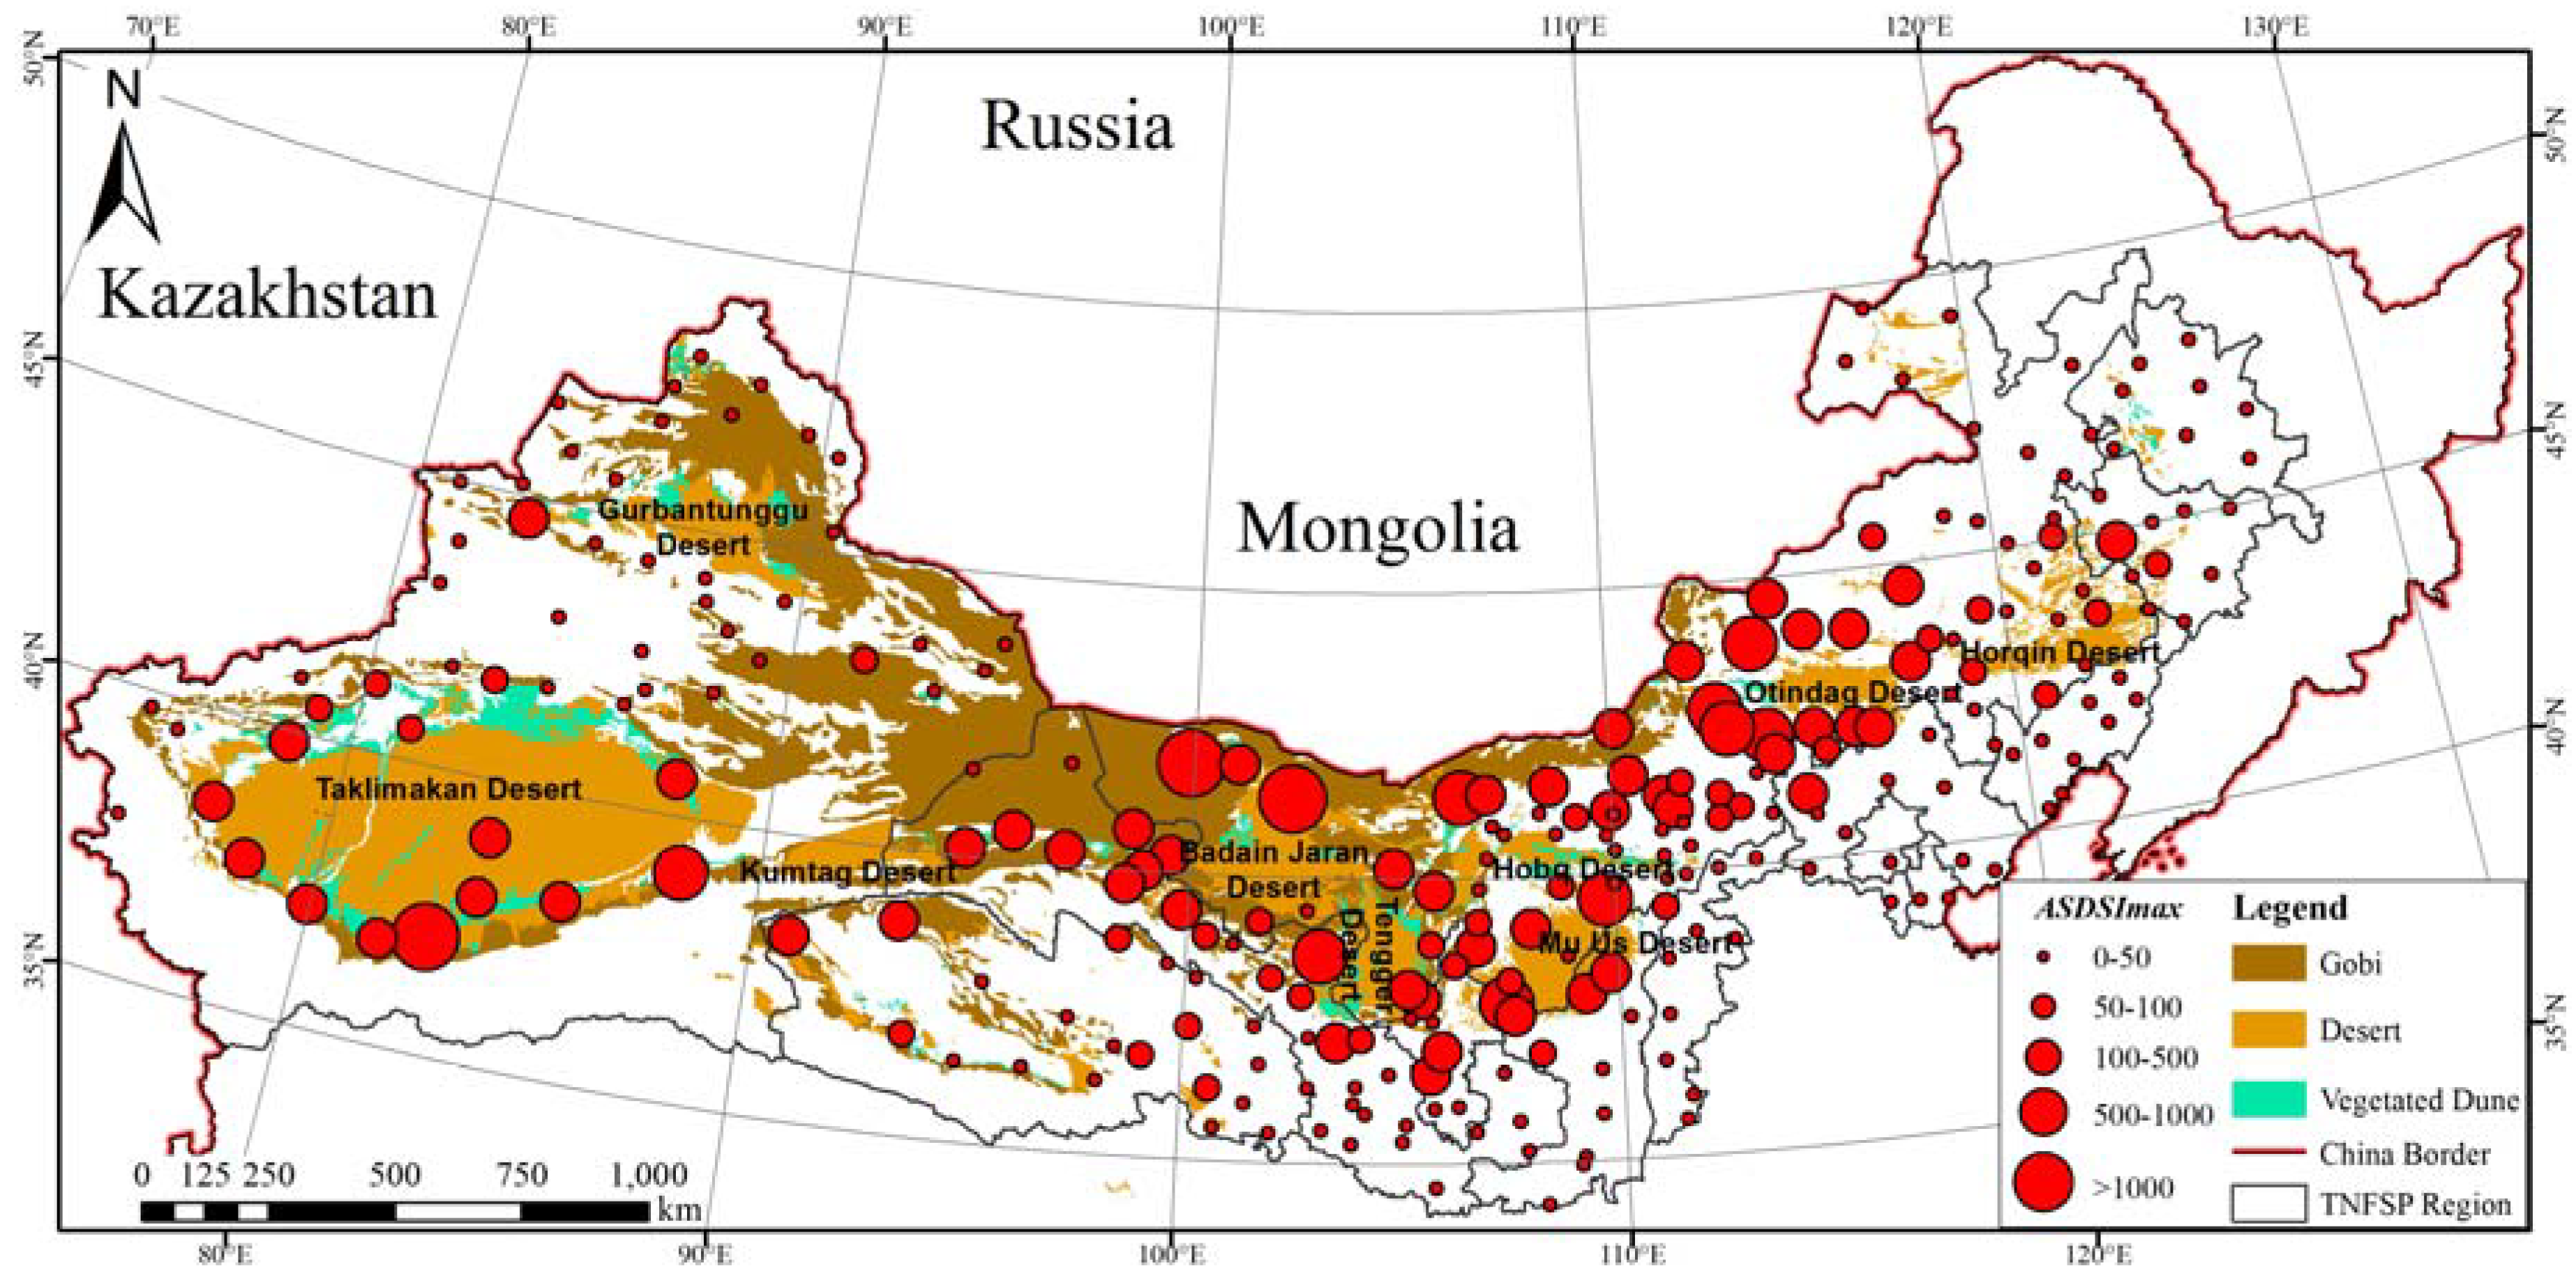
2.1. Study Area

By 2014, desertified land accounted for a total of 261 million ha in northeastern, northern, and northwestern China, which was approximately 28% of the country’s surface area [40,41]. Sand and dust storms have been occurring frequently in these regions, causing tremendous losses to the national economy and human lives. In order to combat SDS events, a series of afforestation programs were initiated and implemented by the Chinese government. Among them, the Three-North Forest Shelterbelt Program (TNFSP), which covers northeastern, northern, and northwestern China, is the most significant program enacted in response to desertification and SDS impact.
The Three-North Forest Shelterbelt Program (TNFSP) was launched in 1978 and is scheduled to end by 2050. The objective of this program was to combat desertification and control sand and dust events through afforestation and ecological restoration approaches. The TNFSP region is located between 73°26′ and 127°50′ E and 33°30′ and 50°12′ N, and covers eight deserts, four sand lands, and the Gobi area. This region includes 551 counties in 13 provinces, municipalities, and autonomous regions, stretching from Western Xinjiang to Heilongjiang in the northeast, and representing approximately 42% of the total land area of China (Figure 1).

2.2. Data

In this study, SDS data were extracted from the Chinese Sand and Dust Events Sequence and Supporting Dataset (1954–2007) (http://data.cma.cn/), which was collected by the China Meteorological Administration (CMA) from 798 meteorological observation stations. The dataset provides relevant information about sand and dust events, including the geographical location of each observation station (longitude and latitude), wind direction, maximum 10-min average wind speed (hereinafter refer to as wind speed), start time, end time, and visibility of each sand and dust event. The SDS dataset was obtained by selecting records with a visibility of less than 1 km, including sand and dust storms, strong sand and dust storms, and severe sand and dust storms. Before 1979, the visibility of sand and dust events at meteorological observation stations was recorded on a scale between 0 and 9, which is not consistent with the criterion afterward. Therefore, this study only incorporated SDS records from 1980 onward.

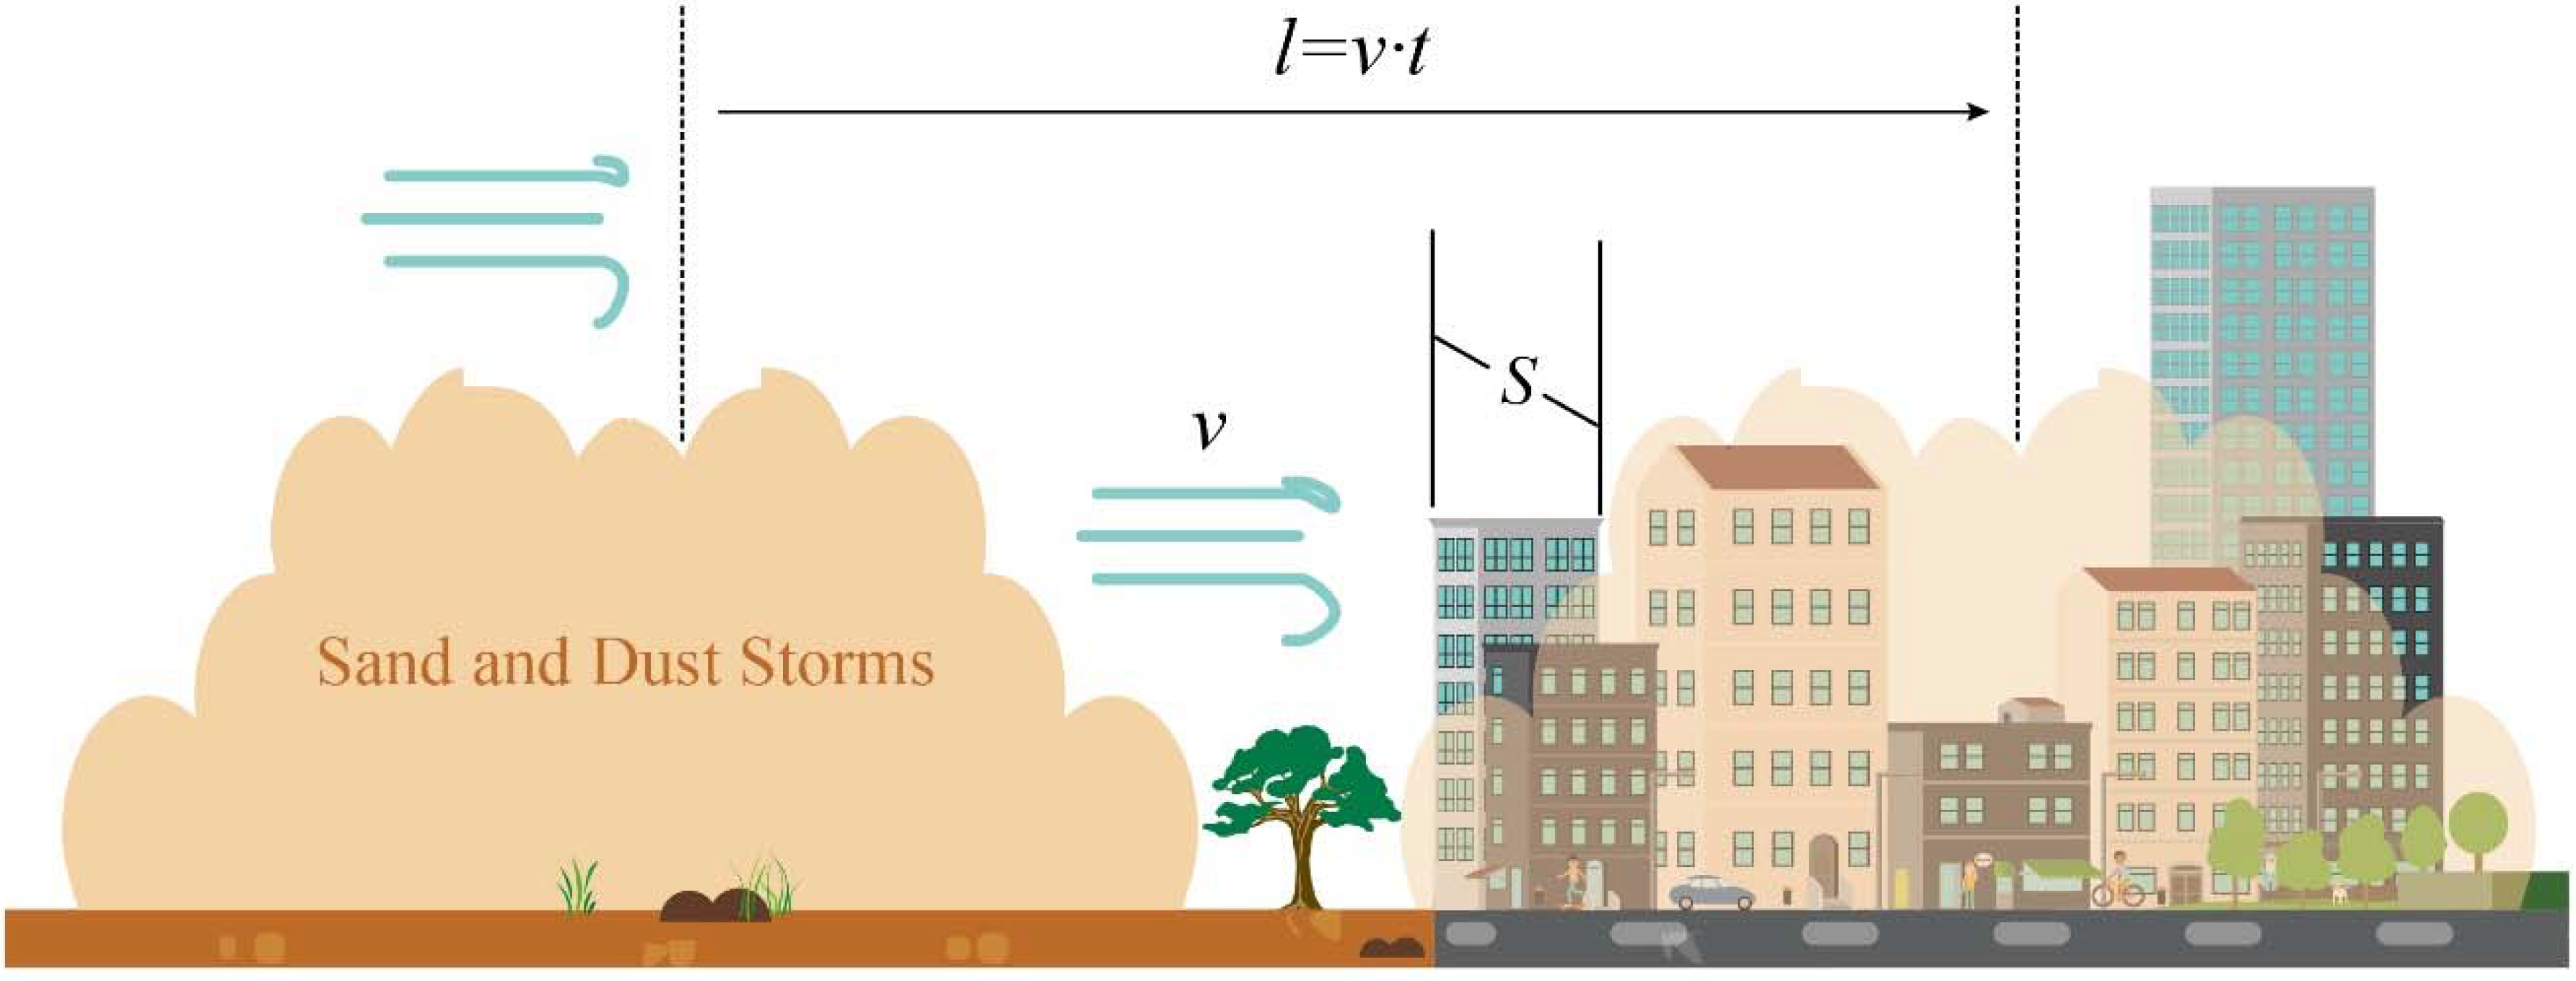
2.3. Sand and Dust Storms Index (SDSI)

The sand and dust storms index (SDSI) is defined as the amount of dust received by the object per unit area during an SDS event. The SDSI was developed to address the potential impacts of SDS on sensitive elements, such as population, infrastructure, agriculture, and livestock. In order to calculate the SDSI, we provide a simplified illustrative diagram in Figure 2. The SDSI is calculated as follows:
S D S I = m S = ρ V S = ρ l S S = ρ l = ρ v t
where m is the total mass of dust during an SDS event, S is the cross-sectional area of the object perpendicular to the direction of dust movement, ρ is the concentration of dust mass, V is the volume of the dust mass, l is the distance of dust movement, v is the velocity of dust movement, and t is the duration of the SDS event.
For the Chinese SDS sequence and supporting dataset, no information was recorded about the concentration of dust mass (ρ). However, ρ is closely correlated to the visibility of SDS events [42,43,44,45]. In this project, we replaced ρ by visibility using the equation below [46]:
ρ = 3802.29 × D v 0.84
where ρ is the dust concentration in ug m–3, and Dv is visibility in km. In addition, wind speed in the Chinese SDS sequence and supporting dataset is the maximum 10-min average wind speed; thus, we modified SDSI as SDSImax:
S D S I m a x = 3802.29 × D v 0.84 v m a x t
where SDSImax is the maximum possible SDSI during an SDS event, and vmax is the maximum 10- average wind speed. Thus, the final SDSImax at thminutee station level is defined as:
A S D S I m a x , j = i = 1 n S D S I m a x , j i T j
where ASDSImax,j is the final SDSImax at station j, n is the total number of SDS events recorded at station j, and Tj is the valid years at station j (although the dataset ranged from 1980 to 2007, not all of the stations had full records for the 28 years). Through this method, SDS frequency was also incorporated into SDSI, where SDS frequency is defined as the number of SDS records in this study.

3. Results and Discussion

3.1. Characteristics of ASDSImax and Its Components

From Figure 3, high values of ASDSImax were concentrated in southern Xinjiang, western and central inner Mongolia, Western and central Gansu, and north Ningxia. Particularly, Minfeng station, which is located on the southern edge of the Taklimakan Desert in Xinjiang, experienced the most significant SDS intensity from 1980 to 2007. The ASDSImax value of this station exceeded 146. The second highest ASDSImax value was recorded at the Guaizihu station of inner Mongolia, in the north of the Badain Jaran Desert. In addition, most of the stations with high values of ASDSImax were distributed around Gobi or deserts, such as the Taklimakan Desert, Badain Jaran Desert, Tengger Desert, and Mu Us Desert. These deserts have been recognized as important sources of sand and dust storms in China, and even East Asia [24,25,26,47]. SDS intensity was usually not severe at stations in northern Xinjiang, southern Shaanxi, Shanxi, Hebei, Tianjin, Beijing, and the three northeast provinces. The ASDSImax values at these stations were mostly below 25.
Since ASDSImax is developed based on SDS frequency, SDS visibility, SDS duration, and SDS wind speed, the characteristics of ASDSImax at different stations are determined by these components.
From Figure 4a, over half of the stations had an SDS frequency of less than 28, which means that these stations experienced sand and dust storms no more than once per year on average from 1980 to 2007. Seventeen stations had more than 280 records of sand and dust storms, of which most were located in Xinjiang and inner Mongolia. The highest SDS frequency was observed at Minfeng station, which also had the highest ASDSImax value. Among all of the SDS records, almost all of the SDS events reduced horizontal visibility to less than 500 m (Figure 4b), which means that these SDS events would probably be classified as strong or severe sand and dust storms. About 45% of the SDS events finished within one hour, whereas one-third of the SDS events lasted more than two hours (Figure 4c). The longest SDS event, which lasted more than 24 hours, was recorded at the Sonid Left Banner station in inner Mongolia in March 2002. In terms of spatial distribution, over 90% of the SDS events that were longer than two hours occurred in Xinjiang, inner Mongolia, Gansu, Ningxia, and Qinghai. Generally, the wind speed of the SDS events was not less than 5 m/s, and over half of the events had wind speeds varying between 10–17 m/s (Figure 4d). However, some stations, especially in inner Mongolia, Gansu, and Xinjiang, always experienced strong winds (>20 m/s) during the SDS events. The Alataw Pass station in Xinjiang recorded a wind speed that was greater than 40 m/s in April 1984.
Generally, SDS events occurred less than 10 times per year on average in the TNFSP region. However, most of the events led to a considerable reduction in visibility to even less than 50 m, and lasted longer than half an hour. In addition, an SDS event in the TNFSP region was usually accompanied by strong winds with wind speeds no less than 10 m/s. With strong winds and long duration, SDS events resulted in significant social and economic losses.

3.2. Comparison of SDSI and SDS Frequency

SDSI combines SDS frequency, visibility, duration, and wind speed, so the index can theoretically reflect SDS intensity. In this section, we compare the spatial and temporal variations between SDSI and SDS frequency, since SDS frequency has been most commonly used in the existing literature. Figure 5 shows the spatial comparison of ASDSImax and SDS frequency (FREQ) as a percent of the total. As with ASDSImax, FREQ is calculated as the number of records of sand and dust storms in the valid years:
F R E Q j = n T j
where n is the total number of records of sand and dust storms at station j, and Tj is the valid years at station j.
Generally, the ASDSImax and FREQ at each station have similar spatial distribution in terms of the percent of the total (Figure 5). The highest value of both ASDSImax and FREQ were calculated at Minfeng station, but the value of FREQ was lower than ASDSImax in terms of the percent of the total. Actually, the sand and dust storms that occurred at this station were not only the most frequent, but also always lasted longer with lower visibility. Therefore, SDS intensity could be underestimated if we used FREQ to reflect the intensity at Minfeng station. For Kelpin station at the northern edge of the Taklimakan Desert, FREQ was higher than ASDSImax as a percent of the total. Over two-thirds of the SDS events ended within half an hour at this station. At some stations in Qinghai, such as Mangnai station and Gangcha station, ASDSImax was also lower than FREQ. SDS events occurring at these stations usually had shorter durations or higher visibility. Compared to ASDSImax, FREQ also underestimated SDS intensity in inner Mongolia. Inner Mongolia is not just a source of sand and dust storms in China, as the region is also significantly affected by SDS events [41,47,48].
Additionally, the annual trends in total SDSImax and total FREQ for all of the stations are shown in Figure 6. Both annual SDSImax and annual FREQ decreased with fluctuations from 1980 to 2007, except in 2003 and 2006. Annual SDSImax ranged from approximately 720 to 4360, whereas annual FREQ varied between 266–1373. However, annual SDSImax provides a sharper contrast for reflecting the interannual change. Especially in 1983, 1989, 1997, 2001, and 2006, the peaks in annual SDSImax were higher, whereas the troughs in annual SDSImax were lower compared with those of annual FREQ. In fact, the sand and dust storms in the peak years were not only more frequent, but also stronger and caused much larger socioeconomic losses [49]. Therefore, SDSI is more sensitive than SDS frequency at reflecting the temporal variation in SDS events.
Further case studies and field validations are required to test the performance of SDSI in reflecting SDS intensity, but SDSI appears to be suitable for accurately characterizing sand and dust storms by combining SDS frequency, SDS visibility, SDS duration, and SDS wind speed [38,39,50]. Instead of SDS frequency, SDSI can be applied to studies that are relevant to SDS intensity. For example, the United Nations Convention to Combat Desertification (UNCCD) is developing global methodologies for SDS risk assessment and SDS vulnerability mapping for governments, policy makers, and communities for the prevention and mitigation of SDS impacts. A more accurate reflection of SDS intensity is an important factor for both methodologies; SDSI could improve the results of SDS risk assessment and SDS vulnerability mapping.

3.3. Major Transportation Routes of Sand and Dust Storms in the TNFSP Region

In order to trace the transportation routes of SDS events in the TNFSP region, the prevailing surface wind directions were drawn based on SDS records from each meteorological station. Stations with ASDSImax <1 and numbers of prevailing wind <10 were excluded to remove the interference of low-intensity SDS events and highlight the trend in SDS movements (Figure 7a).
Based on wind direction and the existing literature, the major transportation routes of sand and dust storms are illustrated (Figure 7b). Sand and dust storms caused by cold airflows from northern Asia (usually Siberian and Mongolian cyclones) [47,51] always sweep over Mongolia and inner Mongolia, and further extend toward the southeast and northeast provinces, such as Ningxia, Shaanxi, Shanxi, and Hebei. The airflows are occasionally blocked by the Beishan Mountains when passing across western inner Mongolia, so the sand and dust storms either turn right to northern Xinjiang or left into the Hexi Corridor of Gansu. The SDS routes mentioned above indicate one of the most significant SDS sources in the TNFSP region and East Asia: the Mongolian Plateau SDS source region, including deserts and Gobi deserts on the Mongolian Plateau and its southern extensions: the Ordos Plateau and Alxa Plateau [25,52,53,54].
The Taklimakan Desert in Tarim Basin is another important SDS source in the TNFSP region. The Tarim Basin is mostly surrounded by high mountains (especially the Tianshan Mountains to the north and the Kunlun Mountains to the south), except for an open area existing in the east. Two pathways of prevailing winds are responsible for SDS events in this region [55,56,57]. Westerly winds cross the Pamir Plateau and arrive in the Tarim Basin through Kashgar. Airflows in this direction usually do not move out of the Tarim Basin due to the blockage created by the Tianshan Mountains. Easterly winds flowing into the Tarim Basin from the east open area also play an important role in generating SDS activities in the Taklimakan Desert. Therefore, most of the SDS events occurring in the Taklimakan Desert would deposit into the desert, especially in the Hotan, Yutian, and Minfeng regions, where the convergence of the two prevailing winds lead to high-intensity sand and dust storms [47,58]. In addition to the ground surface SDS routes, the Taklimakan Desert is also regarded as a source of long-distance SDS events in the remote North Pacific Ocean, where dust particles are raised by strong upward winds that climb over the mountains [48].
In the spring and summer, westerly winds from Central Asia dominate Northern Xinjiang, and airflows usually move into this region through the Alataw Pass and the south edge of the Altai Mountains. Compared to southern Xinjiang, northern Xinjiang is not a major SDS source in the TNFSP region. However, airflows in this region usually spread into most parts of the TNFSP region, such as Qinghai, Gansu, and inner Mongolia, causing SDS events [57,59,60]. In this study, two SDS routes in Gansu and Qinghai were extracted due to the geographical settings. The Hexi Corridor in Gansu is located between the Beishan Mountains and Qilian Mountains, and borders Kumtag Desert to the west, Badain Jaran Desert to the north, and Tengger Desert to the east. Besides the local SDS source, the Hexi Corridor experiences SDS transported from the west (Gobi and Kumtag Desert) and north (Gobi, Badain Jaran Desert and Tengger Desert) [61,62,63]. In Qinghai, the Qaidam Basin is surrounded by the Qilian and Altun Mountains to the north and the Kunlun Mountains to the south. Therefore, the downwind areas of Qaidam Desert experience SDS events when westerly winds from Xinjiang flow into Qinghai [64].
Whether the Three-North Forest Shelterbelt Program is performing well in combating desertification and SDS events is still debatable, but countermeasures should be adopted in this region [65,66]. The map of the major transportation routes of sand and dust storms, combined with the results of SDSI, could help the government and policy makers more accurately and effectively address SDS issues. For example, Figure 5 indicates that SDS intensity is higher in inner Mongolia. Considering the major transportation routes in this region, more ecological projects should be implemented to restore rangelands and control the movement of sand and dust, especially in the upwind area [67,68]. The SDS routes also imply that SDS events originate from both inside and outside China [54,69]. Therefore, regional cooperation should be addressed to combat sand and dust storms.

4. Conclusions

Single parameters of sand and dust storms (SDS) cannot accurately reflect SDS characteristics. In this study, we developed a new index (SDSI) combining four parameters: SDS frequency, SDS visibility, SDS duration, and SDS wind speed. The distribution of ASDSImax at each station showed that southern Xinjiang, western and central Inner Mongolia, western and central Gansu, and north Ningxia usually experience intense sand and dust storms. Over half of the stations in the TNFSP region experienced sand and dust storms less than once per year on average, and the visibility of most SDS events was reduced to less than 500 m. In addition, one-third of the SDS events lasted more than two hours, and 45% finished within one hour. The wind speed during the SDS events usually ranged from 10 m/s to 17 m/s.
SDS intensity at Minfeng station was underestimated if SDS frequency instead of SDSI was used. SDS frequency also exaggerated the SDS intensity at stations such as Kelpin, Mangnai, and Ganghca. Compared with SDS frequency, SDSI is more sensitive to the temporal variation in SDS events, since it provides a sharper contrast for the interannual change. In general, SDSI characterized sand and dust storms more accurately, and this index can be applied to other SDS-related issues and studies.
Surface prevailing wind direction with an ASDSImax of less than 1 and a frequency of prevailing wind of less than 10 were used to extract major SDS transportation routes. Five transportation routes were identified in this study. The first originates from Mongolia and inner Mongolia, and usually sweeps over the entire TNFSP region. The second route circulates inside Tarim Basin in southern Xinjiang. Although the SDS route originating in Northern Xinjiang does not cause severe local SDS events frequently, it is a significant SDS pathway when moving forward to inner Mongolia, Gansu, and Qinghai. Another two SDS routes in Gansu and Qinghai were also identified due to their unique geographical settings. The SDSI map and SDS routes can help governments and policy makers enable regional cooperation and combat SDS events more effectively.

Author Contributions

H.C. and J.L. conceived and designed the methodology for this study; H.C., W.Z. and C.F. wrote the manuscript.

Acknowledgments

The authors appreciate the support from the secretariat of the United Nations Convention to Combat Desertification (UNCCD). This research is also funded by the CAS Key Laboratory of Lunar and Deep Space Exploration (Grant No. 16120452), and the National Natural Science Foundation of China (Grant No. 41701468).

Conflicts of Interest

The authors declare no conflict of interest.

References

  1. Middleton, N.; Kang, U. Sand and Dust Storms: Impact Mitigation. Sustainability 2017, 9, 1053. [Google Scholar] [CrossRef]
  2. World Meteorological Organization; United Nations Environment Programme. Establishing a WMO Sand and Dust Storm Warning Advisory and Assessment System Regional Node for West Asia: Current Capabilities and Needs; World Meteorological Organization: Geneva, Switerland, 2013. [Google Scholar]
  3. Middleton, N. Dust storms in the Middle East. J. Arid Environ. 1986, 10, 83–96. [Google Scholar]
  4. China Meteorological Administration. Classification of Sand and Dust Weather. General Administration of Quality Supervision, Inspection and Quarantine of the People’s Republic of China; Standardization Administration of the People’s Republic of China: Beijing, China, 2017.
  5. Wang, S.; Wang, J.; Zhou, Z.; Shang, K. Regional characteristics of three kinds of dust storm events in China. Atmos. Environ. 2005, 39, 509–520. [Google Scholar] [CrossRef]
  6. Zhang, K.; Chai, F.; Zhang, R.; Xue, Z. Source, route and effect of Asian sand dust on environment and the oceans. Particuology 2010, 8, 319–324. [Google Scholar] [CrossRef]
  7. Goudie, A.; Middleton, N.J. Desert Dust in the Global System; Springer Science & Business Media: Berlin, Germany, 2006. [Google Scholar]
  8. Al-Dousari, A.; Doronzo, D.; Ahmed, M. Types, Indications and Impact Evaluation of Sand and Dust Storms Trajectories in the Arabian Gulf. Sustainability 2017, 9, 1526. [Google Scholar] [CrossRef]
  9. Cao, H.; Liu, J.; Wang, G.; Yang, G.; Luo, L. Identification of sand and dust storm source areas in Iran. J. Arid Land 2015, 7, 567–578. [Google Scholar] [CrossRef] [Green Version]
  10. Goudie, A.S. Dust storms: Recent developments. J. Environ. Manag. 2009, 90, 89–94. [Google Scholar] [CrossRef] [PubMed]
  11. United Nations Environment Programme; World Meteorological Organization; United Nations Convention to Combat Desertification. Global Assessment of Sand and Dust Storms; United Nations Environment Programme: Nairobi, Kenya, 2016. [Google Scholar]
  12. Shao, Y.; Wyrwoll, K.-H.; Chappell, A.; Huang, J.; Lin, Z.; McTainsh, G.H.; Mikami, M.; Tanaka, T.Y.; Wang, X.; Yoon, S. Dust cycle: An emerging core theme in Earth system science. Aeolian Res. 2011, 2, 181–204. [Google Scholar] [CrossRef]
  13. Goudarzi, G.; Daryanoosh, S.M.; Godini, H.; Hopke, P.K.; Sicard, P.; De, M.A.; Rad, H.D.; Harbizadeh, A.; Jahedi, F.; Mohammadi, M.J. Health risk assessment of exposure to the Middle-Eastern Dust storms in the Iranian megacity of Kermanshah. Public Health 2017, 148, 109–116. [Google Scholar] [CrossRef] [PubMed]
  14. Khaniabadi, Y.O.; Daryanoosh, M.; Sicard, P.; Takdastan, A.; Hopke, P.K.; Esmaeili, S.; De Marco, A.; Rashidi, R. Chronic obstructive pulmonary diseases related to outdoor PM10, O3, SO2, and NO2 in a heavily polluted megacity of Iran. Environ. Sci. Pollut. Res. Int. 2018, 25, 17726–17734. [Google Scholar] [CrossRef] [PubMed]
  15. Khaniabadi, Y.O.; Daryanoosh, S.M.; Amrane, A.; Polosa, R.; Hopke, P.K.; Goudarzi, G.; Mohammadi, M.J.; Sicard, P.; Armin, H. Impact of Middle Eastern Dust storms on human health. Atmos. Pollut. Res. 2017, 8, 606–613. [Google Scholar] [CrossRef] [Green Version]
  16. Khaniabadi, Y.O.; Fanelli, R.; De Marco, A.; Daryanoosh, S.M.; Kloog, I.; Hopke, P.K.; Conti, G.O.; Ferrante, M.; Mohammadi, M.J.; Babaei, A.A.; et al. Hospital admissions in Iran for cardiovascular and respiratory diseases attributed to the Middle Eastern Dust storms. Environ. Sci. Pollut. Res. Int. 2017, 24, 16860–16868. [Google Scholar] [CrossRef] [PubMed]
  17. Geravandi, S.; Sicard, P.; Khaniabadi, Y.O.; De Marco, A.; Ghomeishi, A.; Goudarzi, G.; Mahboubi, M.; Yari, A.R.; Dobaradaran, S.; Hassani, G.; et al. A comparative study of hospital admissions for respiratory diseases during normal and dusty days in Iran. Environ. Sci. Pollut. Res. Int. 2017, 24, 18152–18159. [Google Scholar] [CrossRef] [PubMed]
  18. Tozer, P.; Leys, J. Dust storms ? what do they really cost? Rangel. J. 2013, 35, 131–142. [Google Scholar] [CrossRef]
  19. Chen, J.; Li, G. Geochemical studies on the source region of Asian dust. Sci. China Earth Sci. 2011, 54, 1279–1301. [Google Scholar] [CrossRef]
  20. Shao, Y.; Dong, C.H. A review on East Asian dust storm climate, modelling and monitoring. Glob. Planet. Chang. 2006, 52, 1–22. [Google Scholar] [CrossRef]
  21. Wang, X.; Huang, J.; Ji, M.; Higuchi, K. Variability of East Asia dust events and their long-term trend. Atmos. Environ. 2008, 42, 3156–3165. [Google Scholar] [CrossRef]
  22. Youlin, Y.; Squires, V.; Qi, L. Global Alarm: Dust and Sandstorms from the World’s Drylands; United Nations: Bangkok, Thailand, 2001.
  23. Cao, H.; Amiraslani, F.; Liu, J.; Zhou, N. Identification of dust storm source areas in West Asia using multiple environmental datasets. Sci. Total Environ. 2015, 502, 224–235. [Google Scholar] [CrossRef] [PubMed]
  24. Li, G.; Chen, J.; Chen, Y.; Yang, J.; Ji, J.; Liu, L. Dolomite as a tracer for the source regions of Asian dust. J. Geophys. Res. Atmos. 2007, 112. [Google Scholar] [CrossRef] [Green Version]
  25. Xuan, J.; Sokolik, I.N.; Hao, J.; Guo, F.; Mao, H.; Yang, G. Identification and characterization of sources of atmospheric mineral dust in East Asia. Atmos. Environ. 2004, 38, 6239–6252. [Google Scholar] [CrossRef]
  26. Yang, J.; Li, G.; Rao, W.; Ji, J. Isotopic evidences for provenance of East Asian Dust. Atmos. Environ. 2009, 43, 4481–4490. [Google Scholar] [CrossRef]
  27. Yan, Y.; Sun, Y.; Ma, L.; Long, X. A multidisciplinary approach to trace Asian dust storms from source to sink. Atmos. Environ. 2015, 105, 43–52. [Google Scholar] [CrossRef]
  28. Li, G.; Chen, J.; Ji, J.; Yang, J.; Conway, T.M. Natural and anthropogenic sources of East Asian dust. Geology 2009, 37, 727–730. [Google Scholar] [CrossRef]
  29. Kim, J. Transport routes and source regions of Asian dust observed in Korea during the past 40 years (1965–2004). Atmos. Environ. 2008, 42, 4778–4789. [Google Scholar] [CrossRef]
  30. Shi, P.; Yan, P.; Yuan, Y.; Nearing, M.A. Wind erosion research in China: Past, present and future. Prog. Phys. Geogr. 2004, 28, 366–386. [Google Scholar] [CrossRef]
  31. Yang, H.; Zhang, X.; Zhao, F.; Wang, J.A.; Shi, P.; Liu, L. Mapping Sand-dust Storm Risk of the World. In World Atlas of Natural Disaster Risk; Shi, P., Kasperson, R., Eds.; Springer: Berlin/Heidelberg, Germany, 2015; pp. 115–150. [Google Scholar]
  32. Al-Hemoud, A.; Al-Sudairawi, M.; Neelamanai, S.; Naseeb, A.; Behbehani, W. Socioeconomic effect of dust storms in Kuwait. Arab. J. Geosci. 2017, 10, 18. [Google Scholar] [CrossRef]
  33. Daryanoosh, M.; Goudarzi, G.; Rashidi, R.; Keishams, F.; Hopke, P.K.; Mohammadi, M.J.; Nourmoradi, H.; Sicard, P.; Takdastan, A.; Vosoghi, M. Risk of morbidity attributed to ambient PM10 in the western cities of Iran. Toxin Rev. 2017. [Google Scholar] [CrossRef]
  34. Liu, G.; Park, S.U. The logarithm-linear relationship of the occurrence frequency to the duration of sand–dust storms: Evidence from observational data in China. J. Arid Environ. 2007, 71, 243–249. [Google Scholar] [CrossRef]
  35. Yao, Z.; Xiao, J.; Li, C.; Zhu, K. Regional characteristics of dust storms observed in the Alxa Plateau of China from 1961 to 2005. Environ. Earth Sci. 2010, 64, 255–267. [Google Scholar] [CrossRef]
  36. Wang, X.; Zhou, Z.; Dong, Z. Control of dust emissions by geomorphic conditions, wind environments and land use in northern China: An examination based on dust storm frequency from 1960 to 2003. Geomorphology 2006, 81, 292–308. [Google Scholar] [CrossRef]
  37. O’Loingsigh, T.; McTainsh, G.H.; Tews, E.K.; Strong, C.L.; Leys, J.F.; Shinkfield, P.; Tapper, N.J. The Dust Storm Index (DSI): A method for monitoring broadscale wind erosion using meteorological records. Aeolian Res. 2014, 12, 29–40. [Google Scholar] [CrossRef]
  38. Tan, M.; Li, X.; Xin, L. Intensity of dust storms in China from 1980 to 2007: A new definition. Atmos. Environ. 2014, 85, 215–222. [Google Scholar] [CrossRef]
  39. Wang, R.; Liu, B.; Li, H.; Zou, X.; Wang, J.; Liu, W.; Cheng, H.; Kang, L.; Zhang, C. Variation of strong dust storm events in Northern China during 1978–2007. Atmos. Res. 2017, 183, 166–172. [Google Scholar] [CrossRef]
  40. State Forestry Administration, People’s Republic of China. The Desertification and Sandification State of China: Bulletin; State Forestry Administration: Beijing, China, 2015.
  41. Wang, X.; Dong, Z.; Zhang, J.; Liu, L. Modern dust storms in China: An overview. J. Arid Environ. 2004, 58, 559–574. [Google Scholar] [CrossRef]
  42. Camino, C.; Cuevas, E.; Basart, S.; Alonso-Pérez, S.; Baldasano, J.M.; Terradellas, E.; Marticorena, B.; Rodríguez, S.; Berjón, A. An empirical equation to estimate mineral dust concentrations from visibility observations in Northern Africa. Aeolian Res. 2015, 16, 55–68. [Google Scholar] [CrossRef] [Green Version]
  43. Chepil, W.S.; Woodruff, N.P. Sedimentary Characteristics of Dust Storms 2. Visibility and dust concentration. Am. J. Sci. 1957, 255, 104–114. [Google Scholar] [CrossRef]
  44. Zhao, H.; Che, H.; Ma, Y.; Xia, X.; Wang, Y.; Wang, P.; Wu, X. Temporal variability of the visibility, particulate matter mass concentration and aerosol optical properties over an urban site in Northeast China. Atmos. Res. 2015, 166, 204–212. [Google Scholar] [CrossRef]
  45. Baddock, M.C.; Strong, C.L.; Leys, J.F.; Heidenreich, S.K.; Tews, E.K.; McTainsh, G.H. A visibility and total suspended dust relationship. Atmos. Environ. 2014, 89, 329–336. [Google Scholar] [CrossRef] [Green Version]
  46. Shao, Y. Northeast Asian dust storms: Real-time numerical prediction and validation. J. Geophys. Res. 2003, 108. [Google Scholar] [CrossRef] [Green Version]
  47. Qian, W.; Tang, X.; Quan, L. Regional characteristics of dust storms in China. Atmos. Environ. 2004, 38, 4895–4907. [Google Scholar] [CrossRef]
  48. Sun, J.; Zhang, M.; Liu, T. Spatial and temporal characteristics of dust storms in China and its surrounding regions, 1960–1999: Relations to source area and climate. J. Geophys. Res. Atmos. 2001, 106, 10325–10333. [Google Scholar] [CrossRef]
  49. China Meteorological Administration. Sand-Dust Weather Yearbook; China Meteorological Press: Beijing, China, 2001–2011.
  50. Xuan, J.; Sokolik, I.N. Characterization of sources and emission rates of mineral dust in Northern China. Atmos. Environ. 2002, 36, 4863–4876. [Google Scholar] [CrossRef]
  51. Wang, X.; Zhang, C.; Wang, H.; Qian, G.; Luo, W.; Lu, J.; Wang, L. The significance of Gobi desert surfaces for dust emissions in China: An experimental study. Environ. Earth Sci. 2011, 64, 1039–1050. [Google Scholar] [CrossRef]
  52. Wang, X.; Xia, D.; Wang, T.; Xue, X.; Li, J. Dust sources in arid and semiarid China and southern Mongolia: Impacts of geomorphological setting and surface materials. Geomorphology 2008, 97, 583–600. [Google Scholar] [CrossRef]
  53. Laurent, B.; Marticorena, B.; Bergametti, G.; Mei, F. Modeling mineral dust emissions from Chinese and Mongolian deserts. Glob. Planet. Chang. 2006, 52, 121–141. [Google Scholar] [CrossRef]
  54. Jugder, D.; Shinoda, M.; Sugimoto, N.; Matsui, I.; Nishikawa, M.; Park, S.-U.; Chun, Y.-S.; Park, M.-S. Spatial and temporal variations of dust concentrations in the Gobi Desert of Mongolia. Glob. Planet. Chang. 2011, 78, 14–22. [Google Scholar] [CrossRef]
  55. Shao, Y.; Wang, J. A climatology of Northeast Asian dust events. Meteorol. Z. 2003, 12, 187–196. [Google Scholar] [CrossRef]
  56. Uno, I.; Harada, K.; Satake, S.; Hara, Y.; Wang, Z.F. Meteorological characteristics and dust distribution of the Tarim Basin simulated by the nesting RAMS/CFORS dust model. J. Meteorol. Soc. Jpn. 2005, 83A, 219–239. [Google Scholar] [CrossRef]
  57. Chen, Y.; Zhang, W.; Chen, C.; Du, P.; Wang, X. Two types of the dust storms caused by cold air crossing the mountains in Xinjiang. In Proceedings of the Third International Asia-Pacific Environmental Remote Sensing, Remote Sensing of the Atmosphere, Ocean, Environment, and Space, Hangzhou, China, 23–27 October 2002. [Google Scholar]
  58. Wang, H.; Jia, X. Field Observations of Windblown Sand and Dust in the Takimakan Desert, NW China, and Insights into Modern Dust Sources. Land Degrad. Dev. 2013, 24, 323–333. [Google Scholar] [CrossRef]
  59. Abuduwaili, J.; Gabchenko, M.V.; Junrong, X. Eolian transport of salts—A case study in the area of Lake Ebinur (Xinjiang, Northwest China). J. Arid Environ. 2008, 72, 1843–1852. [Google Scholar] [CrossRef]
  60. Ge, Y.; Abuduwaili, J.; Ma, L.; Wu, N.; Liu, D. Potential transport pathways of dust emanating from the playa of Ebinur Lake, Xinjiang, in arid northwest China. Atmos. Res. 2016, 178–179, 196–206. [Google Scholar] [CrossRef]
  61. Yan, C.Z.; Zhou, Y.M.; Song, X.; Duan, H.C. Estimation of areas of sand and dust emission in the Hexi Corridor from a land cover database: An approach that combines remote sensing with GIS. Environ. Geol. 2008, 57, 707–713. [Google Scholar] [CrossRef]
  62. Zhang, Z.; Dong, Z.; Li, J.; Qian, G.; Jiang, C. Implications of surface properties for dust emission from gravel deserts (gobis) in the Hexi Corridor. Geoderma 2016, 268, 69–77. [Google Scholar] [CrossRef]
  63. Wang, X.; Huang, N.; Dong, Z.; Zhang, C. Mineral and trace element analysis in dustfall collected in the Hexi Corridor and its significance as an indicator of environmental changes. Environ. Earth Sci. 2009, 60, 1–10. [Google Scholar] [CrossRef]
  64. Qiang, M.; Chen, F.; Zhou, A.; Xiao, S.; Zhang, J.; Wang, Z. Impacts of wind velocity on sand and dust deposition during dust storm as inferred from a series of observations in the northeastern Qinghai–Tibetan Plateau, China. Powder Technol. 2007, 175, 82–89. [Google Scholar] [CrossRef]
  65. Tan, M.; Li, X. Does the Green Great Wall effectively decrease dust storm intensity in China? A study based on NOAA NDVI and weather station data. Land Use Policy 2015, 43, 42–47. [Google Scholar] [CrossRef] [Green Version]
  66. Wang, X.M.; Zhang, C.X.; Hasi, E.; Dong, Z.B. Has the Three Norths Forest Shelterbelt Program solved the desertification and dust storm problems in arid and semiarid China? J. Arid Environ. 2010, 74, 13–22. [Google Scholar] [CrossRef]
  67. Han, J.; Zhang, Y.; Wang, C.; Bai, W.; Wang, Y.; Han, G.; Li, L. Rangeland degradation and restoration management in China. Rangel. J. 2008, 30, 233–239. [Google Scholar] [CrossRef] [Green Version]
  68. Zhang, Q.-Y.; Zhao, X.-Y.; Zhang, Y.; Li, L. Preliminary study on sand-dust storm disaster and countermeasures in China. Chin. Geogr. Sci. 2002, 12, 9–13. [Google Scholar] [CrossRef]
  69. Natsagdorj, L.; Jugder, D.; Chung, Y.S. Analysis of dust storms observed in Mongolia during 1937–1999. Atmos. Environ. 2003, 37, 1401–1411. [Google Scholar] [CrossRef] [Green Version]
Figure 1. Three-North Forest Shelterbelt Program (TNFSP) region in China.
Sustainability 10 02372 g001
Figure 2. Illustrative diagram for the calculation of the sand and dust storms index (SDSI).
Sustainability 10 02372 g002
Figure 3. The final SDSImax (ASDSImax) at each station in the TNFSP region, from 1980 to 2007.
Sustainability 10 02372 g003
Figure 4. Statistics of SDSI components in the TNFSP region from 1980 to 2007 obtained from all of the SDS records: (a) the distribution of SDS frequency; (b) the distribution of SDS visibility; (c) the distribution of SDS duration; and (d) the distribution of SDS wind speed of all of the SDS records.
Sustainability 10 02372 g004
Figure 5. Spatial variation of ASDSImax and FREQ as percent of total.
Sustainability 10 02372 g005
Figure 6. Changes in annual SDSImax and annual sand and dust storms (SDS) frequency (FREQ) of all of the stations in the TNFSP region from 1980 to 2007.
Sustainability 10 02372 g006
Figure 7. Major transportation routes of sand and dust storms in the TNFSP region: (a) for prevailing surface wind directions at stations; and (b) for transportation routes extracted based on prevailing surface wind directions and the existing literature [30,48,52].
Sustainability 10 02372 g007

