1. Introduction
Value chains and production networks have been increasingly complicated by globalization. Companies benefit from global comparative advantages through the disintegration of the production process, in which each country specializes in narrow stages, such as component production, assembly, and research and development. Over the years, China has been known for dominating global production due to the booming Chinese market and its relatively low production costs and wages. However, as China’s economy has matured, the initial advantages for investors have diminished. Many manufacturers are expanding their investments beyond China, in what is called the “China Plus One Strategy”, to other Asian countries, such as Vietnam, Indonesia, Thailand, and Myanmar. Developing economies are increasingly implementing GVCs, and China tends to export more intermediate goods to support their final goods exports to the global market. Of these countries, Vietnam is emerging as one of the most favored destinations for export-oriented foreign investors when compared to other ASEAN countries. It is also a major manufacturing hub for electronics production, contributed to significantly by the presence of two giant South Korean electronics companies, Samsung and LG. Hence, the adequate transport routes from China to Vietnam contribute significantly to a seamless supply chain.
Furthermore, for such high-value cargoes as electronic components’ increasingly globalizing process, route selection is more complicated and critical than for other general cargoes, requiring various considerations to ensure safety and security [
1] Kilic et al. [
2], Yu and Solvang [
3] also pointed out the routing problems which take an important role in the total logistics chain for electrical products and electrical waste. Deriving from the advantages of geographical proximity and the two countries’ promotion of sustainable cooperation, the transportation network from northern Vietnam to southern China is well connected by the main transportation modes: maritime, airway, railway, and trucking. Although the airway route would take priority in transporting high-value products that require reliability and security, the cross-border transport (CBT) for electronics and hi-tech cargo between China and Vietnam has been considerably developed in recent years. The Greater Mekong Subregion Economic Cooperation Program has enhanced the two countries’ economic relations, further boosting the proposed route. The advantages of the route are derived from its lower cost than air transport and its lower risk than seaway transport. Thus, a comparative analysis of the competitiveness of transport routes is of paramount importance to select an appropriate route for transporting electronics products that ensure safety and security performance and simultaneously provide an economic efficiency.
Some studies that have reviewed and assessed the performance of transport corridors have focused on Northeast and Central Asia [
4] and Southeast Asia and east–west economic corridors [
5]; however, few studies have evaluated the north–south economic corridor. Only scant research has focused on route analysis of electronic components from China to Vietnam. Therefore, the present study aimed to assess the competitiveness of transport routes by examining the decision-making process for selecting routes for electronics products from China to Vietnam through an empirical study of door-to-door transport from Shenzhen (China) to Hai Phong (Vietnam). The problem was solved using real data to assess the logistics service providers (LSPs) and shippers, who take leading roles in deciding route selection. The Delphi method and the Consistent Fuzzy Preference Relations (CFPR) method are employed to achieve the objective. As a result, crucial academic and practical implications are presented.
2. Literature Review
In the literature, several decision models have been developed for complex decision-making problems of the forward and reverse logistics chains for electrical and electronics products and wastes such as logistics network design [
1,
2,
3]. Particularly, one of the most pivotal decisions is transport route selection [
6]. Indeed, transport researchers have made significant efforts to understand the best process for choosing between different modes. The literature on solving routing problems can be classified into three main streams using mathematical algorithms, cost–benefit analysis, and multi criteria decision-making methods.
Numerous studies have determined optimal transport routes by applying mathematical algorithms to minimize cost and time, such as mixed-integer and dynamic programming. The cost and stocking of an intermodal multi-commodity routing problem using ground and maritime transportation has been studied using two mixed-integer programs [
7], and a generalized interval fuzzy mixed-integer programming model has been proposed to deal with a multimodal freight transportation problem in an uncertain environment [
8]. Elsewhere, Pareto optimal solutions have been applied to real intermodal routes from Busan to Rotterdam [
9], and a cost model framework for selecting the optimal route for iron ore shipments between northwest Australia and northeast China has been proposed [
10]. The specific problems of moving hazardous material via multimodal transportation have been examined by multiplying mixed-integer programming [
11]. The main drawback in these studies is the focus on specific cargoes and industries, meaning that they cannot be extended to other circumstances [
10].
Other studies used mathematical formulae to consider additional expenses and other factors in transport choice, such as inventory and in-transit costs. In one study, 36 freight alternatives from China to India were evaluated, and the most competitive routes were identified by minimizing total distribution cost, total transit time, and transit time variability using a cost model and a goal programming model [
12]. In addition, binary choice models have been used to examine the differences between trucks and railways for transporting cargo in the US [
13]. Shipment-specific variables, such as distance, weight, and value, and mode-specific variables, such as haul time and cost, are influential factors affecting truck and rail competition. The real total costs for a Korean auto-parts company transporting goods from Korea to the US have been investigated using the inventory theory model [
14], and a mixed-integer linear programming model for route selection, based on minimizing total energy consumption, has also been proposed [
15].
The second literature stream has applied the classic economic model of cost–benefit analysis to examine regional empirical examples of saving shipment time and costs. The time–cost–distance methodology is simple, using graphical illustrations of cost and time variables to identify inefficiencies and bottlenecks in each route [
14]. The international intermodal transport corridors connecting northeastern and Central Asia have been reviewed [
4], as has the route connecting Southeast Asia [
5]. Furthermore, shipment time variability has been estimated using stated preference data by shippers to provide a more accurate evaluation of cross-border transport routes in the Greater Mekong Subregion [
16]. The cost and distance of seven possible multimodal routes for transporting laptops from Chongqing to Rotterdam has also been analyzed [
17].
Another literature stream of routing solutions applies multiple criteria decision-making (MCDM), a process that considers not only cost and time but other factors, such as reliability, security, and safety. Problems in multimodal transport routing have been solved by integrating a fuzzy analytic hierarchy process (AHP) and artificial neural network theory [
18]. Similarly, fuzzy AHP has been applied to identify the relative importance of the different attributes of intermodal freight transportation [
19]. This study generated a hierarchical framework of four functional attributes (logistics cost, service quality, reliability, and security) comprising 13 key factors. The results demonstrated that a lack of coordination between modes would be a barrier to an intermodal system. The competitiveness of six multimodal rail and sea routes from Korea to Europe was examined by applying the technique for order of preference by similarity to ideal solution (TOPSIS) and triangular fuzzy number, and priorities for the alternatives were based on both qualitative and quantitative factors [
20]. Moreover, a fuzzy Delphi method has elsewhere been applied to identify the optimal transport route from Korea to Central Asia for secondhand vehicle exports, combining expert opinion and real data to assess three alternatives, with total cost prioritized [
21]. Recently, a hybrid fuzzy Delphi-ELECTRE I methodology was proposed to assess intermodal routes from Korea to Central Asia under China’s Silk Road Economic Belt from the perspective of LSPs [
22].
The existing literature includes numerous multimodal route studies that emphasize mathematical algorithms and models for selecting routes according to minimum cost and time [
7,
8,
11]. However, the decision-making process for selecting an intermodal route involves multiple criteria with multiple objectives, of which some qualitative factors, such as service quality and reliability, cannot be accurately illustrated in mathematical models [
22]. Moreover, a factor’s significance is not always consistent from case to case, industry to industry, or company to company, resulting in various decision-making processes [
23]. Clarifying the problem for a specific route and industry is important for satisfying its distinct standards and characteristics. For example, high-value cargo, such as electronics parts and components, requires high security and safety, yet these concerns are seldom considered in the transportation of this product category. While the problems of safety and security for electronics products have continued to increase the complexity of global production, little research has directly addressed these issues in the supply chain [
1]. Hence, the present study aims to fill this gap by assessing multimodal routes from China to Vietnam for electronic components and spare parts. The methods are based on both quantitative and qualitative factors; for example, the CFPR approach uses both real data and expert opinion. Furthermore, the transport route selection for door-to-door service is reviewed from the perspective of shippers and LSPs.
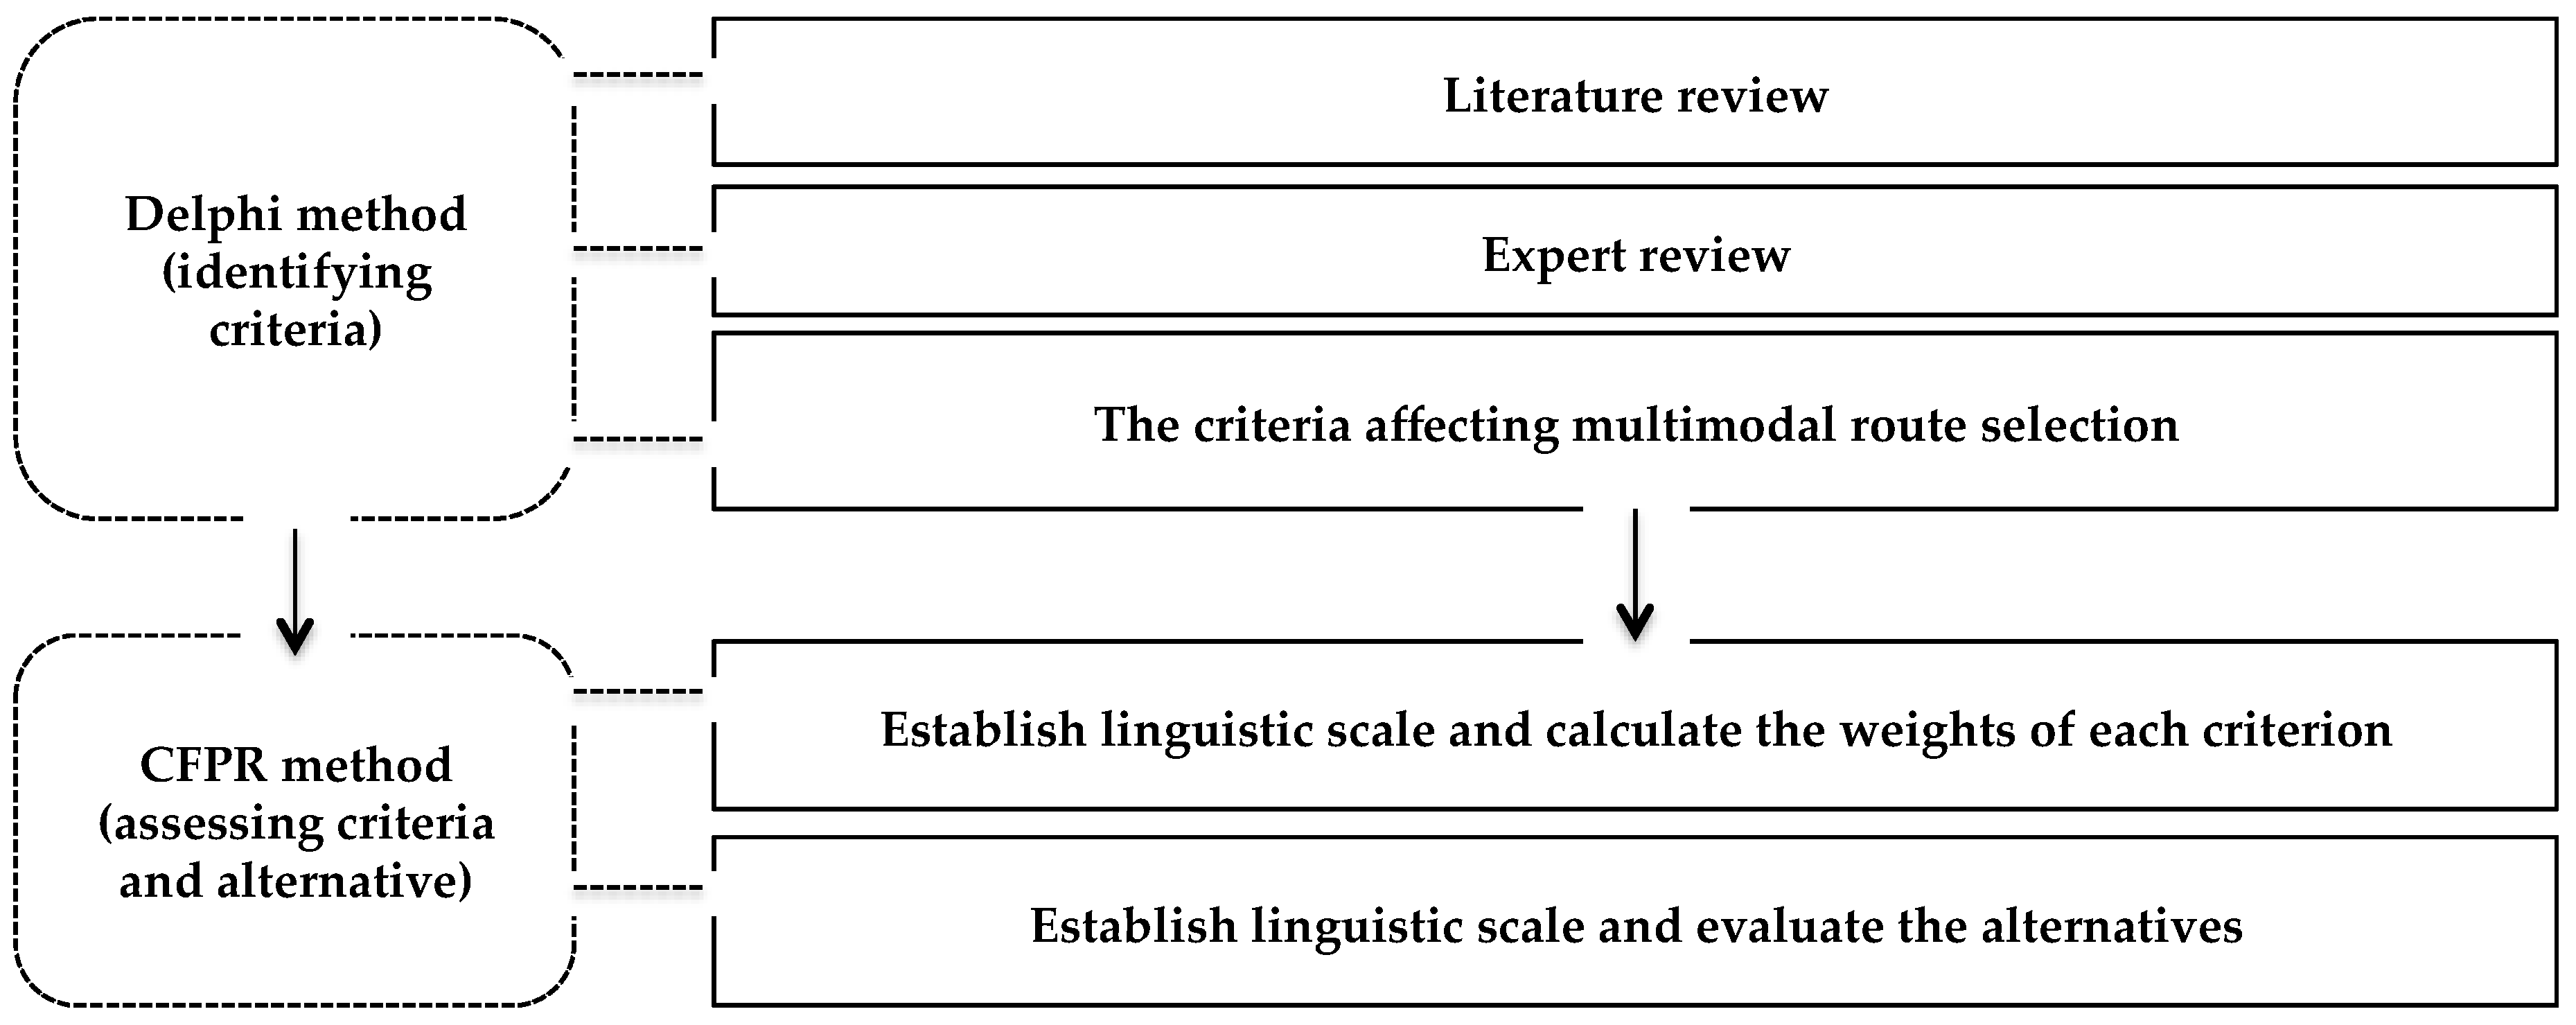
3. Methodology
In this study, the CFPR method was applied to solve the MCDM problem of transport routes for electronic components and parts. The Delphi method was employed to obtain a hierarchy of criteria comparing decision-affecting factors at the same level of importance [
24]. Although a small sample was used, the Delphi method’s results were objective and reasonable [
25,
26].
The CFPR method assisted in evaluating the process of route selection by identifying priorities for the alternatives through computational simplicity and consistency [
27]. The CFPR method has also been used to solve multiple decision-making problems in the literature [
27,
28,
29,
30], as illustrated in
Figure 1. A decision on selecting a transport route is an MCDM problem under uncertainty, including quantitative and qualitative determinants [
22]. Expert knowledge would be significant for solving the problem if there was no real data. However, the preferential model can cause imprecise and vague expert opinions in the decision-making process [
31] due to limited comparison of numerical values [
32]. To that end, fuzzy theory using the linguistics scale has commonly been used to overcome the problem of uncertain and imprecise evaluations [
33] from its first introduction [
34] to more recent adaptations [
35,
36].
3.1. The Delphi Method
The RAND Corporation originally developed the Delphi method in the 1950s to forecast the effect of technology on warfare. The method’s objective is obtaining the most reliable consensus from a repeated “group response” to sequential questionnaires to deal with a complex problem [
37]. Hence, the method is applied to a wide variety of fields as a technique to identify and prioritize issues for managerial decision-making [
25,
38,
39,
40,
41,
42,
43,
44,
45,
46]. The Delphi method involves a group of anonymous experts, who have had experience in and knowledge of a particular topic, replying to questionnaires. This method’s characteristics include “anonymity”, “iteration”, “controlled feedback”, and “statistical aggregation of group response” [
47]. A group of 5–9 experts is adequate to achieve a rational evaluation [
48].
3.2. The CFPR Method
This study applied the CFPR method developed by Herrera-Viedma et al. [
49] to evaluate the intermodal route choice. The CFPR method establishes pairwise comparison preference matrices for decision-making defined by the additive transitivity property.
Moreover, to overcome the problem of uncertain and imprecise evaluations, linguistics scale is powerful tool the method utilized fuzzy theory using the linguistics scale [
33]. Fuzzy set theory was firstly introduced by Zadeh [
34] using triangle fuzzy numbers. Fuzzy three-dimensional fuzzy term set was recently proposed by Centobelli [
35]. This study applied key definitions and propositions of Chen and Chao [
28] with the following improvements: (1) the scale of relative importance was reduced from 9 to 5 to make judgment simpler (
Table 1), and the pairwise comparisons reduced the intensities of importance from 17 to 9, resulting in an increased possibility of receiving responses; and (2) in adopting the CFPR method, the evaluation criteria involved both quantitative and qualitative factors. In terms of the quantitative factors, real data were acquired, and the qualitative factors were collected via questionnaires.
3.2.1. Preference Relations
Decision-makers decide preference relations by scoring a set of the criteria and a set of alternatives; the value illustrates the preference rate of the two criteria or alternatives. Two preference relations were applied: (1) the multiplicative preference relation; and (2) the fuzzy preference relation.
- (1)
In the multiplicative preference relation A, experts express their preferences for a set of alternatives X, which are denoted by a preference relation matrix
, in which
indicates the ratio of the preference ratio of alternative
to
.
As
denotes an equivalence between
and
, and as
denotes that
is absolutely preferred to
, the preference relation R is proposed to be a multiplicative reciprocal:
- (2)
In the fuzzy preference relation, the ratio of the preference intensity of alternative
to that of
is indicated by expert assessments of a set of alternatives, in which
indicates a positive preference relation matrix
with membership function
. When
, there is no difference between
and
, whereas
indicates that
is absolutely preferred to
Indicates that
is absolutely preferred to
; and
indicates that
is preferred to
. Thus,
is an additive reciprocal:
3.2.2. Propositions in Consistent Fuzzy Preference Relations
The inconsistency problem would be solved by constructing decision matrices of pairwise comparisons based on the following three propositions:
Proposition 1. Suppose the existence of a set of alternatives is associated with a multiplicative preference relation .
The corresponding reciprocal additive preference relation with to is defined as follows:
where g is a transformation function, and
is utilized because
is between 1/5 and 5.
Proposition 2. The reciprocal fuzzy preference relation is P = g (A)
, where P =
)
, and the following statements are equivalent: Proposition 3. The reciprocal additive fuzzy preference relation is P =
)
, and the following statements are equivalent: If the preference matrix has values that are not in the interval
but in
, to preserve the reciprocity and additive transitivity, a linear transformation is required:
. The transformation function is then denoted as follows:
where
is the absolute value of the minimum negative value in the preference matrix.
3.2.3. Evaluating the Weights of Criteria and Alternatives
(1) Integrate the evaluations of m experts by using the notations of the average value.
is the transformed fuzzy preference value of expert
k for evaluating the criteria i and j.
(2) Normalizing the aggregated fuzzy preference relation matrices
is employed to illustrate the normalized fuzzy preference value of each considered criteria:
(3) Using
to indicate the average priority weight of considered criteria i, the priority of each criterion can be obtained:
where n is the number of the criteria considered.
4. Empirical Analysis
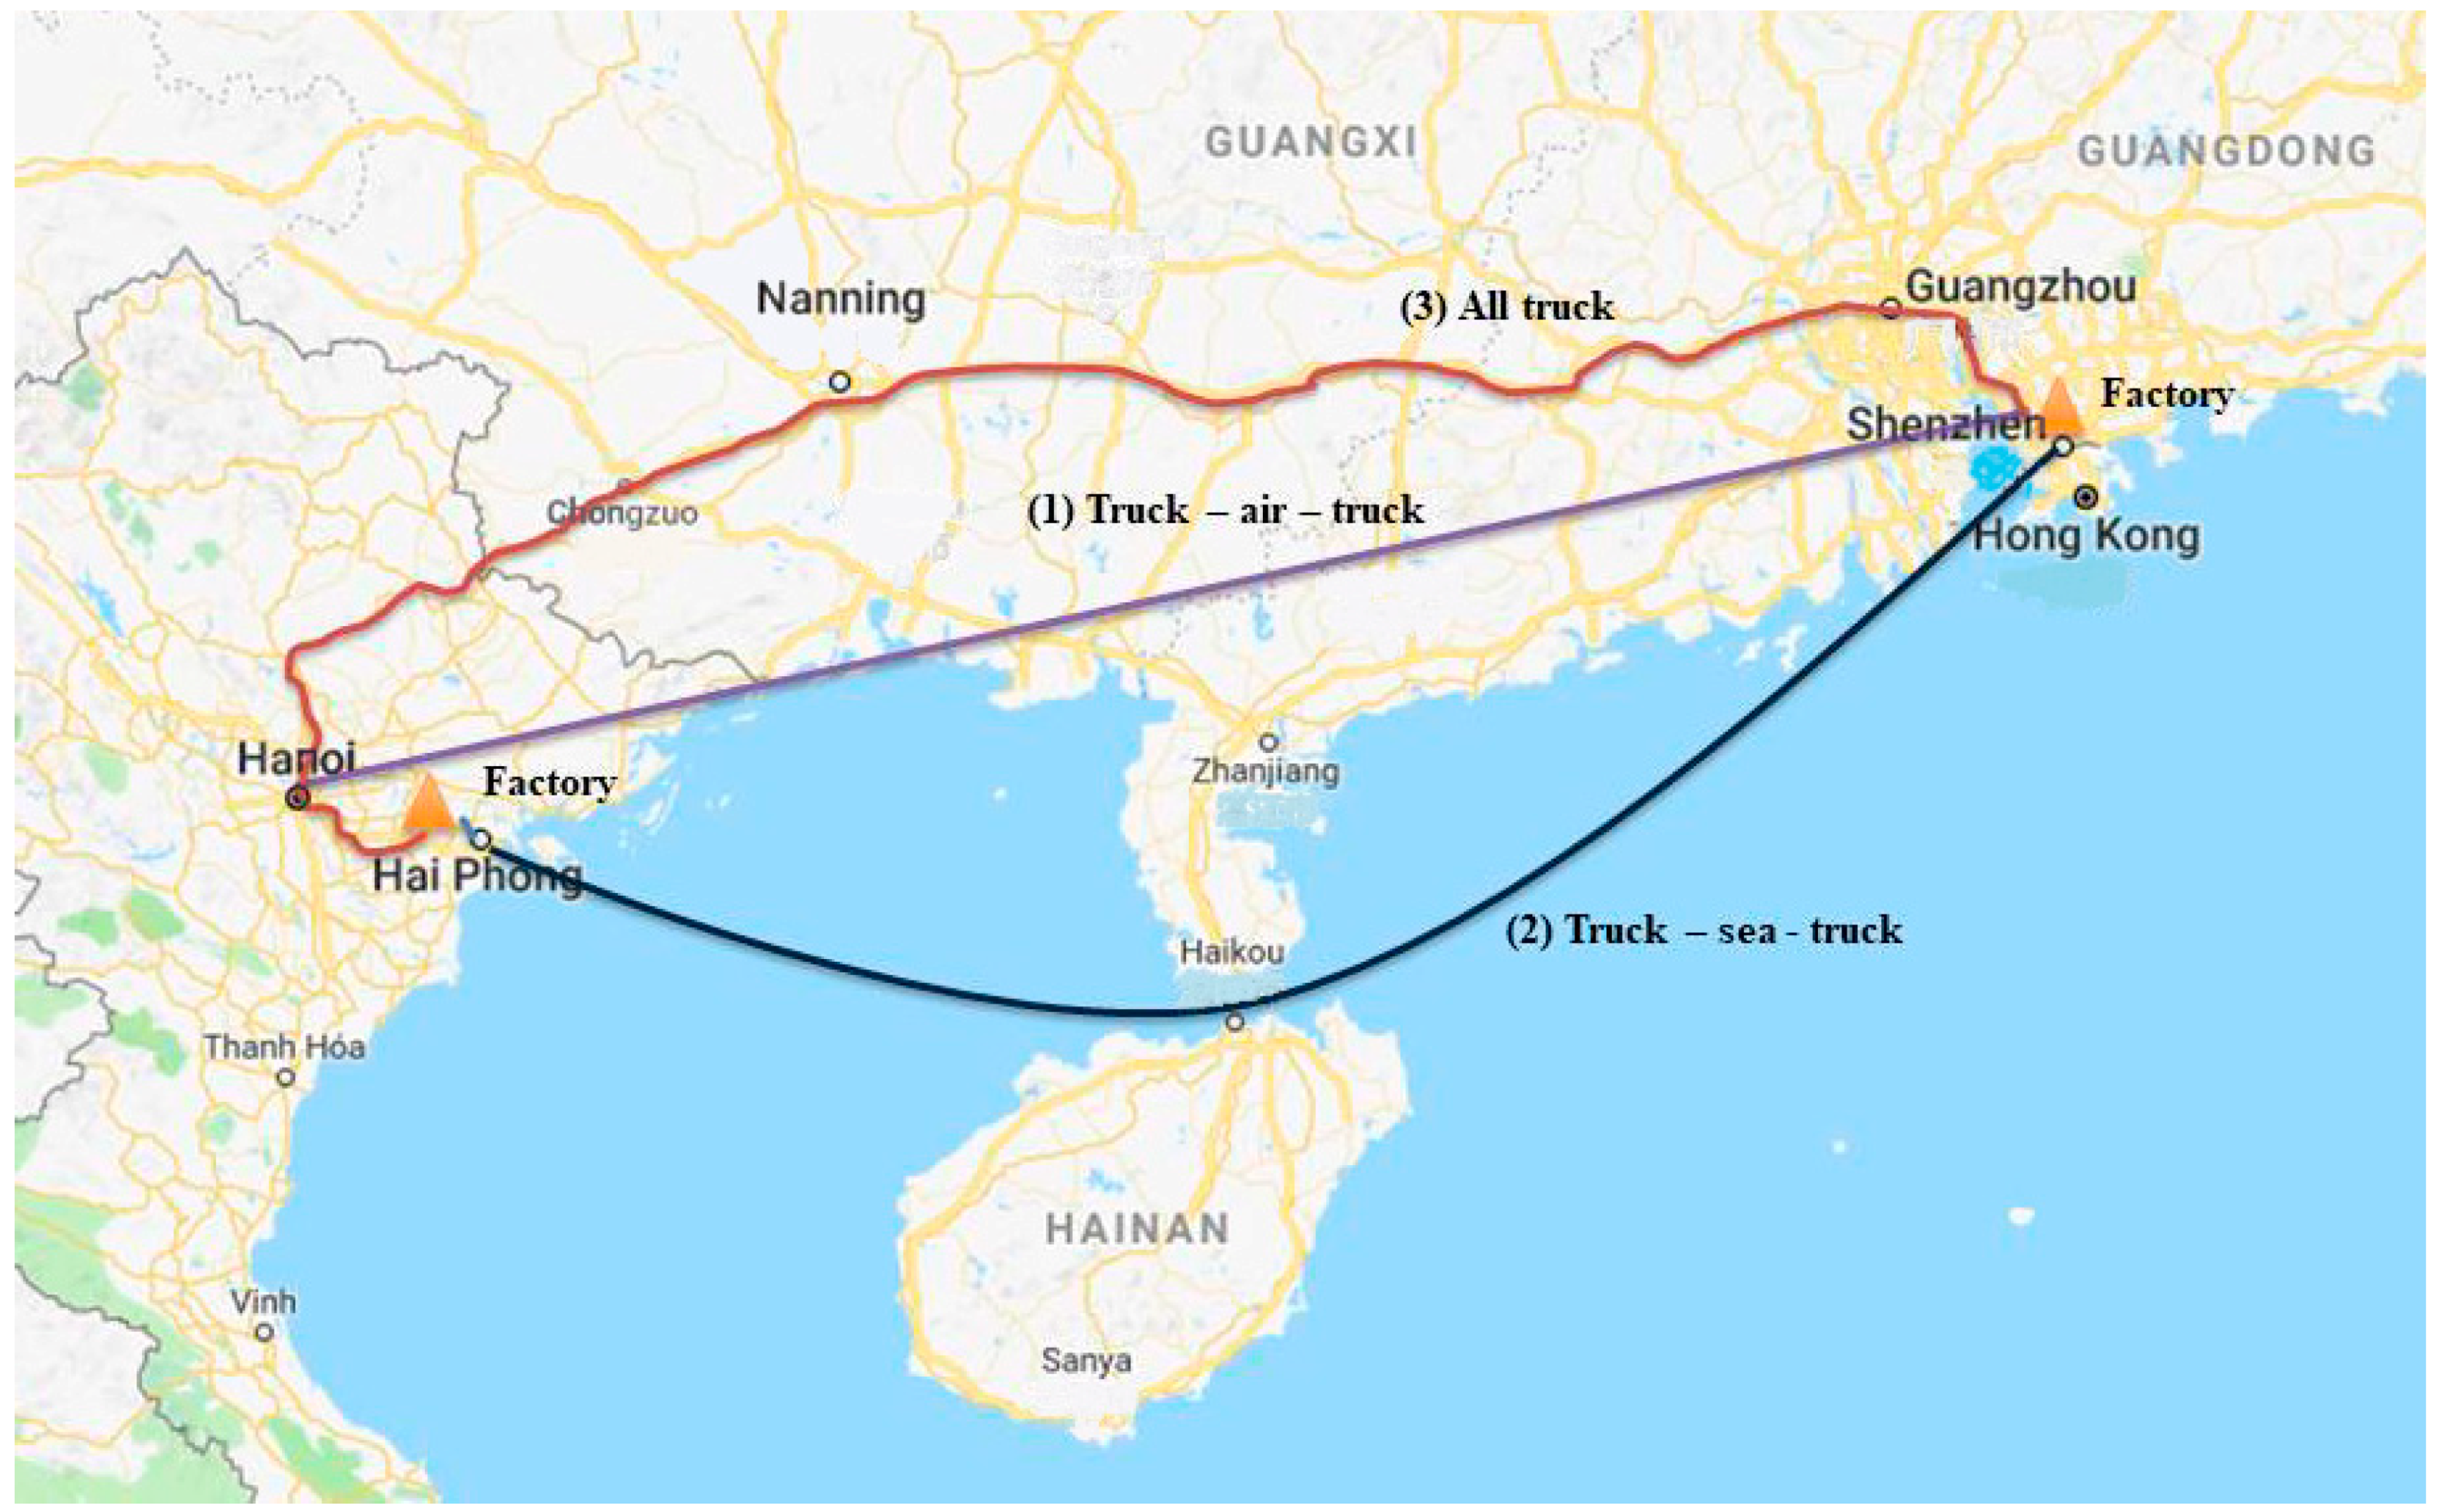
The study’s objective is to evaluate the alternative routes for importing electronic components from China to Vietnam. To ensure a fair comparison, an origin and a destination for door-to-door service would be determined. Indeed, Shenzhen, as an origin, and Hai Phong, as a destination, were chosen because the two locations are the main centers of electronics production in China and Vietnam, respectively.
Having geographically strategic locations and being economic centers, both cities could be well connected by all main types of transportation modes, such as maritime, airway, and roadway. The three common alternatives are examined in the study, as shown in
Figure 2:
Alternative 1: Truck–air–truck (factory in Shenzhen–Bao An airport–Noi Bai airport–factory in Hai Phong).
Alternative 2: Truck–sea–truck (factory in Shenzhen–Da Cha Bay seaport–Hai Phong seaport–factory in Hai Phong).
Alternative 3: All truck (factory in Shenzhen–Nanning–Hanoi–factory in Hai Phong).
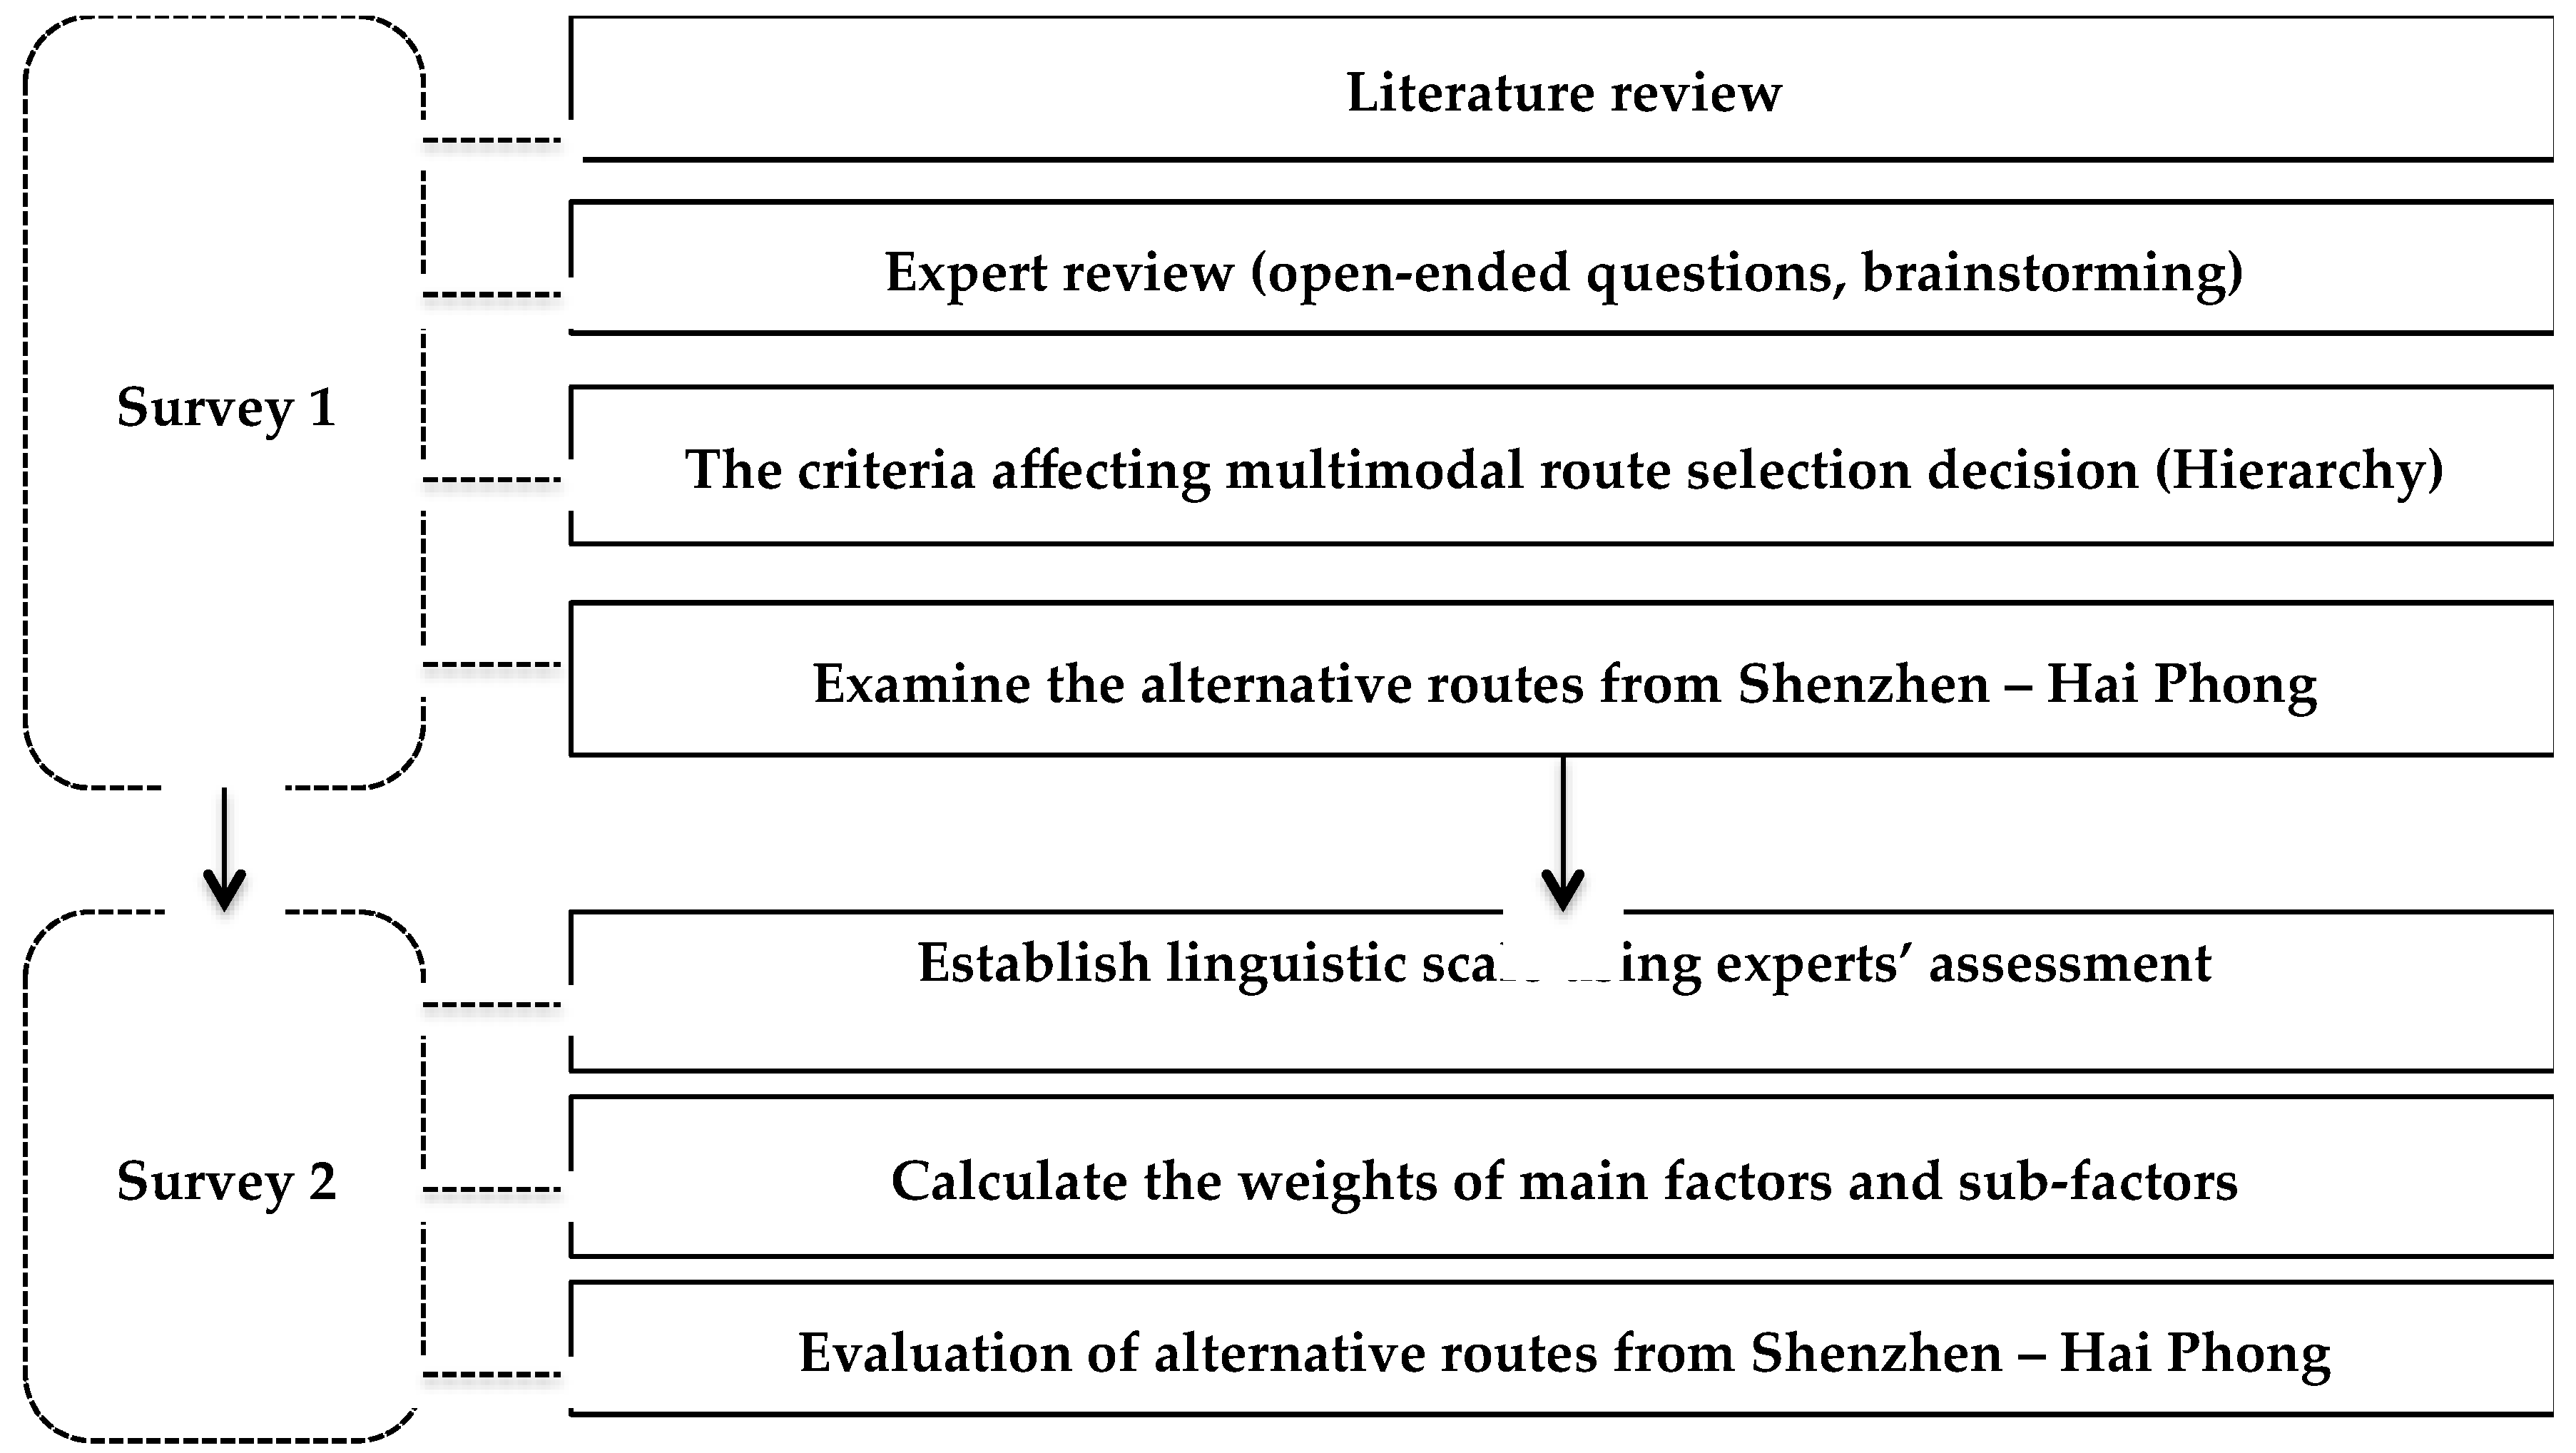
4.1. The Survey Design
To achieve the research’s objectives, a two-step methodology was conducted (
Figure 3).
The process initially employed the Delphi method to obtain a hierarchy of factors affecting multimodal route selection and alternative routes from Shenzhen to Hai Phong. The second step subsequently applied the CFPR method to evaluate those factors and alternatives. During the initial Delphi phase, factors for discussion were suggested in the literature, and through open-ended questions to and brainstorming with experts, both shippers and LSPs involved with the routes, where LSPs no longer simply offer services demanded by shippers [
50]: they serve as specialists to maximize the supply chain’s efficiency [
51]. The main factors and sub-factors in the experts’ knowledge were weighted on a linguistics scale, and the alternative routes were then compared to determine the optimal option.
4.1.1. The Procedure’s First Step: Identifying Factors and Alternatives
In the first step, literature relating to the selection of multimodal routes and transport modes was circulated among experts for five rounds to gain insight into the problem. Nine experts were invited to participate in the survey; however, only six experts accepted the offer. The six respondents are representatives for LSPs and shippers who handle and arrange shipments using intermodal transport from Shenzhen to Hai Phong. All of the experts have more than eight years of working experience and have worked as operation managers or brand directors for companies in Vietnam, such as Interlogs, OOCL Logistics, LG Electronics, and LG Innotek. The survey was conducted over 43 days (from 27 November 2017 to 22 January 2018) using email, phones, and face-to-face interviews.
The experts replied to questionnaires about the factors that had been determined from the literature review. They were asked to identify whether any factors were missing and whether any factors overlapped by answering open-ended questions and participating in brainstorming processes. The questionnaire was conducted in sequential rounds to revise the experts’ opinions. After this phase, a hierarchy of factors, including four principal and 14 sub-factors, was identified from the consensus of all experts, alongside three alternative routes (
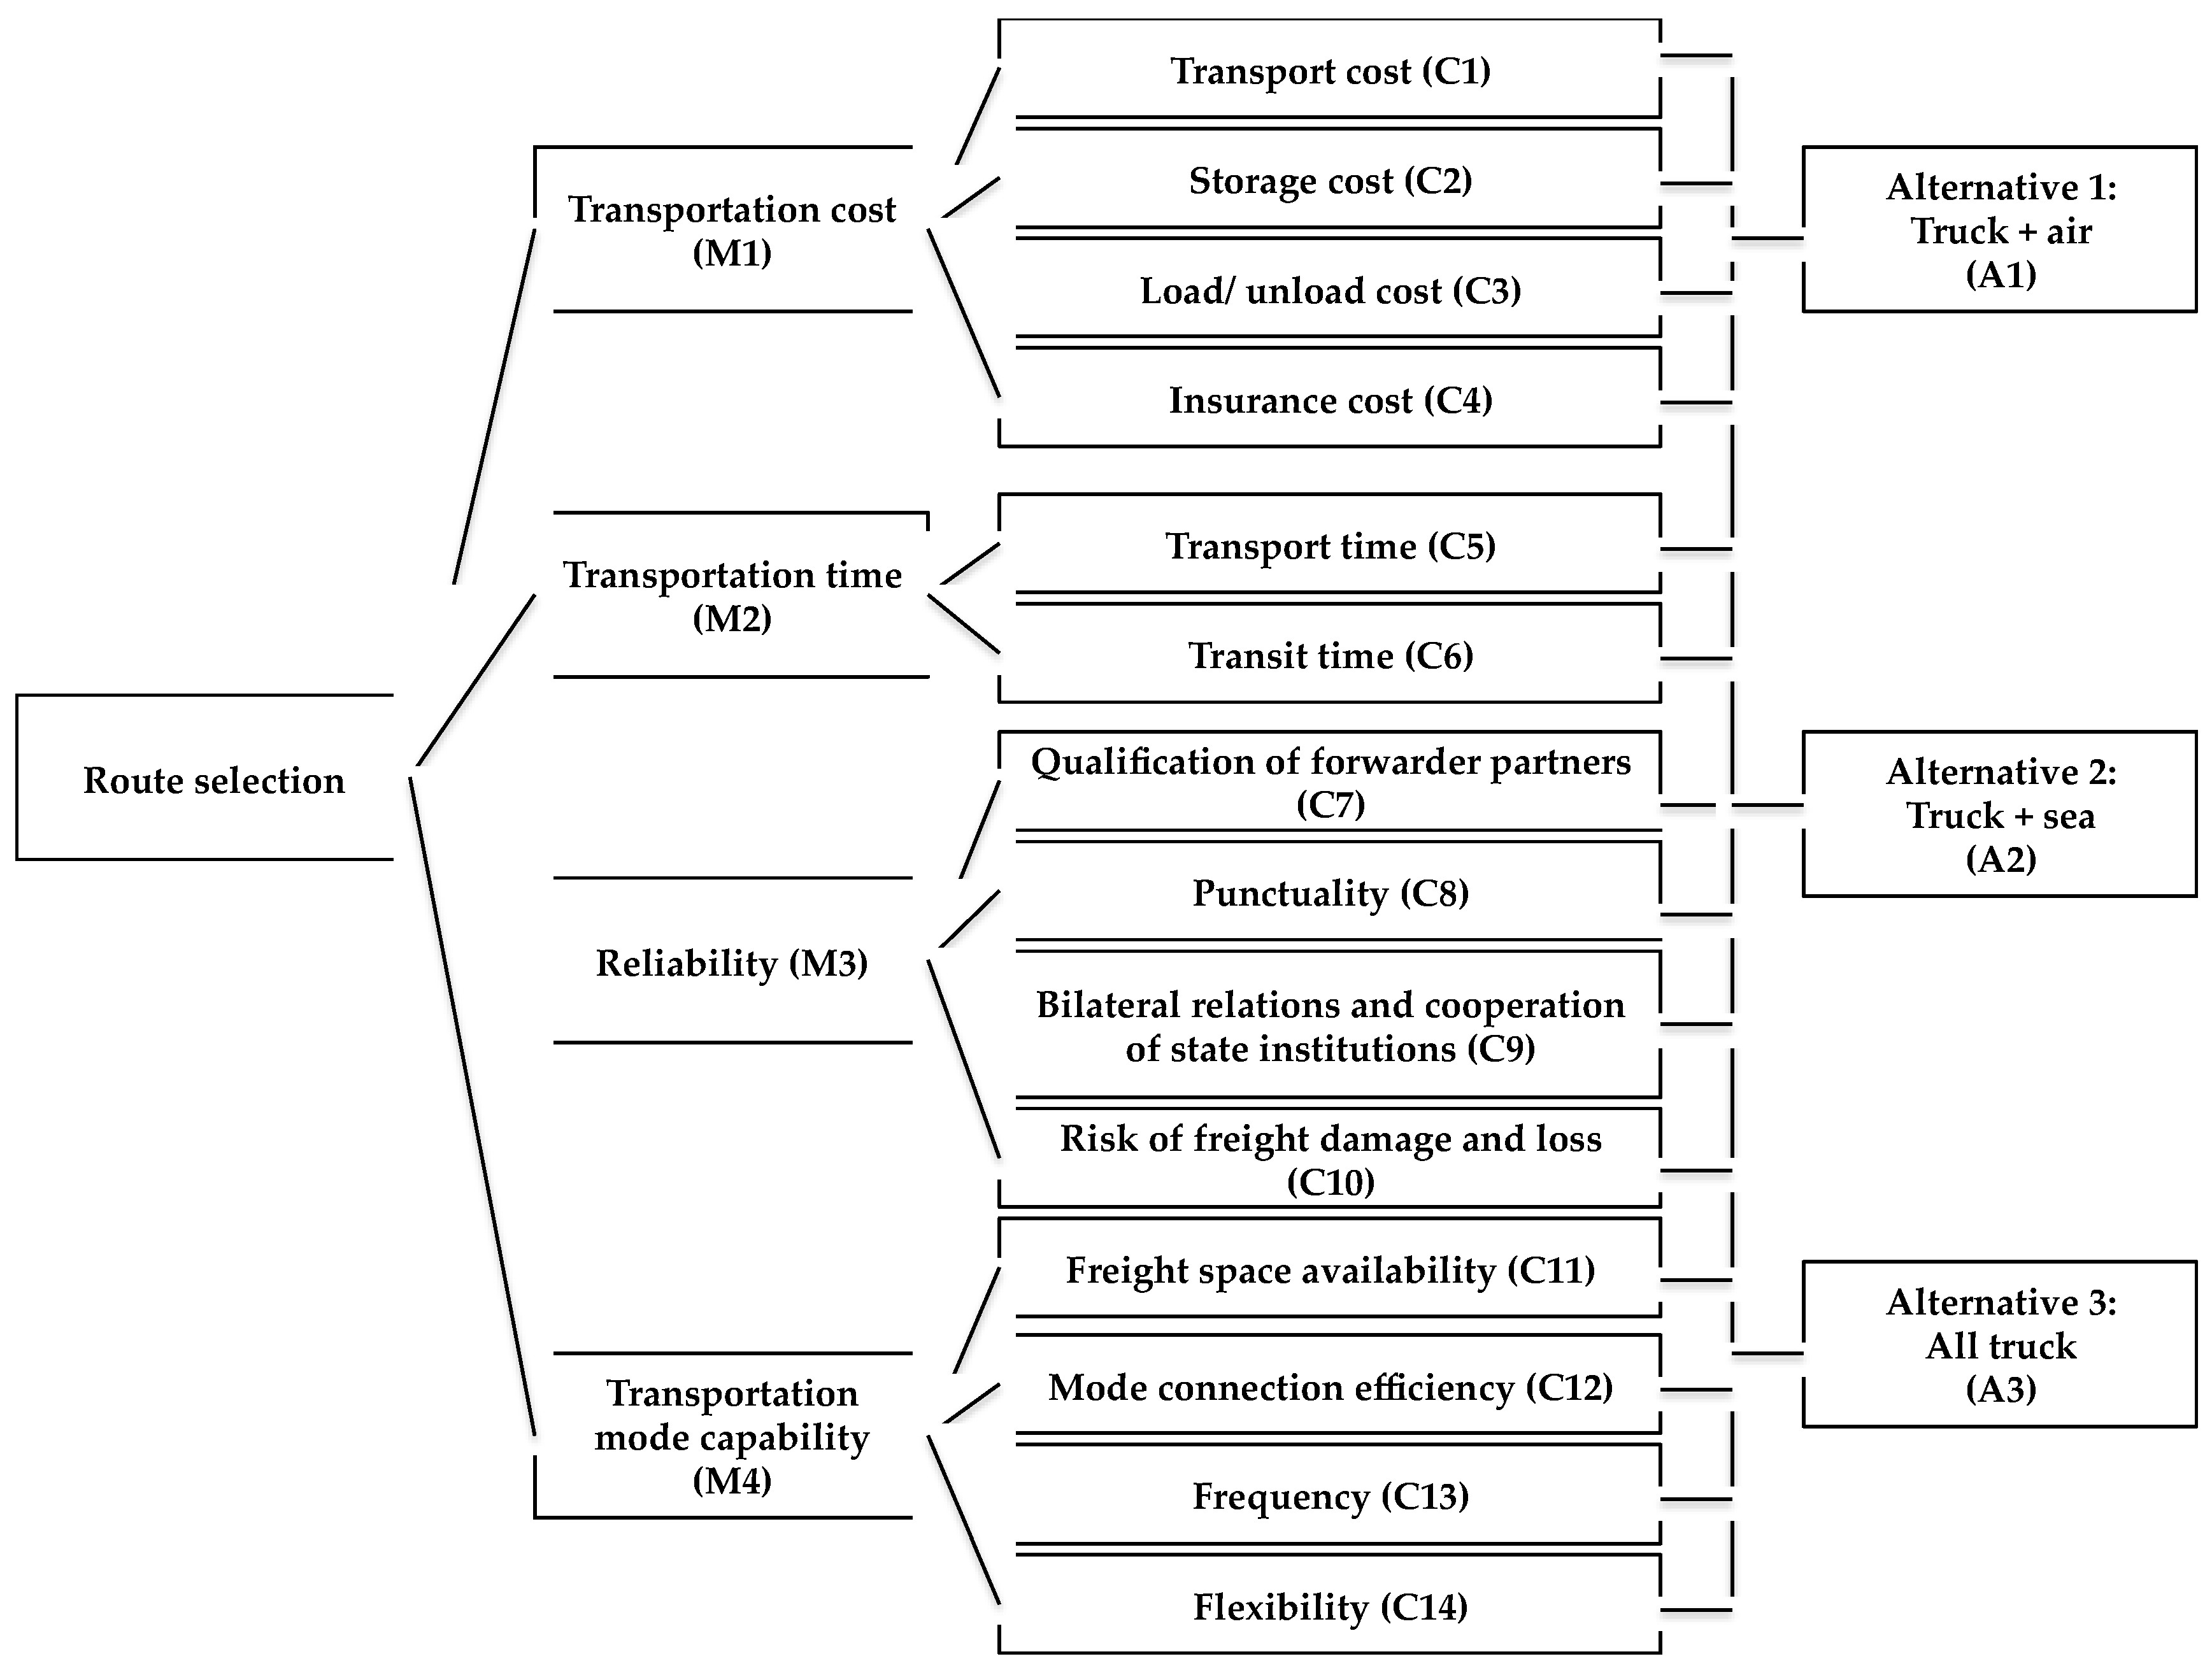
Figure 4).
4.1.2. The Procedure’s Second Step: Weighting Factors and Alternatives
In the second step, the experts evaluated the factors and the alternative routes achieved in the first step. The six experts who had participated in the first-round survey were invited to this round, and 10 additional experts from LSPs and electronics manufacturers were also invited to complete the questionnaire. In total, 16 respondents with more than eight years of professional experience in the international transport of high-value products were involved in the second step. The number of participants would be adequate for an in-depth interview with experienced experts [
21]. The second survey was conducted over 52 days, from 1 February 2018 to 24 March 2018.
4.2. Evaluation of the Criteria and Alternative Routes from Shenzhen to Hai Phong
4.2.1. Weighting Calculations and Evaluating the Criteria
Pair comparisons for the four principal factors and 14 sub-factors employed the CFPR methodology were performed (
Table 2). The results for the principal factors indicated that reliability ranked first. According to the logistics companies and shippers, reliability is the most important criterion when deciding the transport route for electronic components and spare parts. This finding is consistent with the required features for transporting high-value products that prioritize service quality, in which the risk of freight damage and loss, punctuality, reliable partners, reliable service, and reliable international relationships are the main sub-factors. However, transportation cost is a crucial determinant when selecting transportation modes for door-to-door service. Furthermore, to ensure seamless transport, transportation mode capacity is also a vital factor that must be considered, including freight space availability, mode connection efficiency, frequency, and flexibility.
Of the sub-factors, risk of freight damage and loss is the most important. For transporting high-value cargo, such as electronic components, it is essential to establish safety, temperature, and humidity requirements to minimize the possibility of damage and loss. Among the transportation cost sub-factors, including transport cost, storage cost, load/unload cost, and insurance cost, transport cost gains the most attention. That would be a consistent explanation because, on average, transportation cost accounts for 20% of manufacturing companies’ total production costs [
52] and more than 50% of the logistics costs for cargo transportation [
53]. Additionally, the bilateral relations and cooperation of state institutions sub-factor is ranked fourth, as international transport depends on more than one country’s administration. Thus, the involved government departments, trade policies, and political relationships directly and indirectly influence route development.
Furthermore, among the manufacturing inputs, punctuality of delivery is pivotal because any disruption in supply would cause a cascading effect throughout the manufacturing system. Similarly, due to the characteristics of transported cargo, the qualifications and capabilities of the forwarding partner are important criteria. Frequency and flexibility are also vital factors for transport selection. The more frequent are the transport services provided, the lower is the inventory level the shippers require, resulting in lower total costs. The higher is flexibility the service provides, the lower are the losses suffered if there are changes or delays due to uncertainty in the supply chain.
4.2.2. Weighting Calculation and Evaluating the Alternatives with Respect to the Criteria
The three alternatives for transporting electronics spare parts and components from Shenzhen to Hai Phong were evaluated based on sub-factors. The 14 factors included seven qualitative factors and seven quantitative factors. In terms of the quantitative factors, real data were collected to measure the objective factors (
Table 3), while the subjective factors were measured using the experts’ opinions from the second questionnaire.
In terms of the objective factors of transport cost, storage cost, load/unload cost, insurance cost, transport time, transit time, and frequency, real data with different units were transformed into dimensionless indices to ensure compatibility with the linguistics variables of the subjective factors. The alternative with the highest benefit (or the lowest cost) would have the highest score. Thus, the calculation is based on the formulas of Herrera-Viedma et al. [
49] presented in
Appendix A.
Table 4 illustrates the evaluation of the three alternatives, and it indicates logistics service companies and shippers prefer the truck-air-truck route to transport electronics spare parts and components from Shenzhen to Hai Phong, followed by the all truck route and then the sea–trucking route. According to the LSPs and shippers, a door-to-door service by airway and truck is preferred in electronic components, which rely on reliable transport. Although the truck-air–truck route is the most expensive option among the alternatives, the absolute advantages derived from the high reliability, speed, and security enable the route to be preferred over the others.
While the truck-air-truck route would be less competitive in terms of freight space availability, its high frequency, flexibility, and mode connection efficiency enhance the route, ensuring smooth transport and manufacturing activities. In contrast, the route integrating seaway and trucking modes is assessed as the least preferred alternative. Despite having the absolute advantage in costs, the truck-sea-truck route’s main weaknesses are its highest risk of freight damage and loss, its lowest frequency, and its longest shipment time, which combine to diminish this alternative’s competitiveness in transporting high-value cargoes, such as electronic components.
In addition, the routing using all trucks is ranked as the second-best alternative for transporting cargo from Shenzhen to Hai Phong. Ironically, among cost factors, the insurance cost of the cross-border haulage via trucks from China to Vietnam is higher than the others. According to insurance companies, who decide insurance fees, trucking transport consists of numerous uncertain losses and potential damage during transport due to weather, the vehicle itself, congestion, road quality, and potential cargo theft. Similarly, logistics companies and shippers also assess the route as being considerably risky. The route also provides the lowest satisfaction in terms of punctuality due to shipping time variability. The inefficiency at border connections is one of the main causes of delays, and poor cooperation and procedures between the two countries’ state institutions significantly impact the route’s performance. However, the route does possess some strengths that make it a competitive transport route. Besides the advantage of transport time, the route would save substantially on the transit time at the border gates of the two countries for customs procedures. In contrast, shipping using the two other routes must consider cutoff times that not only increase shipment time but also increase the risk of incurring additional monetary costs and delays in manufacturing due to late arrivals. Furthermore, the cross-border transport by trucks offers high flexibility and frequency, contributing significantly to its competitiveness as an alternative route.
4.3. Sensitivity Analysis
A sensitivity analysis was employed to examine the robustness of the preference ranking among the alternatives, as the input data were changed to new values [
54]. This analysis eliminates inaccurate measurements, resulting in reliable results for MCDM problems [
55].
Sensitivity analysis was conducted by increasing and decreasing the priority weights of each route with respect to each factor and by equally decreasing and increasing the others’ weights, respectively.
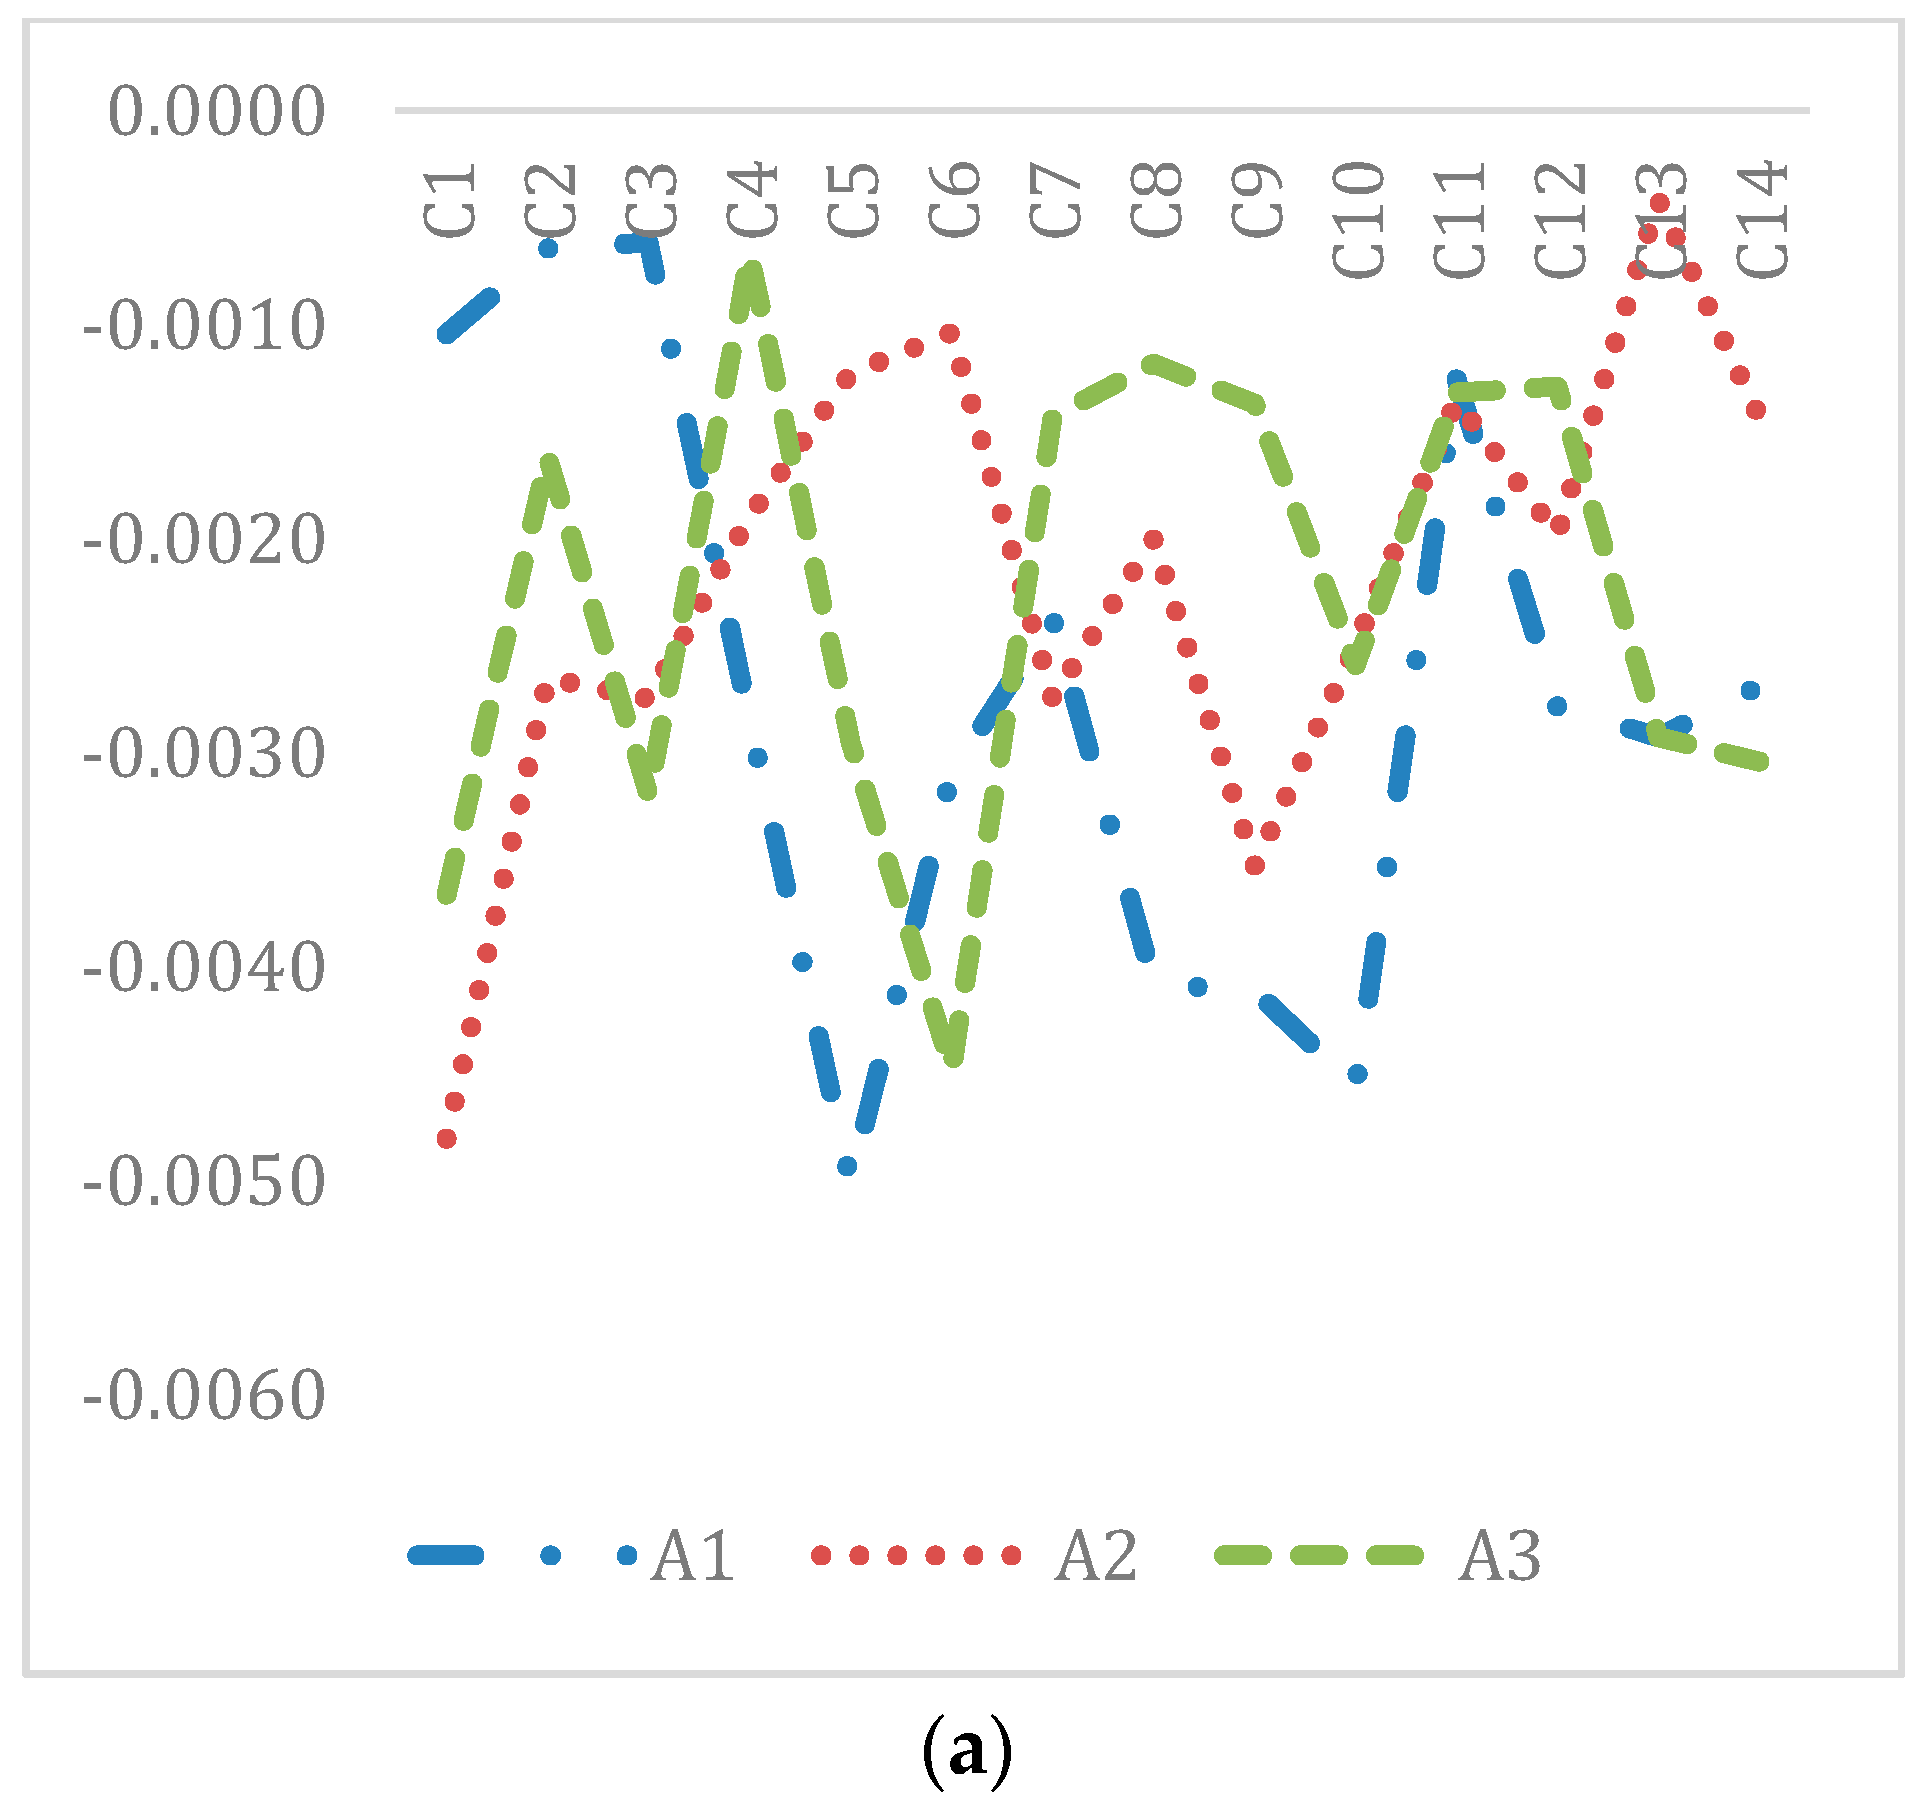
Figure 5 presents the results corresponding to each of the 14 sub-factors and illustrates the differences with respect to weighted scores for each alternative route by increasing and decreasing the weights of the sub-factors by 10%.
Although no change in the alternative routes’ rankings occurred, the weighted scores of each alternative differ due to the 10% changes. This result implies that sub-factors would have different impacts on the choice of transport route and provide insights into the comparative advantages and disadvantages of each route. By decreasing the priority weights of the truck-air-truck transport route by 10%, the route would be reduced in competitiveness due to the decreasing importance of transport time and risk of freight damage and loss, which are absolute advantages of the route compared to the other transport modes. In contrast, the combination of trucking and seaway would suffer a considerable loss of competitiveness, as the importance weight of transport cost decreases. In terms of the route using all trucks, the most sensitive factor is transit time, which contributes significantly to the route’s competitiveness as the priority weight increases or decreases.
Furthermore, to observe the ranking changes among the alternatives when the evaluation of alternatives is largely overestimated or underestimated, the study adjusts the alternatives’ priority weights with respect to each sub-factor with −30%, −20%, +20%, and +30%.
Table 5 shows the three transport routes’ ranking changes for the different priority weight adjustments. In Cases 1–3, as the priority weight of the all truck alternative decreases 30%, the ranking of the truck–sea-truck route and the all-truck route changes. Therefore, this indicates that cost factors and transit time are the sensitive factors for the all truck route. If the costs, including load/unload cost and transport cost, and transit time continuously increase, the competitiveness reduces significantly compared to the truck–sea-truck route. Similarly, the ranking of the two alternatives would be changed, as the priority weight of the truck–sea-truck route increases 20%. Thus, reducing transport costs in the truck-sea–truck route would enhance its competitiveness dramatically.
To investigate at what level of importance weight decision-makers would change their transport route decision, the study increased/decreased a factor’s weight and equally reduced/increased the other 13 factors’ weights, respectively. The study adjusted the weights to 100%.
Table 6 illustrates the representative cases in which there is a ranking reversal. When the importance weights of transport time, transit time, frequency, and flexibility decrease, the all-truck route choice would shift to the truck-sea–truck transport route. Similarly, the choice of transport route would also change if the importance weight of bilateral relations and cooperation of state institutions increased to 60%.
Although the changing ranking among alternatives would occur with considerable changes in terms of the sub-factors’ importance weights and the alternatives’ priority weights with respect to the sub-factors, the sensitivity analysis shows that the results are quite insensitive to possible errors and provide reliable results.
5. Discussion
Evaluating transport routes is becoming an essential requirement for increasing international trade between China and Vietnam, whether transporting finished or unfinished cargoes. Increasing the flows between China and Vietnam is required not only due to the demand of the two countries but also the demand deriving from the rise of GVCs. GVCs cause different stages of the production process to be conducted in different countries. Recently, Vietnam has emerged as an assembly production hub for high-technology products, such as electronics products. These products mainly originate in China, which is a global manufacturing base for the world’s electronics industry. Transporting electronic components requires maintaining quality, safety, and transport vehicle capacity compared to other general cargoes. Hence, this study aimed to investigate the optimal route for transporting electronic parts and components from China to Vietnam and to evaluate all feasible route alternatives for door-to-door transport from Shenzhen to Hai Phong. The Delphi method and the CFPR method, with the integration of qualitative and quantitative factors, were employed to achieve the study objectives from the LSPs and shippers’ perspective. The Delphi method was applied to obtain the hierarchy factors, including four main factors and 14 sub-factors, as decided by expert consensus. The CFPR method was employed to evaluate the factors and the three alternatives.
The study concentrated on a specific industry and routing, and the perceptions of the LSPs and shippers are significant to solve a specific problem, as shown in many previous studies (e.g., [
11,
48,
49]). The results illustrate that, among the four main factors, reliability is prioritized when considering the transport routes for electronics parts and components, followed by transportation costs, transportation mode capacity, and transportation time. Meanwhile, of the 14 sub-factors, risk of freight damage and loss is the most important factor. Therefore, the truck-air-truck route is preferred over the two other alternatives to ship from Shenzhen to Hai Phong. The route selection for high-value cargoes, such as electronic components, is decided according to multiple qualitative and quantitative factors, where the qualitative factor of reliability for minimizing loss and damage or maximizing safety and security is prioritized over the objectives of minimizing cost and time. Thus, the inventory theory model applied for auto parts [
14] or the cost–distance analysis used for laptop transportation [
17] would have difficulty interpreting the problem of transporting electronic components from China to Vietnam. Despite numerous studies examining routing selection as defined by the MCDM problem, the priorities of the determinants and alternatives would differ according to the particular circumstances. Furthermore, to examine the possibility of rank reversal, sensitivity analysis was conducted by changing the importance weights of sub-factors and the priority weights of the alternatives with respect to each sub-factor. The results illustrate that the truck-sea-truck route and the all-trucking route would have altered rankings if there were some improvements.
Therefore, the study offers some crucial academic and practical implications. Regarding the academic aspect, the study proposed the MCDM method to solve the transport route selection problem using expert knowledge and real data integrating the Delphi method and the CFPR methodology. To increase the objectivity of the comparison, quantitative values are key, but other factors, such as reliability or qualification of forwarding partners, constitute major obstacles to achieving precise values. Therefore, a combination of qualitative and quantitative analyses for selecting routes was applied to examine the transport routes for transporting electronic components. The study also investigated what factors should be given priority when designing routes for hi-tech cargoes, from the viewpoints of shippers and LSPs. The findings showed qualitative factors, such as reliability and transportation mode capacity, are more meaningful than quantitative factors, such as transportation costs and transportation time. Additionally, a sensitivity analysis was conducted to examine the transport choice alternatives in various circumstances by changing the variables, thus overcoming the limitations of a static analysis.
Furthermore, the study provides implications for management. LSPs and shippers, who play vital roles in transport route selection, will now have a better understanding of the three feasible transport routes to import products to assembly plants. Consequently, the appropriate strategies and the selection of route would be decided depending on the specific circumstances. The study also provides clear requirements and desires from logistics companies and shippers when transporting cargoes between China and Vietnam. As a result, policymakers and state institutions, who play crucial roles in authorizing and promoting the development of transport routes, would make prompt improvements to contribute toward supply chain efficiency. Additionally, deriving from the study’s sensitivity analysis, the ranking of transport routes would be changed when the relative importance of the variables and the relative priority weights of the routes change. Although the airway route would be preferred over the others for hi-tech cargoes, there are opportunities for seaway and trucking transportation modes. Changes in cost and time variables could impact the decision-making process.
The study contributes both theoretical and practical perspectives, despite the limitation of studying only transport routes for the two production hubs of Shenzhen and Hai Phong. To generalize the findings, additional studies should widen the scope to other provinces and cities in China and Vietnam to obtain a better assessment of the transport route network between the two countries. Additionally, the study excluded the railway alternative that would be a competitive transport alternative for transporting hi-tech cargoes because it is still performing a pilot run. Hence, it is recommended that further research be conducted to replicate this study to better compare transport route alternatives from China to Vietnam when the railway system is fully operational.

