Evaluation of Silage Corn Yield Gap: An Approach for Sustainable Production in the Semi-Arid Region of USA


1
Department of Research Centers, Montana State University, Eastern Agricultural Research Center, Sidney, MT 59270, USA
2
Department of Plant Sciences, University of Wyoming, Department 3354, 1000 E. University Ave., Laramie, WY 82071, USA
3
Agricultural Science Center, New Mexico State University, Clovis, NM 88101, USA
4
Department of Agronomy and Plant Genetics, University of Minnesota, Southwest Research and Outreach Center, Lamberton, MN 56152, USA
*
Author to whom correspondence should be addressed.
Sustainability 2018, 10(7), 2523; https://doi.org/10.3390/su10072523
Submission received: 28 June 2018
/
Revised: 16 July 2018
/
Accepted: 17 July 2018
/
Published: 19 July 2018
(This article belongs to the Special Issue Agroecology: Principles and Application for Efficient and Sustainable Agricultural Production)
Abstract
:Water and nitrogen (N) play an important role in closing the yield gap of crops by reducing associated stresses and yield variability. Field research data coupled to the CSM-CERES-Maize model of Decision Support System Agrotechnology Transfer were used to advance our understanding of the effect of water and N on silage corn growth and yield. The objectives of the study were to determine: (i) the best combination of irrigation water and N for optimum biomass yield, and (ii) the yield gap of silage corn grown at different locations in Wyoming, USA. Field experiments were conducted under sub-surface drip irrigation using a randomized complete block design in a split-plot arrangement with four replications. The main plot was irrigation and consisted of 100% crop evapotranspiration (100ETc), 80% (80ETc), and 60% (60ETc), and the sub-plot was N rates, including 0, 90, 180, 270, and 360 kg N ha−1 as urea-ammonium-nitrate. The simulated results indicated full irrigation and at least 150 kg N ha−1 as the best combination for silage corn production in Wyoming. Our observed and simulated results show the potential to increase the biomass and reduce the yield gap of silage corn in the region if irrigation water and N are properly managed.
1. Introduction
Water and nitrogen (N) are essential components for plant growth and development. With increasing water scarcity and the environmental risks associated with nutrient leaching, the need to increase agricultural water use efficiency (WUE) and the efficient use of N is receiving significant attention. Irrigation water and fertilizer N use are likely to face future limitations, which warrants further study aiming at maximizing crop production for achieving maximum net return [1].
Water and N play an important role in closing the yield gap by reducing associated stresses and yield variability [2]. Irrigation management requires a thorough understanding of the crop water needs during the growing season as related to developmental stages as well as management strategies for high yield [3,4]. Irrigation is not only important as a way of supplementing seasonal water needs, but also to ensure that crops get suitable water during critical periods of growth to optimize their yield potential while enhancing WUE. Increasing WUE in agricultural production systems is important in arid and semi-arid regions due to limited supply and growing demand for fresh water [5]. This is especially important in water-scarce regions like Wyoming where crop production is not possible without the practice of irrigation. In turn, such practice is optimized with proper irrigation scheduling in order to maximize economic return [6]. Aside from irrigation water, fertilizer N is a critical input for optimum crop production [7]. Nitrogen promotes rapid growth of corn plants, increases leaf size and quality, and promotes fruit and seed development [8].
In the last decades, a large number of studies have provided the framework to assist farmers in making more informed water and N management decisions [9]. These decisions are influenced by many factors including climatic conditions, soil type, and management practices such as planting date, fertilization timing and water application, genotype, previous crop, N carry-over, and seeding rate. The complex interaction of those factors, along with associated costs, limit agronomic field research at specific points in time and space [10]. Dynamic crop simulation models, which have been shown to be valuable tools to assist field-based research, can be used to significantly shorten the timing of field research and to help advance our understanding of the long-term effect of cropping practices in crop growth and yield and the environment [11]. For instance, Staggenborg and Vanderlip [12] have used crop simulation models in dry-land crop production systems to support field-based research to broaden recommendations to producers. Similarly, Kaur et al. [13] used a modeling approach to test the long-term effects of different tillage practices on growth and WUE of dryland winter wheat grown in western U.S.
A crop model is a quantitative approach for predicting growth, development, and yield of crops under a given set of genetic and environmental variables [14]. A crop simulation model coupled to a decision support system can also be used to obtain information on water use, N uptake, and soil moisture [10]. The Cropping System Model (CSM)-CERES-Maize of the Decision Support System for Agrotechnology Transfer (DSSAT) [10,15] is a model known worldwide. Decision Support System for Agrotechnology Transfer models simulate growth, development, water use, and yield of crops growing under specific conditions as a function of weather, soil water, soil N and carbon, and management of the cropping system [10]. DSSAT contains models for over 42 (version 4.7) crops as well as supporting tools to facilitate the use of the models. Such tools include database management programs for soil, weather, crop management and experimental data, utilities, and application programs (https://dssat.net/) [16,17].
The soil water balance module of DSSAT computes the daily changes in soil water content by soil layer due to infiltration of rainfall and irrigation, vertical drainage, soil evaporation, and root water uptake [18]. Irrigation can be applied at specific growth stages (version 4.7), on specific dates with specified water amounts, or can be triggered when the soil water content drops below a specific fraction of the water-holding capacity in the specified irrigation management depth [10]. With respect to N dynamics, DSSAT simulates its mineralization, denitrification, volatilization, transport, and uptake by plants [19].
The goal of this study was to simulate the response of corn for silage production to irrigation water and fertilizer N at different locations in the semi-arid USA. The specific objectives were to determine: (i) the best combination of irrigation water and fertilizer N for optimum biomass yield, and (ii) the yield gap of silage corn grown at different locations in Wyoming, USA.
2. Materials and Methods
2.1. Field Experiments
Field experiments were conducted at the University of Wyoming Research and Extension Center located in Powell, Wyoming (44°45′32” latitude N and 108°45′30” longitude W, and a 1333 masl) during the 2014 and 2015 growing seasons. The daily weather data for 2014 and 2015 are presented in Figure 1. The study area is characterized by a semi-arid climate with an average annual temperature of 6.7 °C, an average annual rainfall of 157 mm, and a growing season of 125 days (www.wrds.uwyo.edu). The soil is characterized as clay loam soil with a pH of 7.9, organic matter of 1.67%, and nitrate-N and P in the top 30 cm soil of 13 mg kg−1 and 14 mg kg−1, respectively (www.nrcs.usda.gov).
The hybrid Pioneer “P8107HR” was planted on 22 May 2014 and 2015 on a subsurface drip irrigated (SDI) field at 56 cm row spacing and a population of 90,000 plants ha−1. The experiment was laid out as a randomized complete block in a split-plot arrangement with four replications. The main plots were irrigation strategies and the subplot N rates. The irrigation treatments included 100ETc, 80ETc, and 60ETc, while the N treatments included 0, 90, 180, 270, and 360 kg N ha−1. The N fertilizer urea-ammonium-nitrate aqueous solution was side-dressed four times on 17 June, 2 July, 15 July, and 22 July 2014, and on 10 June, 25 June, 6 July, and 13 July 2015.
The irrigation scheduling was based on the ETc obtained as a product of the reference evapotranspiration (ET0) and the dual crop coefficient (Kc) [20,21]. The daily ET0 was calculated using the FAO Penman–Monteith equation as modified by the American Society of Civil Engineers (ASCE) [22]. Irrigation was triggered when the soil moisture dropped below 50% of the available water in the top 30 cm of soil.
The data collected in the field experiments included leaf area index (LAI), aboveground biomass for growth analysis, and aboveground biomass yield. Plant measurements were obtained during the two years throughout the growing season at five growth stages (V4, V8, V12, VT, and R4 for harvest; V stages were recorded when the collar of a given leaf was visible, VT refers to tasselling, and R4 refers to the reproductive dough stage). Plants in 1-m row lengths of the two inner rows were collected from each plot at each sampling date. The plants were split into leaves, stems, and ears. The leaves were used to obtain the leaf area with an LI-3100C Area Meter (LI-COR Inc., Lincoln, NE, USA). Samples were then oven-dried at 60 °C for a period of 48–72 h before being weighed for aboveground biomass. The occurrence of phenological stages was recorded three times a week on plants in 1-m-row lengths based on the scale of Ritchie et al. [23]. The onset of a given phenological stage was recorded when 50% of the plants were at the stage of interest.
2.2. Modeling Component
Required model inputs included daily weather data, soil profile characteristics, plant-specific information, and management practices (e.g., tillage type, planting date, plant population, fertilization strategy, and irrigation amounts and timing), and grain yield (for model calibration purposes). The daily solar radiation data were obtained from the Climatology Resource for Agroclimatology of NASA (power.larc.nasa.gov). WeatherMan [24], a DSSAT tool to facilitate the preparation of weather information, was used to prepare the weather data in DSSAT format. The soil profile information was obtained from the Soil Characterization Database of the National Resources Conservation Service of the USDA [25]. SBuilt, a DSSAT tool to facilitate the preparation of soil information and estimate missing data, was used to prepare the soil files in a DSSAT format (Table 1).
For model calibration and validation, data collected in 2014 and 2015 were used (Table 2 and Table 3). The cultivar coefficients of the CSM-CERES-Maize model (Table 2) were calibrated with data from 2014 using the Genotype Coefficient Calculator (GenCalc; [26]) tool of DSSAT. GenCalc iteratively estimates the genotype coefficients and compares the model outputs with measured data. The coefficients that minimize the sum of the squared error are selected [26] to create the new cultivar (Table 2), which is then used for applications of the model. In order to get the best match between simulated and observed data [27], the model was calibrated with observed data obtained under non-stressed conditions of our field research. Because CSM-CERES-Maize was developed for corn for grain [10], a parallel study using the same genotype and management practices [28] was conducted to obtain grain yield data. Then, the model was run to physiological maturity, but the aboveground biomass for silage corn was extracted from the daily outputs at R4 (dough) growth stage using the cumulative growing degree-days obtained from the field experiment to match the simulated R4. After calibration, the model was validated using the observed field data from the 2015 growing season (Table 3).
The calibrated CSM-CERES-Maize model was used to simulate the response of corn to water and N for conditions at three locations (i.e., Powell, Sheridan, and Lingle) in Wyoming, USA. For each location, the model was set to trigger irrigation when the soil available water at a management depth of 30 cm dropped below 50%. For each location, the seasonal analysis of DSSAT was set to run for a period of 31 years (1985–2015) to simulate growth, development, and N uptake of maize, and to determine the WUE of the crop. The long-term weather data was obtained from the NOAA-NCDC [29], the soil profile information for each location was obtained from the USDA-NRCS [25], and the management practices were kept the same as in the experimental field at all locations. The automated irrigation scenario (irrigation water applied when needed (IN)) combined with different rates of N from 0 kg N ha−1 to 360 kg N ha−1 were included in the model. The model was also set to simulate the potential yield of maize. To do so, at each location the CSM-CERES-Maize model simulated the growth and development of maize assuming no water and no N limitations.
The yield gap, defined as the difference between potential yield and actual (treatment) crop yield [30,31], was used to quantify and determine potential improvements of maize for silage yield across Wyoming. The yield gap was calculated for each N treatment of the 31-year outputs from each location, as compared to the model outputs for potential yield as in Equation (1).
2.3. Statistical Analysis
The CSM-CERES-Maize model performance was evaluated by comparing the simulated and measured results using three statistics, including coefficient of determination (R2), the Willmott [32] index of agreement (d; Equation (2)), and the root mean square error (RMSE) (Equation (3); [33]).
where n is the number of measured dataset, si is simulated data, mi is ith measured data, is the mean of the measured data. = si − ; = mi − . The closer the d-index of agreement to 1, the better the simulated results fit the observed data [32]. Conversely, the lower the RMSE, the better the model simulates the observed data [33].
The model outputs, including LAI, aboveground biomass, N uptake, and WUE, were analyzed using the PROC GLM procedure of the SAS statistical package [34] (SAS v. 9.4; SAS Institute, Inc., Cary, NC, USA). A post-hoc Least Significant Difference (LSD) mean separations was performed using the PROC MEANS of SAS. Data were checked for homogeneity of variances using the Bartlett test [35], and for normality of residuals using the Shapiro–Wilk test [36].
3. Results and Discussion
3.1. Observed Data
The LAI and aboveground biomass data collected during 2014 and 2015 growing seasons were used to calibrate and validate the CSM-CERES-Maize model (Table 3). For both the 2014 and 2015 results, high LAI values were obtained with the combination of 100ETc and 270 kg N ha−1 (Table 3). Similarly, high aboveground biomass was obtained with the combination of 100ETc and 270 kg N ha−1, and 100ETc and 180 kg N ha−1 in 2014 and 2015, respectively (Table 3). The LAI decreased with a decrease in fertilizer N, which is reported to reduce leaf expansion due to reduction on leaf length and leaf width [37,38]. Likewise, LAI decreased with water stress, which is reported to be the consequence of reduced photosynthetic assimilates as a result of accelerated stomatal closure [39]. The increase of the aboveground biomass with increased N rates was due to the increase of leaf expansion leading to increase of leaf absorption of photosynthetically active radiation [40], and accumulation of assimilates which increased the biomass of silage corn [41,42]. Similarly, aboveground biomass increased with irrigation water as a result of enhanced gas exchange (CO2, H2O) and sufficient supply of assimilates to get the plants to their final size and weight [43].
3.2. Model Calibration
The derived crop coefficients for the cultivar PIO8101HR14 (Table 2) allowed the model to satisfactorily simulate the anthesis date, which occurred 79 days after planting (DAP) compared to 80 DAP observed. The physiological maturity date was predicted to occur at 140 DAP compared to 143 DAP observed. The model also satisfactory simulated the LAI; the simulated average LAI in 2014 was 2.27 compared to 2.31 observed for the 100ETc 180 N treatment (R2 = 0.92; d-index = 0.93; RMSE = 0.66 m2 m−2) (Table 3). For the aboveground biomass, the model slightly underestimated the observed values (6395 kg DM ha−1 simulated versus 7092 kg DM ha−1 observed for 100ETc 180 N treatment) with an R2 equal to 0.90, d-index of 0.97, and the RMSE equal to 2332 kg ha−1 (Table 3).
The model validation using 2015 data showed that the simulated and the observed values for LAI and aboveground biomass were acceptable (R2 = 0.59; d-index = 0.88; RMSE = 0.72 m2 m−2 for LAI, and R2 = 0.95; d-index = 0.96; RMSE = 2599 kg ha−1 for aboveground biomass under 100ETc 180 N treatment; Table 3), indicating the suitability of the CSM-CRES-MAIZE model for broader use in the region.
3.3. Long-Term Simulation of Silage Maize Growth and Development
For the irrigation water applied, the averaged 31-year period of simulated value were comparable to the amount of water applied (Table 4). The seasonal irrigation water applied was 257 mm compared to 249, 262, and 280 mm for Powell, Sheridan, and Lingle, respectively (Table 4). This indicates that the water applied under subsurface drip irrigation was close enough to what the maize needed for adequate growth and development.
The 31-year outputs of the model were averaged to determine the LAI of maize for different N rates under the “IN” scenario (Figure 2). The LAI increased with increased N rate and showed a maximum at 180 kg N ha−1 for Powell and Sheridan conditions, and 120 kg N ha−1 for Lingle. The LAI values were stable with no significant difference above these rates. The LAI increase with increased N are reported to be due to leaf expansion and high photosynthetic rate under no stress conditions [6,44]. The average LAI across the three locations showed that 150 kg N ha−1 maximized LAI of corn for silage, indicating its stability across the state.
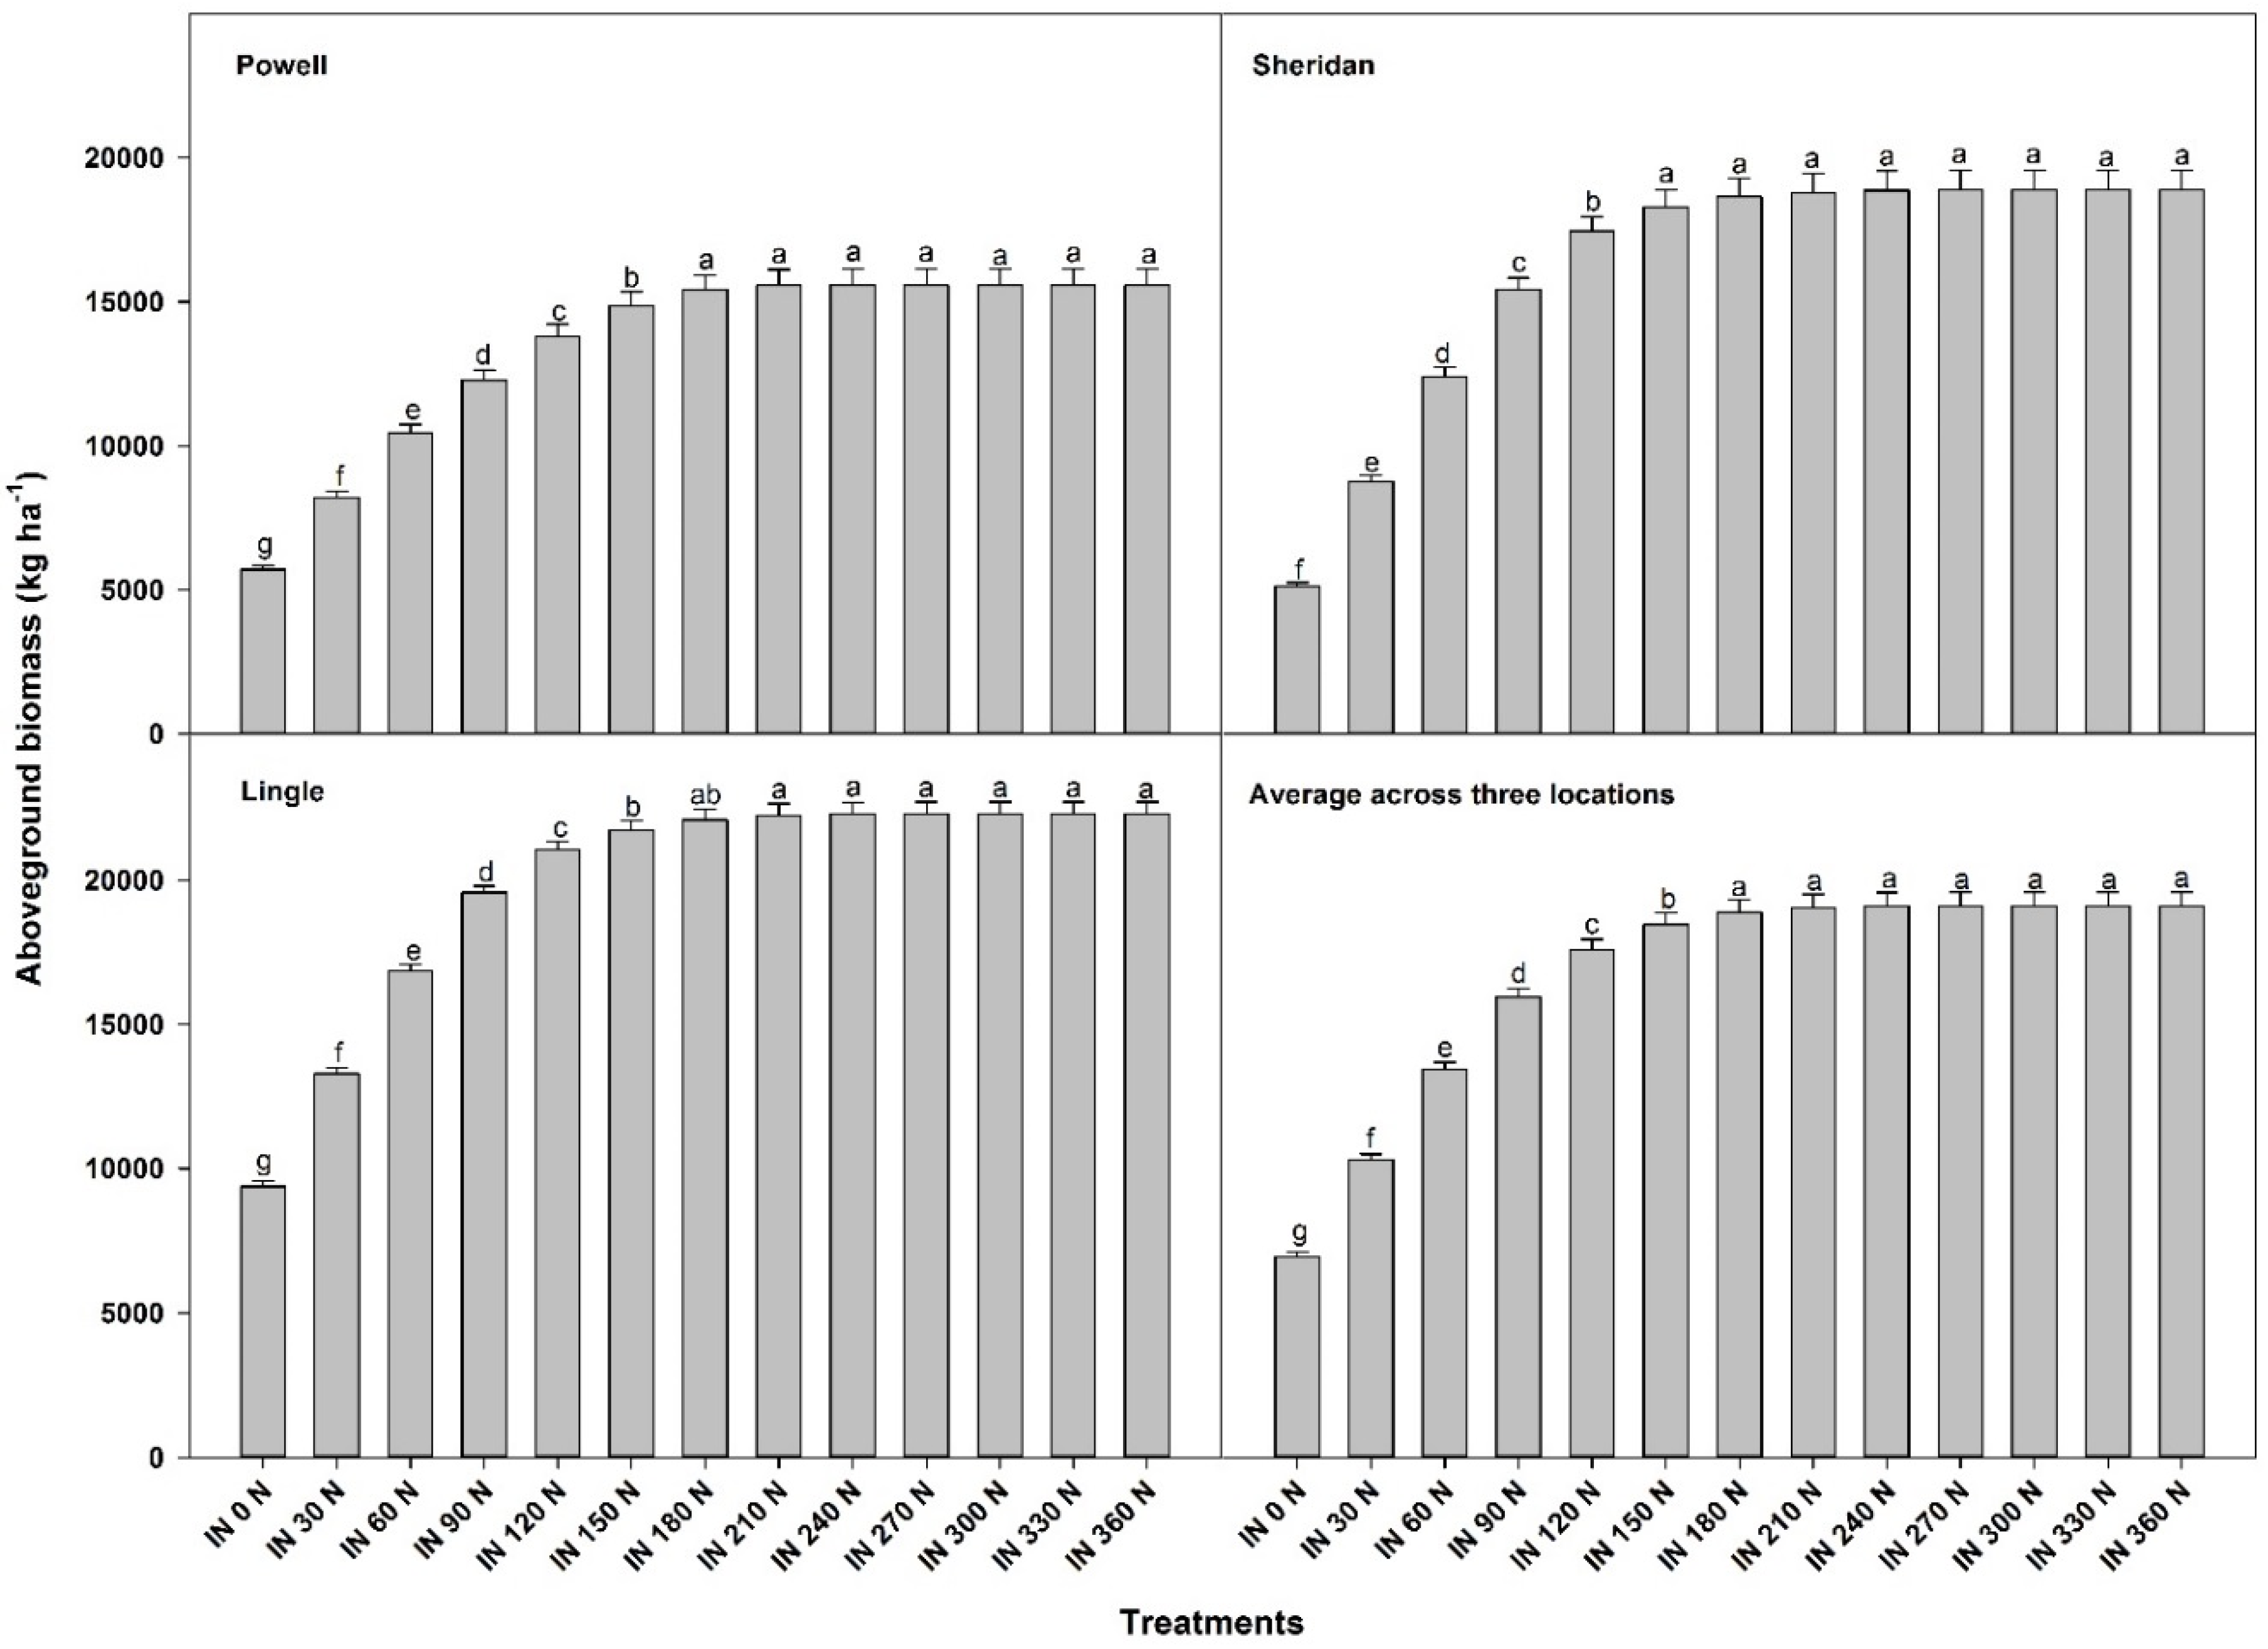
The aboveground biomass showed high values when at least 180, 150, and 180 kg N ha−1 applied for Powell, Sheridan, and Lingle, respectively (Figure 3). Geographically, high aboveground biomass values followed a trend of Lingle > Sheridan > Powell, which reflected the better soil and weather conditions for maize growth in Lingle compared to other locations. The aboveground biomass across the locations indicated that at least 180 kg N ha−1 is needed for optimum silage corn biomass in Wyoming.
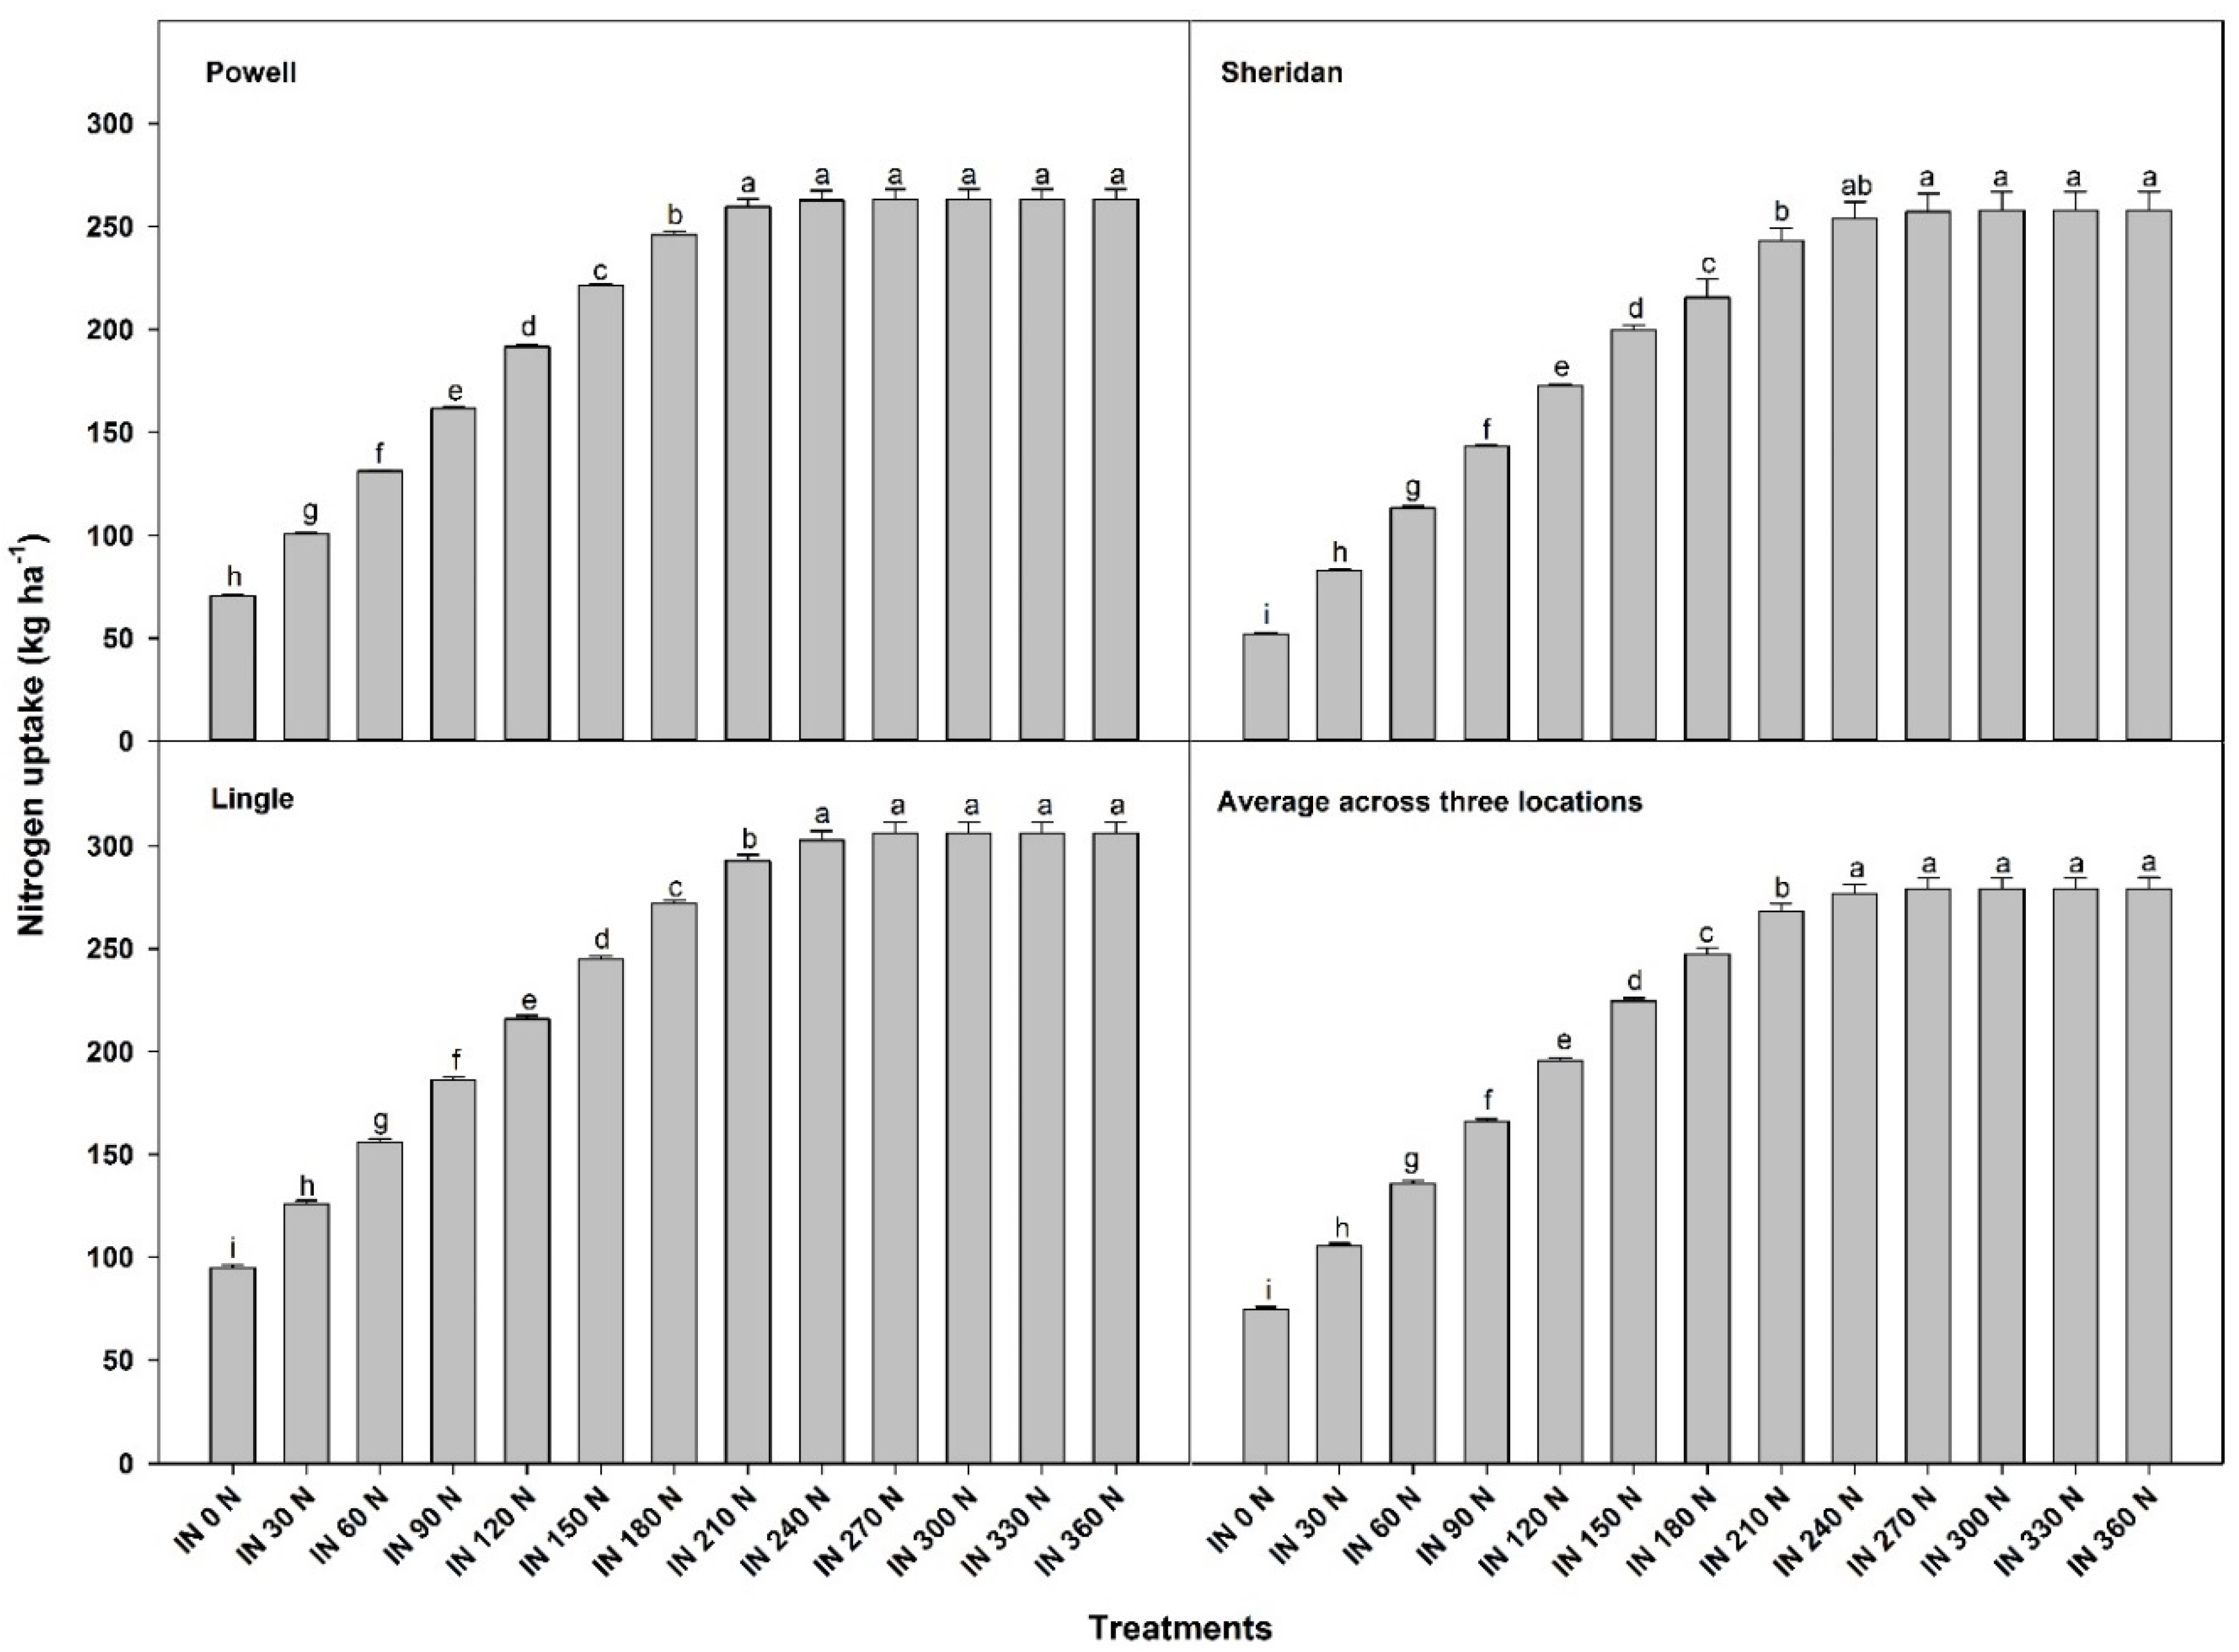
The seasonal N uptake of maize showed high values under at least 210 kg N ha−1 for Powell, and at least 240 kg N ha−1 for both Sheridan and Lingle (Figure 4). The N used by corn increased with increased N, and followed a trend of Lingle > Sheridan > Powell. The average across the three locations showed that at least 240 kg N ha−1 is needed for maximum N uptake. As for WUE, the simulated values followed a similar pattern as the aboveground biomass with high values starting at 180 kg N ha−1 for Powell and Lingle, and 150 kg N ha−1 for Sheridan (Figure 5). The average across the three locations indicated that at least 180 kg N ha−1 is needed to improve the WUE.
In summary, the long-term simulated results indicated that water and N fertilizer rate affected LAI, aboveground biomass, N uptake, and WUE of corn grown in different locations of Wyoming. For conditions in northern Florida, He et al. [45] used the CSM-CERES-Maize model to identify the best N rate on sandy soils using 33 years of data, and reported that the optimal rate of N fertilizer ranged between 196 kg N ha−1 to 224 kg N ha−1. Our simulated results showed high LAI, aboveground biomass, N uptake, and WUE for N rates ranging between 150 kg N ha−1 to 180 kg N ha−1.
3.4. Potential Yield, Yield Gap, and Opportunities for Increasing Silage Corn Yield
The yield gap analysis enabled the advancement of our understanding of the impact of water and fertilizer N in silage corn production in semi-arid Wyoming. In comparison with the potential yield, our simulated results indicate that the yield gap of silage corn could be reduced to less than 10% if 120 kg N ha−1 is applied with a proper irrigation amount (Table 5). The model results showed that the yield gap was reduced to 5%, 4%, and 3% under the IN 150 kg N ha−1 scenario for Powell, Sheridan, and Lingle, respectively (Table 5). The pooled average across the three locations indicates a potential to increase silage corn biomass and greatly reduce the yield gap to less than 5% if no less than 150 kg N ha−1 is applied (Table 5). The yield gap greatly reduced with the increasing rates of fertilizer N, suggesting the potential to increase the silage corn biomass if N rates are optimized.
4. Conclusions
The present study used a combination of field research and modeling to assess the response of corn for silage production to water and N at different locations in the semi-arid climate of Wyoming. The model provided acceptable outputs in which the simulated results were in agreement with the observed values. The simulated multi-year results indicated that water and N affected LAI, aboveground biomass, N uptake, and WUE of corn for silage grown in the semi-arid western region of the USA. At least 150 kg N ha−1 was needed to obtain highest LAI, aboveground biomass, N uptake, and WUE. The simulated results demonstrated stability across locations, suggesting the suitability of the model for broader use in the region. Our simulated results also indicated that the region has the potential to increase the aboveground biomass of corn for silage and to reduce the yield gap provided that irrigation water and N fertilization practices are well managed.
Author Contributions
A.N. designed the experiment, collected, and analyzed results, set up and executed the modeling component, and led the writing of the manuscript; M.A.I. administered and supervised the overall project, led and guided the lab and field work, contributed to funding, and reviewed the manuscript; A.O.M. conceptualized the study, helped in designing the study, agronomic management and obtaining funds, and reviewed the manuscript; A.G.G. contributed to the inception of the project and funding management, the design of the experiment, the setup of the modeling component, and reviewed the manuscript.
Funding
This research received no external funding.
Acknowledgments
This project was supported by the Department of Plant Sciences and the Wyoming Agricultural Experiment Station. Appreciation is extended to the field and laboratory assistants of the University of Wyoming Powell Research and Extension Center.
Conflicts of Interest
The authors declare no conflict of interest.
References
- Karamouz, M.; Ahmadi, B.; Zahmatkesh, Z. Developing an agricultural planning model in a watershed considering climate change impacts. J. Water Resour. Plan. Manag. 2013, 10, 349–363. [Google Scholar] [CrossRef]
- Mueller, N.D.; Gerber, J.S.; Johnston, M.; Ray, D.K.; Ramankutty, N.; Foley, J.A. Closing yield gaps through nutrient and water management. Lett. Res. Nat. 2012, 490, 254–257. [Google Scholar] [CrossRef] [PubMed]
- Howell, T.A. Irrigation scheduling research and its impact on water use. In Evapotranspiration and Irrigation Scheduling, Proceedings of the International Conference, San Antonio, TX, USA, 3–6 November 1996; Camp, C.R., Sadler, E.J., Yoder, R.E., Eds.; American Society of Agricultural Engineers: St. Joseph, MI, USA, 1996; pp. 21–33. [Google Scholar]
- Geerts, S.; Raes, D. Deficit irrigation as an on-farm strategy to maximize crop water productivity in dry areas. Agric. Water Manag. 2009, 96, 1275–1284. [Google Scholar] [CrossRef] [Green Version]
- Al-Karaki, G.N.; Al-Hashimi, M. Green fodder production and water use efficiency of some forage crops under hydroponic conditions. Int. Sch. Res. Not. Agron. 2012, 2012, 924672. [Google Scholar] [CrossRef]
- Pandy, R.K.; Maranville, J.W.; Admou, A. Deficit irrigation and nitrogen effects on maize in a Sahelian environment. I. Grain yield and yield components. Agric. Water Manag. 2000, 46, 1–13. [Google Scholar] [CrossRef]
- Koenig, R.; Nelson, M.; Barnhill, J.; Miner, D. Fertilizer Management for Grass and Grass-Legume Mixtures; AG-FG-03; Utah State University Cooperative Extension: Logan, UT, USA, 2002. [Google Scholar]
- Tucker, M.R. Essential Plant Nutrients: Their Presence in North Carolina Soils and Role in Plant Nutrition; Department of Agriculture and Consumer Services: Agronomic Division, NC, USA, 1999; p. 9. [Google Scholar]
- Rana, G.; Katerji, N. Measurement and estimation of actual evapotranspiration in the field under Mediterranean climate: A review. Eur. J. Agron. 2000, 13, 125–153. [Google Scholar] [CrossRef]
- Jones, J.W.; Hoogenboom, G.; Porter, C.H.; Boote, K.J.; Batchelor, W.D.; Hunt, L.A.; Wilkens, P.W.; Singh, U.; Gijsman, A.J.; Ritchie, J.T. DSSAT Cropping System Model. Eur. J. Agron. 2003, 18, 235–265. [Google Scholar] [CrossRef]
- López-Cedrón, F.X.; Boote, K.J.; Pineirob, C.J.; Sau, F. Improving the CERES Maize model ability to simulate water deficit impact on maize production and yield components. Agron. J. 2008, 100, 296–307. [Google Scholar] [CrossRef]
- Staggenborg, S.A.; Vanderlip, R.L. Crop Simulation Models can be used as dry-land cropping systems research tools. Agron. J. 2005, 97, 378–384. [Google Scholar] [CrossRef]
- Kaur, G.; Garcia y Garcia, A.; Norton, U.; Persson, T.; Kelleners, T. Effects of cropping practices on water-use and water productivity of dryland winter wheat in the high plains ecoregion of Wyoming. J. Crop Improv. 2015, 29, 491–517. [Google Scholar] [CrossRef]
- Monteith, J.L. The quest for balance in crop modelling. Agron. J. 1996, 88, 695–697. [Google Scholar] [CrossRef]
- Hoogenboom, G.; Jones, J.W.; Wilkens, P.W.; Porter, C.H.; Boote, K.J.; Hunt, L.A.; Singh, U.; Lizaso, J.I.; White, J.W.; Uryasev, O.; et al. Decision Support System for Agrotechnology Transfer (DSSAT) Version 4.6 (www.DSSAT.net); DSSAT Foundation: Prosser, Washington, DC, USA, 2015. [Google Scholar]
- Chun, L.W.; Anlauf, R.; Ma, Y. Application of the DSSAT model to simulate wheat growth in Eastern China. J. Agric. Sci. 2013, 5, 198–208. [Google Scholar]
- Iglesias, A. Use of DSSAT models for climate change impact assessment, calibration and validation of CERES-Wheat and CERES-Maize in Spain. In Proceedings of the CGE Hands-on Training Workshop on V&A Assessment of the Asia and the Pacific Region, Jakarta, Indonesia, 20–24 March 2006. [Google Scholar]
- Ritchie, J.T. Soil water balance and plant water stress. In Understanding Options for Agricultural Production; Tsugi, G.Y., Hoogenboom, G., Thornton, P.K., Eds.; Kluwer Academic Publishers: Dordrecht, The Netherlands, 1998; pp. 41–54. [Google Scholar]
- Uehara, G.; Tsuji, G.Y. Overview of IBSNAT. In Understanding Options for Agricultural Production; Tsuji, G.Y., Hoogenboom, G., Thornton, P.K., Eds.; Kluwer Academic Publishers: Dordrecht, The Netherlands, 1998; pp. 1–7. [Google Scholar]
- Doorenbos, J.; Pruitt, W. Guidelines for Predicting Crop Water Requirements, Irrigation and Drainage Paper 24; FAO: Rome, Italy, 1977. [Google Scholar]
- Allen, R.G.; Pereira, L.S.; Raes, D.; Smith, M. Crop Evapotranspiration-Guidelines for Computing Crop Water Requirements, Irrigation and Drainage Paper 56; FAO: Rome, Italy, 1998. [Google Scholar]
- Walter, I.; Allen, R.; Elliott, R.; Jensen, M.; Itenfisu, D.; Mecham, B.; Howell, T.; Snyder, R.; Brown, P.; Echings, S.; et al. ASCE’s Standardized Reference Evapotranspiration Equation (ASCE). In Proceedings of the Watershed Management and Operations Management Conferences 2000, Fort Collins, CO, USA, 20–24 June 2000; pp. 1–11. [Google Scholar]
- Ritchie, S.W.; Hanway, J.J.; Benson, G.O. How a Corn Plant Develops; Iowa State University of Science and Technology, Cooperative Extension Service: Ames, IA, USA, 1993. [Google Scholar]
- Pickering, N.B.; Hansen, J.W.; Jones, J.W.; Wells, C.M.; Chan, V.K.; Godwin, D.C. WeatherMan: A utility for managing and generating daily weather data. Agron. J. 1994, 86, 332–337. [Google Scholar] [CrossRef]
- USDA-NRCS. Irrigation Water Management. Program Act No. 449 (2012). Available online: http://www.nrcs.usda.gov (accessed on 14 October 2016).
- Hunt, L.A.; Pararajasingham, S.; Jones, J.W.; Hoogenboom, G.; Imamura, D.T.; Ogoshi, R.M. GENCALC: Software to facilitate the use of crop models for analyzing field experiments. Agron. J. 1993, 85, 1090–1094. [Google Scholar] [CrossRef]
- Liu, H.L.; Yang, J.Y.; Drury, C.F.; Reynolds, W.D.; Tan, C.S.; Bai, Y.L.; He, P.; Jin, J.; Hoogenboom, G. Using the DSSAT-CERES-Maize model to simulate crop yield and nitrogen cycling in fields under long-term continuous maize production. Nutr. Cycl. Agroecosyst. 2011, 89, 313–328. [Google Scholar] [CrossRef]
- Abritta, M.; Garcia y Garcia, A. Subsurface and Sprinkler Irrigated Corn; University of Wyoming, Agricultural Experiment Station, Field Days Bull: Laramie, WY, USA, 2012; pp. 129–130. [Google Scholar]
- NOAA-NCDC-National Climatic Data Center. 2016. Available online: http://www.ncdc.noaa.gov (accessed on 14 October 2016).
- Evans, L.T.; Fischer, R.A. Yield potential: Its definition, measurement and significance. Crop Sci. 1999, 39, 1544–1551. [Google Scholar] [CrossRef]
- Lobell, D.B.; Cassman, K.G.; Field, C.B. Crop yield gaps: Their importance, magnitudes, and causes. Annu. Rev. Environ. Resour. 2009, 34, 179–204. [Google Scholar] [CrossRef]
- Willmott, C.J.; Akleson, G.S.; Davis, R.E.; Feddema, J.J.; Klink, K.M.; Legates, D.R.; Odonnell, J.; Rowe, C.M. Statistics for the evaluation and comparison of models. J. Geophys. Res. 1985, 90, 8995–9005. [Google Scholar] [CrossRef]
- Loague, K.; Green, R.E. Statistical and graphical methods for evaluating solute transport models: Overview and application. J. Contam. Hydrol. 1991, 7, 51–73. [Google Scholar] [CrossRef]
- SAS Institute. SAS Proprietary Software Version 9.4; SAS Institute Inc.: Cary, NC, USA, 2012. [Google Scholar]
- Bartlett, M.S. Properties of sufficiency and statistical tests. Proc. R. Soc. Lond. Ser. A 1937, 160, 268–282. [Google Scholar] [CrossRef] [Green Version]
- Shapiro, S.S.; Wilk, M.B. An analysis of variance test for normality (complete samples). Biometrika 1965, 52, 591–611. [Google Scholar] [CrossRef]
- Ma, B.L.; Morrison, M.G.; Dwyer, L.D. Canopy light reflectance and field greenness to assess nitrogen fertilization and yield of maize. Agron. J. 1996, 88, 915–920. [Google Scholar] [CrossRef]
- Valero, J.A.; Juan, M.; Maturano, A.A.; Ramírez, J.M.T.; Benito, M.; Alvarez, J.F.O. Growth and nitrogen use efficiency of irrigated maize in a semiarid region as affected by nitrogen fertilization. Span. J. Agric. Res. 2005, 3, 134–144. [Google Scholar] [CrossRef]
- Kaiser, W.M. Effect of water deficit on photosynthetic capacity. Physiol. Plant. 1987, 71, 142–149. [Google Scholar] [CrossRef]
- Hugh, J.E.; Richard, F.D. Effect of drought stress on leaf and whole canopy radiation use efficiency and yield of maize. Agron. J. 2003, 95, 688–696. [Google Scholar]
- Lindquist, J.L.; Arkebauer, T.J.; Walters, D.T.; Gassman, K.G.; Dobermann, A. Maize radiation use efficiency under optimal growth conditions. Agron. J. 2005, 97, 72–78. [Google Scholar] [CrossRef]
- Hammad, H.M.; Ahmad, A.; Azhar, F.; Khaliq, T.; Wajid, A.; Nasim, W.; Farhad, W. Optimizing water and nitrogen requirement in maize (Zea Mays L.) under semi-arid conditions of Pakistan. Pak. J. Bot. 2011, 43, 2919–2923. [Google Scholar]
- Yang, J.C.; Zhang, J.H. Grain filling of cereals under soil drying. New Phytol. 2006, 169, 223–236. [Google Scholar] [CrossRef] [PubMed]
- Muchow, R.C.; Davis, R. Effect of nitrogen supply on the comparative productivity of maize and sorghum in a semi-arid tropical environment: II. Radiation interception and biomass accumulation. Field Crops Res. 1988, 18, 17–30. [Google Scholar] [CrossRef]
- He, J.; Dukes, M.D.; Hochmuth, G.J.; Jones, J.W.; Graham, W.D. Identifying irrigation and nitrogen best management practices for sweet corn production on sandy soils using CERES-Maize model. Agric. Water Manag. 2012, 109, 61–70. [Google Scholar] [CrossRef]
Figure 1.
Weather conditions during 2014 and 2015 in Powell, Wyoming. DOY = Day of the year.

Figure 2.
Seasonal analysis for leaf area index at the three locations that were evaluated and the average across the three locations using 31 years of data. IN = Irrigation water applied when needed. Within location, means with different letters are significantly different based on the Least Significant Difference (LSD) (0.05). The error bars indicate the standard error.

Figure 3.
Seasonal analysis for aboveground biomass at the three locations that were evaluated and the average across the three locations using 31 years of data. IN = Irrigation water applied when needed. Within location, means with different letters are significantly different based on the Least Significant Difference (LSD) (0.05). The error bars indicate the standard error.

Figure 4.
Seasonal analysis for N uptake at the three locations that were evaluated and the average across the three locations using 31 years of data. IN = Irrigation water applied when needed. Within location, means with different letters are significantly different based on the Least Significant Difference (LSD) (0.05). The error bars indicate the standard error.

Figure 5.
Seasonal analysis for water use efficiency at the three locations that were evaluated and the average across the three locations using 31 years of data. IN = Irrigation water applied when needed. Within location, means with different letters are significantly different based on the Least Significant Difference (LSD) (0.05). The error bars indicate the standard error.


Table 1.
Soil properties used in the model for Powell (Park County).
| Depth (cm) | Master Horizon | Lower Limit (cm3 cm−3) | Upper Limit, Drained (cm3 cm−3) | Upper Limit, Saturated (cm3 cm−3) | Sat. Hydraulic Conductivity (cm h−1) | Bulk Density (g cm−3) | Organic Carbon (%) | Clay (%) | Silt (%) | Coarse Fraction (%) | pH in Water | CEC § (cmol kg−1) |
|---|---|---|---|---|---|---|---|---|---|---|---|---|
| 3 | A1 | 0.208 | 0.390 | 0.410 | 1.32 | 0.82 | 8.34 | 15.4 | 37.0 | 37.0 | 4.9 | 28.4 |
| 13 | A2 | 0.153 | 0.303 | 0.353 | 1.32 | 0.98 | 5.37 | 14.9 | 35.1 | 38.0 | 4.8 | 23.6 |
| 25 | A3 | 0.078 | 0.171 | 0.293 | 1.32 | 1.23 | 1.84 | 11.3 | 36.9 | 41.0 | 5.0 | 16.0 |
| 46 | Bs1 | 0.051 | 0.123 | 0.258 | 2.59 | 1.35 | 0.61 | 9.60 | 38.1 | 44.0 | 4.9 | 14.5 |
| 66 | Bs2 | 0.050 | 0.114 | 0.241 | 2.59 | 1.42 | 0.38 | 10.9 | 34.2 | 45.0 | 4.8 | 14.9 |
| 107 | Bt | 0.051 | 0.116 | 0.240 | 1.32 | 1.43 | 0.22 | 12.2 | 36.4 | 45.0 | 5.2 | 16.3 |
| 178 | 2C | 0.041 | 0.092 | 0.323 | 6.11 | 1.55 | 0.05 | 4.50 | 13.2 | 18.0 | 6.8 | 13.2 |
§ CEC = Cations exchange capacity.
Table 2.
The calibrated corn cultivar coefficients for the cultivar PIO8107HR14.
| Code | Definition | Default | Calibrated |
|---|---|---|---|
| P1 | Thermal time from seedling emergence to the end of juvenile period (>8 °C degree days) | 200 | 153.6 |
| P2 | Extent to which development is delayed for each hour when the photoperiod is greater than 12.5 h | 0.7 | 0.51 |
| P5 | Thermal time from silking to physiological maturity (degree days) | 800 | 950 |
| G2 | Maximum possible number of kernels per plant | 715 | 810 |
| G3 | Kernel optimum filling rate during the linear grain filling stage (mg d−1) | 8.5 | 8.6 |
| PHINT | Phylochron interval between successive leaf tip appearances (degree days) | 38.9 | 46.17 |
Table 3.
Measured and simulated data for the model calibration (2014) and validation (2015).
| Year | Treatment | LAI (m2 m−2) | Aboveground biomass (kg DM ha−1) | ||||||||
|---|---|---|---|---|---|---|---|---|---|---|---|
| Observed | Simulated | R2 | RMSE | d-Stat | Observed | Simulated | R2 | RMSE | d-Stat | ||
| 2014 | 100ETc 0 N | 1.99 | 2.26 | 0.92 | 0.58 | 0.94 | 6433 | 6404 | 0.74 | 3197 | 0.92 |
| 100ETc 90 N | 2.05 | 2.28 | 0.93 | 0.60 | 0.93 | 6118 | 6384 | 0.84 | 2374 | 0.96 | |
| 100ETc 180 N | 2.31 | 2.27 | 0.92 | 0.66 | 0.93 | 7092 | 6395 | 0.90 | 2332 | 0.97 | |
| 100ETc 270 N | 2.40 | 2.82 | 0.99 | 0.45 | 0.98 | 7503 | 7170 | 0.91 | 2199 | 0.98 | |
| 100ETc 360 N | 2.19 | 2.3 | 0.93 | 0.66 | 0.93 | 7350 | 6397 | 0.92 | 2534 | 0.96 | |
| 2015 | 100ETc 0 N | 1.63 | 1.70 | 0.92 | 0.28 | 0.97 | 7246 | 5508 | 0.98 | 2117 | 0.96 |
| 100ETc 90 N | 1.91 | 2.59 | 0.67 | 0.99 | 0.85 | 8610 | 6788 | 0.95 | 2355 | 0.97 | |
| 100ETc 180 N | 1.85 | 2.00 | 0.59 | 0.72 | 0.88 | 8959 | 6788 | 0.95 | 2599 | 0.96 | |
| 100ETc 270 N | 1.99 | 2.60 | 0.70 | 0.92 | 0.86 | 8050 | 5354 | 0.98 | 3172 | 0.94 | |
| 100ETc 360 N | 1.88 | 2.00 | 0.69 | 0.62 | 0.91 | 8142 | 5354 | 0.98 | 3239 | 0.94 | |
d = Index of agreement; RMSE = root mean square error; LAI = leaf area index.
Table 4.
Irrigation water applied (mm) during the growing season compared to simulated data for the three locations.
Table 4.
Irrigation water applied (mm) during the growing season compared to simulated data for the three locations.
| DOY | Measured | Simulated | |||
|---|---|---|---|---|---|
| Powell | Sheridan | Lingle | Pooled Average | ||
| 170 | 6 | 0 | 3 | 0 | 1 |
| 173 | 7 | 2 | 1 | 2 | 2 |
| 175 | 4 | 2 | 1 | 4 | 2 |
| 180 | 10 | 10 | 6 | 18 | 11 |
| 186 | 17 | 16 | 14 | 18 | 16 |
| 191 | 18 | 14 | 16 | 22 | 17 |
| 199 | 25 | 31 | 30 | 31 | 31 |
| 203 | 10 | 14 | 19 | 17 | 17 |
| 206 | 28 | 13 | 12 | 19 | 15 |
| 213 | 28 | 30 | 32 | 27 | 30 |
| 220 | 23 | 27 | 26 | 29 | 27 |
| 227 | 28 | 28 | 28 | 26 | 27 |
| 240 | 25 | 29 | 38 | 35 | 34 |
| 250 | 28 | 32 | 36 | 34 | 34 |
| Total | 257 | 249 | 262 | 280 | 263 |
DOY = Day of the year.
Table 5.
Yield gap (%) of the treatments used for corn grown for silage in Wyoming.
| Treatment | Powell | Sheridan | Lingle | Pooled Average |
|---|---|---|---|---|
| IN 0 N | 173 | 271 | 139 | 194 |
| IN 30 N | 90 | 117 | 68 | 92 |
| IN 60 N | 49 | 53 | 33 | 45 |
| IN 90 N | 27 | 23 | 14 | 22 |
| IN 120 N | 13 | 9 | 6 | 10 |
| IN 150 N | 5 | 4 | 3 | 4 |
| IN 180 N | 1 | 2 | 1 | 2 |
| IN 210 N | 0 | 1 | 1 | 1 |
| IN 240 N | 0 | 1 | 0 | 1 |
| IN 270 N | 0 | 1 | 0 | 0 |
| IN 300 N | 0 | 1 | 0 | 0 |
| IN 330 N | 0 | 1 | 0 | 0 |
| IN 360 N | 0 | 1 | 0 | 0 |
IN = Irrigation water applied when needed.
© 2018 by the authors. Licensee MDPI, Basel, Switzerland. This article is an open access article distributed under the terms and conditions of the Creative Commons Attribution (CC BY) license (http://creativecommons.org/licenses/by/4.0/).
Share and Cite
MDPI and ACS Style
Nilahyane, A.; Islam, M.A.; O. Mesbah, A.; Garcia y Garcia, A. Evaluation of Silage Corn Yield Gap: An Approach for Sustainable Production in the Semi-Arid Region of USA. Sustainability 2018, 10, 2523. https://doi.org/10.3390/su10072523
AMA Style
Nilahyane A, Islam MA, O. Mesbah A, Garcia y Garcia A. Evaluation of Silage Corn Yield Gap: An Approach for Sustainable Production in the Semi-Arid Region of USA. Sustainability. 2018; 10(7):2523. https://doi.org/10.3390/su10072523
Chicago/Turabian StyleNilahyane, Abdelaziz, M. Anowarul Islam, Abdel O. Mesbah, and Axel Garcia y Garcia. 2018. "Evaluation of Silage Corn Yield Gap: An Approach for Sustainable Production in the Semi-Arid Region of USA" Sustainability 10, no. 7: 2523. https://doi.org/10.3390/su10072523
Note that from the first issue of 2016, this journal uses article numbers instead of page numbers. See further details here.