Grass-Legume Mixtures for Improved Soil Health in Cultivated Agroecosystem


1
College of Agriculture, Food & Natural Resources, University of Missouri Extension, Chariton County, Keytesville, MO 65261, USA
2
Department of Plant Sciences, University of Wyoming, Department 3354, 1000 E. University Ave., Laramie, WY 82071, USA
*
Author to whom correspondence should be addressed.
Sustainability 2018, 10(8), 2718; https://doi.org/10.3390/su10082718
Submission received: 1 July 2018
/
Revised: 30 July 2018
/
Accepted: 30 July 2018
/
Published: 2 August 2018
(This article belongs to the Special Issue Agroecology: Principles and Application for Efficient and Sustainable Agricultural Production)
Abstract
:Planting grass-legume mixtures may be a good option to improve soil health in addition to increased forage productivity, improved forage nutritive value, and net farm profit in a hay production system. A field experiment was conducted from 2011 to 2014 at Lingle, Wyoming to evaluate soil microbial biomass under different seeding proportions of two forage grasses (meadow bromegrass, Bromus biebersteinii Roem. & Schult.; and orchardgrass, Dactylis glomerata L.) and one legume (alfalfa, Medicago sativa L.). Nine treatments included monoculture grass, monoculture legume, one grass and one legume mixture, two grasses and one legume mixture, and a control (not seeded with grass or legume). Monoculture grass received either no nitrogen (N) or N fertilizer (150 kg N ha−1 year−1 as urea) whereas monoculture legume, grass-legume mixtures, and control plots received no N fertilizer. The study was laid out as a randomized complete block design with three replications. The plots were harvested 3–4 times each year after the establishment year. Soil samples were collected and analyzed for microbial biomass using phospholipid fatty acid (PLFA) analysis at the end of May in 2013 and 2014. Soil samples were also analyzed for mineralizable carbon (C) and N in 2013 and 2014. The total above-ground plant biomass was higher in 50–50% mixture of grass and alfalfa than monoculture alfalfa and monoculture grass (with and without N fertilizer) during the entire study period. The application of N fertilizer to the grass hay production system had little effect on improving mineralizable soil C, N, and soil microbial biomass. However, grass-legume mixture without N fertilizer had great effect on improvement of mineralizable soil C and N, and total, bacterial, and actinomycetes microbial biomass in soil. The 50–50% mixture of grass and alfalfa performed consistently well and can be considered to use in Wyoming conditions for improving soil health and forage productivity.
1. Introduction
Soil microorganisms are the key driver for various soil biochemical processes such as organic matter decomposition, nutrient cycling, and soil aggregate formation [1,2]. These microorganisms rely on organic carbon (C) for their growth, development, and activities in soil [3]. Plants provide organic C to those microorganisms in the form of root exudates, secretions, and mucilage into the rhizosphere [4,5].
The total biomass and diversity of microorganisms in soil are good indicators of soil quality and health. The abundance, diversity, and activity of soil microorganisms depends on soil and plant management factors [6,7]. The factors that help to build up organic matter in soil also help to increase abundance, activity, and diversity of microorganisms in soil [8]. For example, soil under the perennial crop production system has a higher soil microbial biomass and diversity compared to annual crop production systems due to the reduction in soil disturbance and addition of more organic residues into the soil [9,10]. Similarly, plant species grown in soil also have a strong influence on microbial population, activity [11], and community structure [12]. There is good correlation between aboveground plant species and the belowground microbial community [11]. This is due to variations in quantity and quality of rhizodeposits under different plant production systems [13,14] and increased abundance and diversity of both the aboveground species and belowground microbial population [15].
Inclusion of legume in the grass hay production may increase the total microbial population and their activity in the soil [16]. Researchers have reported variations in abundance, diversity, and activity of soil microbes under legume and non-legume systems [17]. As rhizodeposits in legume are higher in substrate quality with low C/N (nitrogen) ratio, higher total microbial biomass in soil is found under legume than non-legume plants [14]. The higher substrate utilization by soil microbes under legume than non-legume is due to the release of more amino-N by legume roots and less C/N ratios of the substrate [18]. In contrast, non-legume plant species such as grasses secrete less root exudates and have less presence of microorganisms in their rhizosphere [19].
Forage crops grown for hay production are one of the most important economic crops in Wyoming [20]. Cool season perennial grasses such as meadow bromegrass (Bromus biebersteinii Roem. & Schult.) and orchardgrass (Dactylis glomerata L.) are commonly grown and well adapted cool season perennial grasses under irrigated conditions in Wyoming [21]. Grass hay producers apply a significant amount of N fertilizers to increase productivity. Chemical fertilizers, however, increase production costs and may degrade the soil health by reducing organic matter and microbial population and activity [22]. Grass-legume mixtures could be a good alternative to reduce production costs, increase forage yield and quality, and improve soil health. However, information is lacking on the effect of different seeding mass ratios of grass-legume mixtures on soil microbial properties. The objective of the study was to assess the effect of monoculture grass, monoculture legume, and mixtures of grass and legume on soil mineralizable C, N, and soil microbial biomass.
2. Materials and Methods
2.1. Field Experiments
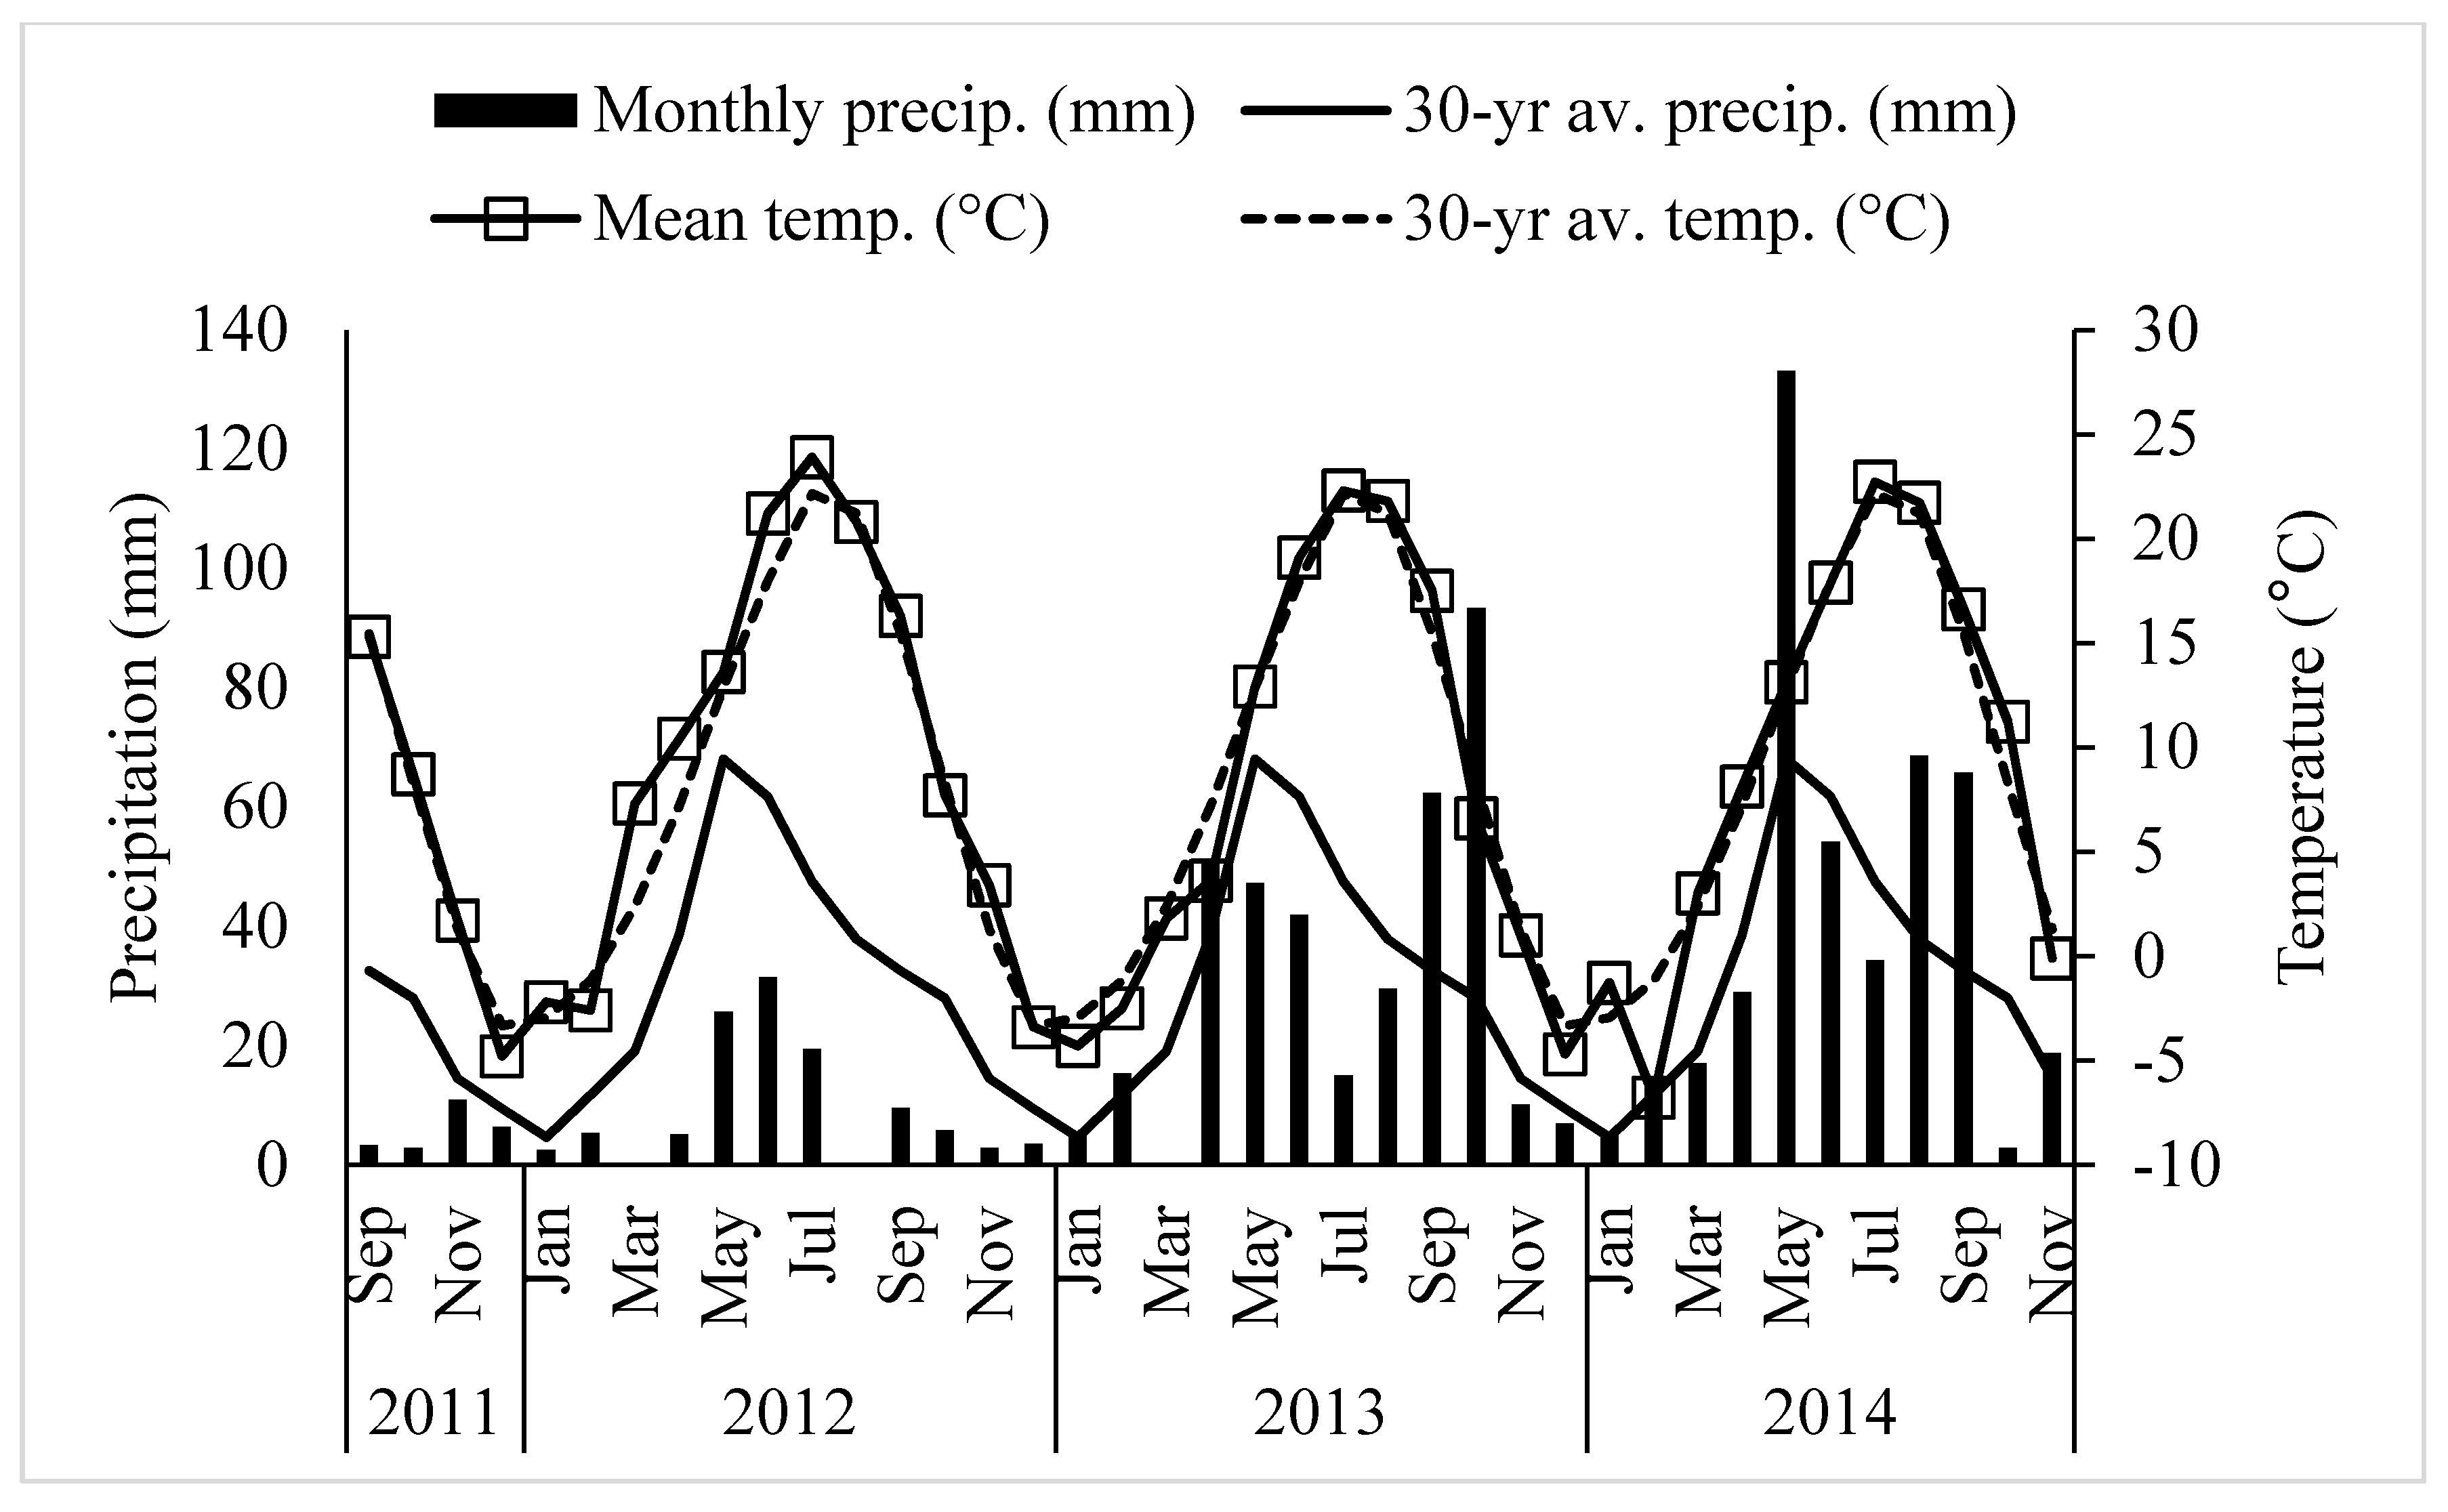
Field research was conducted at the University of Wyoming James C. Hageman Sustainable Agriculture Research and Extension Center near Lingle, Wyoming (42°18′ latitude N, 104°30′ longitude W; elevation 1272 m) from 2011 to 2014. The study was planted on September 20, 2011. The crop growing season at this location is short with 125 frost-free (above −4 °C) days per year. The 30-yearr average annual temperature and precipitation were 8.4 °C and 373 mm, respectively. The detailed weather data during the study period at Lingle is presented in Figure 1. Soil type was a fine-loamy, mixed, superactive, calcareous, mesic Aridic Ustifluvents [23] with pH of 8.0 and organic matter content of 20 g kg−1 with low inorganic and total soil N (Table 1). Different seeding mass ratios of alfalfa, meadow bromegrass, and orchardgrass with two levels of N (0 and 150 kg N ha−1 year−1 as urea) were used for the study (Table 2). Nine treatments included monoculture grass, monoculture legume, one grass and one legume mixtures, two grasses and one legume mixture and control (not seeded with any grass or legume and not applied any fertilizers). Nitrogen fertilizer was not applied to monoculture legume and grass-legume mixtures, while monoculture grass received either no N or 150 kg N ha−1 year−1. The experiment was a randomized complete block design with three replications and experimental plots measuring 1.5 m × 6 m.
The field experiment was under sprinkler irrigation system and received a consistent amount of water (2.5 cm per week) during the growing season each year. The land was previously planted with winter wheat (Triticum aestivum L.). The seeding rates of alfalfa, meadow bromegrass and orchardgrass were 22.5, 22.5, and 7 kg pure live seed ha-1, respectively. The alfalfa seed was inoculated with Sinorhizobium meliloti before planting. The amount of seeds for all crops were calculated and weighed on the basis of their proportion in the treatment and mixed together. The seeding was done using a double disc cone planter (a custom built 7 row 23 cm) with 23 cm row spacing and 1.5 cm planting depth. Phosphatic (P) fertilizer (58 kg P ha−1 year−1) was applied in early spring for all plots recommended after soil testing. No potassium (K) fertilizer was applied to plots due to high soil K content. The N fertilizer was applied to grasses in two splits, first in early spring and second in late fall in all years. Plots were harvested 3–4 times each year except establishment year and forage dry matter (DM) yield was recorded. Additionally, in the mixture plots at each harvest, forage samples were separated by species, recorded the fresh and dry weight, and calculated the DM yield of each species for estimating the proportion of biomass with their seeding mass ratio and total yield.
2.2. Soil Sampling
Composite soil samples were collected from 0 to 15 cm depth (n = 7) before applying treatments to analyze basic physical and chemical properties. The soil samples were air-dried and sieved through 2 mm sieve and used for the analysis of soil texture, pH, organic matter, total N, inorganic N, available P, exchangeable K, Ca, Mg, and Na, and electrical conductivity.
Different sets of soil samples were collected using core sampler (0–15 cm depth) at the end of May in 2013 and 2014 to analyze phospholipid fatty acid (PLFA). Three non-composited soil samples were collected from each experimental plot. The forage crops at the plots were at the actively growing (pre-flowering) stage when the soil samples were collected. The soil samples were collected three days after irrigation in the field and soil was moist when collected. The collected soil samples were kept in Ziplock plastic bags and stored in an insulated cooler box containing dry ice and transported to the laboratory. The soil samples were stored at −20 °C freezer in the laboratory and were used for PLFA analysis.
Another set of soil samples was collected using a core sampler from 0 to 15 cm depth at five sampling points from each plot before applying treatments in 2011 for mineralizable C and N analysis. Collected samples from each plot were composited and homogenized at the time of sampling. The soil samples were stored in a cooler box with dry ice to transport to the laboratory and stored in a 4 °C refrigerator before laboratory analysis. The analysis was performed within 24 h of soil sampling. Same procedures of soil sampling were followed at the end of May 2013 and 2014 to analyze mineralizable C and N.
2.3. Soil Sample Analysis for Basic Physical and Chemical Properties
The basic soil physical and chemical properties were analyzed using standard methods and are presented in Table 1.
2.4. Soil Phospholipid Fatty Acid Analysis
Phospholipid fatty acid analysis was used to determine the relative abundance of soil bacteria, fungi, actinomycetes, and protozoa. The fatty acids were extracted from 5 g of lyophilized soils using a 1:2:0.8 chloroform:methanol:phosphate buffer mixture based on a modified Blight–Dyer methodology [29]. Phospholipid fatty acids were separated from neutral and glycolipid fatty acids in a solid-phase extraction column. The separated PLFA were methylated with mild methanoic potassium hydroxide (KOH) and analyzed using an Agilent 6890 gas chromatograph with autosampler, split-splitless injector (7683B series), and flame ionization detector (Agilent Technologies Inc.). The system was controlled with an Agilent Chemstation and MIDI Sherlock software. Different PLFA biomarkers were used to classify the relative abundances of soil microbial groups including bacteria, fungi, actinomycetes, and protozoa. Gram positive bacteria were identified using iso- and anteiso-branched fatty acids and gram negative bacteria by monounsaturated fatty acids. Fungi were identified using 18:2 ω6c, arbuscular mycorrhizal fungi by 16:1 ω5c, protozoa by 20:4 ω6 and actinomycetes by 10-methyl fatty acids [9,30,31,32]. Total microbial biomass was determined by adding the concentrations of all PLFAs present in the soil sample.
2.5. Soil Mineralizable Carbon and Nitrogen Analysis
The refrigerated soil samples from all plots were incubated within 24 h of sampling. Twenty grams of soil were incubated aerobically for 14 days in an incubation setup in the laboratory to determine the mineralizable C [33]. All soil samples were placed in plastic specimen cups and brought to field capacity moisture (~23% gravimetric soil water content) by adding deionized water. Each specimen cup was placed in a 1 L canning jar with a lid modified to hold a 1.5 cm long butyl rubber stopper. Each jar was added to 5 mL of deionized water to maintain the relative humidity inside the jar. All jars were stored in a dark cabinet at room temperature (23.5 ± 1 °C) with an air pressure of 1.01 atm. One blank jar (no soil) was also incubated to monitor the background CO2 concentration. From each jar, a headspace syringe using a 22-gauge needle on a rubber stopper. The CO2 samples from the jars were collected on days 1, 7, and 14. Before CO2 sampling from the jar, the air inside the jar was mixed thoroughly by plunging the syringe up and down three times. After CO2 sampling, the lids were opened and jars were flushed with a vacuum air pump to re-equilibrate the CO2 concentration in jar and air. All jars containing samples were incubated again until the next reading. The CO2-C concentration sampled by syringe was measured in an infrared gas analyzer (LICOR INC., Lincoln, NE, USA) calibrated at >98% precision. Soil organic carbon (SOC) mineralization was calculated by subtracting the CO2-C concentration of the blank jar from the CO2-C concentration of the jar with soil samples.
The 14-day incubated soil samples were then used to extract and measure inorganic nitrate-N [34] and ammonium-N [35]. Ten grams of incubated soil samples were extracted in 50 mL 1 M K2SO4, and measured inorganic nitrate-N and ammonium-N using a BioTek microplate spectrometer (BioTek INC., Winooski, VT, USA). The measured values of inorganic nitrate-N and ammonium-N were summed to calculate the mineralizable N in soil.
2.6. Statistical Analysis
Data was analyzed by year using an analysis of variance set in a randomized complete block design [36]. Posthoc tests were conducted using Fisher’s protected LSD (α = 0.05). Statistical computations were facilitated by using the mixed model procedure (Proc Mixed) and the LSMEANS option in Statistical Analysis System (version 9.4, SAS Institute, 2016, Cary, NC, USA). Fixed effect included treatment and random effect included block, block × treatment, and sub-sample within block × treatment.
3. Results and Discussion
3.1. Results
3.1.1. Plant Aboveground Biomass
There was significant variation (p < 0.05) in the total aboveground plant biomass among the treatments in all three study years (Table 3). The three years total aboveground plant biomass ranged from 15,772 to 32,796 kg DM ha−1. In general, the trend of treatment response for yearly and three year total plant aboveground biomass was in the order of 50–50% mixture of meadow bromegrass-alfalfa > 50–50% mixture of orchardgrass-alfalfa = 50-25-25% mixture of meadow bromegrass-orchardgrass-alfalfa > 100% alfalfa = N fertilized 100% meadow bromegrass = N fertilized 100% orchardgrass > without N fertilized 100% meadow bromegrass = without N fertilized 100% orchardgrass. When compared year-wise yield among treatments, the overall trend for aboveground plant biomass was in the order of 2012 > 2013 > 2014 for most of the treatments.
3.1.2. Soil Mineralizable Carbon and Nitrogen
There was no variation in mineralizable C and N among the plots before applying treatments in 2011. However, there was significant difference (p < 0.05) in mineralizable C and N among the treatments in both 2013 and 2014 (Table 4). In both years, the highest mineralizable C in soil was found in 100% alfalfa, followed by 50–50% mixtures of alfalfa-grass. The lowest mineralizable C was observed from monoculture of grass without N fertilizer. The C mineralization was higher in 2013 than in 2014 for all treatments. There was a 226% increase in mineralizable C in soil with 100% alfalfa in three years. However, there was only a 2% increase in mineralizable C with 100% of grass without N fertilizer. There was more than 100% increase in mineralizable C with 50–50% mixture of legume and grass.
In 2013, mineralizable N was the highest in the soil with 100% alfalfa, which was similar to 50–50% mixture of alfalfa and meadow bromegrass (Table 4). Similar but much higher values were obtained in 2014. In general, the N mineralization was higher in 2014 than in 2013 for all treatments. There was more than a 1000% increase in mineralizable N in three years in the plots containing at least 50% alfalfa in the mixtures. However, the increment in mineralizable N was very low (2–49%) in the 100% grass plots without N fertilizer. Also, the increments in N fertilized 100% grass plots were much lower (169–300%) than 50–50% or 50-25-25% alfalfa-grass mixture plots.
3.1.3. Soil Microbial Biomass
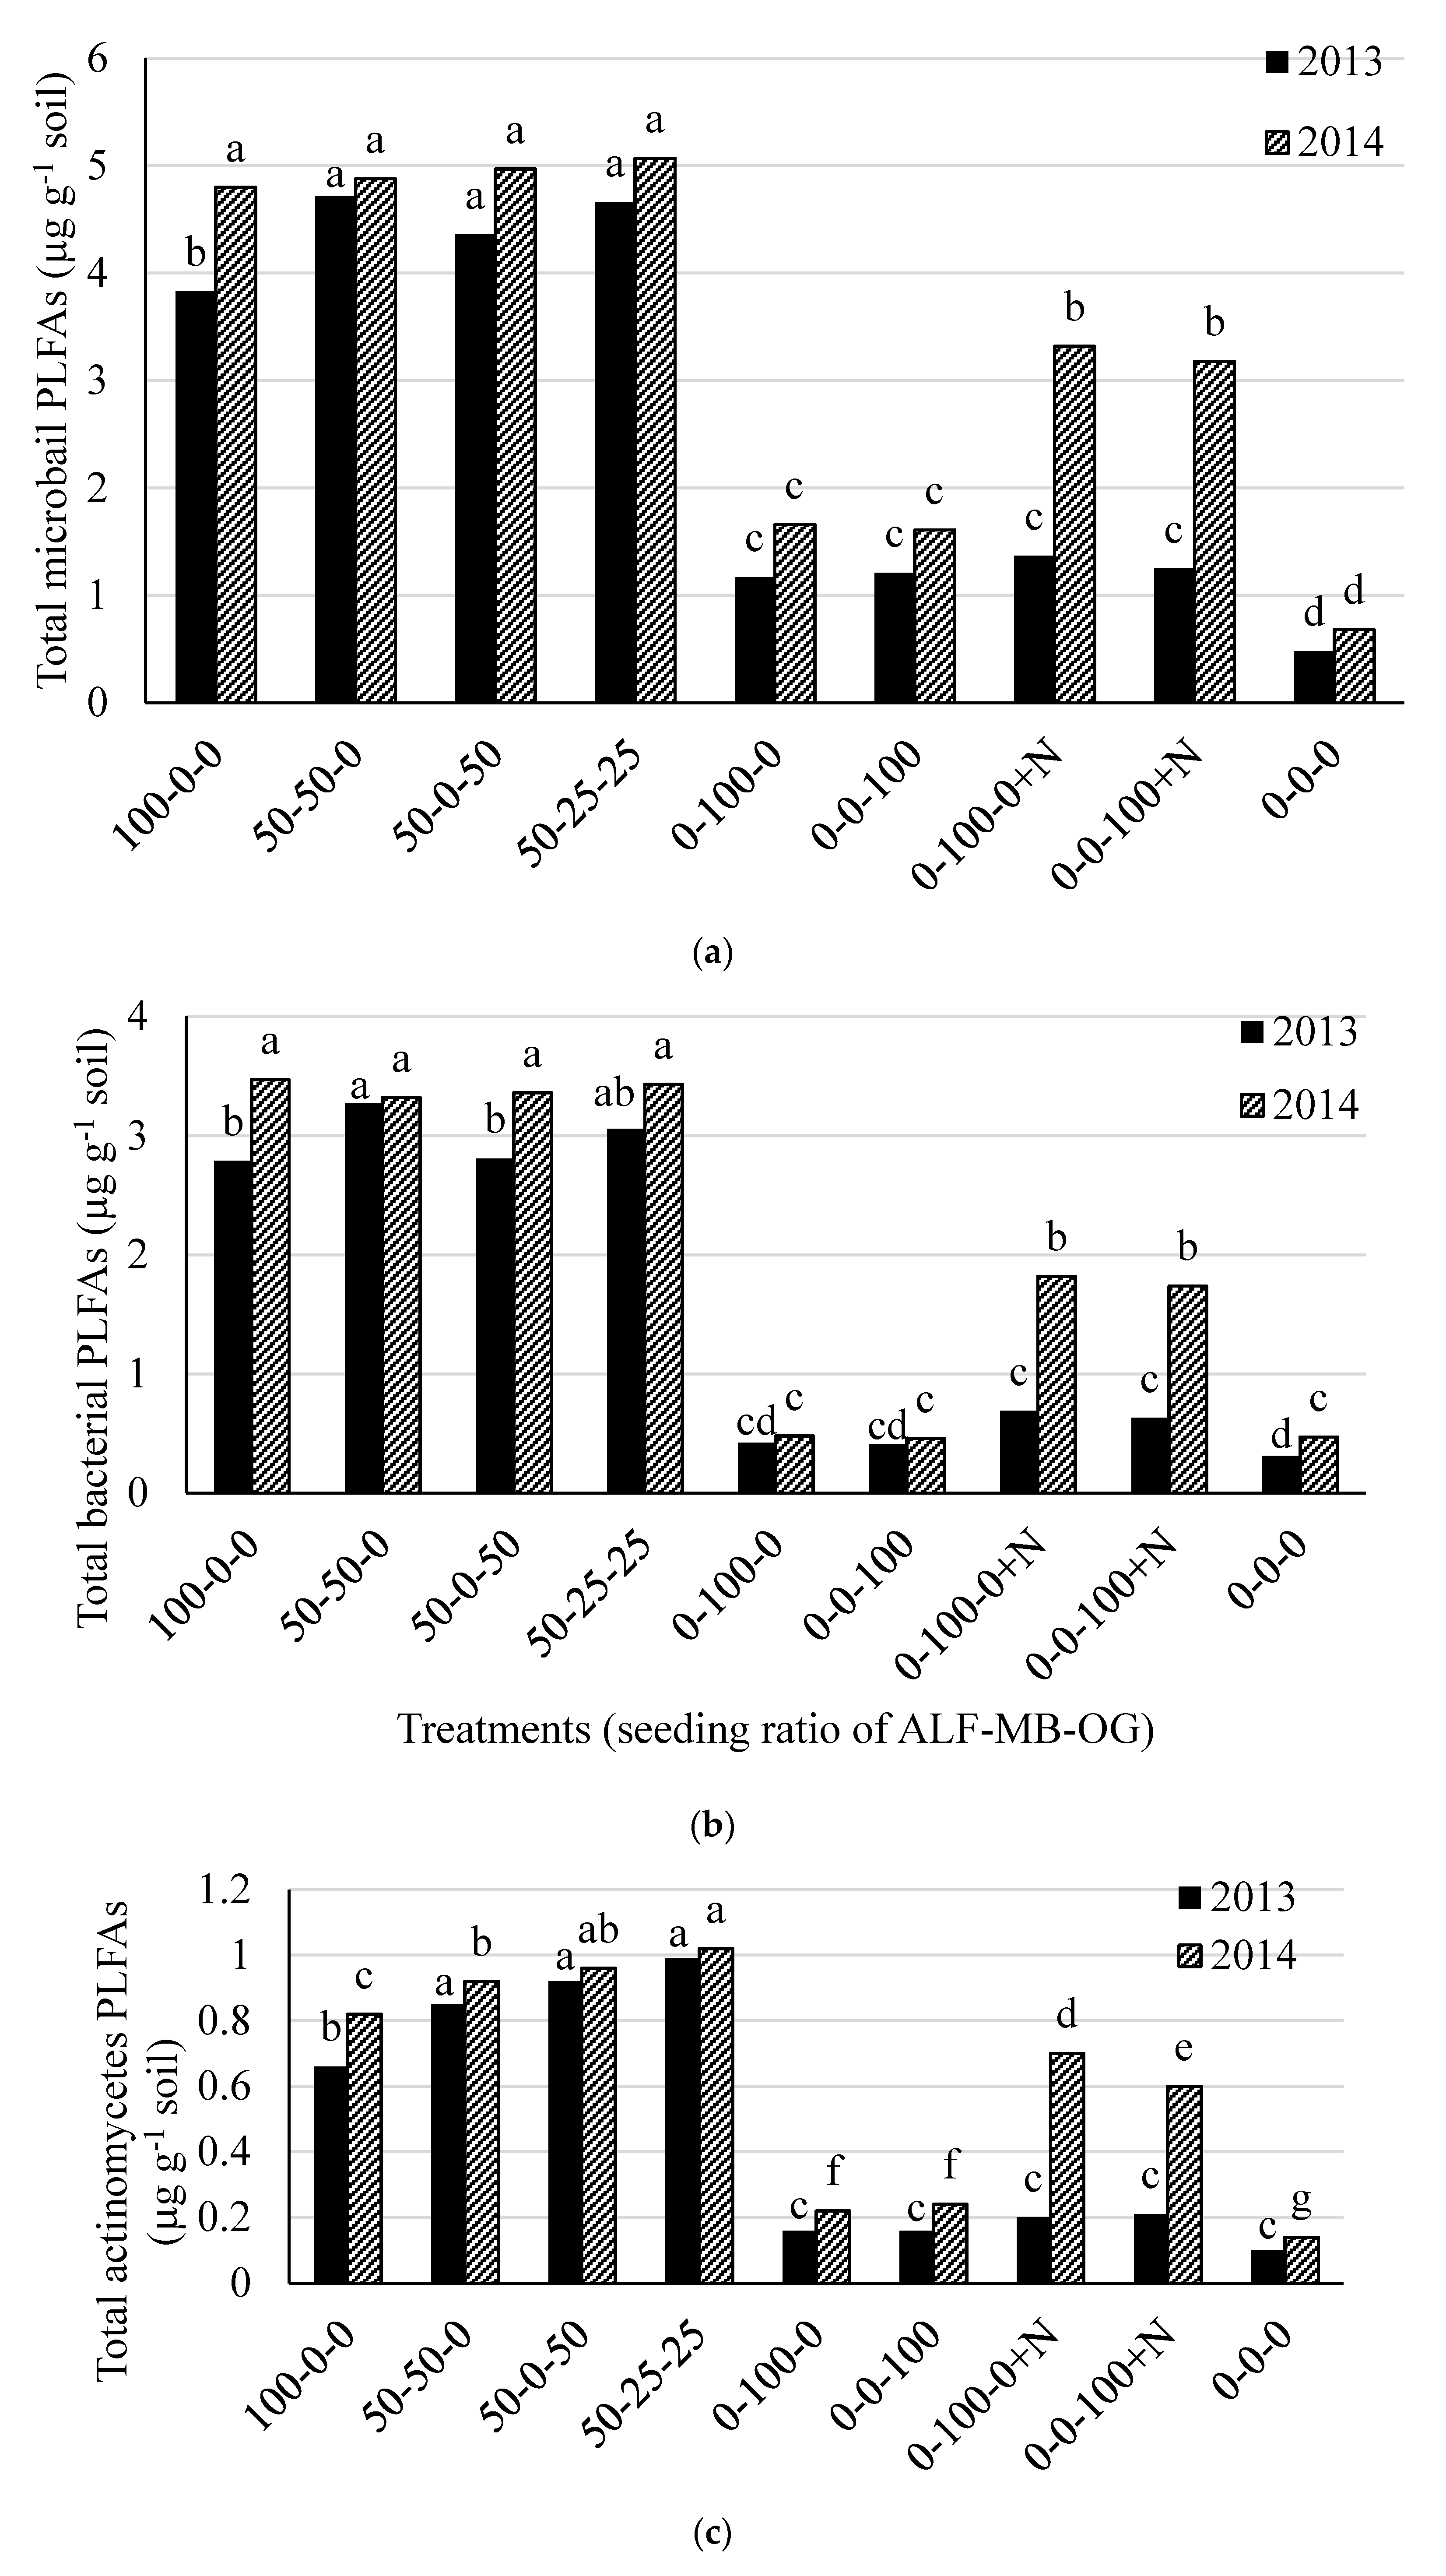
The total soil microbial, bacterial, actinomycetes, and fungal biomass, and fungal to bacterial (F:B) ratio were different (p < 0.05) among the treatments in both 2013 and 2014. The total soil microbial PLFAs was higher in treatments containing 100% alfalfa (except in 2013) or 50% alfalfa in mixture with grass (range 3.83 to 5.07 µg g−1 soil) than 100% grass treatments (range 1.17 to 1.37 µg g−1 soil) and control (0.48 µg g−1 soil) in both 2013 and 2014 (Figure 2a). There was an effect of N fertilizer application in monoculture grass plots in 2014 for total soil microbial PLFAs. Similar treatment effects on total bacterial PLFAs were also observed in both 2013 and 2014 (Figure 2b). The actinomycetes PLFAs was higher in treatments containing 100% and 50% alfalfa in mixtures (range 0.66 to 0.99 µg g−1 soil) than other treatments (range 0.10 to 0.21 µg g-1 soil) in 2013 while it was higher in 50-25-25% mixture of alfalfa-meadow bromegrass-orchardgrass and 50–50% mixture of alfalfa-orchardgrass than other treatments in 2014 (Figure 2c). The total fungal PLFAs were higher from treatments with 100% grass without N fertilization and all treatments containing 50% alfalfa in mixture with grass (range 0.59 to 0.63 µg g−1 soil) than other remaining treatments (range 0.08 to 0.48 µg g−1 soil) in 2013 (Figure 2d). In 2014, it was higher in all monoculture grass plots with or without N than other treatments. The total soil microbial, bacterial, actinomycetes, and fungal PLFAs in the control plot were much lower than other treatments (Figure 2a–d).
3.1.4. Fungi to Bacteria Ratio
The F:B ratio was the highest in N unfertilized grass plots (range 1.46 to 1.59 and 2.0 to 2.12, in 2013 and 2014, respectively) followed by N fertilized grass plots (range 0.65 to 0.69 and 0.45 to 0.49, in 2013 and 2014, respectively) in both 2013 and 2014 (Figure 3). The lowest and similar F:B ratios were obtained in alfalfa monoculture, alfalfa-grass mixtures, and control plots (Figure 3).
3.1.5. Soil Microbial Community Structure
Grouping individual PLFA biomarkers into certain groups and comparing their proportions among the treatments is considered a better approach than comparing individual biomarkers [28]. So, different PLFA biomarkers were grouped into gram positive and gram negative bacteria, actinomycetes, and arbuscular mycorrhizal fungi (AMF) and other fungi (Table 5); and their relative proportions analyzed in both 2013 and 2014 (Table 6). There were differences (p < 0.05) among the treatments for both actual amount and proportion of all these five microbial groups in both 2013 and 2014 (Table 5 and Table 6). The proportion of gram positive bacteria was higher in all treatments containing either 100% or 50% alfalfa in mixture (range 22.2 to 24.9%) than the remaining treatments (range 14.8 to 18.6%) in 2013. In 2014, the 50-25-25% mixture of alfalfa-meadow bromegrass-orchardgrass had the highest proportion of gram positive bacteria (24.6%), which was similar with the other two mixtures containing 50% alfalfa and N fertilized 100% meadow bromegrass (Table 6). Similarly, the proportion of gram negative bacteria was higher from soil under either 100% alfalfa (49.6 and 53.6% in 2013 and 2014, respectively) or 50% alfalfa in mixture (range 39.2 to 47.1% and 43.2 to 44.9% in 2013 and 2014, respectively) than the remaining treatments in both 2013 and 2014 (Table 6). The proportion of actinomycetes followed a similar trend of gram negative bacteria in 2013 and 2014 (Table 6).
In contrast, the proportion of AMF and other fungi were higher in soils on 100% grass with or without N fertilization than treatments containing alfalfa in both 2013 and 2014.
3.2. Discussion
The higher forage yields in grass-legume mixtures, especially in 50–50% grass-legume mixtures, than monocultures might be due to better utilization of niche spaces by diverse species and the positive interaction between or among the species [37]. The mutual association of legume and grass in the mixtures enhanced the legume to transfer fixed N to grass while grass reduced the hindering effect of soil N on the biological N fixation by the legume [38]. In addition, efficient photosynthesis in the mixtures might have played a role for higher aboveground biomass as grasses had erect leaves while legumes had horizontal leaves in the grass-legume mixtures [39].
The variations in soil mineralizable C, N, and total soil microbial, bacterial, actinomycetes, and fungal PLFAs among the treatments was due to differences in plant type (grass vs. legume) grown in soil, aboveground biomass production, and the N sources (chemical vs. legume N fixation). Biomass proportion of individual plant species in the mixtures at each harvest indicated that they were similar and close to their seeding mass ratios. Overall, the higher mineralizable C and N in soil from treatments containing alfalfa might be due to better substrate quality from legume roots compared to grass roots and this might have increased microbial population and activity in the soils. The higher mineralizable C in 2013 than in 2014 might be due to plant and weather factors. The total aboveground forage biomass production was generally higher in 2012 than in 2013 and 2014. The higher aboveground biomass might have contributed to higher belowground plant biomass and hence contributed to total soil organic C and labile/mineralizable C. The year 2012 was warmer and drier in the study location than the 30-year average, and 2013 and 2014. The higher mineralizable C in late spring of 2013 might be due to the higher total belowground biomass (substrate quantity) and warmer temperature in the previous (2012) growing season. On the other hand, the higher N mineralization in 2014 than in 2013 might be due to the availability of more substrate and increased activity of soil microbes over the period of time. The total precipitation during the spring of 2014, especially in the month of May, was much higher compared to the previous study years, which might also have contributed to increased N mineralization. The aboveground plant species and nutrient management in crops influence the belowground microbial community [11,40,41,42]. The general trend of treatment response for total soil microbial, bacterial, and actinomycetes PLFAs was in the order of 100% alfalfa = 50–50% mixture of grass-alfalfa > N fertilized 100% grass > without N fertilized 100% grass >> control in both years (Figure 2a–c). This trend follows the similar aboveground biomass productivity trend of alfalfa or grass-alfalfa mixtures (species diversity) supporting the previous reports of positive influence of biodiversity on soil health and productivity [15,16,17].
The effect of alfalfa in increasing total microbial, bacterial or actinomycetes PLFAs was due to higher quantity and better quality of substrate with low C/N ratio [43,44]. On the other hand, the higher total soil microbial, bacterial, and actinomycetes PLFAs in 100% alfalfa or 50–50% grass-alfalfa than 100% grass with N or without N was probably due to the higher quality of substrate deposit and root exudates into the soil from legume than grass [13,14,15].
As most of the bacteria and actinomycetes in soil decompose more labile tissue as primary decomposer while fungi grow slowly and decompose more recalcitrant C tissues as a secondary decomposer in the soil [13]. This fact might contribute to higher total bacterial and actinomycetes PLFAs in soil under alfalfa than grass because of the effect of nutrient cycling [40,41] and organic matter decomposition [45,46,47]. It has been reported that the rate of N mineralization is positively correlated with the bacterial population in the soil [48].
The higher soil fungal biomass and F:B ratio in the soil of grass than the alfalfa or grass-alfalfa mixture could be due to presence of more recalcitrant substrate with higher C/N ratio in soil under grass than alfalfa, which favors fungal growth and increases the F:B ratio in the soil [46,47]. The F:B ratio in a soil is affected by different plant factors such as quantity and quality of root exudates and litter [43], plant productivity, and composition of plants in the mixture [49]. It has been reported that the soil under grass has a lower rate of N mineralization and less availability of nutrients as compared to legume, enhancing increasing fungal growth and F:B ratio [11,39]. The F:B ratio in soil is increased with decreased nutrient cycling and results in more organic C in soil [38,39,50]. The results of decreasing fungal biomass and F:B ratio in soil due to the application of chemical N fertilizer in the study is similar to the findings of other researchers [51,52]. Negative correlation between fungal biomass and N fertilizer application rate was also reported by previous researchers [53,54] because it renders the bacteria to become more competitive. The F:B ratio was less than 1 for most of the treatments except monoculture grass without N fertilization. This might be due to selectivity of the PLFA extraction. Nonetheless, similar findings of low F:B ratio were reported in previous studies on pasturelands and hay production fields [55,56].
4. Conclusions
This study evaluated the soil mineralizable C, N, and soil microbial biomass as influenced by different seeding mass ratios of two cool season perennial grasses and alfalfa with two levels of N fertilizer application. The results showed that grass-legume mixtures, especially a 50–50% mixture of grass-legume, increased soil mineralizable C, N and total soil microbial biomass compared to 100% grass with or without N. The trend of improving productivity of belowground microbial biomass was similar to the productivity of aboveground plant biomass indicating that grass-legume mixtures have a positive impact on soil productivity and fertility resilience, which eventually can improve soil health in long-term.
Author Contributions
D.D. designed the experiment, collected, and analyzed data, and led the writing of the manuscript; M.A.I. administered and supervised the overall project, led and guided the lab and field work, contributed to funding, and reviewed the manuscript.
Funding
This research received no external funding.
Acknowledgments
The authors are thankful to Bob Baumgartner for his assistance in managing the field experiment and to Peter D. Stahl for providing his laboratory facility to analyze soil samples. We thank David E. Legg and Andrew R. Kniss for their support during data analysis.
Conflicts of Interest
The authors declare no conflict of interest.
References
- Liebig, M.; Carpenter-Boggs, L.; Johnson, J.M.F.; Wright, S.; Barbour, N. Cropping system effects on soil biological characteristics in the Great Plains. Renew. Agric. Food Syst. 2006, 21, 36–48. [Google Scholar] [CrossRef]
- Jackson, R.B.; Fierer, N.; Schimel, J.P. New directions in microbial ecology. Ecology 2007, 88, 1343–1344. [Google Scholar] [CrossRef]
- Karolien, D.; Dries, R.; Mihiri, C.W.M.W.; Peter, L.; Pascal, B. Microbial community composition and rhizodeposit-carbon assimilation in differently managed temperate grassland soils. Soil Biol. Biochem. 2009, 41, 144–153. [Google Scholar]
- Singh, B.K.; Millard, P.; Whiteley, A.S.; Murrell, J.C. Unraveling rhizosphere-microbial interactions: Opportunities and limitations. Trends Microbiol. 2004, 12, 386–393. [Google Scholar] [CrossRef] [PubMed]
- Jones, D.L.; Hodge, A.; Kuzyakov, Y. Plant and mycorrhizal regulation of rhizodeposition. New Phytol. 2004, 163, 459–480. [Google Scholar] [CrossRef] [Green Version]
- Wei, D.; Yang, Q.; Zhang, J.Z.; Wang, S.; Chen, X.L.; Zhang, X.L.; Li, W.Q. Bacterial community structure and diversity in a black soil as affected by long-term fertilization. Pedosphere 2008, 18, 582–592. [Google Scholar] [CrossRef]
- Ngosong, C.; Jarosch, M.; Raupp, J.; Neumann, E.; Ruess, L. The impact of farming practice on soil microorganisms and arbuscular mycorrhizal fungi: Crop type versus long-term mineral and organic fertilization. Appl. Soil Ecol. 2010, 46, 134–142. [Google Scholar] [CrossRef]
- Insam, H. Developments in soil microbiology since the mid 1960’s. Geoderma 2001, 100, 389–402. [Google Scholar] [CrossRef]
- McKinley, V.L.; Peacock, A.D.; White, D.C. Microbial community PLFA and PHB responses to ecosystem restoration in tallgrass prairie soils. Soil Biol. Biochem. 2005, 37, 1946–1958. [Google Scholar] [CrossRef]
- Acosta-Martinez, V.; Mikha, M.M.; Vigil, M.F. Microbial communities and enzyme activities in soils under alternative crop rotations compared to wheat-fallow for the Central Great Plains. Appl. Soil Ecol. 2007, 37, 41–52. [Google Scholar] [CrossRef]
- Wardle, D.A.; Bardgett, R.D.; Klironomos, J.N.; Setala, H.; van der Putten, W.H.; Wall, D.H. Ecological linkages between aboveground and belowground biota. Science 2004, 304, 1629–1633. [Google Scholar] [CrossRef] [PubMed]
- Grayston, S.J.; Wang, S.; Campbell, C.D.; Edwards, A.C. Selective influence of plant species on microbial diversity in the rhizosphere. Soil Biol. Biochem. 1998, 30, 369–378. [Google Scholar] [CrossRef]
- Soderberg, K.H.; Olsson, P.A.; Baath, E. Structure and activity of the bacterial community in the rhizosphere of different plant species and the effect of arbuscular mycorrhizal colonization. FEMS Microbiol. Ecol. 2002, 40, 223–231. [Google Scholar] [CrossRef]
- Nair, A.; Ngouajio, M. Soil microbial biomass, functional microbial diversity, and nematode community structure as affected by cover crops and compost in an organic vegetable production system. Appl. Soil Ecol. 2012, 58, 45–55. [Google Scholar] [CrossRef]
- Gangatharan, R.; Neri, D. Can biodiversity improve soil fertility resilience in agroecosystems? New Medit 2012, 4, 11–18. [Google Scholar]
- Kirkegaard, J.; Christen, O.; Krupinsky, J.; Layzell, D. Break crop benefits in temperate wheat production. Field Crops Res. 2008, 107, 185–195. [Google Scholar] [CrossRef]
- Bauhus, J.; Khanna, P.K.; Menden, N. Aboveground and belowground interactions in mixed plantations of Eucalyptus globulus and Acacia mearnsii. Can. J. For. Res. 2000, 30, 1886–1894. [Google Scholar] [CrossRef]
- Vancura, V.; Hanzlikova, A. Root exudates of plants IV. Differences in chemical composition of seed and seeding exudates. Plant Soil 1972, 36, 271–282. [Google Scholar]
- Martin, J.K. 14C-labelled material leached from the rhizosphere of plants supplied with 14CO2. Aust. J. Biol. Sci. 1971, 24, 1131–1142. [Google Scholar] [CrossRef]
- Wyoming Agricultural Statistics (WAS); United States Department of Agriculture, National Agricultural Statistics Service, Wyoming Field Office: Washington, DC, USA, 2015; p. 88.
- Skinner, Q.D. A Field Guide to Wyoming Grasses; Education Resources Publishing: Cumming, GA, USA, 2010; p. 595. [Google Scholar]
- Marschner, P.; Kandeler, E.; Marschner, B. Structure and function of the soil microbial community in a long term fertilizer experiment. Soil Biol. Biochem. 2003, 35, 453–461. [Google Scholar] [CrossRef]
- United States Department of Agriculture-Natural Resources Conservation Service. On-line Database. 2015. Available online: http://websoilsurvey.nrcs.usda.gov (accessed on 19 February 2015).
- Gee, G.W.; Bauder, J.W. Particle-size analysis. In Methods of Soil Analysis. Physical and Mineralogical Methods. Part 1, Agronomy Monographs, 2th ed.; Klute, A., Ed.; ASA and SSSA: Madison, WI, USA, 1986; pp. 383–411. [Google Scholar]
- Thomas, G.W. Soil pH and soil acidity. In Methods of Soil Analysis. Part 3: Chemical Methods; Sparks, D.L., Ed.; Soil Science Society of America: Madison, WI, USA, 1996; pp. 475–490. [Google Scholar]
- Schhulte, E.E.; Hopkins, B.G. Estimation of soil organic matter by weight loss-on-ignition. In Soil Organic Matter: Analysis and Interpretation; Magdoff, F.R., Tabatabai, M.A., Hanlon, E.A., Eds.; Soil Science Society of America Special Publication 46: Madison, WI, USA, 1996; pp. 21–31. [Google Scholar]
- Olsen, S.R.; Sommers, L.E. Phosphorus. In Methods of Soil Analysis. Chemical and Biological Methods. Part 2, 2nd ed.; Page, A.L., Ed.; ASA and SSSA: Madison, WI, USA, 1982; pp. 403–430. [Google Scholar]
- Knudsen, D.; Peterson, G.A.; Pratt, P.F. Lithium, sodium, and potassium. In Methods of Soil Analysis. Part 2: Chemical and Microbiological Properties; Page, A.L., Miller, R.H., Keeney, D.R., Eds.; No. 9; ASA Monograph: Madison, WI, USA, 1982; pp. 225–246. [Google Scholar]
- Buyer, J.S.; Teasdale, J.R.; Roberts, D.P.; Zasada, I.A.; Maul, J.E. Factors affecting soil microbial community structure in tomato cropping systems. Soil Biol. Biochem. 2010, 42, 831–841. [Google Scholar] [CrossRef]
- Frostegard, A.; Tundlid, A.; Baath, E. Phospholipid fatty acids composition, biomass, and activity of microbial communities from two soil types experimentally exposed to different heavy metals. Appl. Environ. Microbiol. 1993, 59, 3605–3617. [Google Scholar] [PubMed]
- Blackwood, C.B.; Buyer, J.S. Soil microbial communities grown with Bt and non-Bt corn in three soils. J. Environ. Qual. 2004, 33, 832–836. [Google Scholar] [CrossRef] [PubMed]
- Yao, H.; Wu, F. Soil microbial community structure in cucumber rhizosphere of different resistance cultivars to fusarium wilt. FEMS Microbiol. Ecol. 2010, 72, 456–463. [Google Scholar] [CrossRef] [PubMed] [Green Version]
- Zibilske, L.M. Carbon mineralization. In Methods of Soil Analysis. Part 2: Microbiological and Biochemical Properties; Weaver, R.W., Angle, S., Bottomley, P., Bezdicek, D., Smith, S., Tabatabai, A., Wollum, A., Mickelson, S.H., Bigham, J.M., Eds.; Soil Science Society of America: Madison, WI, USA, 1994; pp. 15–40. [Google Scholar]
- Doane, T.A.; Horwath, W.R. Spectrophotometric determination of nitrate with a single reagent. Anal. Lett. 2003, 36, 2713–2722. [Google Scholar] [CrossRef]
- Weatherburn, M.W. Phenol-hypochlorite reaction for determination of ammonia. Anal. Chem. 1967, 39, 971–974. [Google Scholar] [CrossRef]
- Steel, R.G.D.; Torrie, J.H. Principles and Procedures of Statistics: A Biometrical Approach; McGraw-Hill Book Company: New York, NY, USA, 1980. [Google Scholar]
- Cardinale, B.J.; Wright, J.P.; Cadotte, M.W.; Carroll, I.T.; Hector, A.; Srivastava, D.S.; Loreau, M.; Weis, J.J. Impacts of plant diversity on biomass production increase through time because of species complementarity. Proc. Natl. Acad. Sci. USA 2007, 104, 18123–18128. [Google Scholar] [CrossRef] [PubMed] [Green Version]
- Gebhart, D.L.; Call, C.A.; Weaver, R.W. Dinitrogen fixation and transfer in legume crested wheatgrass mixtures. J. Range Manag. 1993, 46, 431–435. [Google Scholar] [CrossRef]
- Mooso, G.D.; Wedin, W.F. Yield dynamics of canopy components in alfalfa-grass mixtures. Agron. J. 1990, 82, 696–701. [Google Scholar] [CrossRef]
- Zelles, L. Fatty acid patterns of phospholipids and lipopolysaccharides in the characterization of microbial communities in soil: A review. Biol. Fertil. Soils 1999, 29, 111–129. [Google Scholar] [CrossRef]
- Toyota, K.; Kuninaga, S. Comparison of soil microbial community between soils amended with or without farmyard manure. Appl. Soil Ecol. 2006, 33, 39–48. [Google Scholar] [CrossRef]
- Esperschutz, J.; Gattinger, A.; Mader, P.; Schloter, M.; Fliebach, A. Response of soil microbial biomass and community structures to conventional and organic farming systems under identical crop rotations. Microb. Ecol. 2007, 61, 26–37. [Google Scholar] [CrossRef] [PubMed] [Green Version]
- Grayston, S.J.; Griffith, G.S.; Mawdsley, J.L.; Campbell, C.D.; Bardgett, R.D. Accounting for variability in soil microbial communities of temperate upland grassland ecosystems. Soil Biol. Biochem. 2001, 33, 533–551. [Google Scholar] [CrossRef]
- Chen, M.; Chen, B.; Marschner, P. Plant growth and soil microbial community structure of legumes and grasses grown in monoculture or mixture. J. Environ. Sci. 2008, 20, 1231–1237. [Google Scholar] [CrossRef] [Green Version]
- Rillig, M.C.; Wright, S.F.; Eviner, V.T. The role of arbuscular mycorrhizal fungi and glomalin in soil aggregation: Comparing effects of five plant species. Plant Soil 2002, 238, 325–333. [Google Scholar] [CrossRef]
- De Vries, F.T.; Hoffland, E.; van Eekeren, N.; Brussaard, L.; Bloem, J. Fungal/bacterial ratios in grasslands with contrasting nitrogen management. Soil Biol. Biochem. 2006, 38, 2092–2103. [Google Scholar] [CrossRef] [Green Version]
- Hogberg, M.N.; Chen, Y.; Hogberg, P. Gross nitrogen mineralization and fungi-to-bacteria ratios are negatively correlated in boreal forests. Biol. Fertil. Soils 2007, 44, 363–366. [Google Scholar] [CrossRef]
- Bardgett, R.D.; Smith, R.S.; Shiel, R.S.; Peacock, S.; Simkin, J.M.; Quirk, H.; Hobbs, P.J. Parasitic plants indirectly regulate below-ground properties in grassland ecosystems. Nature 2006, 439, 969–972. [Google Scholar] [CrossRef] [PubMed]
- Donnison, L.M.; Griffith, G.S.; Hedger, J.; Hobbs, P.J.; Bardgett, R.D. Management influences on soil microbial communities and their function in botanically diverse haymeadows of northern England and Wales. Soil Biol. Biochem. 2000, 32, 253–263. [Google Scholar] [CrossRef]
- Strickland, M.S.; Rousk, J. Considering fungal: Bacterial dominance in soils—Methods, controls, and ecosystem implications. Soil Biol. Biochem. 2010, 42, 1385–1395. [Google Scholar] [CrossRef]
- Bittman, S.; Forge, T.A.; Kowalenko, C.G. Responses of the bacterial and fungal biomass in a grassland soil to multi-year applications of dairy manure slurry and fertilizer. Soil Biol. Biochem. 2005, 37, 613–623. [Google Scholar] [CrossRef]
- Benizri, E.; Amiaud, B. Relationship between plants and soil microbial communities in fertilized grasslands. Soil Biol. Biochem. 2005, 37, 2055–2064. [Google Scholar] [CrossRef]
- De Vries, F.T.; Bloem, J.; van Eekeren, N.; Brussaard, L.; Hoffland, E. Fungal biomass in pastures increases with age and reduced N input. Soil Biol. Biochem. 2007, 39, 1620–1630. [Google Scholar] [CrossRef]
- De Vries, F.T.; Groenigen, J.W.; Hofland, E.; Bloem, J. Nitrogen losses from two grassland soils with different fungal biomass. Soil Biol. Biochem. 2011, 43, 997–1005. [Google Scholar] [CrossRef]
- Ghimire, R.; Norton, J.B.; Stahl, P.D.; Norton, U. Soil microbial substrate properties and microbial community responses under irrigated organic and reduced-tillage crop and forage production systems. PLoS ONE 2014, 9, e103901. [Google Scholar] [CrossRef] [PubMed]
- Bardgett, R.D.; Hobbs, P.J.; Frostegard, A. Changes in soil fungal: Bacterial biomass ratios following reductions in the intensity of management of an upland grassland. Biol. Fertil. Soils 1996, 22, 261–264. [Google Scholar] [CrossRef]
Figure 1.
Monthly precipitation (■), 30-year average monthly precipitation (—), monthly average temperature (□), and 30 year average monthly temperature (---) from September 2011 to November 2014 at Lingle, Wyoming.
Figure 1.
Monthly precipitation (■), 30-year average monthly precipitation (—), monthly average temperature (□), and 30 year average monthly temperature (---) from September 2011 to November 2014 at Lingle, Wyoming.

Figure 2.
Total soil microbial (a); bacterial (b); actinomycetes (c); and fungal (d) PLFAs in 2013 and 2014 at Lingle, Wyoming. ALF = Alfalfa, MB = meadow bromegrass, OG = orchardgrass, +N = 150 kg N ha−1 year−1 as urea. Bars within a year followed by the same letter do not differ at the p > 0.05 level of significance.

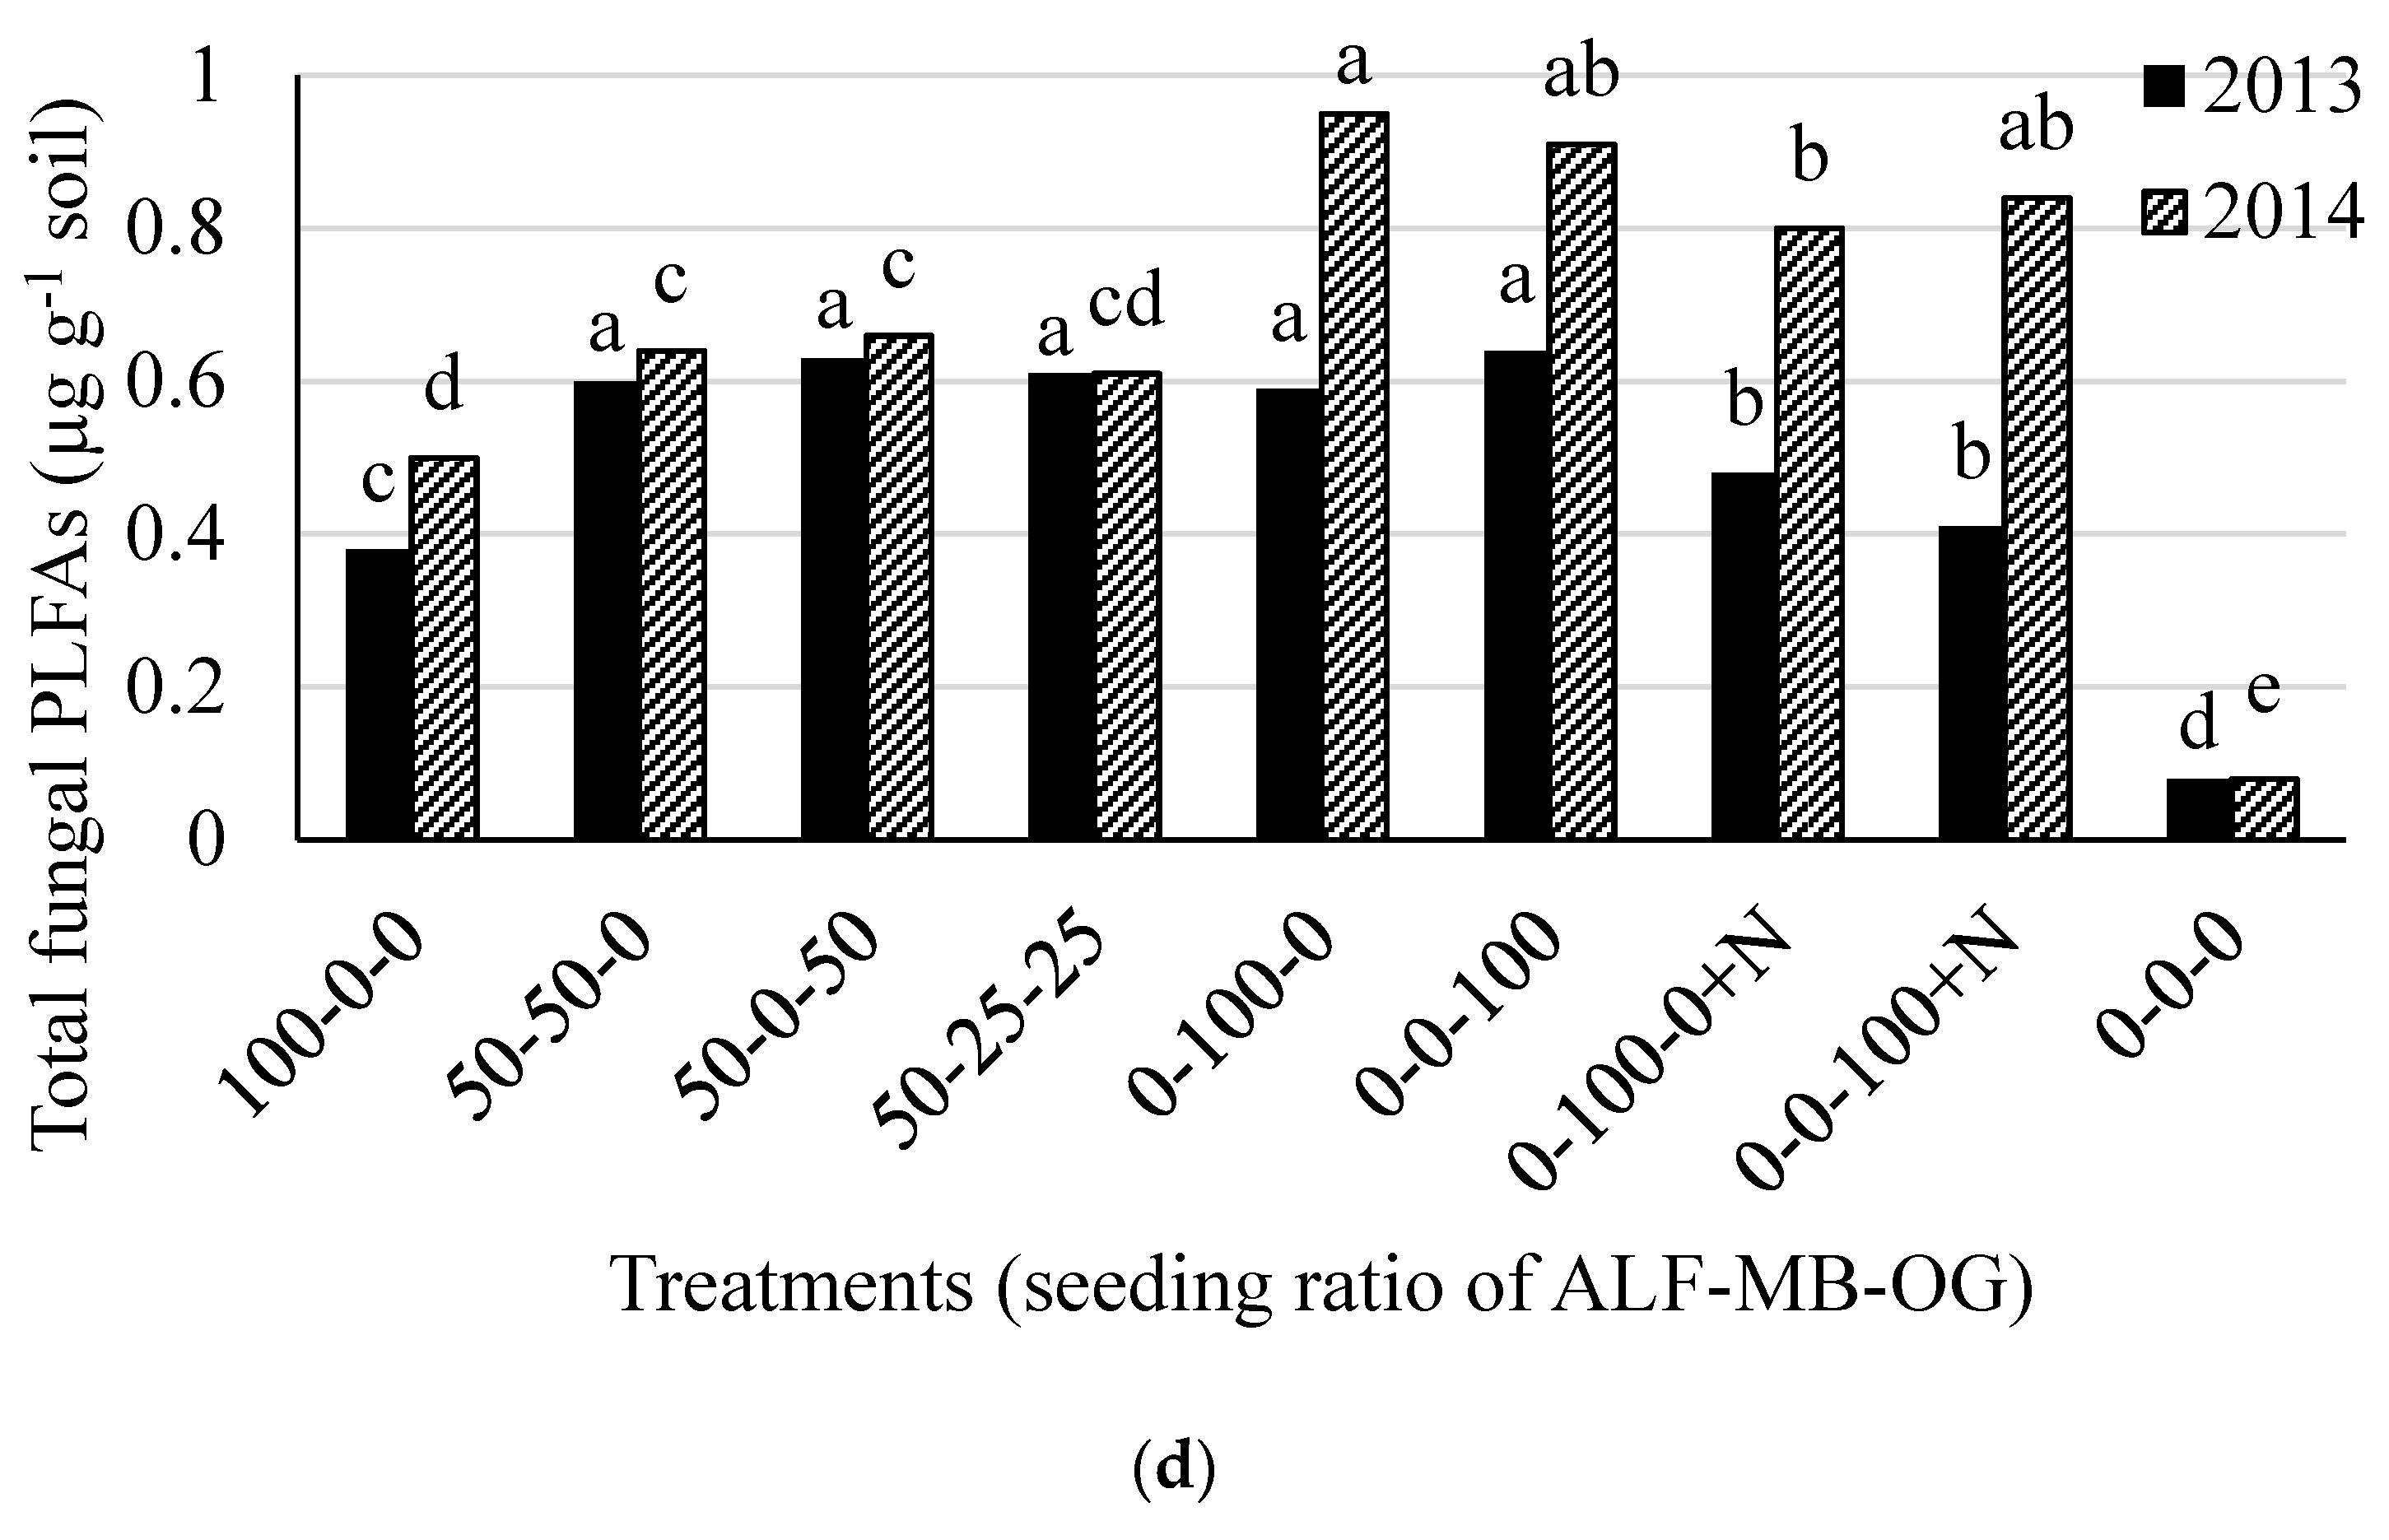
Figure 3.
Fungal to bacterial (F:B) ratio in soil in 2013 and 2014 at Lingle, Wyoming. ALF = Alfalfa, MB = meadow bromegrass, OG = orchardgrass, +N = 150 kg N ha−1 year−1 as urea. Bars within a year followed by the same letter do not differ at the p > 0.05 level of significance.
Figure 3.
Fungal to bacterial (F:B) ratio in soil in 2013 and 2014 at Lingle, Wyoming. ALF = Alfalfa, MB = meadow bromegrass, OG = orchardgrass, +N = 150 kg N ha−1 year−1 as urea. Bars within a year followed by the same letter do not differ at the p > 0.05 level of significance.


Table 1.
Physical and chemical properties of surface soil (0–15 cm) before applying treatments in 2011 at Lingle, Wyoming. Data was mean of seven soil samples. Values in parentheses are standard errors of means.
Table 1.
Physical and chemical properties of surface soil (0–15 cm) before applying treatments in 2011 at Lingle, Wyoming. Data was mean of seven soil samples. Values in parentheses are standard errors of means.
| Properties | Units | Analytical Results (n = 7) |
|---|---|---|
| Physical | ||
| Sand † (0.2–2.0 mm) | (%, w/w) | 44.3 (±0.7) |
| Silt † (0.002–0.2 mm) | (%, w/w) | 34.6 (±0.7) |
| Clay † (<0.002 mm) | (%, w/w) | 21.1 (±0.5) |
| Texture [24] | Loam | |
| Gravel | (%, w/w) | 0.8 (±0.2) |
| Chemical | ||
| pH | 8.0 (±0.02) | |
| Electrical conductivity [25] | (ds m−1) | 1.7 (±0.08) |
| Organic matter [26] | (g kg−1) | 17 (±0.4) |
| Total N # | (g kg−1) | 0.89 (±0.02) |
| Total SOC | (g kg−1) | 8.56 (±0.04) |
| Inorganic-N | (mg kg−1) | 2.36 (±0.07) |
| Available P [27] | (mg kg−1) | 77.1 (±1.0) |
| Exchangeable cations [28] | ||
| K | (mg kg−1) | 328.7 (±20.6) |
| Ca | (%, w/w) | 0.6 (±0.01) |
| Mg | (mg kg−1) | 402.9 (±12.5) |
| Na | (mg kg−1) | 203.7 (±10.6) |
† Textural class was determined using USDA textural triangle; # Carlo Erba combustion on an EA1100 Soil C/N analyzer (Carlo Erba Instruments, Milan, Italy).
Table 2.
Treatment details used for the study.
| Treatments (ALF-MB-OG †) | Proportion of Seed in Mixtures § | N Fertilizer Applied | ||
|---|---|---|---|---|
| ALF | MB | OG | ||
| % | kg N ha−1 | |||
| 100-0-0 | 100 | 0 | 0 | 0 |
| 50-50-0 | 50 | 50 | 0 | 0 |
| 50-0-50 | 50 | 0 | 50 | 0 |
| 50-25-25 | 50 | 25 | 25 | 0 |
| 0-100-0 | 0 | 100 | 0 | 0 |
| 0-0-100 | 0 | 0 | 100 | 0 |
| 0-100-0 + N ‡ | 0 | 100 | 0 | 150 |
| 0-0-100 + N | 0 | 0 | 100 | 150 |
| 0-0-0 ¶ | 0 | 0 | 0 | 0 |
† ALF = alfalfa; MB = meadow bromegrass; OG = orchardgrass; ‡ N = Nitrogen applied at the rate of 150 kg ha−1 as urea; § By weight as described in Materials and Methods; ¶ Control (not seeded with any grass or legume and not applied any fertilizers).
Table 3.
Forage dry matter yield of grass-legume mixture study during 2012 to 2014 at Lingle, Wyoming.
Table 3.
Forage dry matter yield of grass-legume mixture study during 2012 to 2014 at Lingle, Wyoming.
| Treatments (ALF-MB-OG †) | Forage Dry Matter Yield | |||
|---|---|---|---|---|
| 2012 | 2013 | 2014 | 3 year Total | |
| kg ha−1 | ||||
| 100-0-0 | 9738 b § | 8488 cd | 4880 d | 23,106 c |
| 50-50-0 | 12,463 a | 11,560 a | 8773 a | 32,796 a |
| 50-0-50 | 10,481 b | 10,495 b | 8106 ab | 29,082 b |
| 50-25-25 | 10,280 b | 9444 bc | 7387 b | 27,111 b |
| 0-100-0 | 9311 b | 5067 e | 3760 e | 18,138 d |
| 0-0-100 | 6063 c | 5549 e | 4160 de | 15,772 e |
| 0-100-0 + N ‡ | 10,621 b | 7400 d | 5960 c | 23,961 c |
| 0-0-100 + N | 6983 c | 7375 d | 5734 cd | 20,092 d |
† ALF = alfalfa; MB = meadow bromegrass; OG = orchardgrass; ‡ N = Nitrogen applied at the rate of 150 kg ha−1 as urea; § Means within a column followed by the same letter do not differ at the p = 0.05 level of significance.
Table 4.
Soil mineralizable carbon (C) and nitrogen (N) in grass-legume mixture study in 2011, 2013, and 2014 at Lingle, Wyoming.
Table 4.
Soil mineralizable carbon (C) and nitrogen (N) in grass-legume mixture study in 2011, 2013, and 2014 at Lingle, Wyoming.
| Treatments (ALF-MB-OG †) | Mineralizable C | Mineralizable N | ||||||
|---|---|---|---|---|---|---|---|---|
| 2011 | 2013 | 2014 | ∆ in 3 year | 2011 | 2013 | 2014 | ∆ in 3 year | |
| mg kg−1 d−1 | % | mg kg−1 d−1 | % | |||||
| 100-0-0 | 3.76 | 20.06 a § | 12.27 a | 226 * | 3.62 | 9.41 abc | 50.63 ab | 1299 * |
| 50-50-0 | 3.66 | 14.53 bc | 7.90 bc | 116 * | 3.75 | 9.50 abc | 47.64 abc | 1170 * |
| 50-0-50 | 3.72 | 14.70 bc | 7.71 bc | 107 * | 3.71 | 5.72 cde | 54.90 a | 1380 * |
| 50-25-25 | 3.85 | 13.27 cd | 7.81 bc | 103 * | 3.66 | 6.46 cdef | 45.44 bc | 1142 * |
| 0-100-0 | 3.79 | 5.54 i | 3.88 de | 2 | 4.05 | 3.76 def | 4.12 e | 2 |
| 0-0-100 | 3.62 | 6.00 hi | 3.69 de | 2 | 3.76 | 3.02 ef | 5.62 de | 49 |
| 0-100-0+ N ‡ | 3.76 | 9.62 ef | 5.07 cd | 35 | 3.64 | 2.93 ef | 9.78 de | 169 * |
| 0-0-100 + N | 3.80 | 8.54 fg | 4.94 cd | 30 | 3.59 | 2.64 f | 14.37 d | 300 * |
| 0-0-0 (control) | 3.64 | 4.08 i | 3.67 de | 1 | 3.71 | 2.60 f | 3.74 e | 1 |
† ALF = alfalfa; MB = meadow bromegrass; OG = orchardgrass; ‡ N = Nitrogen applied at the rate of 150 kg ha−1 as urea; § Means within a column followed by the same letter do not differ at the p = 0.05 level of significance; * Indicates significant change (∆) from first year to final year at α = 0.05.
Table 5.
Soil microbial communities in grass-legume mixture study in 2013 and 2014 at Lingle, Wyoming.
Table 5.
Soil microbial communities in grass-legume mixture study in 2013 and 2014 at Lingle, Wyoming.
| Treatments (ALF-MB-OG †) | Gram Positive Bacteria | Gram Negative Bacteria | Actinomycetes | AMF ¶ | Other Fungi | |||||
|---|---|---|---|---|---|---|---|---|---|---|
| 2013 | 2014 | 2013 | 2014 | 2013 | 2014 | 2013 | 2014 | 2013 | 2014 | |
| (µg g−1 soil) | ||||||||||
| 100-0-0 | 0.88 b § | 0.89 b | 1.91 b | 2.59 a | 0.66 b | 0.82 c | 0.19 c | 0.22 cd | 0.19 d | 0.28 c |
| 50-50-0 | 1.04 a | 1.13 a | 2.22 a | 2.19 b | 0.85 a | 0.92 b | 0.28 b | 0.16 d | 0.32 c | 0.48 b |
| 50-0-50 | 1.08 a | 1.17 a | 1.73 b | 2.19 b | 0.92 a | 0.96 ab | 0.28 b | 0.21 cd | 0.35 bc | 0.45 b |
| 50-25-25 | 1.05 a | 1.25 a | 2.01 ab | 2.18 b | 0.99 a | 1.02 a | 0.32 a | 0.16 d | 0.29 c | 0.46 b |
| 0-100-0 | 0.19 de | 0.21 d | 0.24 c | 0.27 d | 0.16 c | 0.22 f | 0.15 d | 0.28 bc | 0.44 ab | 0.67 a |
| 0-0-100 | 0.18 e | 0.20 d | 0.23 c | 0.26 d | 0.16 c | 0.24 f | 0.14 d | 0.37 a | 0.49 a | 0.54 b |
| 0-100-0 + N ‡ | 0.24 c | 0.69 c | 0.45 c | 1.13 c | 0.20 c | 0.70 d | 0.16 cd | 0.31 ab | 0.32 c | 0.48 b |
| 0-0-100 + N | 0.23 cd | 0.64 c | 0.41 c | 1.10 c | 0.21 c | 0.60 e | 0.14 d | 0.31 ab | 0.27 cd | 0.53 b |
| 0-0-0 (control) | 0.08 f | 0.14 d | 0.23 c | 0.33 d | 0.10 c | 0.14 g | 0.04 e | 0.04 e | 0.04 e | 0.04 d |
† ALF = alfalfa; MB = meadow bromegrass; OG = orchardgrass; ‡ N = Nitrogen applied at the rate of 150 kg N ha−1 year−1 as urea; § Means within a column followed by the same letter do not differ at the p > 0.05 level of significance; ¶ Arbuscular mycorrhizal fungi.
Table 6.
Relative abundance of soil microbial groups (%) in grass-legume mixture study in 2013, and 2014 at Lingle, Wyoming.
Table 6.
Relative abundance of soil microbial groups (%) in grass-legume mixture study in 2013, and 2014 at Lingle, Wyoming.
| Treatments (ALF-MB-OG †) | Gram Positive Bacteria | Gram Negative Bacteria | Actinomycetes | AMF ¶ | Other Fungi | |||||
|---|---|---|---|---|---|---|---|---|---|---|
| 2013 | 2014 | 2013 | 2014 | 2013 | 2014 | 2013 | 2014 | 2013 | 2014 | |
| (%) | ||||||||||
| 100-0-0 | 23.2 a § | 18.4 c | 49.5 a | 53.6 a | 17.5 bcd | 17.2 b | 5.0 d | 4.8 d | 5.0 c | 6.0 de |
| 50-50-0 | 22.2 a | 23.1 ab | 47.1 a | 44.9 b | 18.1 abc | 18.9 ab | 6.0 cd | 3.3 d | 6.6 c | 9.8 d |
| 50-0-50 | 24.9 a | 23.4 ab | 39.2 c | 44.2 b | 21.3 a | 19.3 ab | 6.5 c | 4.2 d | 8.1 c | 9.0 de |
| 50-25-25 | 23.5 a | 24.6 a | 41.9 bc | 43.2 b | 21.0 ab | 20.2 a | 7.2 bc | 3.1 d | 6.3 c | 8.9 de |
| 0-100-0 | 15.9 bc | 12.8 d | 19.9 e | 16.0 d | 14.0 de | 12.9 c | 12.8 a | 17.8 b | 37.4 a | 40.5 a |
| 0-0-100 | 14.8 c | 12.8 d | 19.2 e | 15.7 d | 13.4 e | 14.5 c | 11.9 a | 23.5 a | 40.6 a | 33.7 b |
| 0-100-0 + N ‡ | 17.8 b | 20.9 abc | 33.0 d | 34.0 c | 14.5 cde | 21.2 a | 12.1 a | 9.4 c | 22.6 b | 14.4 c |
| 0-0-100 + N | 17.9 b | 20.0 bc | 33.3 d | 34.5 c | 16.7 cde | 19.1 ab | 11.5 a | 10.1 c | 20.6 b | 16.4 c |
| 0-0-0 (control) | 18.6 b | 20.7 bc | 46.9 ab | 46.7 b | 18.1 abc | 21.3 a | 8.2 b | 5.7 d | 8.3 c | 5.6 e |
† ALF = alfalfa; MB = meadow bromegrass; OG = orchardgrass; ‡ N = Nitrogen applied at the rate of 150 kg N ha−1 year−1 as urea; § Means within a column followed by the same letter do not differ at the p = 0.05 level of significance; ¶ Arbuscular mycorrhizal fungi.
© 2018 by the authors. Licensee MDPI, Basel, Switzerland. This article is an open access article distributed under the terms and conditions of the Creative Commons Attribution (CC BY) license (http://creativecommons.org/licenses/by/4.0/).
Share and Cite
MDPI and ACS Style
Dhakal, D.; Islam, M.A. Grass-Legume Mixtures for Improved Soil Health in Cultivated Agroecosystem. Sustainability 2018, 10, 2718. https://doi.org/10.3390/su10082718
AMA Style
Dhakal D, Islam MA. Grass-Legume Mixtures for Improved Soil Health in Cultivated Agroecosystem. Sustainability. 2018; 10(8):2718. https://doi.org/10.3390/su10082718
Chicago/Turabian StyleDhakal, Dhruba, and M. Anowarul Islam. 2018. "Grass-Legume Mixtures for Improved Soil Health in Cultivated Agroecosystem" Sustainability 10, no. 8: 2718. https://doi.org/10.3390/su10082718
Note that from the first issue of 2016, this journal uses article numbers instead of page numbers. See further details here.