The Impact of Climate Change on Swiss Hydropower

Faculty of Business and Economics, FoNEW, SCCER-CREST, University of Basel, Basel 4001, Switzerland
*
Author to whom correspondence should be addressed.
Sustainability 2018, 10(7), 2541; https://doi.org/10.3390/su10072541
Submission received: 30 June 2018
/
Revised: 16 July 2018
/
Accepted: 17 July 2018
/
Published: 19 July 2018
(This article belongs to the Special Issue Hydropower Production)
Abstract
:Hydropower represents an important pillar of electricity systems in many countries. It not only plays an important role in mitigating climate change, but is also subject to climate-change impacts. In this paper, we use the Swiss electricity market model Swissmod to study the effects of changes in water availability due to climate change on Swiss hydropower. Swissmod is an electricity dispatch model with a plant-level representation of 96% of Swiss hydropower plants and their interrelations within cascade structures. Using this detailed model in combination with spatially disaggregated climate-change runoff projections for Switzerland, we show that climate change has ambiguous impacts on hydropower and on the overall electricity system. Electricity prices and overall system costs increase under dry conditions and decrease under average or wet conditions. While the change of seasonal patterns, with a shift to higher winter runoff, has positive impacts, the overall yearly inflow varies under hydrological conditions. While average and wet years yield an increase in inflows and revenues, dry years become drier, resulting in the opposite effect. Even though different in magnitude, the direction of impacts persists when applying the same changes in inflows to the 2050 electricity system.
1. Introduction
Hydropower has a large share in global electricity generation and is still the most widely used source of renewable electricity [1]. The interaction of the hydrological and the energy system, known as the water-energy nexus, has received growing attention in research and political debates in the past decade [2]. As an emission free generation technology, hydropower not only plays an important role in mitigating climate change, but at the same time, is particularly sensitive to changes in average, intra (seasonal), and inter-annual water availability, determined by changes in both precipitation and evapotranspiration. The resulting impacts are increases and/or decreases in seasonal or yearly power output and lost outputs or even floods in the case of higher peak flows [3,4,5,6,7,8].
Various studies analyze the impact of climate change on gross hydropower potential represented by total (annual or seasonal) runoff. These studies look at different spatial scales ranging from a global or continental perspective [5,9,10,11,12] to a country or local perspective [13,14,15,16,17,18,19] using different Global (GCM) and Regional Climate Models (RCM). The models are run with either the IPCC Special Report on Emissions Scenarios (SRES, [20]) or Representative Concentration Pathways (RCP, [21]) scenarios.
While most studies use changes in the availability of water as a proxy for the impact of climate change on hydropower, only a few studies have considered more detailed electricity market impacts [8,22]. This is crucial to capture the role of hydropower in linking hydrological and market conditions.
Therefore, in this paper, we focus on the impact of climate change on hydropower in a hydro-rich country (Switzerland) and feed future hydrologic inflows into a yearly electricity market model (Swissmod [23]) with an hourly resolution and a high degree of detail on hydropower operation. This modeling approach enables us not only to capture possible quantitative effects of changes in water availability and the resulting variation in potential generation, but also to calculate realized generation and revenues for hydropower operators under market constraints. Furthermore, we assess the feedback effects between changes in hydrologic potential on the one hand and electricity market prices and system costs on the other.
The paper is structured as follows. First, we provide an overview of global and regional studies looking at water availability and hydropower generation under various climate change scenarios. Next, we present our modeling framework including the dispatch model, Swissmod, and the market and climate scenarios used for this study. In the results section, we discuss both system-wide as well as hydropower-specific impacts of climate change. Additionally, we compare how these results might change in a future electricity system. Finally, we conclude by discussing our findings in light of prior research and by providing some limitations of our approach and ideas for future research.
2. Climate Change and Water Availability
This chapter provides an overview of recent research on the impact of climate change on hydropower. A comprehensive overview of studies in the water-energy nexus is given by Dai et al. [2]. On a global scale, Turner et al. [9] analyze reservoir inflow scenarios for 1593 large hydropower dams in more than one hundred countries and show both losses and gains in hydropower generation. According to their study, there is high uncertainty about potential impacts on a global scale—ranging from −5 to +5% in mean global production by the 2080s—driven by the selection of GCM’s and emission scenarios. The authors find that Mediterranean countries in southern Europe, northern Africa, and the Middle East are most likely to be negatively impacted by climate change in all model and scenario combinations with reductions in generation of about 40 percent. Conversely, some countries in Scandinavia and central Asia are expected to profit from climate change, with increases in total generation of 5 to 15%. Van Vliet et al. [10] find a net global decrease in generation across all GCMs under the RCP 8.5 scenario. For most European countries, they identify a decrease in gross hydropower potential, while only the Scandinavian countries see a slight increase. For Europe in general, this results in a total decrease of approximately −5% under the RCP 2.6 scenario and up to −20% under the RCP 8.5 scenario by 2080 [10]. Another study by Turner et al. [24] finds a change in net global hydropower production by −8% to −5% under RCP 8.5 and between −4% and +4% under RCP 4.5 by the end of this century.
Tobin et al. [11] analyze the impact of climate change leading to temperature increases of 1.5, 2, or 3 °C on mean, gross hydropower potential—sum of annual runoff by country—in Europe using five regional climate model simulations from the EUROCORDEX initiative [25]. They confirm the regional stratification of the impact of climate change on hydropower potential shown by global studies with increases in Northern, Eastern, and Western Europe, and decreases in Southern Europe. Out of the 25 countries taken into account, 18 are expected to see increases, whilst Portugal, Spain, and Greece are expected to see decreases, in hydropower potential. For four countries, including Switzerland, the direction of change depends on the level of warming. Tobin et al. find changes in hydropower potential ranging up to 10% (1.5 °C temperature increase) or even 20% (3 °C), but also note a high uncertainty in their results due to a large spread between the model simulations [11].
Based on their global simulation, Turner et al. [24] expect a decrease in Swiss hydro generation of −7.1% on average in 2050, ranging from −9.1 to −1.3% depending on the underlying emission scenario and GCM. Austria (−13.7%) is even more severely affected by projected climate change. For Germany (−4.3%), the trend is a little less certain, with both negative and positive projections ranging from −15.6 to +10%.
In their global analysis of the impacts of climate change on hydropower and consequences for global electricity supply investment needs, Turner et al. [24] add an Integrated Assessment Model to their analysis, going beyond the pure evaluation of changes in hydropower potential (as represented by total runoff). They show that in regions assumed to be adversely affected by climate change and with a large share of hydropower generation, increases of power sector emissions of up to 20% can be expected. This finding is driven by losses in hydropower generation that are substituted by investment in and generation by thermal capacities.
In addition to these generation potential studies, there are several studies that also include the potential impact on the electricity market (i.e., for the EU [4,22], the U.S. [13,26,27], the Iberian Peninsula [28,29], Norway [30], and Austria and Germany [31]). Boehlert et al. [26] combine a monthly water resources systems model with an electric sector planning model to analyze the impact of climate change on U.S. hydropower generation. They find a general increase in hydropower generation due to higher inflows in the Pacific Northwest, while generation decreases in months with already low runoffs today. They find increased benefits for hydropower both due to increased generation and to a higher value placed on carbon-free generation. Tarroja et al. [13] find increases in GHG emissions, fuel usage, and costs for the Californian electricity system using the RCP 4.5 and 8.5 scenarios. These model results are due to decreased hydro generation and decreased efficiencies in load-following. Pereira-Cardenal et al. [29] analyze climate change impacts on the Iberian power system using a coupled water-power model. They find decreases in hydropower generation and increases in thermal generation from coal and CCGT, combined with a significant demand shift from winter to summer. In a detailed analysis for Portugal, Teotónio et al. [28], combining the TIMES_PT model with climate model results under different RCP scenarios, show that hydropower is highly vulnerable to climate change. As expected, decreases in water availability lead to decreases in electrical hydropower generation between 17% and 41%, leading to increases in Portuguese electricity prices of up to 17%. Furthermore, the authors conclude that GHG emissions may increase due to the substitution of reduced hydropower generation by thermal power plants burning fossil fuels. Tarroja et al. show similar results for California [13].
Considering Germany and Austria in more detail, Totschnig et al. [31] see a general decline in runoff ranging from −14 to −3%, depending on the underlying climate model. This decline is due to increases in evapotranspiration by the end of the century described in the A1B SRES scenario. As one of the few other research groups, they not only use their runoff results as a proxy for changes in hydro generation, but also use these results in the electricity and heating sector simulation model HiREPS. Similar to the model employed in the analysis at hand, Swissmod (see e.g., Schlecht et al. [23]), HiREPS is a cost-minimization model that covers all hydropower plants larger than 10 MW in the considered countries. While there are several similarities to Swissmod, HiREPS puts a stronger focus on integrated power and heating simulation and also covers investments in new power or heat generation infrastructure. Totschnig et al. [31] take into account three different policy scenarios; the grey (business-as-usual scenario with no particular focus on renewable energies), green (focus on renewable energies but not on energy efficiency, and blue policy scenario (additional effort on energy efficiency). The authors show that mean annual generation by run-of-river hydropower plants in Austria and Germany decreases by 5.5% in the 2051–2080 period and that there is a clear shift from summer to spring due to the earlier runoff peak.
For Switzerland, the country selected for our analysis, the available studies primarily consider the impact of climate change on hydropower potential (e.g., [32,33,34,35]) and some local case studies take market interaction into account [36,37,38].
Gaudard et al. [36] perform a detailed analysis for a single run-of-river power plant, integrating a hydrologic model with a hydropower model under different climate and electricity price scenarios (assuming electricity prices as given). For the considered run-of-river plant, the study shows a 20% decrease of revenue under climate change, but notes that the effect is mainly driven by the lack of melting water from an upstream glacier for future climatic periods and thereby points to the site-specific nature of the result.
Our paper adds to the existing literature in three ways: First, we link the hydrologic impacts of climate change with electricity market modeling to assess feedback effects between the two systems; second, we provide specific results for Switzerland as a case study for a hydro-rich country; And third, our study design allows us to identify the isolated impact of changes in runoff patterns and quantities.
3. Modeling Framework
This section presents the modeling framework, the input data, and the scenarios used to analyze the impact of climate change on Swiss hydropower and the central European electricity system.
3.1. Model
For our analysis, we employ the electricity market model Swissmod [23]. Swissmod is a DC load-flow nodal pricing electricity dispatch model of Switzerland and its neighboring countries. Each model run simulates one year in an hourly time resolution. The model framework has been tailored to allow for an in-depth analysis of future scenarios for the Swiss electricity market. Given the employed DC load flow approach, Swissmod is able to link a detailed representation of the Swiss power grid with a more aggregated representation of surrounding regions. This is crucial for determining imports and exports, as well as for obtaining reasonable price patterns: As a small country that is highly interconnected with its neighboring countries, Switzerland is highly influenced by surrounding trends. Within Switzerland, the defining feature of its electricity system is its reliance on hydropower, which provides about 60 percent of the national electricity supply. To represent the flexibility and restrictions that hydropower is subject to, hydropower stations are modeled with a high degree of detail on a plant-by-plant basis in Swissmod (Figure 1). The model endogenously manages and optimizes storage lakes and captures the hydrologic interrelations within hydropower cascades. This means that the outflow of an upstream power plant ends up as inflow to a downstream power plant. In total, 400 hydro stations are modeled in detail, representing around 96% of Swiss hydro production. The mathematical model formulation is provided in Appendix A.
3.2. Input Data and Scenarios
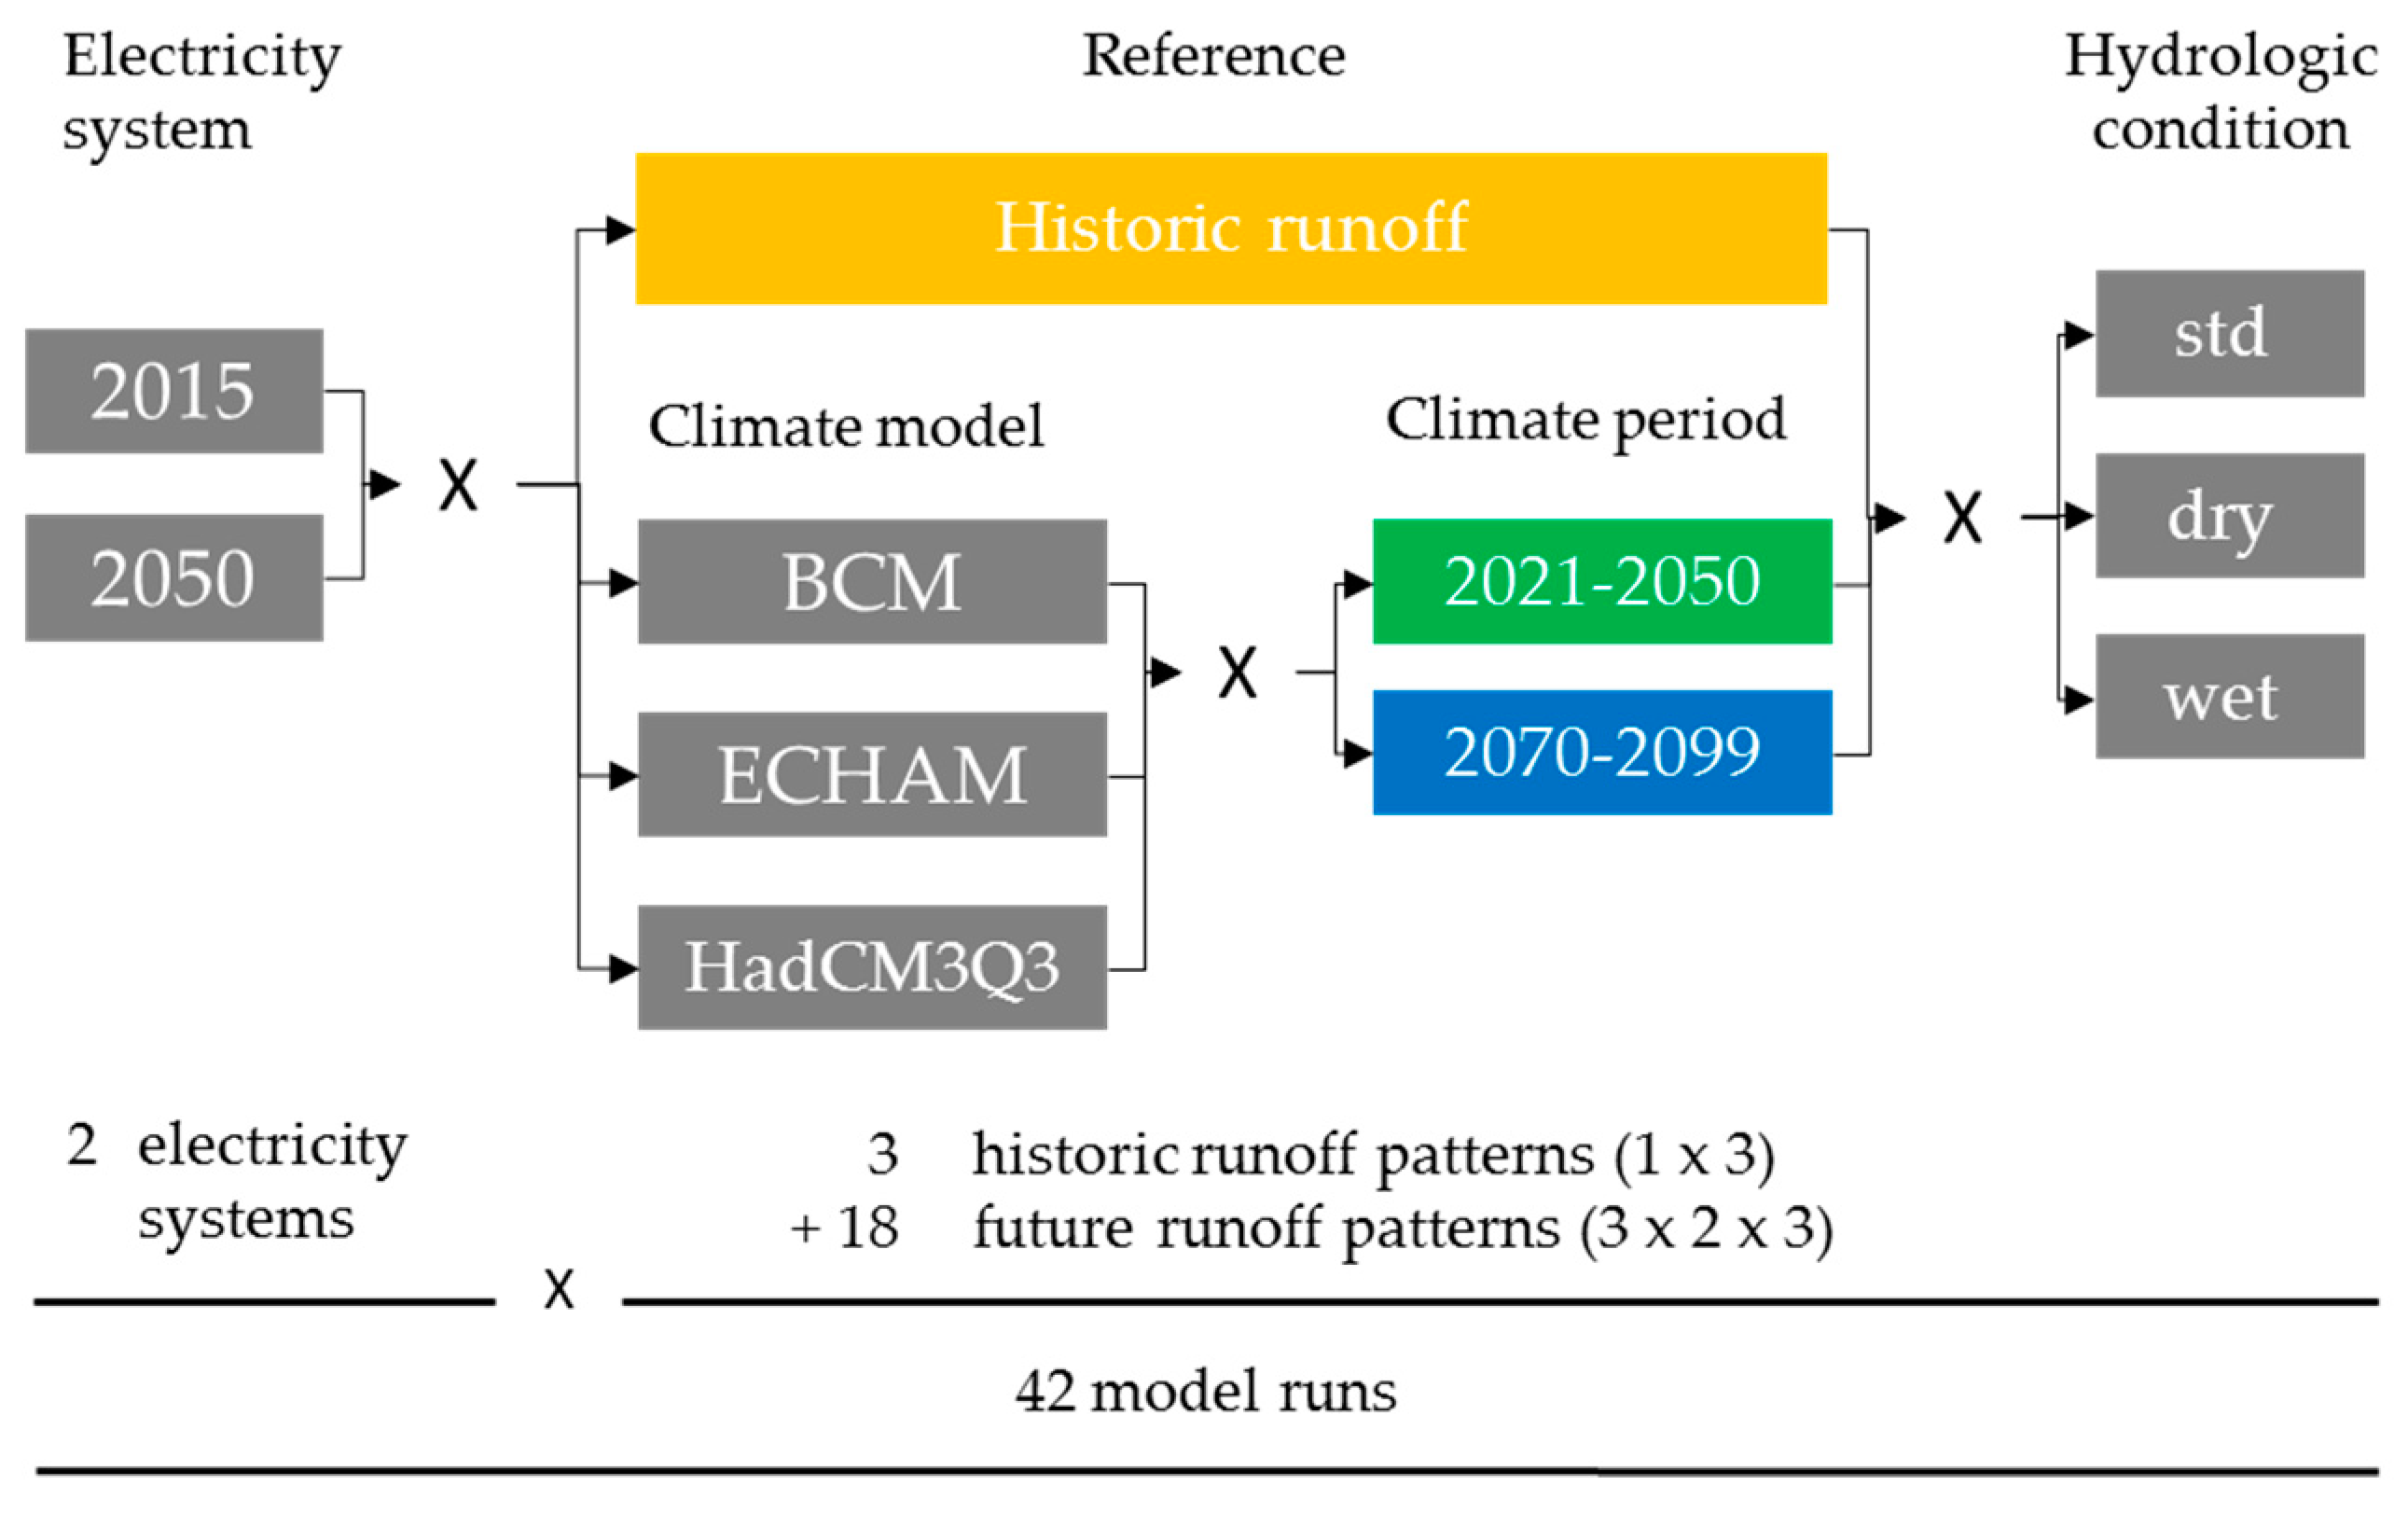
In order to disentangle the effects of the future development of the electricity system from those stemming from changes in hydro runoff patterns, we set up a scenario tree with 42 scenarios (Figure 2). As a first element of the tree, two different electricity systems are considered, one calibrated to a historic electricity system (2015) and one for a future electricity system (2050), according to reference scenarios described in Section 3.2.1. The remaining elements of the scenario tree concern the different hydropower runoff scenarios for Switzerland described in Section 3.2.2. The aim of the different runoff scenarios is to show the bandwidth of changes across climate models, climate periods, and hydrologic conditions.
3.2.1. Electricity System Scenarios
We define two different electricity system scenarios, one for 2015, which is very closely linked to the current (historical) electricity system, and one for 2050, which is constructed according to the reference scenarios of the European Commission [39] and the Swiss Federal Office of Energy [40].
To obtain a more accurate representation of the Swiss electricity system, we substantially update the input data from the original Schlecht and Weigt [23,41] Swissmod model. We update the transmission grid with data from swisstopo [42] and cross-check it with the ENTSO-E Transmission System Map [43]. Generic values for line capacity as well as resistance and reactance are based on Fischer and Kiessling [44]. Our grid representation includes aggregated line and node data for surrounding countries. Data on tie-lines between Switzerland and neighboring countries and between neighboring countries are recreated from the ENTSO-E grid map and set to transfer capacity values from ENTSO-E data [45]. For the aggregate depiction of surrounding countries, representative nodes on both voltage levels have been set up for the smallest regional units bordering Switzerland for which demand data was available (e.g., Bavaria and Baden-Wuerttemberg in Germany). Regions lying behind them have been combined to per country nodes for each voltage level. Limitless lines connect per country nodes and nodes in the surrounding regions.
3.2.2 Climate Scenarios
We use the high-resolution climate change runoff dataset for Switzerland underlying Speich et al. [46]. The dataset is a gridded dataset with a cell size of 200 m. Each cell contains runoff data for a reference period (1980–2009) from the spatially explicit version of the rainfall-runoff model PREVAH [47]. Projections for two future climate periods (2021–2050 and 2070–2099) are based on ten different climate model chains from the ENSEMBLES project [48] using the SRES A1B (moderate increase in greenhouse gas) emissions scenario. These projections cover a time period from 1951 to 2099 and have a spatial resolution of 25 km. The climate change signal in precipitation and temperature underlying the dataset is transmitted using the delta-change method by Bosshard et al. [49], which is able to model a high spatial resolution. The runoff data we obtain is of a monthly time-resolution while preserving the 200-m cell size and thereby captures seasonal and spatial variability.
To obtain inflow data on a per hydropower plant basis from the input runoff dataset, we use the HydroGIS database by Balmer et al. [50], which includes catchment areas of individual hydropower cascades. We scale the obtained inflow data for the long-term historical average inflow to match yearly expected production per cascade. Thus, inflows used in the model are already implicitly adjusted by regulatory and environmental requirements. We keep scaling factors constant for all scenarios in order to be able to interpret changes across inflow scenarios.
In order to analyze the differences stemming from the different GCM’s, we include the three global climate models BCM, ECHAM, and HadCM3Q0 that are available for the regional model RCA in our scenario tree. Differences between model runs are more pronounced between GCM’s than between RCM’s; therefore, we focus on a single RCM to keep the analysis tractable.
We select three historical hydrological years to take into account weather specific changes in inflows. The choice of the hydrological years is based on yearly inflow quantities.
As illustrated in Figure 3, the year 2008 was characterized by typical hydrological conditions: lower inflows in winter months and high runoff in spring due to snowmelt. Due to its typical hydrological conditions, 2008 represents our “average” year. 2003 was selected as our “dry” year. Compared to our average year, yearly runoff was 24% lower in 2003 due to high summer temperatures and a European heat wave. While the summer was dry in 2003, runoff in January, February, and October was slightly above average. This means that the dry year is driest on average but is not necessarily drier than our average year at all times (i.e., January and October). In 1999, yearly runoff was 33% higher than in 2008 (average year), resulting from wet conditions in the first half of the year. Runoff was significantly above average, especially in May and June. Due to its high runoff, we select 1999 as our “wet” year.
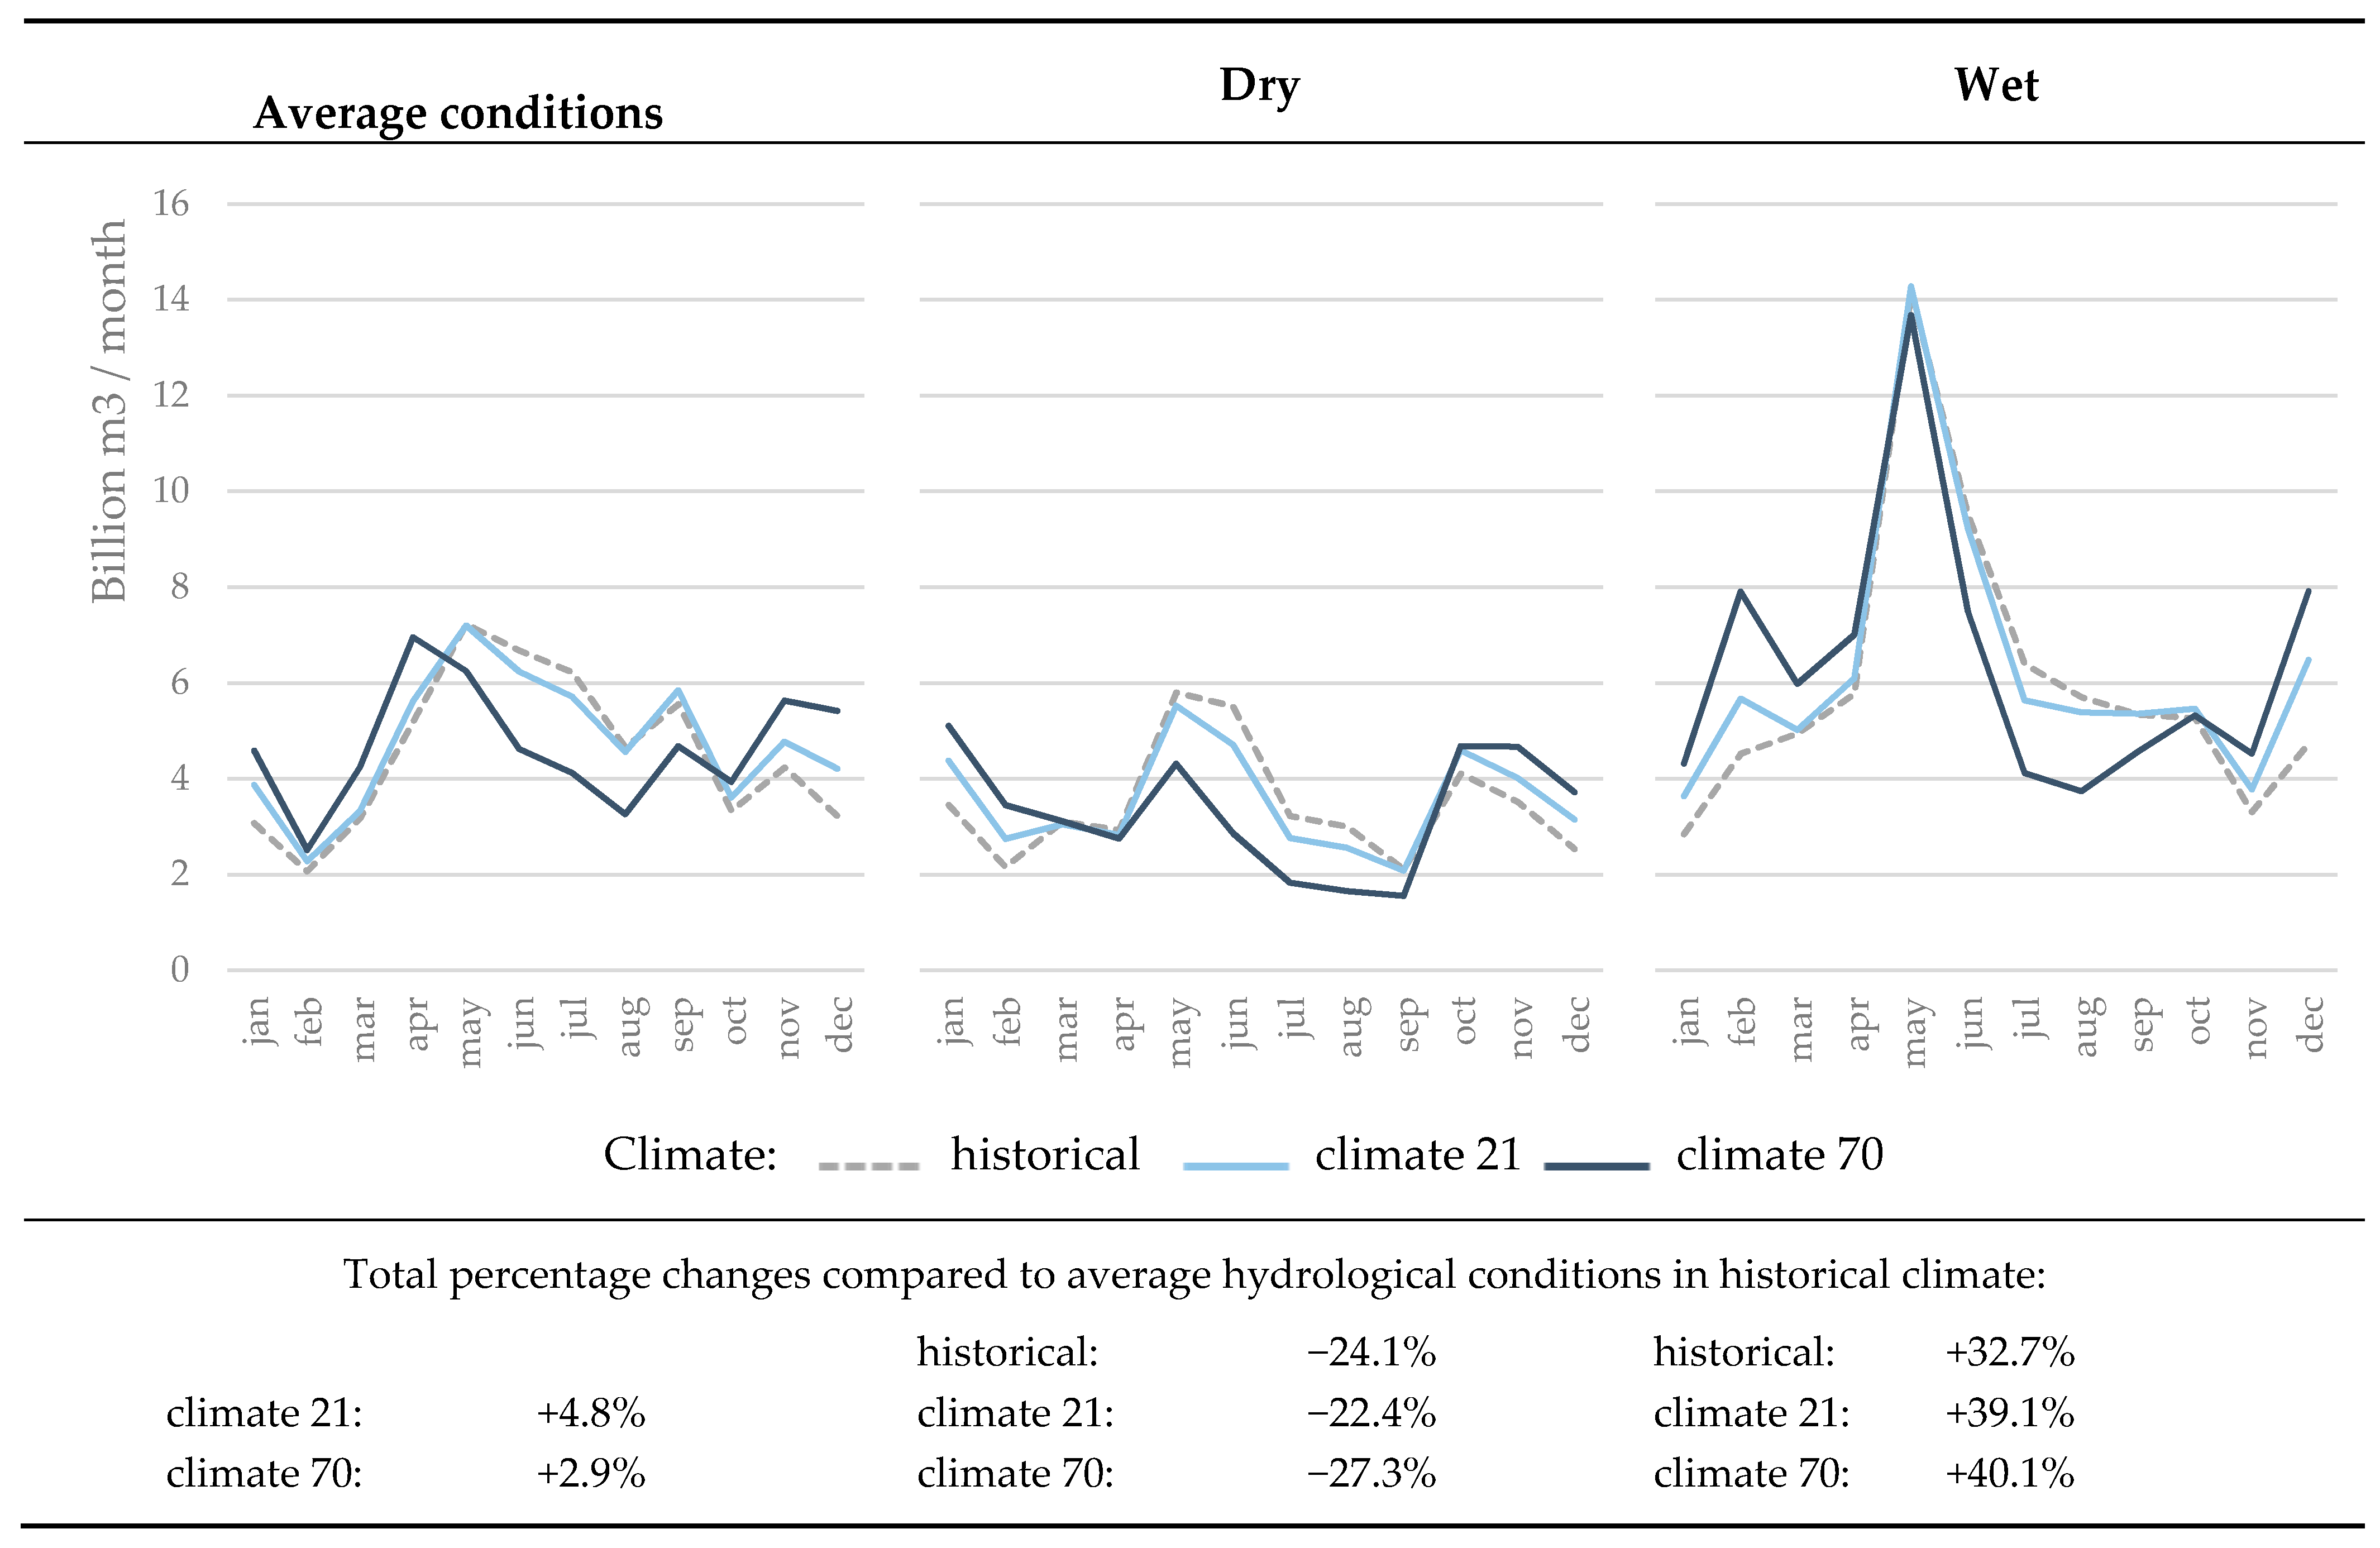
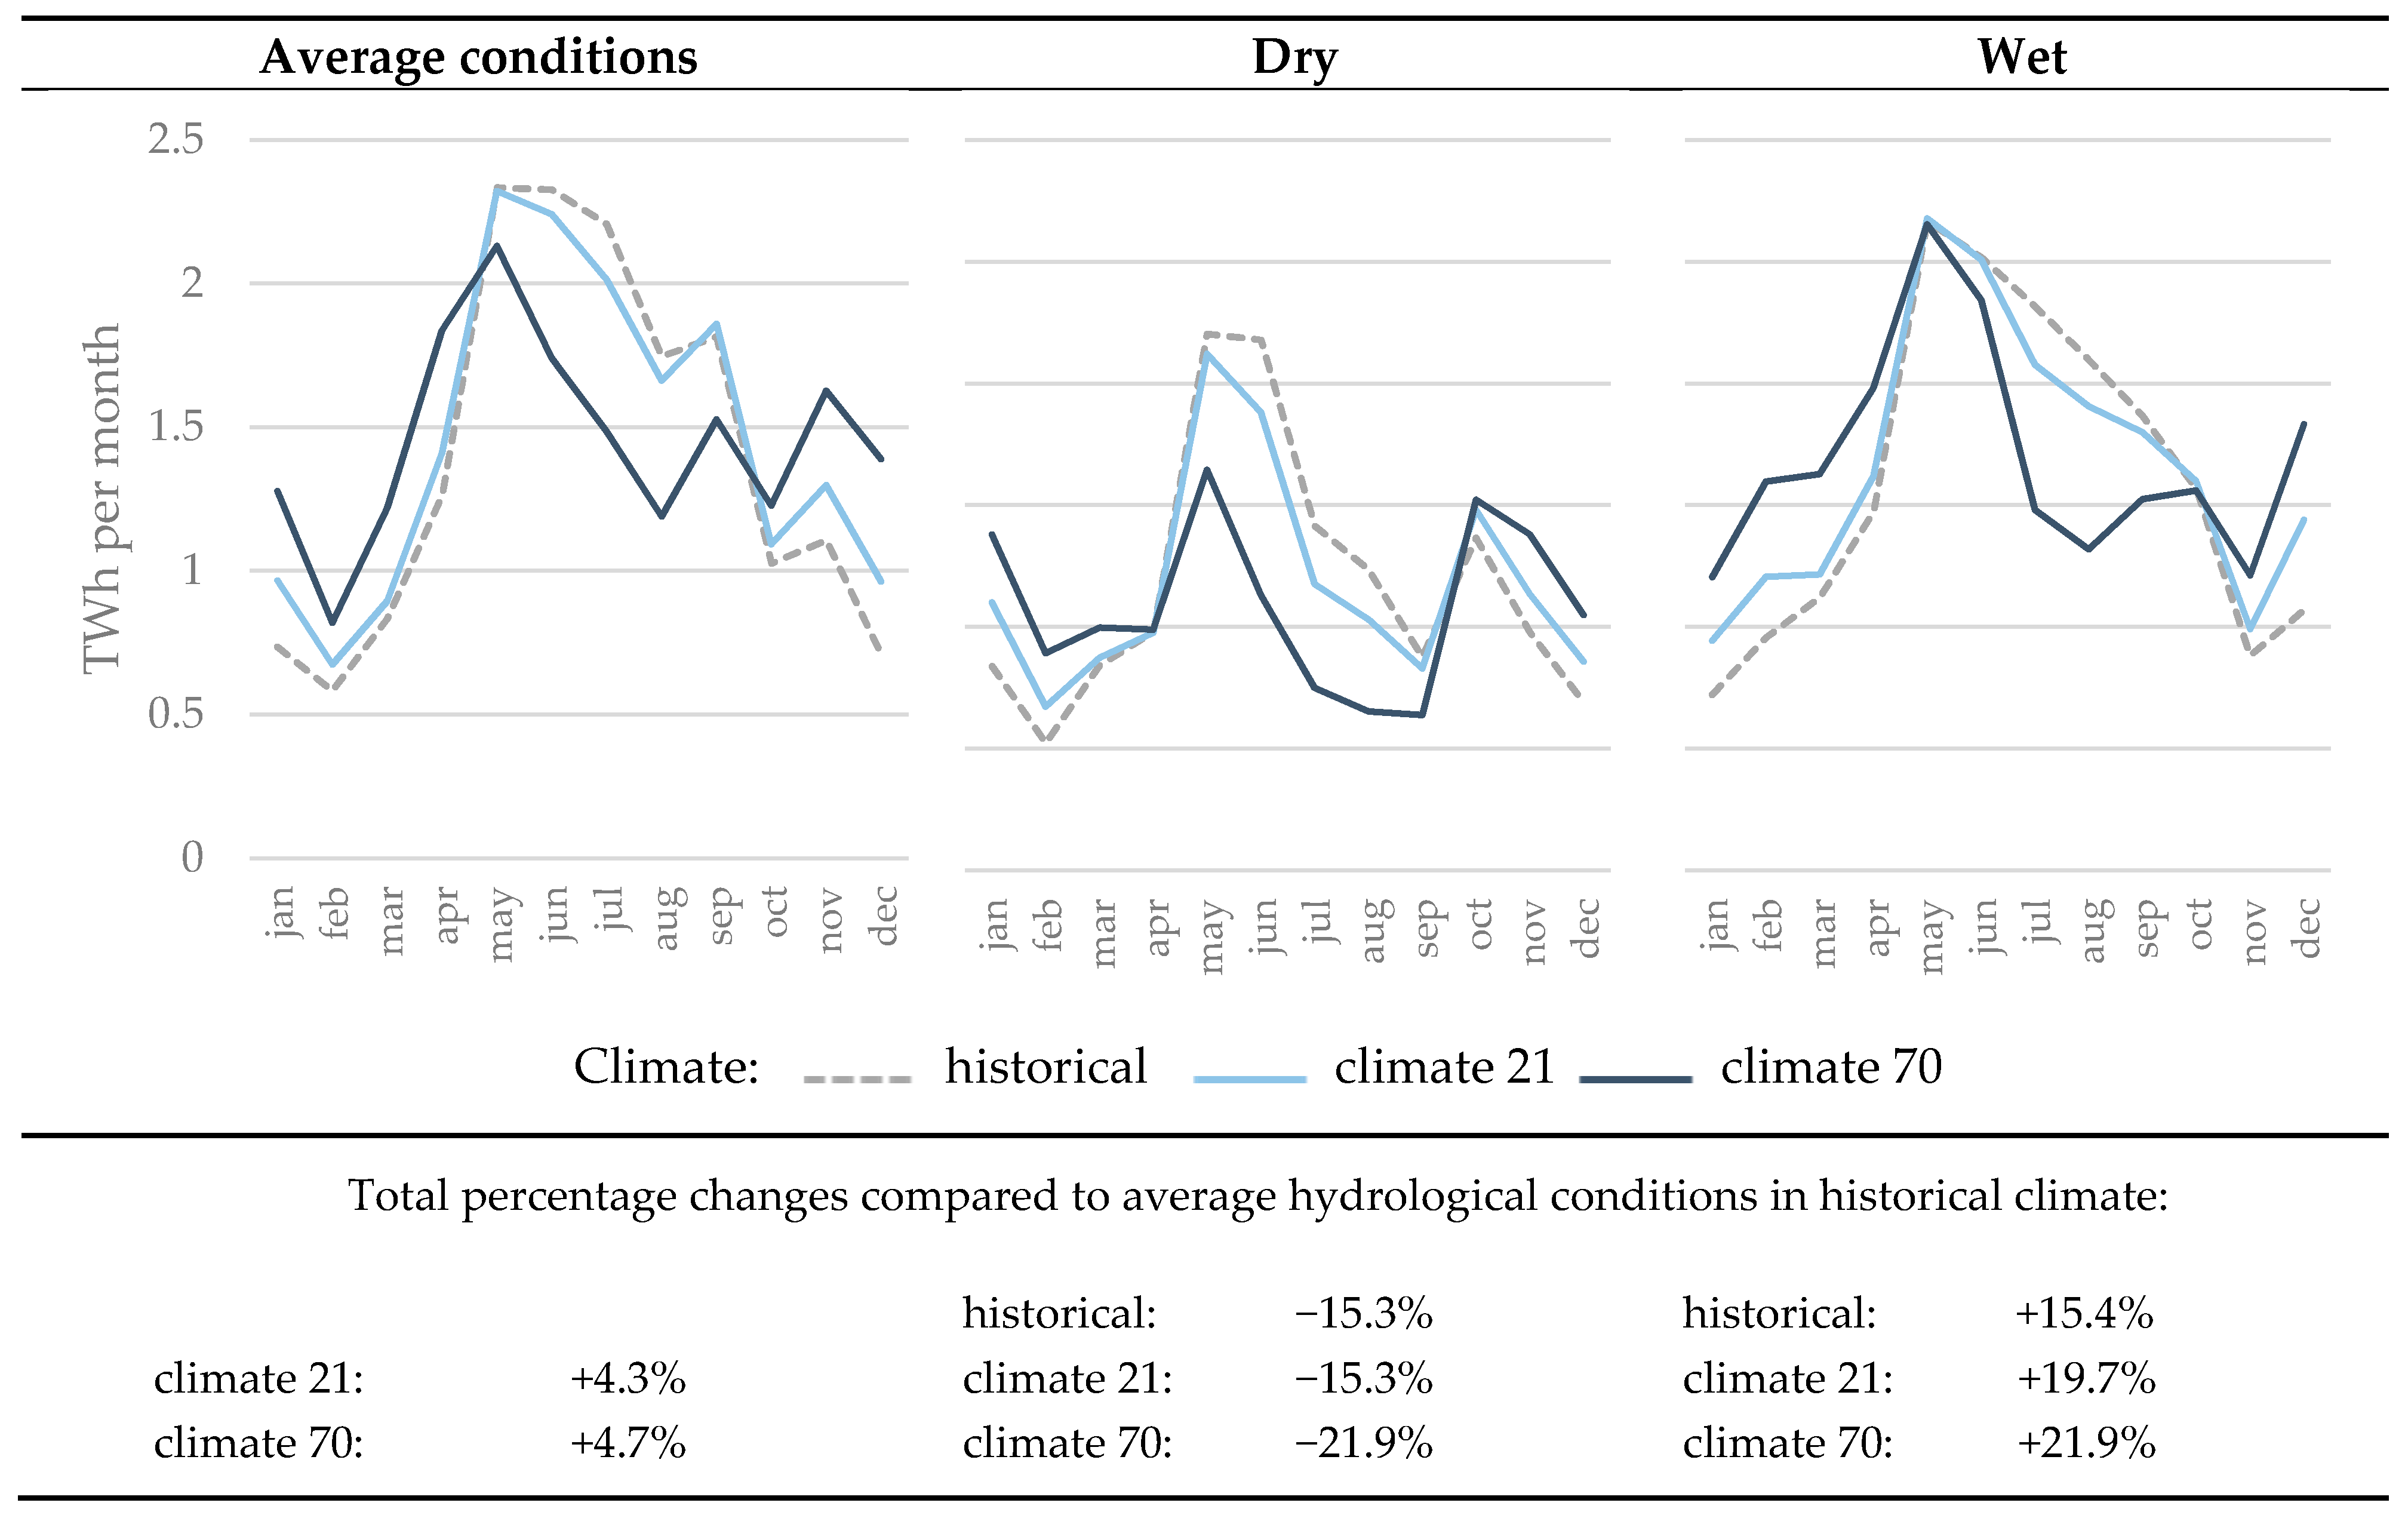
Figure 4 illustrates how the runoff in the three hydrological years is influenced by changes in climate in the climate periods 2021–2050 (called “climate 21” in the following) and 2070–2099 (called “climate 70” in the following) based on averages of all three GCM’s. Each of the average, wet, and dry years is matched with two corresponding climate years, representing expected changes in runoff due to climate change for climate 21 and climate 70. For comparison, the historical climate is shown as well. For all simulations, we consider the same initial storage values, i.e., we assume that each of these combinations of hydrological conditions and climate change effects occurs after an average year.
Under average hydrological conditions, climate 21 is characterized by a slightly wetter winter and a slightly drier summer. Overall, climate 21 is wetter than the historical climate. This is also the case for climate 70, but compared to climate 21, the increase in yearly inflows is lower. Seasonality of inflows shows an especially pronounced change in climate 70, with a stronger shift of inflows from summer to winter.
In the case of a dry year, changes in inflows due to climate change are similar to those under average hydrological conditions; summer is getting drier and winter slightly wetter. In addition, changes in inflow seasonality are more pronounced under climate 70. The yearly aggregated inflows are reduced less under climate 21 than under historical climate, but reduced more under climate 70. The previously observed seasonal pattern of wetter winters and drier summers, which is more pronounced under climate 70 than under climate 21, perpetuates under wet hydrological conditions. However, in the case of a wet year, the inflow peak in May/June is almost not affected by changes in climate.
The observed changes in inflows under different hydrological conditions and climate-change periods highlight that variations in hydrological conditions have a stronger impact on inflows than variations in long-term climate. In addition, the impact of climate change on the dry and wet conditions reveals that extremes become even more pronounced.
4. Results
The results section is structured in the following way: First, climate impacts on the 2015 electricity system are analyzed (Section 4.1 and Section 4.2). Afterwards, the impact of climate change on a potential 2050 electricity system is illustrated (Section 4.3). The results are based on separate model runs for each of the 42 scenarios, which were subsequently aggregated over the three GCM’s.
4.1. System Impacts
4.1.1. Changes to Total System Costs
As hydropower itself has zero variable costs in our model, changes in hydropower schedules have no direct impact on system costs. However, there is an indirect effect as thermal generation has to substitute for reductions in hydro generation and adds fuel and CO2 costs to total system costs. In this paper, system costs represent the short-term cost of electricity supply in all countries considered in the model (Switzerland, Germany, Austria, France, and Italy). Therefore, changes in Swiss hydropower production have an impact not just on Switzerland, but also on neighboring countries due to cross border trade. Figure 5 shows changes in total system costs depending on the hydrological conditions and climate period. For comparison, changes in inflows (in energy units) are shown as well.
In the case of average hydrological conditions, system costs are slightly reduced for climate 21 and 70 compared to the current climate. While under climate 21, the reduction in system costs is mostly driven by an increase in yearly inflow quantity, the cost reduction under climate 70 can be explained by changes in inflow seasonality beneficial to the system. For dry and wet hydrological conditions, system costs change according to changes in inflows. System costs increase under dry conditions as lower inflows reduce generation from hydropower and have to be substituted by thermal generation in Swiss neighboring countries in order to satisfy the electricity demand. Especially for climate 70, system costs are significantly higher under dry conditions. For wet conditions, system costs are reduced due to increased hydro generation and changes in seasonality beneficial to the system. Correspondingly, thermal (peak) generation is lower than under average conditions.
In line with the analysis of changes in inflows, changes in system costs indicate that the variation of hydrological conditions shows a higher impact on the electricity system than changes in long-term climate. However, comparing dry hydrological conditions to average conditions shows that, in this case, climate change roughly doubles the increase in system costs.
4.1.2. Changes to Prices
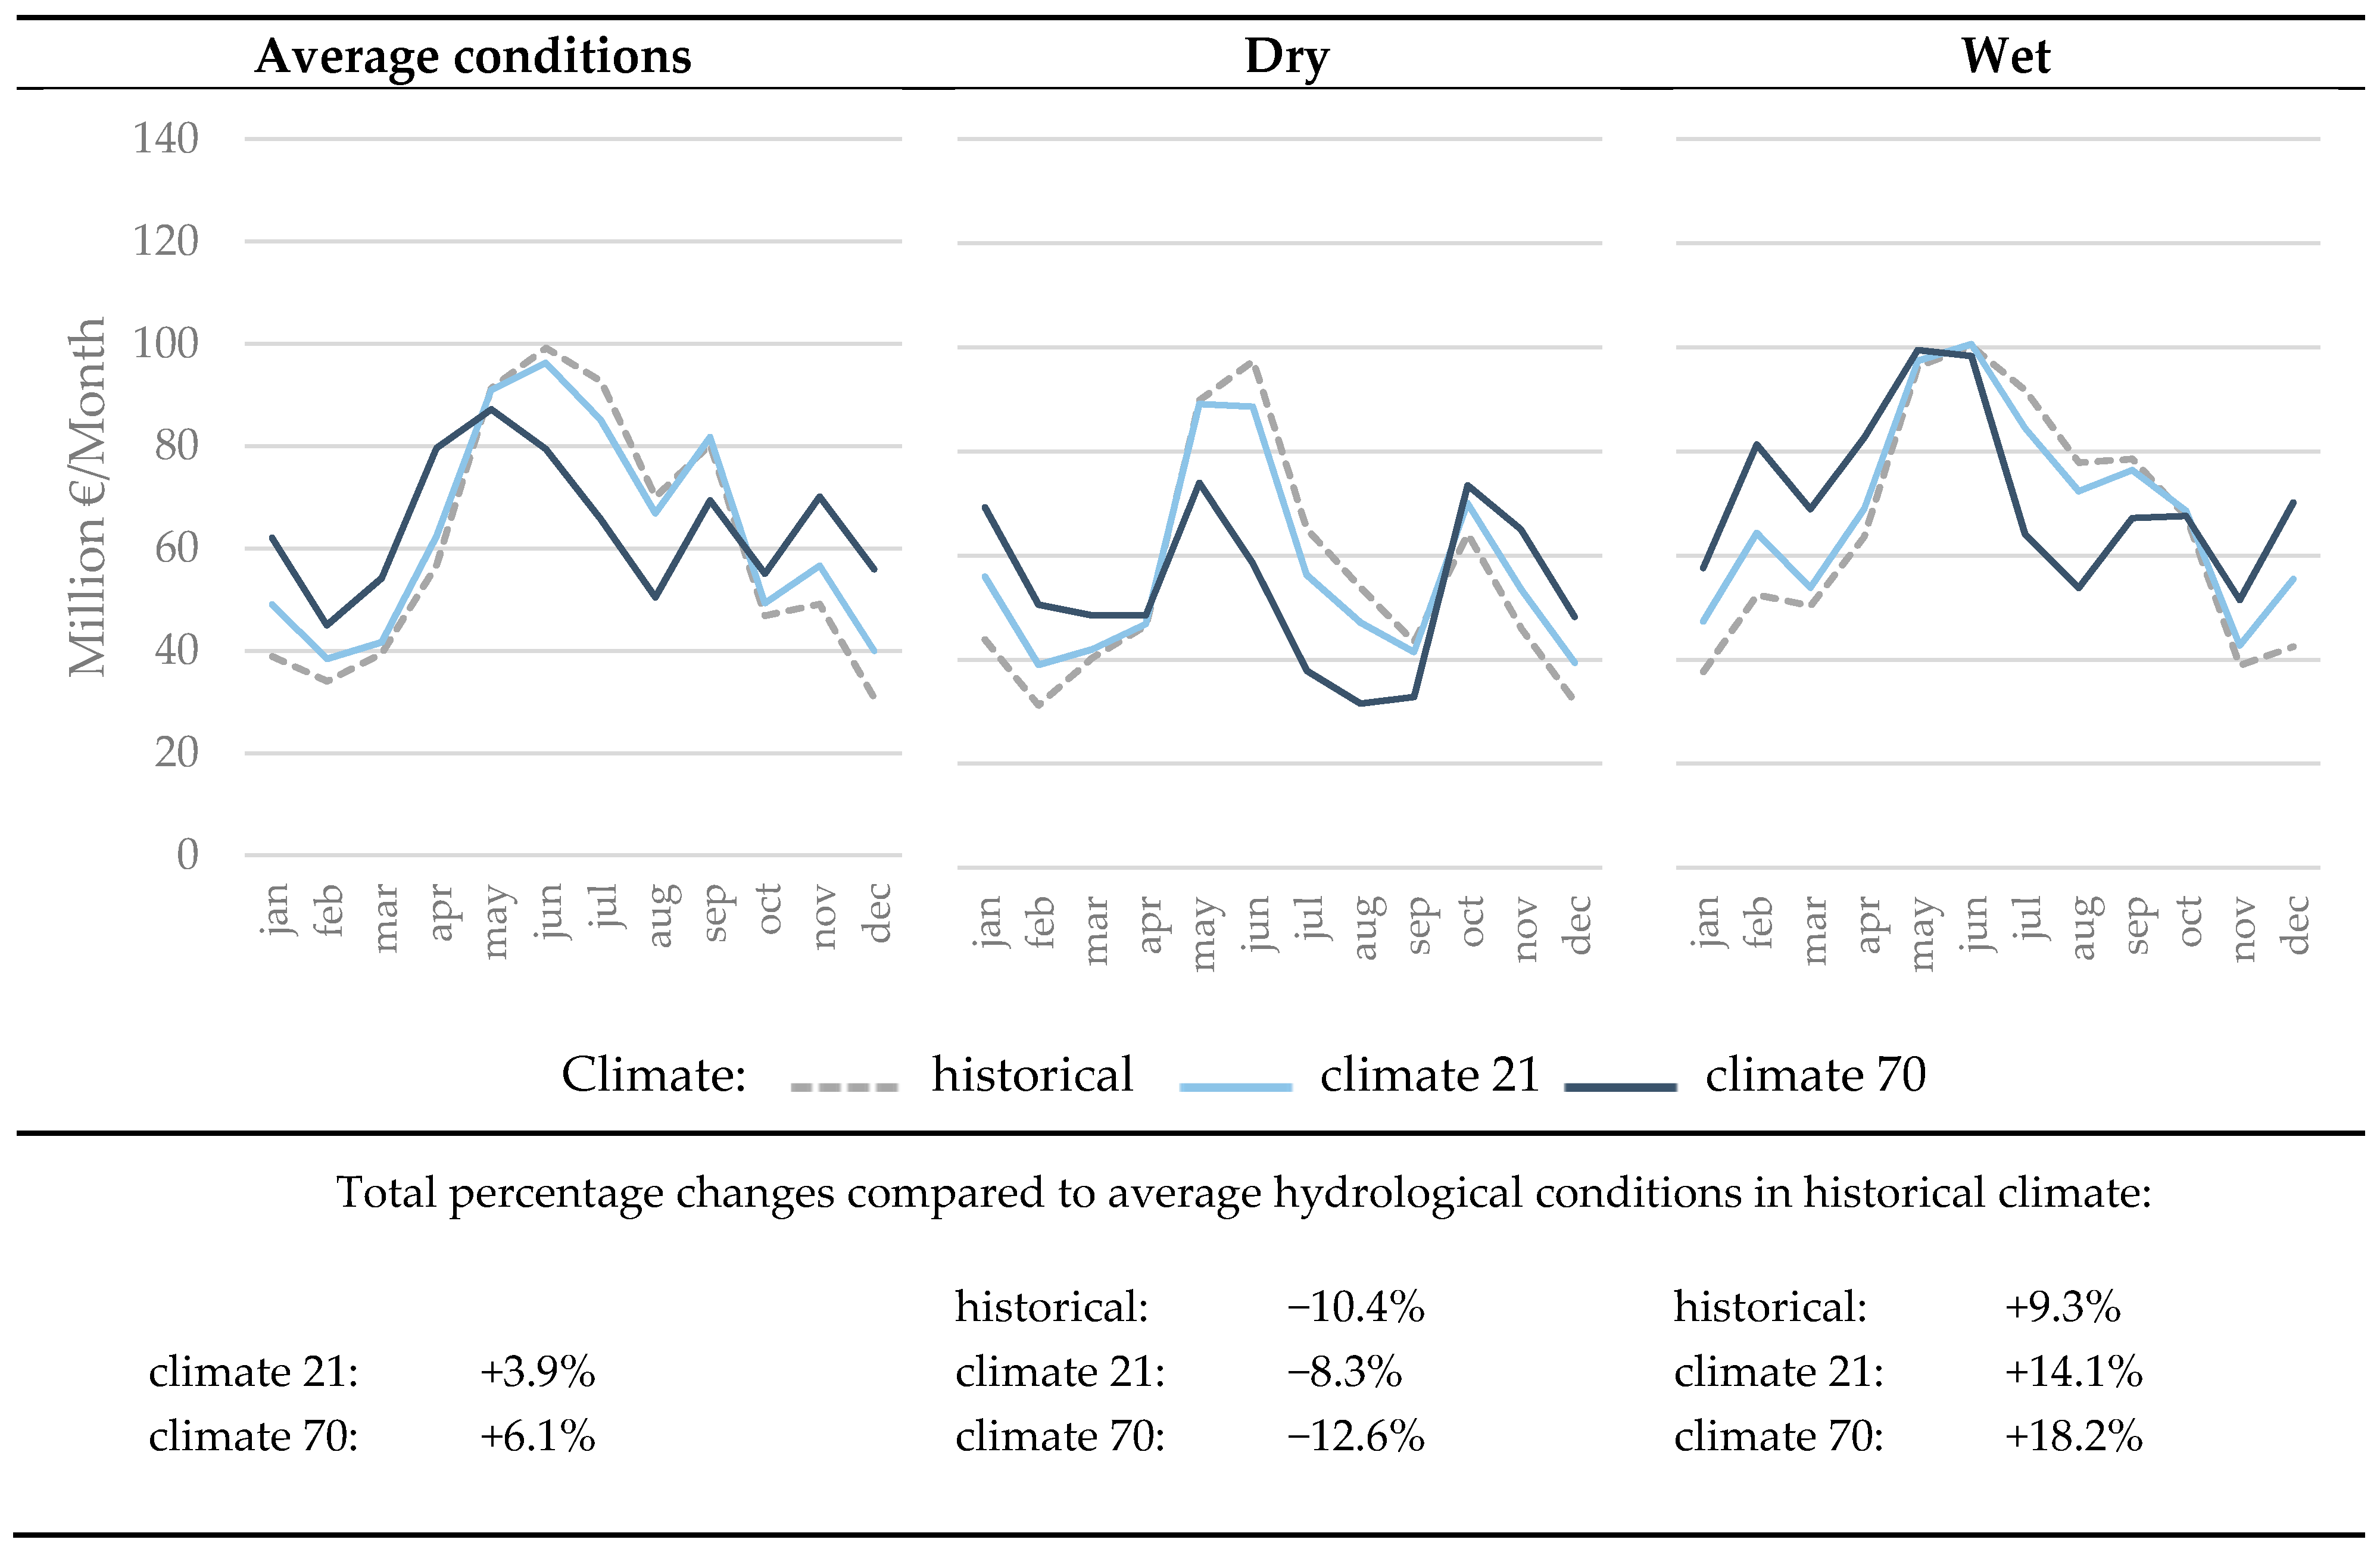
Going beyond the analysis of total system costs shows that electricity market prices are affected by changes in water availability as well. In this section, we focus on Swiss electricity market prices. Figure 6 illustrates the monthly average electricity market prices for Switzerland for the average, dry, and wet hydrological years.
Electricity prices in Figure 6 show a clear change in the yearly price profile due to climate change: prices are lower in winter but higher in summer compared to their historic levels. Since inflows are slightly higher in winter months under climate change in comparison to historical values, hydropower generation is higher during that time, leading to a decrease in market prices. In summer, inflows under climate change are lower. Therefore, hydropower generation is reduced and prices are higher. Whether the price increase in summer is stronger than the decrease in winter or vice versa depends on the hydrological year considered. Under average hydrological conditions, average yearly electricity market prices decrease due to changes in long-term climate, while the decrease is higher in the climate 21 period than in the climate 70 period. In a dry year, the price increase in summer outweighs the price decrease in winter. Average yearly electricity prices increase and climate change accentuates this effect. The change in electricity prices due to climate change is highest under dry hydrological conditions, with a maximum difference of average monthly prices relative to the historical climate (hist. DRY) of 11% (70DRY case). The price decrease in winter is higher than the increase in summer under wet conditions. Therefore, yearly prices are lower on average. In the climate 21 period, this effect is most pronounced. Overall, extreme hydrological conditions amplify the impact of climate change on electricity market prices.
4.1.3. Conclusion System Impacts
From a system perspective, climate change has a positive impact under average and wet conditions; that is, more hydro generation during winter which reduces total system costs and electricity prices. However, in dry years, climate change worsens the system situation. Driven by changes in inflows, changes in system costs or electricity prices indicate that the impact of a shift to wet hydrological conditions on the electricity system is more pronounced than the impact of variation in climate periods. However, under the assumption of dry hydrological conditions, the system impact exceeds the impact that could be expected when only looking at changes in water availability (respectively hydropower potential) and ignoring the system perspective.
4.2. Impacts on Hydropower
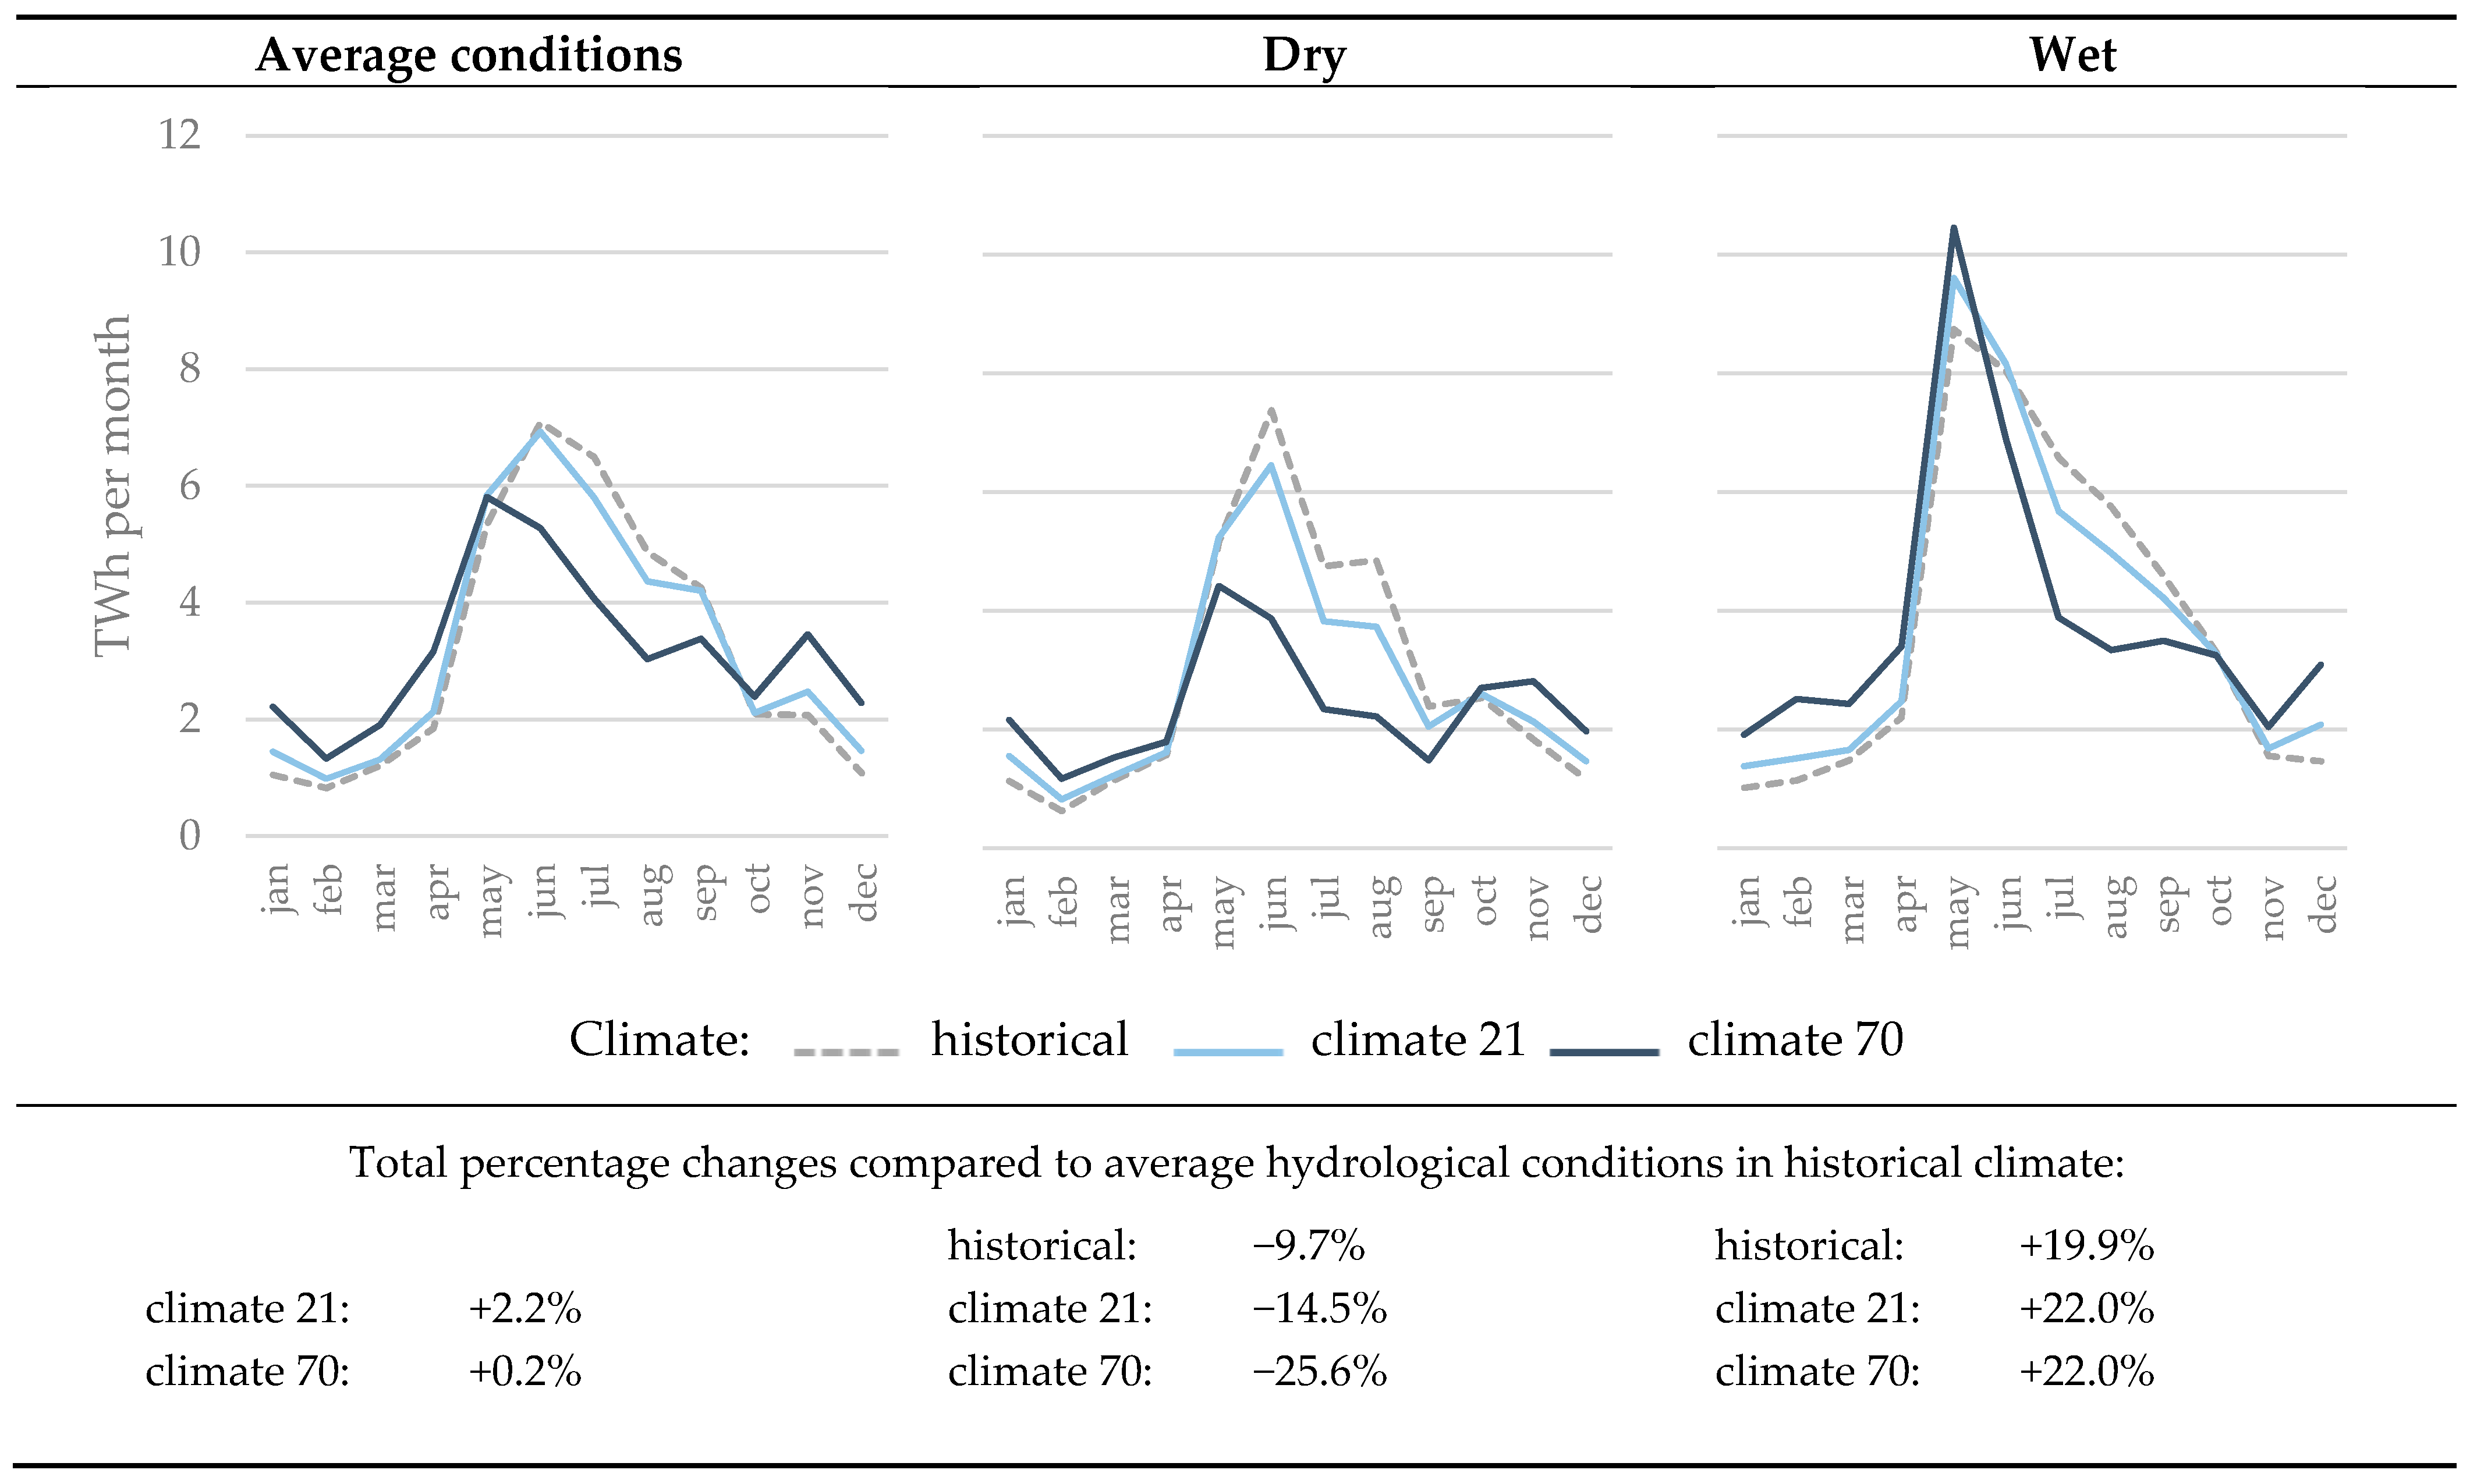
Changes in inflows influence the operation of hydropower plants. Figure 7 illustrates the changes in inflows we consider in the following analysis. Contrary to Figure 4, which shows inflows in water units, inflows here are given in energy units (TWh), based on the energy factor of connected hydropower stations combined with the spatially and temporally discrete inflows in water units (m3) shown before.
Inflows in energy units look slightly different to inflows in water units. This is the result of regional or site-specific differences in changes in inflows, as well as the different energy content of water depending on vertical head. In this paper, we focus on the aggregated impacts of climate change on hydropower, but distinguish between run-of-river (RoR) and storage (storage) hydropower plant technologies. More detailed spatially stratified results on the level of energy regions, cantons, or cascades will be part of future research. In this study, we consider changes in RoR and storage generation and the revenues induced by changes in water availability.
4.2.1. Run-of-River
The generation by RoR hydropower plants is determined by the quantity and seasonality of inflows as RoR hydropower plants do not have access to storage. Changes in RoR generation for the different scenarios are shown in Figure 8. RoR plants cannot flexibly react to changes in inflows; therefore, changes in RoR generation follow changes in inflows (i.e., more generation in winter, less generation in summer).
However, comparing inflows and generation, we observe an interesting effect. Under average hydrological conditions, inflows increase by 2.2% (climate 21) or 0.2% (climate 70) (see Figure 7), causing RoR generation to increase by 4.0% and 4.1%, respectively. In other words, the relative change in RoR generation is higher than the level we would expect based on the relative change in inflows. It is important to note that inflows shown in Figure 7 represent Swiss averages, while RoR generation is spatially disaggregated. Still, the difference between changes in inflows and changes in generation is likely to stem from an interplay of technical constraints and seasonal inflow variation. Historically, Swiss RoR power plants have around 4600 full load hours, with spilling mainly occurring during early summer months (May to July). This means that they have excess capacity to use additional inflows in winter and early spring, whereas reductions in inflows during summer do not necessarily translate into reduced generation, but rather into reduced spilling.
Under average conditions, this effect could explain the observed difference between changes in inflows and changes in generation; where additional inflow results in more additional generation. For dry conditions, this effect persists when taking into account the climate 70 period, where the reduction in inflows (−25.6%) is larger than the reduction in generation (−22.1%). However, for the historical and climate 21 period, the effect is reversed. In line with this, also under wet conditions, the increase in inflows is not translated into a similar increase in generation for all climate periods. Here, this can be explained by the fact that inflows in spring exceed the capacity of several RoR hydropower plants.
It is important to note, that in general, there is no situation in which all RoR plants in our model reach their peak capacity exactly at the same time. Accordingly, the effects shown here are also a result of aggregating across different plants.
The changes in RoR hydropower plant revenues are shown in Figure 9.
In general, changes in RoR revenues are driven by changes in generation due to increased or reduced inflows in combination with changes in electricity market prices. Especially in the climate 70 period under average hydrological conditions, revenues increase more than generation due to an increase in production during high price winter hours and during a higher price level in summer (resulting from lower summer generation). Under dry hydrological conditions, the same effect can be observed. Reductions in RoR generation in summer are partially mitigated by an increase in electricity prices. As the capacity of RoR plants is usually designed to optimally use average yearly inflows, which include very high inflows in spring under historical conditions, they are able to use the shift in seasonality due to earlier snowmelt to their advantage. Under wet conditions, the decrease in electricity prices outweighs the increase in RoR generation, which is why revenue increases are lower than generation increases.
4.2.2. Storage
Compared to RoR hydropower plants, storage hydropower plants are flexible due to their ability to store water in reservoirs and discharge water only in peak price hours in order to maximize profits.
Under average hydrological conditions, the seasonality of storage production is not affected significantly by climate-related changes in inflows (Figure 10). While generation is slightly increased in winter and spring and reduced in summer, the overall profile looks similar to the profile under current climate conditions. This result comes from the ability of storage hydropower plants to use their seasonal storage to shift production to higher priced winter periods. The total yearly generation is slightly increased under climate 21 compared to the current climate conditions, but not affected under climate 70. Under dry hydrological conditions, the change in yearly generation follows the changes in inflows. Thus, generation is reduced more with climate change over time. Within the year, seasonality of generation is affected more under dry than under average hydrological conditions. While generation in January and February is nearly not affected, summer generation as well as generation in October until December is significantly reduced. These changes in seasonality become more pronounced under climate 70 conditions. Under wet hydrological conditions, climate change has no relevant impact on yearly storage generation in comparison to historical values. Seasonal generation follows a similar pattern among all climate periods.
The changes in storage revenue due to changes in inflows are shown in Figure 11.
Under average hydrological conditions, yearly revenues slightly increase due to higher winter production and despite lower winter and higher summer prices (which in and of itself would decrease storage revenue). In the case of dry hydrological conditions, the yearly generation reduction mirrors the reduced inflows, but revenue is less affected than generation since the highest price hours can still be exploited. Under wet hydrological conditions, yearly revenues increase but by less than generation since the most expensive hours of the year can already be used with average (or even dry year) inflows. In other words, storage capacity is already fully utilized during peak price hours in winter and early spring. Thus, additional inflows in these hours cannot be fully exploited.
4.2.3. Conclusion Regarding Impacts on Hydropower
The analysis of hydropower generation and revenues shows that storage hydropower plant operators try to produce as much as possible in high winter price hours (peak hours) using their inherent flexibility. This strategy is similar to that under current climate conditions. In contrast, generation by RoR plants is directly linked to water availability and their revenues are thus driven by electricity market prices. Changes in inflow seasonality resulting from climate change seem to be favorable for Swiss hydropower since less water has to be spilled. Climate change effects considered in this paper seem to have a positive impact on Swiss hydropower under average or wet conditions, but a strong negative impact under dry conditions. However, due to the focus on three selected hydrological years, we cannot identify whether one of these effects dominates the other. Furthermore, storage power plants revenues are more strongly affected by an exacerbation of dry conditions due to climate change than revenue of RoR power plants. This effect might seem counter intuitive at first as storage power plants are much more flexible than RoR power plants, but the effect can be explained by the amount of unused capacity in winter peak price hours. This amount of unused capacity is almost zero for storage power plants under historical conditions. This means that they produce at full capacity in winter peak price hours. In contrast, RoR power plants have excess capacity in winter peak price hours, as they follow seasonal inflow patterns. Accordingly, RoR power plants can compensate for some of the overall losses in revenue due to decreased inflows by increased generation in winter peak price hours, using a more beneficial seasonality of inflows.
4.3. Impact of Electricity System Developments
The results from the same analyses on the hypothetical 2050 Swiss electricity system and its neighboring countries are similar to those in 2015 presented above (for figures on the 2050 electricity system results see Appendix B). In general, system costs are higher in 2050 compared to 2015 (due to the assumed increases in fuel and CO2 prices from the EU reference scenarios), but the impact of climate change on system costs shows the same pattern in 2050 as in 2015. The same holds true for electricity prices. While electricity prices in 2050 are higher in general, the seasonality of electricity prices in 2050 remains comparable to the seasonality in the 2015 electricity system—high prices in winter and low prices in summer. However, in the 2050 electricity system, high winter prices are prolonged and start with a price peak in October followed by a second price peak in February. Climate change influenced inflows affect electricity prices less in 2050 compared to 2015 and only the summer months in 2050 show slight price variations due to climate change. The maximum difference in the 2050 average monthly electricity prices is 10% in the 70DRY case (in comparison to 11% in the 70DRY case in 2015).
The impact of climate change on RoR generation in 2050 is the same as in the 2015 electricity system. Since the RoR capacity in Switzerland does not increase up to 2050 and RoR plants operate independently of the electricity price, the RoR generation does not change in 2050 due to changes in prices but is solely driven by the quantity and seasonality of inflows, which are the same in 2015 and 2050. However, since prices in 2050 are higher in general, RoR revenues are higher in 2050 as well, but the changes in revenues due to climate change show the same direction in 2050 as in 2015. Regarding storage hydropower plants, the general picture shows no big difference between 2015 and 2050 since storage hydropower plants still try to shift as much generation as possible into high price winter hours. However, since high winter price hours are prolonged, storage generation is also slightly adapted in order to make use of the higher prices in early winter. Due to slight changes in storage generation and electricity prices in 2050, the revenues are slightly different: the October peak in prices—and therefore in storage generation—translates into a peak in revenues. However, the changes in revenues induced by climate variation are in the same direction as in 2015.
Overall, our results for 2050 show that climate induced inflow changes have a similar impact on the 2015 and 2050 electricity systems. However, it is important to note that we look at the isolated impact of climate change on Swiss hydropower and do not take the effects of climate change on other elements of the electricity system such as solar, wind, and thermal generation or demand into account. Considering the impact of climate change on those other elements could yield additional or even different results. At the same time, the focus on hydropower allows us to clearly identify the isolated system impacts of changes in water availability.
5. Discussion and Limitations
The hydrological data used in our analysis shows that variations in inflows are more pronounced between hydrological years than between climate years. The same holds true when comparing system costs and prices between average and wet hydrological conditions for different climate periods. However, the increase in total system costs and prices under dry hydrological conditions, in comparison to average hydrological conditions, doubles when adding strong climate change (climate 70). Climate change exacerbates the already negative impact of dry hydrological conditions on the electricity system.
Furthermore, under climate change, the seasonality of inflows in average and wet conditions shifts in a way that is more beneficial to the electricity system. This is the case because inflows increase in times of high residual demand. For example, residual demand is high during winter months when generation by PV power plants is lower but electricity demand is higher. From a hydropower perspective, shifts in inflows from summer to winter are favorable because electricity prices are higher in winter and thus profits of hydropower can be increased by higher winter generation. At the same time, the changes in inflow seasonality allow Swiss hydropower to better utilize the available water since less water has to be spilled in summer.
Water availability alone is not a good indicator of the impact of climate change on hydropower. Our result show that while hydropower operation by RoR power plants is purely driven by inflows, storage power plants are able to adjust their generation schedules to changes in electricity prices in order to maximize their profits. At the same time, our results show that, paradoxically, inflexible RoR power plants in Switzerland profit more from seasonal shifts in inflow under climate change (under wet and average conditions, i.e., lose less under dry conditions) than flexible storage power plants. RoR power plants have around 4600 full load hours on average in our dataset. This means that RoR can increase their generation with additional inflows during peak price hours in winter and early spring and mitigate losses in summer. Additionally, independent from the scenario, the aggregated set of all RoR power plants is always limited by available capacity (inflows) and not by installed (nameplate) capacity — except in May under wet hydrological conditions. Storage power plants are already fully utilizing peak price hours. This means that additional inflows in winter and early spring to storage power plants can only be used in hours of lower prices. Thereby, additional revenue in winter is lower for storage power plants than additional revenue for RoR power plants. Storage power plants are less able to mitigate losses in summer and do not profit as much from climate change induced shifts in seasonality.
Where Gaudard et al. [36] find a decrease in generation and revenue for a single RoR power plant, we see more differentiated effects on RoR generation. This can be explained by the broader scale of our study covering all Swiss hydropower plants, thereby taking into account both power plants that are more and less affected by changes in runoff. Furthermore, we see more nuanced effects from endogenously modeling price rather than taking prices to be exogenously set as in Gaudard et al. [36]. In relation to the study by Totschnig et al. [31], our results are only partially comparable, as Totschnig et al. look at different countries, use different policy scenarios, and combine electricity and heat generation. The decrease in RoR generation of around 5.5% is similar to our findings for a dry year for Switzerland. Under average or wet conditions, we find increases in RoR generation. Changes in storage power plant generation are not documented in their paper. Beyond this, the approach used by the authors does not pinpoint the effect of climate change on hydropower and its market impacts, but rather reflects the interaction of market effects and climate impacts in various areas.
It has to be noted that our analysis and results are subject to some limitations. First, in this paper, we are interested in the impact of climate change on Swiss hydropower. Therefore, we neglect the impact of climate change on other elements of the electricity sector such as demand or thermal generation. We also do not consider climate change impacts on the electricity system in countries outside of Switzerland. Thus, changes in system costs, electricity prices, and hydropower operation are purely driven by climate change induced variations in Swiss water availability. On the one hand, this allows us to clearly pinpoint the effect of climate change on Swiss hydropower and its market implications. On the other hand, we are not able to show the overall impact of climate change on the electricity system as some seasonalities underlying our inputs such as high demand in winter and low demand in summer might shift under climate change (see e.g., [7,8,31,51,52,53]).
We consider the impacts of climate change on Swiss RoR and storage hydropower plants only on an aggregate level. While we find mixed effects of climate change on hydropower (positive under average or wet hydrological conditions, negative under dry conditions), this might not be the case for all hydropower plants and regions. Some specific sites may be mostly adversely affected by climate change [36]. Differences between regions or hydropower cascades are beyond the scope of this paper and will be addressed in future research.
Due to the focus on three hydrological years (average, wet, and dry), we cannot make a robust statement about the overall impact of climate change on hydropower that is to be expected in the future. To this end, a much wider coverage of weather variations in combination with likelihoods for these weather variations (including the likely higher frequency and duration of extreme events such as heat waves or dry spells) would be needed. Furthermore, the results shown here are driven by our choice of the respective years and could look different if other years had been selected.
Due to the selection of 2015 as our base year and the upscaling of seasonal variation in demand, specific particularities of this base year influence all results. Most importantly, the high price peak in February 2015 due to a cold spell can be seen in all price simulations. Without this peak, the increase in electricity prices in summer driven by a dry year under strong climate change (climate 70) would completely dominate the simultaneous decrease in winter, leading to a shift in the seasonality of electricity prices. This could amplify the effect of climate change on hydropower described above.
The selection of a single climate scenario that represents rather moderate changes limits the coverage of our results. A new dataset is currently being developed in the “Climate Change and its Consequences on Hydrology in Switzerland” (Hydro-CH2018) project. Finally, our analysis might show more pronounced climate change impacts under an RCP 8.5 scenario.
6. Conclusions
In our paper, we study the effects of climate change on Swiss hydropower. While previous literature has primarily analyzed quantitative changes in water availability, we combine hydrological data with an electricity market model to identify interactions between climate induced variations of water availability and market outcomes. Thereby, we are able to evaluate changes in inflow quantity and seasonality resulting from climate change from an electricity system perspective.
In general, we find ambiguous net impacts of climate change on the electricity system. While climate change leads to a shift in seasonality that is beneficial to the electricity system under average or wet hydrological conditions, it aggravates the negative effect of dry conditions. In general, the effect of hydrological conditions (i.e., wet or dry years) has a stronger impact on the profitability of hydropower than the long-term climate change effects. Furthermore, climate-induced changes in inflows have the same impact on the electricity system in 2050 as in 2015 in qualitative terms. While absolute magnitudes (e.g., in system costs) change, the direction and pattern of change is the same in 2050 as in 2015; at least for a ceteris paribus assessment of hydro-related climate impacts for Switzerland.
Our findings in this paper provide important insights into the impact of climate change on Swiss hydropower and show the importance of linking hydrological and techno-economic modeling. However, a clear need for future research is given. From our perspective, it should focus on regional variations of climate change impacts while keeping the overall system perspective taken in this paper. Thus, the linkage of global, regional, and site-specific impacts of climate change on the water-energy nexus provides many opportunities for future research.
Author Contributions
All authors developed the idea for this paper together. J.S., M.S., and I.S. prepared the data, coded the model, analyzed the results, and wrote the paper. The original model framework has been developed by H.W. and I.S. and has been updated and improved by J.S. as part of the SNSF funded AFEM project. H.W. contributed substantially to the analysis of results and by overall guidance of the project.
Funding
This research project is financially supported by the Swiss Innovation Agency Innosuisse and is part of the Swiss Competence Center for Energy Research SCCER CREST and the SCCER Joint Activity Scenarios and Modeling.
Acknowledgments
We thank Massimiliano Zappa (WSL) for his invaluable support and for generously making the extensive runoff dataset from the CCHydro project available to us. Furthermore, the detailed hydrological structure for Switzerland could only be set up thanks to extensive prior research by Markus Balmer. We thank Rebecca Lordan-Perret for helpful comments and extensive grammar review. Additionally, we thank three anonymous reviewers for their comments and suggestions.
Conflicts of Interest
The authors declare no conflict of interest.
Appendix A. Swissmod Model

Table A1.
Notation used for the Swissmod model.
| Indices/Sets | Endogenous Variables | ||
|---|---|---|---|
| Power nodes | E | Electricity | |
| Power lines | W | Water in 1000 m^3 | |
| Time periods | X | Phase angle difference | |
| Conventional power plants | WS | Storage content | |
| Hydropower plants | Storage addition | ||
| Water nodes (upper, lower) | WI | Water inflow | |
| WO | Water outflow | ||
| Special Scripts | Water flowing to next node | ||
| Hydro pumping | C | Total cost | |
| Hydro generation | |||
| Upper limit | |||
| Matrices | Parameters | ||
| Power grid incidence ∈ {0,1,−1} | e | Electricity | |
| Conventional plant incidence {0,1} | b | Power line susceptance | |
| d | Demand | ||
| Hydro plant incidence ∈ {0,1} | vc | Variable cost | |
| Plant upper water node ∈ {0,1} | α | Production equivalent | |
| Plant lower water node ∈ {0,1} | Pumping efficiency factor | ||
| Water node successor matrix {0,1} | Local inflow to water node | ||
| . | Water delay time ∈ N | Renewables in-feed | |
Table A2.
Mathematical formulation of the Swissmod model.
| Objective Function | ||
| Power flow | ∀ l, t | |
| Fixing the slack bus | ||
| Power node balance | ∀ n, t | |
| Maximum line flow | ∀ l, t | |
| Plant capacity limit | ∀ cpp, t | |
| Discharge function | ∀ hpp, t | |
| Pumping function | ∀ hpp, t | |
| Discharge capacity | ∀ hpp, t | |
| Pumping capacity | ∀ hpp, t | |
| Water node inflow | ∀ wn, t | |
| Water node outflow | ∀ wn, t | |
| Storage changes | ∀ wn, t | |
| Storage capacity | ∀ wn, t | |
| Water node balance | ∀ wn, t |
Appendix B. Results for 2050 Electricity System
Figure A1.
Change in total system costs for the 2050 electricity system.

Figure A2.
Monthly price structure for the 2050 electricity system.

Figure A3.
Run-of-river generation for the 2050 electricity system.

Figure A4.
Run-of-river revenues for the 2050 electricity system.

Figure A5.
Storage hydro generation for the 2050 electricity system.

Figure A6.
Storage hydro revenue for the 2050 electricity system.

References
- International Energy Agency. IEA Key World Energy Statistics 2017; International Energy Agency: Paris, France, 2009. [Google Scholar] [CrossRef]
- Dai, J.; Wu, S.; Han, G.; Weinberg, J.; Xie, X.; Wu, X.; Song, X.; Jia, B.; Xue, W.; Yang, Q. Water-energy nexus: A review of methods and tools for macro-assessment. Appl. Energy 2018, 210, 393–408. [Google Scholar] [CrossRef]
- Papakostas, K.; Mavromatis, T.; Kyriakis, N. Impact of the ambient temperature rise on the energy consumption for heating and cooling in residential buildings of Greece. Renew. Energy 2010, 35, 1376–1379. [Google Scholar] [CrossRef]
- Van Vliet, M.T.H.; Vögele, S.; Rübbelke, D. Water constraints on European power supply under climate change: Impacts on electricity prices. Environ. Res. Lett. 2013, 8. [Google Scholar] [CrossRef]
- Lehner, B.; Czisch, G.; Vassolo, S. The impact of global change on the hydropower potential of Europe: A model-based analysis. Energy Policy 2005, 33, 839–855. [Google Scholar] [CrossRef]
- Schaeffer, R.; Szklo, A.S.; Pereira de Lucena, A.F.; Moreira Cesar Borba, B.S.; Pupo Nogueira, L.P.; Fleming, F.P.; Troccoli, A.; Harrison, M.; Boulahya, M.S. Energy sector vulnerability to climate change: A review. Energy 2012, 38, 1–12. [Google Scholar] [CrossRef]
- Bonjean Stanton, M.C.; Dessai, S.; Paavola, J. A systematic review of the impacts of climate variability and change on electricity systems in Europe. Energy 2016, 109, 1148–1159. [Google Scholar] [CrossRef]
- Chandramowli, S.N.; Felder, F.A. Impact of climate change on electricity systems and markets—A review of models and forecasts. Sustain. Energy Technol. Assess. 2014, 5, 62–74. [Google Scholar] [CrossRef]
- Turner, S.W.D.; Ng, J.Y.; Galelli, S. Examining global electricity supply vulnerability to climate change using a high-fidelity hydropower dam model. Sci. Total Environ. 2017, 590–591, 663–675. [Google Scholar] [CrossRef] [PubMed]
- Van Vliet, M.T.H.; Wiberg, D.; Leduc, S.; Riahi, K. Power-generation system vulnerability and adaptation to changes in climate and water resources. Nat. Clim. Chang. 2016, 6, 375–380. [Google Scholar] [CrossRef]
- Tobin, I.; Greuell, W.; Jerez, S.; Ludwig, F.; Vautard, R.; Van Vliet, M.T.H.; Breón, F.M. Vulnerabilities and resilience of European power generation to 1.5 °C, 2 °C and 3 °C warming. Environ. Res. Lett. 2018, 13. [Google Scholar] [CrossRef]
- Hamududu, B.; Killingtveit, A. Assessing climate change impacts on global hydropower. Energies 2012, 5, 305–322. [Google Scholar] [CrossRef] [Green Version]
- Tarroja, B.; AghaKouchak, A.; Samuelsen, S. Quantifying climate change impacts on hydropower generation and implications on electric grid greenhouse gas emissions and operation. Energy 2016, 111, 295–305. [Google Scholar] [CrossRef] [Green Version]
- Solaun, K.; Cerdá, E. The impact of climate change on the generation of hydroelectric power-a case study in southern Spain. Energies 2017, 10, 1343. [Google Scholar] [CrossRef]
- Sample, J.E.; Duncan, N.; Ferguson, M.; Cooksley, S. Scotland’s hydropower: Current capacity, future potential and the possible impacts of climate change. Renew. Sustain. Energy Rev. 2015, 52, 111–122. [Google Scholar] [CrossRef]
- Kao, S.C.; Sale, M.J.; Ashfaq, M.; Uria Martinez, R.; Kaiser, D.P.; Wei, Y.; Diffenbaugh, N.S. Projecting changes in annual hydropower generation using regional runoff data: An assessment of the United States federal hydropower plants. Energy 2015, 80, 239–250. [Google Scholar] [CrossRef] [Green Version]
- Chilkoti, V.; Bolisetti, T.; Balachandar, R. Climate change impact assessment on hydropower generation using multi-model climate ensemble. Renew. Energy 2017, 109, 510–517. [Google Scholar] [CrossRef]
- Wagner, T.; Themeßl, M.; Schüppel, A.; Gobiet, A.; Stigler, H.; Birk, S. Impacts of climate change on stream flow and hydro power generation in the Alpine region. Environ. Earth Sci. 2017, 76. [Google Scholar] [CrossRef]
- Majone, B.; Villa, F.; Deidda, R.; Bellin, A. Impact of climate change and water use policies on hydropower potential in the south-eastern Alpine region. Sci. Total Environ. 2016, 543, 965–980. [Google Scholar] [CrossRef] [PubMed]
- Nakicenovic, N.; Swart, R. IPCC Special Report on Emissions Scenarios; A Special Report of Working Group III of the Intergovernmental Panel on Climate Change; Intergovernmental Panel on Climate Change: Geneva, Switzerland, 2000; p. 608. [Google Scholar]
- Van Vuuren, D.P.; Edmonds, J.; Kainuma, M.; Riahi, K.; Thomson, A.; Hibbard, K.; Hurtt, G.C.; Kram, T.; Krey, V.; Lamarque, J.F.; et al. The representative concentration pathways: An overview. Clim. Chang. 2011, 109, 5–31. [Google Scholar] [CrossRef]
- Ciscar, J.C.; Dowling, P. Integrated assessment of climate impacts and adaptation in the energy sector. Energy Econ. 2014, 46, 531–538. [Google Scholar] [CrossRef]
- Schlecht, I.; Weigt, H. Swissmod—A Model of the Swiss Electricity Market. 2014. Available online: https://ssrn.com/abstract=2446807 (accessed on 16 July 2018).
- Turner, S.W.D.; Hejazi, M.; Kim, S.H.; Clarke, L.; Edmonds, J. Climate impacts on hydropower and consequences for global electricity supply investment needs. Energy 2017, 141, 2081–2090. [Google Scholar] [CrossRef]
- Jacob, D.; Petersen, J.; Eggert, B.; Alias, A.; Christensen, O.B.; Bouwer, L.M.; Braun, A.; Colette, A.; Déqué, M.; Georgievski, G.; et al. EURO-CORDEX: New high-resolution climate change projections for European impact research. Reg. Environ. Chang. 2014, 14, 563–578. [Google Scholar] [CrossRef]
- Boehlert, B.; Strzepek, K.M.; Gebretsadik, Y.; Swanson, R.; McCluskey, A.; Neumann, J.E.; McFarland, J.; Martinich, J. Climate change impacts and greenhouse gas mitigation effects on U.S. hydropower generation. Appl. Energy 2016, 183, 1511–1519. [Google Scholar] [CrossRef] [Green Version]
- Voisin, N.; Kintner-Meyer, M.; Skaggs, R.; Nguyen, T.; Wu, D.; Dirks, J.; Xie, Y.; Hejazi, M. Vulnerability of the US western electric grid to hydro-climatological conditions: How bad can it get? Energy 2016, 115, 1–12. [Google Scholar] [CrossRef]
- Teotónio, C.; Fortes, P.; Roebeling, P.; Rodriguez, M.; Robaina-Alves, M. Assessing the impacts of climate change on hydropower generation and the power sector in Portugal: A partial equilibrium approach. Renew. Sustain. Energy Rev. 2017, 74, 788–799. [Google Scholar] [CrossRef]
- Pereira-Cardenal, S.J.; Madsen, H.; Arnbjerg-Nielsen, K.; Riegels, N.; Jensen, R.; Mo, B.; Wangensteen, I.; Bauer-Gottwein, P. Assessing climate change impacts on the Iberian power system using a coupled water-power model. Clim. Chang. 2014, 126, 351–364. [Google Scholar] [CrossRef]
- Seljom, P.; Rosenberg, E.; Fidje, A.; Haugen, J.E.; Meir, M.; Rekstad, J.; Jarlset, T. Modeling the effects of climate change on the energy system—A case study of Norway. Energy Policy 2011, 39, 7310–7321. [Google Scholar] [CrossRef]
- Totschnig, G.; Hirner, R.; Müller, A.; Kranzl, L.; Hummel, M.; Nachtnebel, H.P.; Stanzel, P.; Schicker, I.; Formayer, H. Climate change impact and resilience in the electricity sector: The example of Austria and Germany. Energy Policy 2017, 103, 238–248. [Google Scholar] [CrossRef]
- Hänggi, P.; Angehrn, S.; Bosshard, T.; Helland, E.; Job, D.; Rietmann, D.; Schädler, B.; Schneider, R. Produktion der Wasserkraftwerke Löntsch und Prättigau. Wasser Energie Luft 2011, 103, 292–299. [Google Scholar]
- Hänggi, P.; Weingartner, R. Variations in Discharge Volumes for Hydropower Generation in Switzerland. Water Resour. Manag. 2012, 26, 1231–1252. [Google Scholar] [CrossRef]
- Finger, D.; Heinrich, G.; Gobiet, A.; Bauder, A. Projections of future water resources and their uncertainty in a glacierized catchment in the Swiss Alps and the subsequent effects on hydropower production during the 21st century. Water Resour. Res. 2012, 48, W02521. [Google Scholar] [CrossRef]
- Weingartner, R.; Schädler, B.; Hänggi, P. Auswirkungen der klimaänderung auf die Schweizerische Wasserkraftnutzung. Geogr. Helv. 2013, 68, 239–248. [Google Scholar] [CrossRef]
- Gaudard, L.; Avanzi, F.; De Michele, C. Seasonal aspects of the energy-water nexus: The case of a run-of-the-river hydropower plant. Appl. Energy 2018, 210, 604–612. [Google Scholar] [CrossRef]
- Gaudard, L.; Romerio, F.; Dalla Valle, F.; Gorret, R.; Maran, S.; Ravazzani, G.; Stoffel, M.; Volonterio, M. Climate change impacts on hydropower in the Swiss and Italian Alps. Sci. Total Environ. 2014, 493, 1211–1221. [Google Scholar] [CrossRef] [PubMed]
- Maran, S.; Volonterio, M.; Gaudard, L. Climate change impacts on hydropower in an alpine catchment. Environ. Sci. Policy 2014, 43, 15–25. [Google Scholar] [CrossRef]
- De Vita, A.; Tasios, N.; Evangelopoulou, S.; Forsell, N.; Fragiadakis, K.; Fragkos, P.; Frank, S.; Gomez-Sanabria, A.; Gusti, M.; Capros, P.; et al. EU Reference Scenario 2016: Energy, Transport and GHG Emissions: Trends to 2050; Publications Office: Luxembourg, 2016; ISBN 9279523740. [Google Scholar]
- Swiss Federal Office of Energy. Die Energieperspektiven für die Schweiz bis 2050; Prognos: Basel, Switzerland, 2012; pp. 1–904. [Google Scholar]
- Schlecht, I.; Weigt, H. Linking Europe: The Role of the Swiss Electricity Transmission Grid until 2050. Swiss J. Econ. Stat. 2015, 151, 125–165. [Google Scholar] [CrossRef] [Green Version]
- Swisstopo. swissTLM3D. Available online: https://shop.swisstopo.admin.ch/de/products/landscape/tlm3D (accessed on 16 July 2018).
- ENTSO-E. ENTSO-E Transmission System Map. Available online: https://www.entsoe.eu/map/Pages/default.aspx (accessed on 16 July 2018).
- Kießling, F.; Nefzger, P.; Kaintzyk, U. Freileitungen; Springer: Berlin/Heidelberg, Germany, 2001; ISBN 978-3-642-62673-9. [Google Scholar]
- ENTSO-E. YS & AR Report 2012; ENTSO-E: Brussels, Belgium, 2012. [Google Scholar]
- Speich, M.J.R.; Bernhard, L.; Teuling, A.J.; Zappa, M. Application of bivariate mapping for hydrological classification and analysis of temporal change and scale effects in Switzerland. J. Hydrol. 2015, 523, 804–821. [Google Scholar] [CrossRef]
- Schattan, P.; Zappa, M.; Lischke, H.; Bernhard, L.; Thurig, E.; Diekkruger, B. An approach for transient consideration of forest change in hydrological impact studies. IAHS-AISH Proc. Rep. 2013, 359, 311–319. [Google Scholar]
- Van Der Linden, P.; Mitchell, J.F.B. (Eds.) ENSEMBLES: Climate Change and its Impacts: Summary of Research and Results from the ENSEMBLES Project; Met Office Hadley Centre: Exeter, UK, 2009. [Google Scholar]
- Bosshard, T.; Kotlarski, S.; Ewen, T.; Schär, C. Spectral representation of the annual cycle in the climate change signal. Hydrol. Earth Syst. Sci. 2011, 15, 2777–2788. [Google Scholar] [CrossRef] [Green Version]
- Balmer, M. Schweizer Wasserkraftwerke im Wettbewerb: Eine Analyse im Rahmen des Europäischen Elektrizitätsversorgungssystems; Wirtschaft, Energie, Umwelt; Vdf, Hochschulverlag AG an der ETH Zürich: Zürich, Switzerland, 2006; ISBN 978-3-7281-3048-8. [Google Scholar]
- Golombek, R.; Kittelsen, S.A.C.; Haddeland, I. Climate change: Impacts on electricity markets in Western Europe. Clim. Chang. 2012, 113, 357–370. [Google Scholar] [CrossRef] [PubMed]
- Jaglom, W.S.; McFarland, J.R.; Colley, M.F.; Mack, C.B.; Venkatesh, B.; Miller, R.L.; Haydel, J.; Schultz, P.A.; Perkins, B.; Casola, J.H.; et al. Assessment of projected temperature impacts from climate change on the U.S. electric power sector using the Integrated Planning Model®. Energy Policy 2014, 73, 524–539. [Google Scholar] [CrossRef]
- Mideksa, T.K.; Kallbekken, S. The impact of climate change on the electricity market: A review. Energy Policy 2010, 38, 3579–3585. [Google Scholar] [CrossRef]
Figure 1.
Hydropower plants and reservoirs in the Swissmod model.

Figure 2.
Scenario outline.

Figure 3.
Historical runoff for average, dry, and wet hydrological years.

Figure 4.
Inflows in water units by climate and hydrological conditions

Figure 5.
Absolute difference of total system cost and inflows relative to historical climate and average conditions (historical AVG).
Figure 5.
Absolute difference of total system cost and inflows relative to historical climate and average conditions (historical AVG).

Figure 6.
Monthly average Swiss wholesale electricity prices by climate period and hydrological condition.
Figure 6.
Monthly average Swiss wholesale electricity prices by climate period and hydrological condition.

Figure 7.
Inflows in energy units (TWh) by climate period and hydrological year.

Figure 8.
Run-of-river generation by climate period and hydrological year.

Figure 9.
Run-of-river revenues by climate period and hydrological year.

Figure 10.
Storage hydro generation by climate period and hydrological year.

Figure 11.
Storage hydro revenue by climate period and hydrological year.

© 2018 by the authors. Licensee MDPI, Basel, Switzerland. This article is an open access article distributed under the terms and conditions of the Creative Commons Attribution (CC BY) license (http://creativecommons.org/licenses/by/4.0/).
Share and Cite
MDPI and ACS Style
Savelsberg, J.; Schillinger, M.; Schlecht, I.; Weigt, H. The Impact of Climate Change on Swiss Hydropower. Sustainability 2018, 10, 2541. https://doi.org/10.3390/su10072541
AMA Style
Savelsberg J, Schillinger M, Schlecht I, Weigt H. The Impact of Climate Change on Swiss Hydropower. Sustainability. 2018; 10(7):2541. https://doi.org/10.3390/su10072541
Chicago/Turabian StyleSavelsberg, Jonas, Moritz Schillinger, Ingmar Schlecht, and Hannes Weigt. 2018. "The Impact of Climate Change on Swiss Hydropower" Sustainability 10, no. 7: 2541. https://doi.org/10.3390/su10072541
Note that from the first issue of 2016, this journal uses article numbers instead of page numbers. See further details here.